Kinesin motor proteins, vital for intracellular microtubule-based transport, display region-specific motility within cells, a phenomenon that remains molecularly enigmatic. This study focuses on the localized activation of OSM-3, an intraflagellar transport kinesin crucial for the assembly of ciliary distal segments in Caenorhabditis elegans sensory neurons. Fluorescence lifetime imaging microscopy unveiled an extended, active conformation of OSM-3 in the ciliary base and middle segments, where OSM-3 is conveyed as cargo by kinesin-II. We demonstrate that NEKL-3, a never in mitosis kinase-like protein, directly phosphorylates the motor domain of OSM-3, inhibiting its in vitro activity. NEKL-3 and NEKL-4, localized at the ciliary base, function redundantly to restrict OSM-3 activation. Elevated levels of protein phosphatase 2A at the ciliary transition zone or middle segments triggered premature OSM-3 motility, while its deficiency resulted in reduced OSM-3 activity and shorter cilia. These findings elucidate a phosphorylation-mediated mechanism governing the regional motility of kinesins.
Introduction
Kinesin motor proteins, members of the ATPase family, play a pivotal role in intracellular transport along microtubules (MTs) by harnessing chemical energy to produce mechanical forces (Burute and Kapitein, 2019; Cason and Holzbaur, 2022; Christensen and Reck-Peterson, 2022; Hirokawa et al., 2009; Ou and Scholey, 2022). Similar to many ATPases, kinesins are subject to precise control of their catalytic activity and force generation in a living cell (Burute and Kapitein, 2019; Ou and Scholey, 2022; Sweeney and Holzbaur, 2018). This regulatory mechanism ensures their capacity to transport cargoes within specific cellular locales at designated times. The complex coordination of kinesin’s regional motility involves numerous factors, crucial for directing cargo to precise intracellular locations. Such controlled transport is indispensable for a range of cellular processes, including intracellular trafficking, cell division, and organelle positioning. The dysregulation of kinesin activity, including both impaired motility and the breakdown of inhibitory mechanisms that typically confine kinesin activation to specific regions, has been implicated in various neurodegenerative disorders. These conditions encompass Alzheimer’s disease, Parkinson’s disease, hereditary spastic paraplegia, and amyotrophic lateral sclerosis (Akçimen et al., 2023; Blackstone et al., 2011; Feldman et al., 2022; Sleigh et al., 2019), underscoring the critical significance of precise spatiotemporal regulation of kinesins in neuronal health and disease.
A combination of mechanisms involving protein–protein interactions, posttranslational modifications, and the guidance provided by MT tracks has long been recognized as regulators of the localized activation of kinesin (Blasius et al., 2007; Dietrich et al., 2008; Grant et al., 2011; Park et al., 2021; Ramaiya et al., 2017; Sirajuddin et al., 2014). Cargo binding represents a pivotal regulation underlying motor activation. Following kinesin production, its tail is believed to undergo a folding process, enabling interaction with the motor head and subsequent inhibition of ATPase activity. In the presence of cargo molecules, the loading of cargo through the tail induces a conformational change of the motor, culminating in the release of autoinhibition and motor activation (Cai et al., 2007; Cason and Holzbaur, 2022; Coy et al., 1999; Espenel et al., 2013; Friedman and Vale, 1999; Guillaud et al., 2008; Hammond et al., 2009; Verhey and Hammond, 2009). Additionally, kinesin proteins undergo various posttranslational modifications that exert influence over their motility. For instance, phosphorylation of kinesin can modify its affinity for MTs, cargo adaptors, or regulatory proteins (Cahu et al., 2008; Liang et al., 2014; Sato-Yoshitake et al., 1992). Interestingly, the majority of characterized phosphorylation sites locate outside the motor domain, with limited available information regarding the phosphorylation of the motor head and its consequent effects (Bickel et al., 2017; Mennella et al., 2009). Furthermore, kinesins are reliant on the dynamic behavior of MTs for their locomotion, and factors that stabilize or destabilize MTs can impact the velocity and direction of kinesin transport. Equally significant are the posttranslational modifications of MTs themselves. Tubulin acetylation, polyglutamylation, or detyrosination can alter the binding affinity of kinesins to MTs and consequently affect their motility (Ikegami et al., 2007; Kaul et al., 2014; Reed et al., 2006).
Cilia represent a distinctive system for understanding the region-specific activation and inactivation of MT-based motor proteins (Anvarian et al., 2019; Klena and Pigino, 2022; Nachury and Mick, 2019; Ou and Scholey, 2022; Reiter and Leroux, 2017). The formation of cilia requires bidirectional intraflagellar transport (IFT) along MTs within the axoneme (KozMINSKI et al., 1993). At the ciliary base, the kinesin-2 family proteins undergo conformational changes, rendering them active for the transportation of IFT particles loaded with ciliary precursors to the axonemal tip. Upon unloading cargo, kinesin-2 must be inactivated, while the dynein-2 motor, directed toward the minus end of MTs, is activated to recycle the anterograde IFT machinery (Anvarian et al., 2019; Klena and Pigino, 2022; Nachury and Mick, 2019; Ou and Scholey, 2022). In Caenorhabditis elegans, two members of the kinesin-2 family, heterotrimeric kinesin-II and homodimeric osmotic avoidance abnormal (OSM)-3 (OSM of the Nematode), collaborate to power IFT and construct sensory cilia in chemosensory neurons (Ou et al., 2005; Ou and Scholey, 2022; Prevo et al., 2015; Snow et al., 2004). Previous studies have shown that OSM-3 coordinates with kinesin-II in the middle segment and serves as the sole IFT motor in the distal segment to transport cargo molecules for distal axoneme assembly (Ou et al., 2005; Snow et al., 2004). However, recent findings provide a more nuanced view, indicating that kinesin-II hands over IFT particles to OSM-3, which progressively assumes kinesin-II’s role during anterograde IFT travel in the middle segment (Prevo et al., 2015). This suggests the existence of a regulatory mechanism that modulates OSM-3’s motility, ensuring it remains suppressed at the ciliary base and becomes progressively activated in distinct ciliary regions.
The molecular mechanisms governing the activation and inactivation of kinesin-II and dynein-2 at the ciliary base and tip remain largely unclear. Even more enigmatic is the regulation of the regional motility of OSM-3: How is OSM-3 suppressed in the ciliary base while gradually becoming active in the middle segment and fully activated in the distal segment? In this study, we demonstrated that OSM-3 might have already adopted its extended, active conformation in the ciliary base and middle ciliary segments, where OSM-3 gradually replaces kinesin-II for IFT transport. Through a series of in vitro and in vivo experiments, we found that the NEKL-3 kinase and protein phosphatase 2A (PP2A) phosphatase-mediated phosphorylation regulation of the OSM-3 motor domain represents a hitherto undiscovered mechanism to control OSM-3’s activity, consequently governing its regional motility. The conservation of the NEK kinase, PP2A phosphatase, and phosphorylation site across species implies a likely general mechanism for regulating the regional motility of kinesins.
Results
Fluorescence lifetime imaging microscopy of OSM-3 in C. elegans sensory cilia
We developed a fluorescence lifetime imaging microscopy (FLIM) assay to differentiate between the extended, active conformation and the compact, inactive state of OSM-3 in live C. elegans (Fig. 1 A). This technique utilizes intramolecular Förster resonance energy transfer (FRET) efficiency, with the motor protein tagged with mScarlet and GFPs at its N- and C-termini, respectively (Xie et al., 2024). In this configuration, autoinhibited motors in a compact conformation induce FRET, reducing the GFP fluorescence lifetime due to quenching by the mScarlet protein. In contrast, active motors in an extended conformation do not exhibit this effect (Fig. 1 B). Our FLIM-FRET constructs successfully rescued the short cilia and Dyf phenotypes in osm-3 null mutants, confirming their functionality (Fig. S1 A). Using a transgenic animal expressing the mScarlet::OSM-3::GFP FLIM reporter, we observed a GFP lifetime of 2.64 ± 0.02 or 2.64 ± 0.08 ns in the soma or dendrite. This value is notably lower than the 2.91 ± 0.04 ns lifetime of the non-FRET control OSM-3::GFP but similar to the FRET-positive control OSM-3::GFP::mScarlet measured in the same regions, suggesting that OSM-3 adopts a compact conformation in these areas, indicative of its autoinhibitory nature (Fig. 1, C and D).

FLIM measurement of OSM-3 conformation in C. elegans sensory cilia. (A) Schematic diagram designed for FLIM-FRET assay. Lifetime of GFP was measured and analyzed. (B) Diagram illustrating the conformational change between autoinhibited and active OSM-3 with different fluorescence labeling. (C) Schematic of the C. elegans amphid neurons. The dashed boxes are enlarged on the right, representing cilia and soma, respectively. Each cilium contains a transition zone (t.z.), a middle segment (m.s.), and a distal segment (d.s.). (D) Representative FLIM images of OSM-3 with different fluorescence labeling. OSM-3::GFP, OSM-3::GFP::mScarlet, and mScarlet::OSM-3::GFP are expressed under the control of Pdyf-1 in osm-3 null mutant animals. Fluorescence lifetimes of GFP are shown with a scale of pseudo color ranging from 2.50 to 3.00 nanoseconds (ns). Scale bar, 5 μm. (E) Statistics of lifetimes of GFP measured from different regions of amphid neurons in worms of indicated genotypes. Data are mean ± SD. Comparisons were performed between OSM-3::GFP and OSM-3::GFP::mScarlet or mScarlet::OSM-3::GFP. ***P < 0.001 by one-way ANOVA using BH method to adjust P values. (F) Diagram illustrating conformational changes of homodimeric OSM-3 kinesins in different regions of C. elegans sensory cilia suggested by FLIM-FRET.
FLIM measurement of OSM-3 conformation in C. elegans sensory cilia. (A) Schematic diagram designed for FLIM-FRET assay. Lifetime of GFP was measured and analyzed. (B) Diagram illustrating the conformational change between autoinhibited and active OSM-3 with different fluorescence labeling. (C) Schematic of the C. elegans amphid neurons. The dashed boxes are enlarged on the right, representing cilia and soma, respectively. Each cilium contains a transition zone (t.z.), a middle segment (m.s.), and a distal segment (d.s.). (D) Representative FLIM images of OSM-3 with different fluorescence labeling. OSM-3::GFP, OSM-3::GFP::mScarlet, and mScarlet::OSM-3::GFP are expressed under the control of Pdyf-1 in osm-3 null mutant animals. Fluorescence lifetimes of GFP are shown with a scale of pseudo color ranging from 2.50 to 3.00 nanoseconds (ns). Scale bar, 5 μm. (E) Statistics of lifetimes of GFP measured from different regions of amphid neurons in worms of indicated genotypes. Data are mean ± SD. Comparisons were performed between OSM-3::GFP and OSM-3::GFP::mScarlet or mScarlet::OSM-3::GFP. ***P < 0.001 by one-way ANOVA using BH method to adjust P values. (F) Diagram illustrating conformational changes of homodimeric OSM-3 kinesins in different regions of C. elegans sensory cilia suggested by FLIM-FRET.

FLIM-FRET measurement of OSM-3. (A) Representative cilia images of osm-3 null mutant and animals expressing FLIM-FRET constructs. For osm-3 null animals, cilia are visualized with mScarlet-tagged endogenous DYF-11. Arrows indicate the ciliary base. Arrowheads indicate the junctions between the middle and distal segments. Scale bar, 5 μm. Dyf, dye-filling defective; N ≥ 100. (B) Examples of fluorescence intensity decay curve showing different FRET efficiency at different regions of amphid cilia. 10 representative worms of mScarlet::osm-3::gfp strain were measured. (C) Frequency distribution of GFP fluorescence lifetimes measured from images as shown in Fig. 1 D. 10 representative worms of each strain were measured. The plots were fit with a Gaussian distribution. (D) Statistics of GFP fluorescence lifetimes measured from different regions of amphid neurons. The GFP fluorescence lifetimes of other regions are normalized to soma of each strain. More than 14 worms were measured for each strain. Comparisons were performed between OSM-3::GFP::mScarlet and mScarlet::OSM-3::GFP. n.s., not significant; ***P < 0.001 by unpaired Student’s t tests. Data are mean ± SD.

FLIM-FRET measurement of OSM-3. (A) Representative cilia images of osm-3 null mutant and animals expressing FLIM-FRET constructs. For osm-3 null animals, cilia are visualized with mScarlet-tagged endogenous DYF-11. Arrows indicate the ciliary base. Arrowheads indicate the junctions between the middle and distal segments. Scale bar, 5 μm. Dyf, dye-filling defective; N ≥ 100. (B) Examples of fluorescence intensity decay curve showing different FRET efficiency at different regions of amphid cilia. 10 representative worms of mScarlet::osm-3::gfp strain were measured. (C) Frequency distribution of GFP fluorescence lifetimes measured from images as shown in Fig. 1 D. 10 representative worms of each strain were measured. The plots were fit with a Gaussian distribution. (D) Statistics of GFP fluorescence lifetimes measured from different regions of amphid neurons. The GFP fluorescence lifetimes of other regions are normalized to soma of each strain. More than 14 worms were measured for each strain. Comparisons were performed between OSM-3::GFP::mScarlet and mScarlet::OSM-3::GFP. n.s., not significant; ***P < 0.001 by unpaired Student’s t tests. Data are mean ± SD.
Interestingly, measurements of GFP lifetime in different ciliary segments revealed values of 2.76 ± 0.06 and 2.70 ± 0.07 ns at both the ciliary base and middle segments for mScarlet::OSM-3::GFP, significantly reduced compared with GFP alone (Fig. 1 E and Fig. S1 D). This indicates that OSM-3 might already be released from its autoinhibitory conformation at the ciliary base, despite barely exhibiting active motility (Zhang et al., 2021). Conversely, as the motor progresses along the ciliary distal segments and stops at the ciliary tip, the GFP lifetime for the mScarlet::OSM-3::GFP reporter decreases to 2.58 ± 0.07 ns (Fig. S1, B and C). The decrease of fluorescence lifetime along the length of cilium may result from that more motors are released from IFT trains when approaching the ciliary tip and are recycled to the handover zone, thus adopting inactive conformation. While anterograde lifetime cannot be discriminated from retrograde lifetime in this analysis, and determining OSM-3’s precise conformation within cilia requires its in situ structure, the elevated FRET signal from mScarlet::OSM-3::GFP in the ciliary base and middle segments suggests that conformational release may precede motor activation (Fig. 1 F). This observation implies the presence of a mechanism that might restrict kinesin motility in its active conformation.
NEKL-3 kinase plays a major role in preventing OSM-3’s premature motility
Given the critical role of protein phosphorylation in modulating protein conformation and activity, we hypothesized that OSM-3 might undergo phosphorylation at the ciliary base, potentially suppressing its activity despite its open and active conformation. Previous research has highlighted the localization of NEKL-4 kinase at the ciliary base and its role as a genetic suppressor of the tubulin modification enzyme TTLL (Power et al., 2020), hinting at NEKL-4’s involvement in ciliary formation or function. However, introducing OSM-3::GFP into the nekl-4 null allele revealed no significant abnormalities in ciliary length or the localization of OSM-3 compared with WT, suggesting NEKL-4’s nonessential role in IFT or ciliogenesis, at least when acting alone (Fig. 2 D).

NEKL-3 and NEKL-4 kinases prevent OSM-3’s premature motility. (A) Left panel: Schematic of the C. elegans amphid and phasmid cilia. The dashed boxes are enlarged in the middle panel. Right panel: Representative fluorescence images of the endogenous NEKL-3 labeled with mScarlet. Scale bar, 5 μm. (B) Diagram illustrating synthetic gRNAs (sgRNAs) for nekl-3 nekl-3 cko and the EMS-mutated site on nekl-4 null allele. The gene models are from WormBase. Scale bar, 500 nucleotides. (C) T7EI assay showing the cleavage efficiency of the nekl-3 gene conditionally mutated in animals expressing Phsp::Cas9 and PU6::nekl-3-sg without (left lane) or with heat-shock treatment (right lane). (D) Abnormal distribution of OSM-3 labeled with GFP within the phasmid cilia of nekl-3 and nekl-4 mutant animals. The yellow dotted lines indicate the ciliary base, and the orange dotted lines indicate the junction between the middle segment and the distal segment. Scale bar, 5 μm. (E) Statistics of the cilium length (mean ± SD) measured in the indicated animals. Comparisons were performed between WT and the indicated genotypes by unpaired Student’s t tests. N = 38–45 animals. n.s., not significant. (F) Statistics of the OSM-3 fluorescence intensity ratio (mean ± SD) between middle segment and distal segment in the indicated animals. Fluorescence ratio = 0.5*([mean gray value of middle segment area]−[background gray value])/([mean gray value of distal segment]−[background gray value]). N ≥ 32 animals. Data are mean ± SD. n.s., not significant; ***P < 0.001 by the unpaired Student’s t test with Welch’s correction. Green asterisks represent comparisons between WT animals and other strains; yellow asterisk represents comparison to nekl-3 cko strain. t.z., transition zone; m.s., middle segment; d.s., distal segment. Source data are available for this figure: SourceData F2.
NEKL-3 and NEKL-4 kinases prevent OSM-3’s premature motility. (A) Left panel: Schematic of the C. elegans amphid and phasmid cilia. The dashed boxes are enlarged in the middle panel. Right panel: Representative fluorescence images of the endogenous NEKL-3 labeled with mScarlet. Scale bar, 5 μm. (B) Diagram illustrating synthetic gRNAs (sgRNAs) for nekl-3 nekl-3 cko and the EMS-mutated site on nekl-4 null allele. The gene models are from WormBase. Scale bar, 500 nucleotides. (C) T7EI assay showing the cleavage efficiency of the nekl-3 gene conditionally mutated in animals expressing Phsp::Cas9 and PU6::nekl-3-sg without (left lane) or with heat-shock treatment (right lane). (D) Abnormal distribution of OSM-3 labeled with GFP within the phasmid cilia of nekl-3 and nekl-4 mutant animals. The yellow dotted lines indicate the ciliary base, and the orange dotted lines indicate the junction between the middle segment and the distal segment. Scale bar, 5 μm. (E) Statistics of the cilium length (mean ± SD) measured in the indicated animals. Comparisons were performed between WT and the indicated genotypes by unpaired Student’s t tests. N = 38–45 animals. n.s., not significant. (F) Statistics of the OSM-3 fluorescence intensity ratio (mean ± SD) between middle segment and distal segment in the indicated animals. Fluorescence ratio = 0.5*([mean gray value of middle segment area]−[background gray value])/([mean gray value of distal segment]−[background gray value]). N ≥ 32 animals. Data are mean ± SD. n.s., not significant; ***P < 0.001 by the unpaired Student’s t test with Welch’s correction. Green asterisks represent comparisons between WT animals and other strains; yellow asterisk represents comparison to nekl-3 cko strain. t.z., transition zone; m.s., middle segment; d.s., distal segment. Source data are available for this figure: SourceData F2.
With multiple NEKL kinase family members encoded in the C. elegans genome, we explored the possibility of functional redundancy with NEKL-4 in ciliary structure and function (Fig. S2 A). Notably, we found NEKL-3 kinase expression in ciliated neurons, with distribution at the ciliary base and along the dendrites (Fig. 2 A). Previous genetic studies have shown NEKL-3 kinase’s involvement in vital larval developmental processes, with nonsense mutations leading to lethality (Consortium, 2012; Yochem et al., 2015). To investigate NEKL-3’s potential regulatory role over OSM-3, we utilized our established somatic CRISPR-Cas9 platform (Shen et al., 2014) to generate conditional knockout nekl-3 mutants (nekl-3 cko) within ciliated neurons. We directed Cas9 endonuclease expression using the heat-shock promoter or ciliated neuron-specific Pdyf-1 promoter (Akçimen et al., 2023). This approach had previously been applied to successfully mutate components of the cytoplasmic dynein complex in a cell-specific manner within ciliated neurons (Li et al., 2015, 2017). Our T7EI assay confirmed successful mutation of the nekl-3 gene, indicating the potential for investigation into NEKL-3’s role in OSM-3 regulation (Fig. 2, B and C). Importantly, heat-shock treatment did not induce any noticeable ciliary defects in WT animals, confirming that heat shock does not affect cilia (Fig. 2, D–F and Fig. S2 D).

NEKL-3 and NEKL-4 kinases regulate OSM-3’s regional motility. (A) Heatmap showing the expression levels of nekl-3, nekl-4, and let-92 in ciliated sensory neurons. The plot was generated from CeNGEN website (https://cengen.shinyapps.io/CengenApp/). The size of each circle corresponds to the proportion of neurons in each cluster expressing a particular gene. TPM, transcripts per million. (B) Distribution of OSM-3::GFP within the amphid cilia of nekl-3 and nekl-4 mutant animals. Scale bar, 5 μm. (C) Statistics of the total fluorescence intensity of OSM-3 labeled with GFP in cilia of the indicated animals. Comparisons were performed between WT and other strains. n.s., not significant by unpaired Student’s t tests. Data are mean ± SD. (D) IFT velocities summary of OSM-3::GFP. Numbers of IFT particles are indicated. Comparisons were performed between WT and other strains. n.s., not significant; ***P < 0.001 by unpaired Student’s t tests. m.s.: middle segment; d.s.: distal segment.

NEKL-3 and NEKL-4 kinases regulate OSM-3’s regional motility. (A) Heatmap showing the expression levels of nekl-3, nekl-4, and let-92 in ciliated sensory neurons. The plot was generated from CeNGEN website (https://cengen.shinyapps.io/CengenApp/). The size of each circle corresponds to the proportion of neurons in each cluster expressing a particular gene. TPM, transcripts per million. (B) Distribution of OSM-3::GFP within the amphid cilia of nekl-3 and nekl-4 mutant animals. Scale bar, 5 μm. (C) Statistics of the total fluorescence intensity of OSM-3 labeled with GFP in cilia of the indicated animals. Comparisons were performed between WT and other strains. n.s., not significant by unpaired Student’s t tests. Data are mean ± SD. (D) IFT velocities summary of OSM-3::GFP. Numbers of IFT particles are indicated. Comparisons were performed between WT and other strains. n.s., not significant; ***P < 0.001 by unpaired Student’s t tests. m.s.: middle segment; d.s.: distal segment.
In our nekl-3 cko animals, we did not detect a marked reduction in ciliary length (Fig. 2, D–E). For total fluorescence of OSM-3 in the whole cilia, significant differences between these animals were not found either (Fig. S2, B and C). However, we found OSM-3::GFP exhibits abnormal distribution within the cilia. In WT cilia, OSM-3 is predominantly concentrated in the distal segment, leading to ∼0.6-fold the fluorescence intensity of OSM-3::GFP in the middle segment compared with the distal segment. Contrastingly, in the nekl-3 cko mutants, this distal enrichment was significantly diminished, with a 1.0-fold difference observed. To exclude the possibility of off-target effects by Cas9, we conducted genetic rescue experiments using a modified WT nekl-3 gene containing synonymous mutations in the PAM sequence to impair Cas9 recognition. Upon transformation into the nekl-3 cko allele, the fluorescence intensity of OSM-3::GFP in the middle segment was no longer increased, and IFT velocities were restored to levels closer to WT. These results confirmed that the observed ciliary phenotypes are specifically due to the conditional loss of nekl-3 function. Further, by genetically incorporating the nekl-4 null allele into the nekl-3 cko mutants, we observed a more pronounced decrease in OSM-3 concentration within the distal segments (Fig. 2 F and Fig. 3 A).

Loss of NEKL-3/4 affects regional motility of OSM-3 in sensory cilia. (A) Representative fluorescence intensity profiles along the cilium. All fluorescence intensity profiles are normalized to their maximum. N = 15–19 animals. Data are mean ± SD. (B) Kymographs showing the anterograde movement of OSM-3::GFP in the middle segments and distal segments. Representative particle traces are marked with green, purple, yellow, and red lines. The scale bars represent 5 μm (horizontal) and 20 s (vertical). (C) Histogram of OSM-3::GFP velocities. (Top) anterograde IFT along the middle segments (Antero. m.s.). (Middle) anterograde IFT along the distal segments (Antero. d.s.). (Bottom) retrograde IFT (Retro.). Each plot was fitted by a Gaussian distribution. Velocities and numbers of IFT particles (N) are indicated. Comparisons were performed between WT and other strains. *P < 0.05; **P < 0.01; ***P < 0.001 by unpaired Student’s t tests. m.s.: middle segment; d.s.: distal segment.
Loss of NEKL-3/4 affects regional motility of OSM-3 in sensory cilia. (A) Representative fluorescence intensity profiles along the cilium. All fluorescence intensity profiles are normalized to their maximum. N = 15–19 animals. Data are mean ± SD. (B) Kymographs showing the anterograde movement of OSM-3::GFP in the middle segments and distal segments. Representative particle traces are marked with green, purple, yellow, and red lines. The scale bars represent 5 μm (horizontal) and 20 s (vertical). (C) Histogram of OSM-3::GFP velocities. (Top) anterograde IFT along the middle segments (Antero. m.s.). (Middle) anterograde IFT along the distal segments (Antero. d.s.). (Bottom) retrograde IFT (Retro.). Each plot was fitted by a Gaussian distribution. Velocities and numbers of IFT particles (N) are indicated. Comparisons were performed between WT and other strains. *P < 0.05; **P < 0.01; ***P < 0.001 by unpaired Student’s t tests. m.s.: middle segment; d.s.: distal segment.
For the IFT velocities of OSM-3::GFP within the cilia, kymographs were generated and measured in different ciliary regions separately (Fig. 3 B). Consistent with the altered ciliary distribution of OSM-3 in nekl-3 cko animals, IFT velocity of OSM-3::GFP in the middle segments also increased from 0.74 μm/s to 0.91 μm/s, compared with WT animals (Fig. 3 C and Fig. S2 D). This presumably resulted from premature activation of OSM-3 in the middle segments due to absence of NEKL-3. Concordantly, IFT velocity of OSM-3::GFP in the middle segments increased in nekl-3 cko; nekl-4 null double-mutant animals as well. Taken together, our results suggest that it is mainly the NEKL-3 kinase that regulates OSM-3’s motility, while NEKL-4 may play a minor role, revealing an additional layer of control over kinesin activity within ciliary segments.
Ectopic ciliary localization of NEKL-3 inhibits OSM-3 motility
To further explore NEKL-3’s influence on OSM-3 regulation and ciliary development, we engineered constructs to target NEKL-3 to specific ciliary subdomains. Leveraging our previously established techniques (Chen et al., 2023; Li et al., 2021), we fused NEKL-3 with the transition zone protein MKRS-2 or the ciliary distal segment enriched protein PCRG-1, facilitating its ectopic localization within the cilia (Fig. 4 A). Subsequent analysis revealed aberrant localization of NEKL-3 at the transition zone and ciliary distal segments in these transgenic lines (Fig. 4, B and C). When NEKL-3 is ectopically expressed at the transition zone (mksr-2::nekl-3), cilium length is not significantly altered. In contrast, in pcrg-1::nekl-3 transgenic animals that express NEKL-3 in the ciliary middle segments, the IFT velocity of OSM-3 was noticeably reduced, resulting in shorter cilia. As a negative control, ectopic expression of PCRG-1 fused with NEKL-3 harboring a kinase dead D150A mutation significantly alleviated those ciliary abnormalities (Fig. 4, D and E). These findings indicate that NEKL-3’s presence within the cilia is a potent inhibitor of OSM-3 motility. Collectively, our research illuminates the pivotal role of NEKL-3 kinase in modulating OSM-3’s regional motility.

Ectopic localization of NEKL-3 inhibits OSM-3 motility. (A) Schematic of plasmids used to ectopically express fused NEKL-3 at transition zone (mksr-2::nekl-3) or distal segment (pcrg-1::nekl-3) under the control of Pdyf-1. (B) Amphid and phasmid cilia in mskr-2::nekl-3 animals were labeled by OSM-3::GFP. The distribution of OSM-3::GFP was not affected. Arrows indicate the ciliary base, and arrowheads indicate the junction between the middle segment and the distal segment. Scale bar, 5 μm. (C) Representative fluorescence images of amphid and phasmid cilia in pcrg-1::nekl-3 animals. Arrows indicate the ciliary base, and arrowheads indicate the junction between the middle segment and the distal segment. Scale bar, 5 μm. (D) Quantification of the cilium length (mean ± SD) measured in the indicated animals. Comparisons were performed between WT and the indicated genotypes by unpaired Student’s t tests. N = 37–48 animals. Statistical significance, compared with the control with a matching color code, is based on Student’s t test. **P < 0.01; ***P < 0.001. (E) Histogram of OSM-3::GFP anterograde IFT velocities along the middle segments (Antero. m.s.). Velocities and numbers of IFT particles (N) are indicated. Each plot was fitted by a Gaussian distribution. Statistical significance, compared with the control with a matching color code, is based on Student’s t test. ***P < 0.001. Data are mean ± SD.
Ectopic localization of NEKL-3 inhibits OSM-3 motility. (A) Schematic of plasmids used to ectopically express fused NEKL-3 at transition zone (mksr-2::nekl-3) or distal segment (pcrg-1::nekl-3) under the control of Pdyf-1. (B) Amphid and phasmid cilia in mskr-2::nekl-3 animals were labeled by OSM-3::GFP. The distribution of OSM-3::GFP was not affected. Arrows indicate the ciliary base, and arrowheads indicate the junction between the middle segment and the distal segment. Scale bar, 5 μm. (C) Representative fluorescence images of amphid and phasmid cilia in pcrg-1::nekl-3 animals. Arrows indicate the ciliary base, and arrowheads indicate the junction between the middle segment and the distal segment. Scale bar, 5 μm. (D) Quantification of the cilium length (mean ± SD) measured in the indicated animals. Comparisons were performed between WT and the indicated genotypes by unpaired Student’s t tests. N = 37–48 animals. Statistical significance, compared with the control with a matching color code, is based on Student’s t test. **P < 0.01; ***P < 0.001. (E) Histogram of OSM-3::GFP anterograde IFT velocities along the middle segments (Antero. m.s.). Velocities and numbers of IFT particles (N) are indicated. Each plot was fitted by a Gaussian distribution. Statistical significance, compared with the control with a matching color code, is based on Student’s t test. ***P < 0.001. Data are mean ± SD.
The NEKL-3 kinase directly phosphorylates and inhibits OSM-3 motility in vitro
To investigate whether NEKL-3 regulates OSM-3 motility through direct phosphorylation, we prepared recombinant OSM-3 kinesin and NEKL-3 kinase from bacterial sources. Through in vitro phosphorylation assays (Li et al., 2021), we showed that purified NEKL-3 phosphorylates OSM-3 (Fig. S3, A and B). Subsequent mass spectrometry analysis of phosphopeptides identified serine 96 (S96) of OSM-3 as a phosphorylation site (Fig. 5 A). Sequence alignment indicates that the S96 site is evolutionarily conserved across the kinesin superfamilies (Fig. S3 F). According to crystallographic data (Varela et al., 2021), S96 in OSM-3 is situated on the α2 helix, right behind the P-loop. (Fig. 5 B). The phosphorylation at this site could potentially disrupt the hydrogen bond formation with R10, which might impede nucleotide binding and consequently reduce ATPase activity and motility of OSM-3. Such phosphorylation regulation in kinesin superfamily proteins is previously unreported, and its functional impact remains unknown.
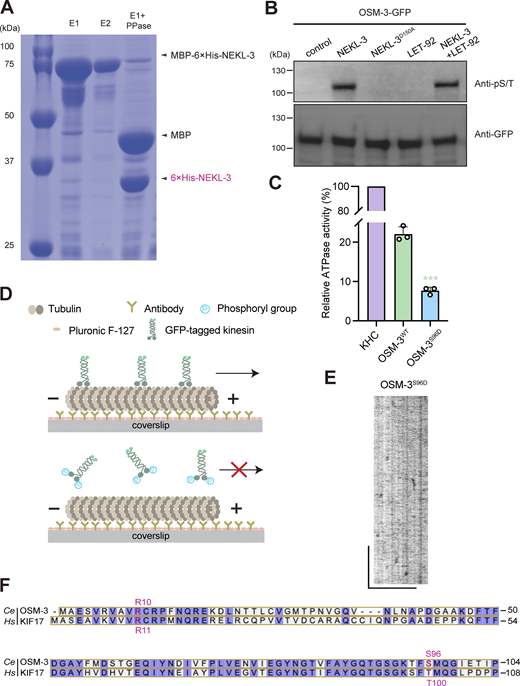
NEKL-3 phosphorylates OSM-3 in vitro. (A) SDS-PAGE result of the purified NEKL-3 proteins. (B) Western blot illustrating phosphorylation of OSM-3 by NEKL-3. (C) Relative ATPase activity of phosphomimic OSM-3S96D normalized to kinesin heavy chain (KHC). The results were obtained from three independent experiments. Statistical significance, compared with OSM-3WT with a matching color code, is based on Student’s t test. ***P < 0.001. (D) Schematic of single-molecule motility assay for the measurement of motility properties of OSM-3 phosphorylated by NEKL-3. (E) Representative kymographs showing the non-active motion of OSM-3S96D along the MT. Horizontal scale bar, 5 µm; vertical bar, 10 s. (F) Alignment of motor domain sequence between human KIF17 and C. elegans OSM-3 proteins. Identical residues are highlighted in purple. R10 and S96 of OSM-3 are highlighted in scarlet. Source data are available for this figure: SourceData FS3.

NEKL-3 phosphorylates OSM-3 in vitro. (A) SDS-PAGE result of the purified NEKL-3 proteins. (B) Western blot illustrating phosphorylation of OSM-3 by NEKL-3. (C) Relative ATPase activity of phosphomimic OSM-3S96D normalized to kinesin heavy chain (KHC). The results were obtained from three independent experiments. Statistical significance, compared with OSM-3WT with a matching color code, is based on Student’s t test. ***P < 0.001. (D) Schematic of single-molecule motility assay for the measurement of motility properties of OSM-3 phosphorylated by NEKL-3. (E) Representative kymographs showing the non-active motion of OSM-3S96D along the MT. Horizontal scale bar, 5 µm; vertical bar, 10 s. (F) Alignment of motor domain sequence between human KIF17 and C. elegans OSM-3 proteins. Identical residues are highlighted in purple. R10 and S96 of OSM-3 are highlighted in scarlet. Source data are available for this figure: SourceData FS3.

NEKL-3 kinase directly phosphorylates and inhibits OSM-3 motility, influencing OSM-3 motility properties in vitro. (A) Tandem mass spectrum of the S96-phosphorylated peptide of OSM-3. The y and b series indicate fragments at amide bonds of the peptide. (B and C) Schematic of hydrogen bond between R10 and S96 (pink) at the AMPPNP (yellow)-binding pocket of OSM-3 (green). (PDB: 7A5E) (C) Relative ATPase activity of OSM-3WT reacted with NEKL-3 or heat-denatured NEKL-3 (dNEKL-3). The assays were performed as described in methods following the established protocols. The mean activity of kinesin heavy chain (KHC) was set to 100%. The results were obtained from three independent experiments. Statistical significance, compared with the control with a matching color code, is based on Student’s t test. n.s., not significant; *P < 0.05; ***P < 0.001. Data are mean ± SD. (D) Representative kymographs showing the motion of phosphorylated or unphosphorylated OSM-3G444E along the MT. Horizontal scale bar, 5 µm; vertical bar, 10 s. (E) Quantification of the number of processive events per micrometer of MT per minute in C. The total numbers of events analyzed were 316 (OSM-3G444E), 80 (OSM-3G444E+NEKL-3), and 235 (OSM-3G444E+dNEKL-3). Statistical significance, compared with the control with matching color codes, is by Mann–Whitney nonparametric test. n.s., not significant; ***P < 0.001. Data are mean ± SD. (F) Statistics of motility properties of OSM-3 under different conditions. † OSM-3G444E was used for single-molecule motility assay. ‡ OSM-3WT was used in MT-gliding assay. Statistical significance is compared with the control. n.s., not significant; **P < 0.01; ***P < 0.001. ND, not detected. Data are mean ± SD. (G) Quantification of the number of detachment events per micrometer of MT per minute during MT-gliding assay. N ≥ 20. Statistical significance, compared with the control with matching color codes, is by Mann–Whitney nonparametric test. n.s., not significant; ***P < 0.001. Data are mean ± SD.
NEKL-3 kinase directly phosphorylates and inhibits OSM-3 motility, influencing OSM-3 motility properties in vitro. (A) Tandem mass spectrum of the S96-phosphorylated peptide of OSM-3. The y and b series indicate fragments at amide bonds of the peptide. (B and C) Schematic of hydrogen bond between R10 and S96 (pink) at the AMPPNP (yellow)-binding pocket of OSM-3 (green). (PDB: 7A5E) (C) Relative ATPase activity of OSM-3WT reacted with NEKL-3 or heat-denatured NEKL-3 (dNEKL-3). The assays were performed as described in methods following the established protocols. The mean activity of kinesin heavy chain (KHC) was set to 100%. The results were obtained from three independent experiments. Statistical significance, compared with the control with a matching color code, is based on Student’s t test. n.s., not significant; *P < 0.05; ***P < 0.001. Data are mean ± SD. (D) Representative kymographs showing the motion of phosphorylated or unphosphorylated OSM-3G444E along the MT. Horizontal scale bar, 5 µm; vertical bar, 10 s. (E) Quantification of the number of processive events per micrometer of MT per minute in C. The total numbers of events analyzed were 316 (OSM-3G444E), 80 (OSM-3G444E+NEKL-3), and 235 (OSM-3G444E+dNEKL-3). Statistical significance, compared with the control with matching color codes, is by Mann–Whitney nonparametric test. n.s., not significant; ***P < 0.001. Data are mean ± SD. (F) Statistics of motility properties of OSM-3 under different conditions. † OSM-3G444E was used for single-molecule motility assay. ‡ OSM-3WT was used in MT-gliding assay. Statistical significance is compared with the control. n.s., not significant; **P < 0.01; ***P < 0.001. ND, not detected. Data are mean ± SD. (G) Quantification of the number of detachment events per micrometer of MT per minute during MT-gliding assay. N ≥ 20. Statistical significance, compared with the control with matching color codes, is by Mann–Whitney nonparametric test. n.s., not significant; ***P < 0.001. Data are mean ± SD.
We next assessed the MT-stimulated ATPase activity of WT OSM-3 phosphorylated by NEKL-3. NEKL-3 significantly reduced ATPase activity of OSM-3WT, while heat-inactivated NEKL-3 (dNEKL-3) did not (Fig. 5 C). In line with structural predictions, the phosphomimic S96D mutation significantly decreased ATPase activity of OSM-3 (Fig. S3 C). Our MT-gliding assays revealed no gliding activity for OSM-3S96D. Furthermore, our single-molecule motility study did not reveal any movement of OSM-3S96D on MTs under total internal reflection fluorescence microscopy (Fig. S3, D and E). A constitutively active form OSM-3G444E mutant (Imanishi et al., 2006; Xie et al., 2024) was used as a positive control. This mutant exhibited processive movement, whereas the WT OSM-3 is auto-inhibited and does not exhibit motility in the single-molecule motility assay.
To ascertain NEKL-3’s direct effect on OSM-3 motility, we incorporated NEKL-3 kinase into an OSM-3–dependent MT-gliding assay (Fig. S4 B). Adding NEKL-3 resulted in MTs disengaging from the glass substrate, halting their gliding motion. We validated that this effect was due to NEKL-3’s kinase activity by introducing heat-inactivated NEKL-3 (dNEKL-3), which did not influence MT gliding, thereby confirming the critical role of active NEKL-3 (Fig. 5 G). In assays combining various proportions of OSM-3WT and OSM-3S96D, an increased presence of OSM-3S96D noticeably increased detachment events during MT movement (Fig. S4 C). Consistently, our single-molecule motility assay revealed the similar inhibitory effect of the NEKL-3’s kinase activity on the processive movement of OSM-3G444E using heat-inactivated NEKL-3 or kinase dead NEKL-3D150A as controls (Fig. 5, E and F; and Fig. S4, A, D, and E). These data indicate an inhibitory effect of NEKL-3 phosphorylation at the S96 of the OSM-3 motor head on its motility (Video 1, Video 2, Video 3, Video 4, and Video 5).

NEKL-3 inhibits motility of OSM-3 in vitro . (A) Quantification of the velocity (Top) and run length (Bottom) for each protein in single-molecule motility assay. The number of events is plotted for the velocity and run length as a histogram and fitted to a Gaussian distribution. The velocity and run length of the corresponding population of the protein (N) are indicated in each panel as mean ± SD. (B) Schematic of MT-gliding assay for the measurement of motility properties of OSM-3 phosphorylated by NEKL-3. (C) Quantification of the number of detachment events per micrometer of MT per minute during MT-gliding assay when different portion of OSM-3S96D was added to OSM-3WT. N ≥ 20. Statistical significance, compared with OSM-3WT, is by Mann–Whitney nonparametric test. **P < 0.01; ***P < 0.001. Data are mean ± SD. (D) Quantification of the processive events (mean ± SD) of OSM-3G444E processed by kinase activity dead NEKL-3D150A in single-molecule motility assay. Statistical significance, compared with the control with matching color codes, is by Mann–Whitney nonparametric test. n.s., not significant. (E) Statistics of motility properties of OSM-3 reacted with inactive NEKL-3D150A in single-molecule motility assay and MT-gliding assay. n.s., not significant. Data are mean ± SD.

NEKL-3 inhibits motility of OSM-3 in vitro . (A) Quantification of the velocity (Top) and run length (Bottom) for each protein in single-molecule motility assay. The number of events is plotted for the velocity and run length as a histogram and fitted to a Gaussian distribution. The velocity and run length of the corresponding population of the protein (N) are indicated in each panel as mean ± SD. (B) Schematic of MT-gliding assay for the measurement of motility properties of OSM-3 phosphorylated by NEKL-3. (C) Quantification of the number of detachment events per micrometer of MT per minute during MT-gliding assay when different portion of OSM-3S96D was added to OSM-3WT. N ≥ 20. Statistical significance, compared with OSM-3WT, is by Mann–Whitney nonparametric test. **P < 0.01; ***P < 0.001. Data are mean ± SD. (D) Quantification of the processive events (mean ± SD) of OSM-3G444E processed by kinase activity dead NEKL-3D150A in single-molecule motility assay. Statistical significance, compared with the control with matching color codes, is by Mann–Whitney nonparametric test. n.s., not significant. (E) Statistics of motility properties of OSM-3 reacted with inactive NEKL-3D150A in single-molecule motility assay and MT-gliding assay. n.s., not significant. Data are mean ± SD.
MT-gliding assays of OSM-3WT. Video represents MT-gliding assays of OSM-3WT. Fluorescent signals showed rhodamine-labeled MTs. Movies were filmed by TIRF microscopy. Scale bar, 5 μm. Frames were taken every second. Display rate, 10 frames per second. TIRF, total internal reflection fluorescence.
MT-gliding assays of OSM-3WT. Video represents MT-gliding assays of OSM-3WT. Fluorescent signals showed rhodamine-labeled MTs. Movies were filmed by TIRF microscopy. Scale bar, 5 μm. Frames were taken every second. Display rate, 10 frames per second. TIRF, total internal reflection fluorescence.
MT-gliding assays of OSM-3WTwith dNEKL-3. Video represents MT-gliding assays of OSM-3WT with dNEKL-3. Fluorescent signals showed rhodamine-labeled MTs. Movies were filmed by TIRF microscopy. Scale bar, 5 μm. Frames were taken every second. Display rate, 10 frames per second. TIRF, total internal reflection fluorescence.
MT-gliding assays of OSM-3WTwith dNEKL-3. Video represents MT-gliding assays of OSM-3WT with dNEKL-3. Fluorescent signals showed rhodamine-labeled MTs. Movies were filmed by TIRF microscopy. Scale bar, 5 μm. Frames were taken every second. Display rate, 10 frames per second. TIRF, total internal reflection fluorescence.
MT-gliding assays of OSM-3WTwith NEKL-3. Video represents MT-gliding assays of OSM-3WT with NEKL-3. Fluorescent signals showed rhodamine-labeled MTs. Movies were filmed by TIRF microscopy. Scale bar, 5 μm. Frames were taken every second. Display rate, 10 frames per second. TIRF, total internal reflection fluorescence.
MT-gliding assays of OSM-3WTwith NEKL-3. Video represents MT-gliding assays of OSM-3WT with NEKL-3. Fluorescent signals showed rhodamine-labeled MTs. Movies were filmed by TIRF microscopy. Scale bar, 5 μm. Frames were taken every second. Display rate, 10 frames per second. TIRF, total internal reflection fluorescence.
MT-gliding assays of OSM-3WTwith 10% OSM-3S96D. Video represents MT-gliding assays of OSM-3WT mixed with 10% OSM-3S96D. Fluorescent signals showed rhodamine-labeled MTs. Movies were filmed by TIRF microscopy. Scale bar, 5 μm. Frames were taken every second. Display rate, 10 frames per second. TIRF, total internal reflection fluorescence.
MT-gliding assays of OSM-3WTwith 10% OSM-3S96D. Video represents MT-gliding assays of OSM-3WT mixed with 10% OSM-3S96D. Fluorescent signals showed rhodamine-labeled MTs. Movies were filmed by TIRF microscopy. Scale bar, 5 μm. Frames were taken every second. Display rate, 10 frames per second. TIRF, total internal reflection fluorescence.
MT-gliding assays of OSM-3WTwith 25% OSM-3S96D. Video represents MT-gliding assays of OSM-3WT mixed with 25% OSM-3S96D. Fluorescent signals showed rhodamine-labeled MTs. Movies were filmed by TIRF microscopy. Scale bar, 5 μm. Frames were taken every second. Display rate, 10 frames per second. TIRF, total internal reflection fluorescence.
MT-gliding assays of OSM-3WTwith 25% OSM-3S96D. Video represents MT-gliding assays of OSM-3WT mixed with 25% OSM-3S96D. Fluorescent signals showed rhodamine-labeled MTs. Movies were filmed by TIRF microscopy. Scale bar, 5 μm. Frames were taken every second. Display rate, 10 frames per second. TIRF, total internal reflection fluorescence.
Building upon these in vitro findings, we explored the in vivo significance of OSM-3’s S96 phosphorylation. Using genome-editing techniques, we introduced the S96D or S96A mutation into the C. elegans OSM-3::GFP genome (Fig. 6 A). The resultant osm-3S96D knock-in animals exhibited a complete loss of their distal ciliary segments and a significant reduction in IFT speed within the middle segments. Conversely, the non-phosphorylating osm-3S96A mutation only mildly affected IFT velocity and had less impact on the length of distal ciliary segments (Fig. 6, B and C). Moreover, we found that S96D mutation suppresses the phenotypes of nekl-3 cko and that S96A mutation suppresses ectopic overexpression of NEKL-3 since S96D or S96A is already in phosphomimic or phosphodead form (Fig. 6, D–F and Fig. S5 D). In addition, we reasoned that S96C can form stronger hydrogen bond with R10 than S96A, which is better for mimicking the non-phosphorylated state of S96. Concordantly, our results showed that the cilium length of osm-3S96C animals is more similar to WT compared with osm-3S96A; however, there are no significant differences between the reduced IFT velocities of these two mutations. (Fig. S5, A–C). These combined results from in vitro and in vivo experiments confirm that phosphorylation of OSM-3 at the S96 site by NEKL-3 is a critical regulator, effectively inhibiting OSM-3’s motor function and impacting ciliary structure and dynamics.

The phosphomimic mutation S96D inhibits OSM-3 motility in vivo. (A) Amphid and phasmid cilia in the WT, osm-3S96D, and osm-3S96A mutant animals. Cilia are visualized with GFP-tagged endogenous WT OSM-3 (the same as Fig. 2 D) or the corresponding mutant OSM-3. Dyf, dye-filling defective; N ≥ 100. Arrows indicate the ciliary base. Arrowheads indicate the junctions between the middle and distal segments. Scale bar, 5 μm. (B) Quantification of cilium length in WT and osm-3 mutant animals. N = 37–39 animals. Statistical significance, compared with the control with a matching color code, is based on Student’s t test. **P < 0.01; ***P < 0.001. Data are mean ± SD. (C) Histogram of anterograde IFT speeds of WT and mutant OSM-3 kinesins at the middle (top) and distal (bottom) ciliary segments. Velocities and numbers of IFT particles (N) are indicated. The plots were fit by a Gaussian distribution. Statistical significance, compared with the control with a matching color code, is based on Student’s t test. Data are mean ± SD. (D) Amphid and phasmid cilia of osm-3S96D;nekl-3 cko double-mutant animals. Cilia are visualized with GFP-tagged endogenous mutant OSM-3. Scale bar, 5 μm. (E) Representative amphid and phasmid cilia images of osm-3S96A animals ectopically expressing NEKL-3 fused to PCRG-1. Scale bar, 5 μm. (F) Quantification of phasmid cilium length (mean ± SD) in the animals of indicated genotypes. N = 37–60 animals. Statistical significance, compared with the control with a matching color code, is based on Student’s t test. n.s., not significant.
The phosphomimic mutation S96D inhibits OSM-3 motility in vivo. (A) Amphid and phasmid cilia in the WT, osm-3S96D, and osm-3S96A mutant animals. Cilia are visualized with GFP-tagged endogenous WT OSM-3 (the same as Fig. 2 D) or the corresponding mutant OSM-3. Dyf, dye-filling defective; N ≥ 100. Arrows indicate the ciliary base. Arrowheads indicate the junctions between the middle and distal segments. Scale bar, 5 μm. (B) Quantification of cilium length in WT and osm-3 mutant animals. N = 37–39 animals. Statistical significance, compared with the control with a matching color code, is based on Student’s t test. **P < 0.01; ***P < 0.001. Data are mean ± SD. (C) Histogram of anterograde IFT speeds of WT and mutant OSM-3 kinesins at the middle (top) and distal (bottom) ciliary segments. Velocities and numbers of IFT particles (N) are indicated. The plots were fit by a Gaussian distribution. Statistical significance, compared with the control with a matching color code, is based on Student’s t test. Data are mean ± SD. (D) Amphid and phasmid cilia of osm-3S96D;nekl-3 cko double-mutant animals. Cilia are visualized with GFP-tagged endogenous mutant OSM-3. Scale bar, 5 μm. (E) Representative amphid and phasmid cilia images of osm-3S96A animals ectopically expressing NEKL-3 fused to PCRG-1. Scale bar, 5 μm. (F) Quantification of phasmid cilium length (mean ± SD) in the animals of indicated genotypes. N = 37–60 animals. Statistical significance, compared with the control with a matching color code, is based on Student’s t test. n.s., not significant.

Effects on ciliogenesis of phosphodead OSM-3 mutants. (A) Amphid and phasmid cilia of osm-3S96C mutant animals. Cilia are visualized with GFP-tagged endogenous mutant OSM-3. Arrows indicate the ciliary base. Arrowheads indicate the junctions between the middle and distal segments. Scale bar, 5 μm. (B) Quantification of cilium length (mean ± SD) in WT and phosphodead osm-3 mutant animals. N = 39–46 animals. Statistical significance, compared with the control with a matching color code, is based on Student’s t test. **P < 0.01; ***P < 0.001. (C) Histogram of anterograde IFT velocities of OSM-3S96C kinesins at the middle (top) and distal (bottom) ciliary segments. Velocities and numbers of IFT particles (N) are indicated. The plots were fit by a Gaussian distribution. Statistical significance, compared with OSM-3S96A with a matching color code, is based on Student’s t test. n.s., not significant. Data are mean ± SD. (D) IFT velocity summaries of OSM-3::GFP in animals of indicated genotypes. Comparisons were performed to osm-3S96D and osm-3S96A, respectively. n.s., not significant; *P < 0.05 by Student’s t tests. m.s.: middle segment; d.s.: distal segment. (E) Ciliary defects in the let-92 mutant animals were rescued with WT LET-92 expressed under the control of ciliated neuron-specific promoter Pdyf-1. Scale bar, 5 μm. (F) Histogram of OSM-3::GFP velocities in animals of indicated genotypes. (Top) anterograde IFT along the middle segments (Antero. m.s.). (Middle) anterograde IFT along the distal segments (Antero. d.s.). (Bottom) retrograde IFT (Retro.). Each plot was fitted by a Gaussian distribution. Comparisons were performed between WT and other strains. n.s., not significant; ***P < 0.001 by unpaired Student’s t tests. m.s.: middle segment; d.s.: distal segment.

Effects on ciliogenesis of phosphodead OSM-3 mutants. (A) Amphid and phasmid cilia of osm-3S96C mutant animals. Cilia are visualized with GFP-tagged endogenous mutant OSM-3. Arrows indicate the ciliary base. Arrowheads indicate the junctions between the middle and distal segments. Scale bar, 5 μm. (B) Quantification of cilium length (mean ± SD) in WT and phosphodead osm-3 mutant animals. N = 39–46 animals. Statistical significance, compared with the control with a matching color code, is based on Student’s t test. **P < 0.01; ***P < 0.001. (C) Histogram of anterograde IFT velocities of OSM-3S96C kinesins at the middle (top) and distal (bottom) ciliary segments. Velocities and numbers of IFT particles (N) are indicated. The plots were fit by a Gaussian distribution. Statistical significance, compared with OSM-3S96A with a matching color code, is based on Student’s t test. n.s., not significant. Data are mean ± SD. (D) IFT velocity summaries of OSM-3::GFP in animals of indicated genotypes. Comparisons were performed to osm-3S96D and osm-3S96A, respectively. n.s., not significant; *P < 0.05 by Student’s t tests. m.s.: middle segment; d.s.: distal segment. (E) Ciliary defects in the let-92 mutant animals were rescued with WT LET-92 expressed under the control of ciliated neuron-specific promoter Pdyf-1. Scale bar, 5 μm. (F) Histogram of OSM-3::GFP velocities in animals of indicated genotypes. (Top) anterograde IFT along the middle segments (Antero. m.s.). (Middle) anterograde IFT along the distal segments (Antero. d.s.). (Bottom) retrograde IFT (Retro.). Each plot was fitted by a Gaussian distribution. Comparisons were performed between WT and other strains. n.s., not significant; ***P < 0.001 by unpaired Student’s t tests. m.s.: middle segment; d.s.: distal segment.
The PP2A phosphatase promotes OSM-3 motility in cilia
We investigated the activation mechanism of OSM-3 in ciliary distal segments, focusing on LET-92, the C. elegans homolog of the catalytic subunit of PP2A. Previous flagellar proteomics identified PP2A as a ciliary component (Ishikawa et al., 2012; Liu et al., 2007), and we observed GFP-tagged LET-92 localized in ciliary middle segments, suggesting its role in dephosphorylating and activating OSM-3 (Fig. S6 A). Comparative proteomics studies have also indicated PP2A’s involvement in ciliary length regulation across various species (Liang et al., 2018; Liu et al., 2014). A lethal phenotype arises from germline deletion of let-92, reflecting its essential role in dephosphorylating various substrates. However, we identified a viable missense mutation, P314L, in LET-92, which notably reduced IFT speed in distal segments and slightly in the middle segments. This mutation likely represents a partial loss-of-function variant. Rescuing these ciliary defects by expressing WT LET-92 under a ciliated neuron-specific promoter confirmed LET-92’s cell-autonomous role in IFT regulation. Alternatively, we found that conditional knockout of nekl-3 can also rescue ciliary defects of let-92P314L mutation, indicating LET-92 is functionally related to NEKL-3 in ciliogenesis regulation (Fig. 7, A and B; and Fig. S5, E and F). However, our western blotting did not detect dephosphorylation of OSM-3 by LET-92 alone (Fig. S3 B), suggesting that either regulatory components of the LET-92 holoenzyme are essential for its activity or LET-92 may not directly dephosphorylate OSM-3. Nevertheless, our genetic experiments showed that conditional knockout of nekl-3 rescues defective ciliogenesis in the let-92 mutant, implying that LET-92 acts in opposition to NEKL-3 in vivo. Additionally, overexpression of LET-92 in ciliary transition zones or middle segments increased OSM-3::GFP localization in these regions and elevated IFT speed in the middle segments. Conversely, overexpressing a phosphatase-inactive H127G variant of LET-92 did not impact OSM-3 distribution or IFT, underscoring the necessity of its phosphatase activity for the premature activation of OSM-3 in the ciliary middle segments (Fig. 7, C–E and Fig. S6, B–D). These results illuminate a role of LET-92–dependent dephosphorylation in regulating OSM-3.

Ectopic expression of LET-92 affects OSM-3’s motility. (A) Ciliary localization of mScarlet-tagged LET-92 protein in OSM-3::GFP knock-in animals. Arrows indicate the ciliary base. Arrowheads indicate the junctions between the middle and distal ciliary segments. Scale bars, 5 μm. (B) Schematic of plasmids used to ectopically express fused let-92 at transition zone (mksr-2::let-92) or within cilia (pcrg-1::let-92) under the control of Pdyf-1.(C) Representative fluorescence images of the cilia in the animals ectopically expressing let-92 within cilia. Arrows indicate the ciliary base. Arrowheads indicate the junctions between the middle and distal ciliary segments. Scale bar, 5 μm. (D) Histogram of OSM-3::GFP velocities in animals of indicated genotypes. (Top) anterograde IFT along the middle segments (Antero. m.s.). (Middle) anterograde IFT along the distal segments (Antero. d.s.). (Bottom) retrograde IFT (Retro.). Each plot was fitted by a Gaussian distribution. Comparisons were performed between mksr-2::let-92H127G and other strains. ***P < 0.001 by unpaired Student’s t tests. m.s.: middle segment; d.s.: distal segment.

Ectopic expression of LET-92 affects OSM-3’s motility. (A) Ciliary localization of mScarlet-tagged LET-92 protein in OSM-3::GFP knock-in animals. Arrows indicate the ciliary base. Arrowheads indicate the junctions between the middle and distal ciliary segments. Scale bars, 5 μm. (B) Schematic of plasmids used to ectopically express fused let-92 at transition zone (mksr-2::let-92) or within cilia (pcrg-1::let-92) under the control of Pdyf-1.(C) Representative fluorescence images of the cilia in the animals ectopically expressing let-92 within cilia. Arrows indicate the ciliary base. Arrowheads indicate the junctions between the middle and distal ciliary segments. Scale bar, 5 μm. (D) Histogram of OSM-3::GFP velocities in animals of indicated genotypes. (Top) anterograde IFT along the middle segments (Antero. m.s.). (Middle) anterograde IFT along the distal segments (Antero. d.s.). (Bottom) retrograde IFT (Retro.). Each plot was fitted by a Gaussian distribution. Comparisons were performed between mksr-2::let-92H127G and other strains. ***P < 0.001 by unpaired Student’s t tests. m.s.: middle segment; d.s.: distal segment.

The PP2A phosphatase promotes OSM-3 motility. (A) Ciliary defects in the let-92 mutant animals and cilia rescued with WT LET-92 or conditional knockout of nekl-3. The images of WT animals are the same as Fig. 2 D. Arrowheads indicate the junctions between the middle and distal segments. Scale bar, 5 μm. (B) Quantification of cilium length in animals of indicated genotypes. N = 39–58. Statistical significance, compared with the control with a matching color code, is based on Student’s t test. ***P < 0.001. Data are mean ± SD. (C) Representative fluorescence images of the amphid and phasmid cilia in the animals ectopically expressing let-92 at transition zone. Arrows indicate the ciliary base. Arrowheads indicate the junctions between the middle and distal ciliary segments. Scale bar, 5 μm. (D) Representative fluorescence intensity profiles along the cilium. All fluorescence intensity profiles are normalized to their maximum. N = 17–18 animals. Data are mean ± SD. (E) Statistics of the OSM-3 fluorescence intensity ratio (mean ± SD) between middle segment and distal segment in the indicated animals. Fluorescence ratio = 0.5*([mean gray value of middle segment area] − [background gray value])/([mean gray value of distal segment] − [background gray value]). N ≥ 32 animals. ***P < 0.001 by unpaired Student’s t test with Welch’s correction. (F) A proposed model for the regulation of regional motility of OSM-3 in vivo. t.z., transition zone; m.s., middle segment; d.s., distal segment.
The PP2A phosphatase promotes OSM-3 motility. (A) Ciliary defects in the let-92 mutant animals and cilia rescued with WT LET-92 or conditional knockout of nekl-3. The images of WT animals are the same as Fig. 2 D. Arrowheads indicate the junctions between the middle and distal segments. Scale bar, 5 μm. (B) Quantification of cilium length in animals of indicated genotypes. N = 39–58. Statistical significance, compared with the control with a matching color code, is based on Student’s t test. ***P < 0.001. Data are mean ± SD. (C) Representative fluorescence images of the amphid and phasmid cilia in the animals ectopically expressing let-92 at transition zone. Arrows indicate the ciliary base. Arrowheads indicate the junctions between the middle and distal ciliary segments. Scale bar, 5 μm. (D) Representative fluorescence intensity profiles along the cilium. All fluorescence intensity profiles are normalized to their maximum. N = 17–18 animals. Data are mean ± SD. (E) Statistics of the OSM-3 fluorescence intensity ratio (mean ± SD) between middle segment and distal segment in the indicated animals. Fluorescence ratio = 0.5*([mean gray value of middle segment area] − [background gray value])/([mean gray value of distal segment] − [background gray value]). N ≥ 32 animals. ***P < 0.001 by unpaired Student’s t test with Welch’s correction. (F) A proposed model for the regulation of regional motility of OSM-3 in vivo. t.z., transition zone; m.s., middle segment; d.s., distal segment.
Discussion
This study presents a model that elucidates the mechanism of achieving regional motility of an IFT kinesin within the ciliary middle and distal segment (Fig. 7 F). The localization of OSM-3::GFP in the soma of sensory neurons suggests that the motor protein is synthesized in the soma and subsequently transported along dendrites to reach the dendritic tip where the ciliary base originates. Our previous research has indicated that cytoplasmic dynein-1 is responsible for transporting the centriole along dendritic MT tracks, with their minus ends oriented toward the ciliary base (Li et al., 2017). Similarly, the newly synthesized OSM-3 protein may undergo a folding process, with its tail interacting with the motor head, resulting in an inactive conformation in the soma. It is then transported by dynein-1 during dendritic transport. Upon reaching the ciliary base, a reorganization of IFT particles and many other ciliary precursors (Van den Hoek et al., 2022) may facilitate the release of OSM-3 from its folded conformation to an extended conformation, allowing it to be loaded with IFT particles for entry into the cilia. Simultaneously, NEKL-3, perhaps in conjunction with NEKL-4, phosphorylates OSM-3 at the S96 site, thereby inhibiting its motility. Otherwise, OSM-3 in its open conformation might have the ability to autonomously initiate movement from the ciliary base. After entering the cilia, PP2A within the ciliary middle segment may dephosphorylate OSM-3, releasing its inhibition from the motor domain. This, in turn, permits OSM-3’s motility to replace kinesin-II–based IFT, ultimately contributing to the construction of the ciliary distal segments.
While this model posits that OSM-3 is phosphorylated by NEKL-3 at the ciliary base, we cannot rule out the possibility that NEKL-3 might phosphorylate newly translated OSM-3 in the neuronal soma, considering the localization of NEKL-3 in the cell body. Most studies on kinesin phosphorylation have focused on sites outside the motor domain due to the highly compacted nature of this globular head, making it challenging for kinases to access residues within its structure. This challenge is particularly pronounced for S96, which forms a hydrogen bond with R10, rendering it less accessible for kinase phosphorylation. However, during the translation of the kinesin polypeptide by the ribosome, NEKL-3 kinase may be able to interact with this site and add a phosphate group before OSM-3 undergoes folding. Consequently, even during kinesin’s initial formation, inhibitory phosphorylation and autoinhibition folding may function as two independent layers of regulation to prevent premature motility. At the ciliary base, kinesin must undergo significant conformational changes to enter the cilia, providing an opportunity for kinase phosphorylation within the motor domain. Moreover, our in vitro data suggest that the motor domain or the overall structure of full-length kinesin might possess greater dynamism than previously recognized. For instance, NEKL-3 could directly phosphorylate full-length OSM-3 in vitro. This notion is further supported by the observation that the addition of NEKL-3, but not its inactivated form, into the OSM-3–driven MT-gliding assay impaired gliding, suggesting that NEKL-3–mediated phosphorylation of OSM-3 may occur rapidly, resulting in immediate inhibitory effects.
We suspect that protein phosphorylation and folded conformation may not constitute the sole mechanisms governing the regulation of OSM-3’s regional motility. MT posttranslational modifications have been widely recognized as regulators of motor activity. Previous in vitro studies have revealed that homodimeric kinesin-2 family proteins, such as mammalian KIF17 or C. elegans OSM-3, exhibit a preference for moving along modified MTs (Ikegami et al., 2007; Kaul et al., 2014; Reed et al., 2006). Due to the lack of reliable immunofluorescence techniques for determining the modification status of axonemal MTs in C. elegans sensory cilia, the precise modification status of OSM-3’s track remains unclear. However, genetic findings have provided crucial insights into the involvement of MT modification in OSM-3 motility. In the assembly of ciliary middle segments, kinesin-II is initially sufficient to transport IFT particles while OSM-3, transported as a cargo molecule, remains largely inactive. As the transport progresses, kinesin-II gradually transfers its cargo to OSM-3, which becomes activated to support anterograde transport. This coordinated activation allows OSM-3 to construct the distal axoneme, where it operates as the sole IFT motor (Ou et al., 2005; Prevo et al., 2015; Snow et al., 2004). Interestingly, the deletion of kinesin-II in C. elegans does not impact IFT or cilium formation, despite the accelerated IFT in the middle segments (Snow et al., 2004). In the absence of kinesin-II, it is OSM-3–kinesin that actively moves along the ciliary middle segments, transporting ciliary precursors to the axoneme tip. Therefore, OSM-3–kinesin alone possesses the capability to traverse the ciliary middle segment, suggesting that OSM-3 possesses intrinsic motility that is regulated at the ciliary base. In this context, how NEKL-3 regulates the regional motility of OSM-3 in kinesin-II mutant animals remains unclear. Based on our FLIM-FRET results, we propose that NEKL-3 may not fully phosphorylate all OSM-3 motors in ciliated neurons, potentially leaving a fraction of them unphosphorylated and active, which may be sufficient to drive IFT in kinesin-II deletion mutants. Additionally, competition between NEKL-3 and other phosphatases might maintain a portion of the OSM-3 motor in an active state, enabling IFT transport even in the absence of kinesin-II. These findings refine earlier models of motor coordination (Ou et al., 2005) by demonstrating that OSM-3 and kinesin-II do not merely compete for cargo binding but exhibit a sequential and cooperative activation along the middle segment, consistent with a measured transition described by Prevo et al. (2015). Our data support this nuanced model, highlighting the adaptability of IFT mechanisms in Nematode cilia.
The NEK family kinase and PP2A family phosphatase exhibit evolutionary conservation across species and possess numerous substrates in proteomes. For instance, it is reported that NEKL-3 functionally opposes PP2A in the regulation of molting, like what we report for motor activation in cilia (Binti et al., 2024, Preprint). NEKL-3 also interacts with another kinesin motor protein UNC-116 in neurons to regulate axon termination (Drozd and Quinn, 2023). Notably, the conservation of the S96 site is observed within the kinesin superfamily. These observations lead us to propose that phosphorylation-mediated regulation of regional kinesin motility could represent a widespread mechanism within the motor domain. It is well established that many kinesins are regulated by kinases, with phosphorylation occurring at multiple sites, including the kinesin stalk, tail, light chains, and motor domain. For example, a calcium-dependent kinase phosphorylates the Chlamydomonas kinesin-II motor subunit (homolog of KIF3B) at the S663 site in the tail domain to regulate IFT entry and turnaround (Liang et al., 2014). Phosphorylation of kinesin-1’s light chain by CDK5 or GSK3 kinase also plays a role in motility regulation (Morfini et al., 2004; Weaver et al., 2013). Additionally, the motor domain of the Drosophila kinesin 13, KLP10A, is phosphorylated at a conserved S573 site, which regulates the temporal and spatial dynamics of MT depolymerization (Mennella et al., 2009). Our study adds to this body of work by showing that phosphorylation can occur within the motor domain. Beyond the ciliary base or middle segment, the ciliary tip also emerges as an important site for regulating IFT-kinesin–based motility. For instance, the loss of DYF-5 or DYF-18 kinases results in abnormally elongated cilia in various species (Maurya et al., 2019). Therefore, the regulation of phosphorylation at various sites of the motor protein within distinct subcellular domains may serve as a general mechanism governing regional motility.
Materials and methods
C. elegans strain maintenance
C. elegans strains were cultured on Nematode growth medium (NGM) plates at 20°C, with Escherichia coli strain OP50 seeded on the plates as food. The SYD0199 (OSM-3::GFP) strain is referred to as WT in this study. Strains used in this study are summarized in Tables S3. All animal experiments in this study were performed following governmental and institutional guidelines.
Molecular biology and genetics
For the conditional knockout of nekl-3, the somatic CRISPR-Cas9 expression vectors were constructed by replacing the Peft-3 promoter in pDD162 (#47549; Addgene) with the C. elegans heat-shock promoter Phsp-16.2 or the ciliated neuron-specific Pdyf-1 promoter using an In-Fusion HD cloning kit (Clontech). The CRISPR design tool (https://crispor.gi.ucsc.edu) was used to select sgRNA target sequence. As previously described (Shen et al., 2014), the functionality of the sgRNA sequence was validated by using Phsp-16.2::Cas9 animals and T7EI assays.
For the generation of point mutations S96D and S96C on osm-3, target of CRISPR-Cas9: 5′-GGGCAAGACTTTCTCCATGC (AGG)-3′ was inserted into the pDD162 vector (#47549; Addgene) by PCR linearizing. The resulting PCR products were transformed into E. coli to generate plasmid after DpnI digestion. Single-stranded oligonucleotides were used as homology recombination templates as described before (Zhao et al., 2014). CRISPR/Cas9 constructs and homology recombination templates, together with rol-6[su1006] and Podr-1::dsRed selection markers, were microinjected into the germ line of young adult OSM-3::GFP knock-in hermaphrodites at a concentration of 50 ng/μl. Single worm PCR and Sanger sequencing were used to confirm the mutant strains. Mutant strains were backcrossed three times to remove background mutations.
For the transgenic strains, PCR fusion-based approach was used to generate the overexpression constructs. Detailed primers and plasmids used in this study are listed in Table S1 and Table S2. For mScarlet::OSM-3::GFP and OSM-3::GFP::mScarlet strains, the overexpression constructs together with rol-6[su1006] were microinjected into the germ line of young adult osm-3(p802) hermaphrodites at a concentration of 20 ng/μl. For NEKL-3::mScarlet and LET-92::mScarlet strains, the genomic sequences of nekl-3 or let-92 were inserted into the pDONR vectors that contain the dyf-1 promoter and mScarlet::unc-54 3′ UTR by using In-Fusion Advantage PCR cloning kit (Cat. # 639621; Clontech). Then, the overexpression constructs, together with rol-6[su1006], were microinjected into the germ line of young adult OSM-3::GFP knock-in hermaphrodites at a concentration of 2 ng/μl. Other overexpression constructs used in this study were microinjected at a concentration of 20 ng/μl. Marker-positive F1s were singled and cultured. The F2s inherited the transgenes were identified as the transgenic lines. At least two independent transgenic lines were maintained and used for experiments in this study.
Live-cell imaging
Young adult C. elegans hermaphrodites were mounted on 3% agar pads, anesthetized with 0.1 mmol/liter levamisole in M9 buffer, and maintained at 20°C. As previously described (Chai et al., 2012), our imaging system includes an Axio Observer Z1 microscope (Carl Zeiss) equipped with a 100×, 1.49 NA Apochromat oil immersion objective lens, an electron-multiplying charge-coupled device camera (Andor iXon+ DU-897D-C00-#BV-500), and the 488 and 561-nm lines of a Sapphire CW CDRH USB Laser System (Coherent) with a spinning disk confocal scan head (Yokogawa CSU-X1 Spinning Disk Unit). Images were acquired by μManager (https://www.micro-manager.org) at an exposure time of 200 ms. All the images were taken using identical settings, and we processed and quantified the images with ImageJ software. To perform fluorescence lifetime imaging, FV1200 (Olympus) equipped with PicoHarp 300 (PicoQuant) was used. Images were analyzed by SymPhoTime 64 software. Regions of interest were manually extracted and average lifetimes were calculated by n-exponential reconvolution fit.
Dye-filling assay
Young adult worms were collected with M9 solution from NGM plates. Subsequently, dyes (DiI, 1,1′-dioctadecyl-3,3,3′,3′,-tetramethylindo-carbocyanine perchlorate; Sigma-Aldrich) were added at a final concentration of 20 μg/ml. After incubation in the dark for 45 min at room temperature, worms were transferred to NGM plates seeded with OP50. The dye-filling ratios were examined 2 h later via fluorescence stereoscope.
Protein preparation
cDNA of OSM-3WT tagged with EGFP was cloned into pET.M.3C plasmid for prokaryotic expression. Point mutations were generated on the OSM-3WT construct by PCR linearizing. We followed the published methods to express and purify all OSM-3 proteins (Case et al., 1997; Imanishi et al., 2006). MBP-tagged NEKL-3WT was cloned into pPMH plasmid for prokaryotic expression. Denatured NEKL-3WT was acquired by 95°C heating for 15 min. Protein concentration was determined by BCA assay.
In vitro kinase assay and mass spectrometry analysis
We used previously established methods to carry out in vitro kinase assay (Case et al., 1997; Imanishi et al., 2006). OSM-3 proteins treated by NEKL-3 were separated by SDS-PAGE with Coomassie brilliant blue staining. For western blotting, PVDF membranes were incubated with mouse anti-phosphoserine/phosphothreonine antibodies (Cat. #612548; BD Biosciences) or mouse anti-GFP antibodies (Cat. #BE2003; EASYBIO) as first antibodies, and goat anti-mouse IgG+IgM (H+L)-HRP–conjugated antibodies (Cat. #BE0141; EASYBIO) as secondary antibodies.
To identify putative phosphorylation sites of OSM-3, the target bands were excised from the gel and reduced, alkylated, and digested with trypsin overnight. An UltiMate 3000 RSLCnano System (Thermo Fisher Scientific) directly interfaced with an Orbitrap Fusion Lumos mass spectrometer (Thermo Fisher Scientific) was used to analyze the resulting tryptic peptides. We used an in-house proteome discovery searching algorithm to search the MS/MS data against the selected database. The phosphorylation sites on OSM-3 were identified by the PhosphoRS algorithm and validated manually.
In vitro single-molecule, MT-gliding, and MT-stimulated ATPase assays
The assays were performed as described previously (Case et al., 1997; Imanishi et al., 2006; Mohamed et al., 2018). Briefly, MTs were attached on a coverslip by antibodies and appropriate concentration of purified motors were added into the flow cell with assay buffer (BRB80, 1 mM ATP/Mg2+, 1% β-mercaptoethanol, 0.08 mg/ml glucose oxidase, 0.032 mg/ml catalase, and 80 mM glucose). To track single-molecule movement of EGFP-fused motors, Olympus IX83 microscopy equipped with a 150× (numerical aperture 1.45 oil; Olympus) objective lens and an ORCA-Flash4.0 V3 camera were used for visualization. The system was controlled by Micro-Manager 2.0, and images were acquired at an exposure time of 100 ms. For MT-gliding assays, motors were attached to the surface of a coverslip via pre-coated GFP antibodies, and gliding of rhodamine-labeled MTs were recorded by total internal reflection fluorescence microscopy. For MT-stimulated ATPase activity assays, a commercial kit (HTS Kinesin ATPase Endpoint Assay Biochem Kit; Cytoskeleton Inc.) was used by following the manufacturer’s instructions. The kinesin-1 heavy chain supplied in the kit was used as the control. The MT-stimulated ATPase activities were derived from three independent assays, and the average activity of kinesin-1 heavy chain was set to 100%.
Quantifications and statistical analysis
We used ImageJ software (http://rsbweb.nih.gov/ij/) to perform measurements and quantifications. For cilium length, the indicated numbers of phasmid cilia were randomly measured. For the fluorescence distribution of OSM-3::GFP, the “Plot Profile” tool of ImageJ was used to perform measurement without discrimination. For IFT velocity, the indicated numbers of IFT particles in phasmid cilia were randomly selected for the measurement. Single-molecule and gliding data were measured using ImageJ software as well, and all the events measured were selected randomly. After measurements and quantifications, all of the data were analyzed by using the GraphPad prism8 program. The statistical differences were determined by two-tailed Student’s t test analysis, as indicated in the figure legends. Frequency distribution of IFT velocity and GFP lifetime was analyzed and fitted with a Gaussian distribution curve. For parametric tests, data distribution was assumed to be normal, but this was not formally tested.
Online supplemental material
Fig. S1 shows the GFP fluorescence lifetime at different ciliary regions. Fig. S2 shows the expression of NEK family kinases and PP2A in ciliated neurons. Fig. S3 shows that the NEKL-3 phosphorylates OSM-3 in vitro. Fig. S4 shows that the NEKL-3 affects single-molecule motility of OSM-3. Fig. S5 shows the effects of phosphodead mutations of OSM-3 on ciliogenesis. Fig. S6 shows the ectopic expression of LET-92 affects distribution of OSM-3. Table S1 shows the targets of CRISPR and primers for molecular analysis. Table S2 shows the primers and plasmids used in this study. Table S3 shows the C. elegans used in this study. Video 1 shows the MT-gliding assays of OSM-3WT. Video 2 shows the MT-gliding assays of OSM-3WT with dNEKL-3. Video 3 shows the MT-gliding assays of OSM-3WT with NEKL-3. Video 4 shows the MT-gliding assays of OSM-3WT mixed with 10% OSM-3S96D. Video 5 shows the MT-gliding assays of OSM-3WT mixed with 25% OSM-3S96D. Data S1 shows the phasmid cilium length of transgenic animals in this study. Data S2 shows the fluorescence distribution of OSM-3 in different transgenic animals. Data S3 shows the IFT velocities of OSM-3 in different transgenic animals. Data S4 shows the velocities and run lengths of single-molecule assays of OSM-3.
Data availability
The data supporting the findings of this study are either available in this article and its supplementary files or from the corresponding author upon request.
Acknowledgments
This work was supported by the National Key RD Program of China (2022YFA1302700 and 2024YFA1307301) and the National Natural Science Foundation of China (grants 92254306, 32430026, 31991191, 32021002, 32270721, 32470730, 32270773, and 32070706).
Author contributions: P. Huang: conceptualization, investigation, and writing—original draft, review, and editing. G. Chen: data curation and resources. Z. Zhu: resources. S. Wang: methodology and resources. Z. Chen: data curation. Y. Chai: writing—review and editing. W. Li: conceptualization, funding acquisition, investigation, methodology, and resources. G. Ou: conceptualization, investigation, methodology, visualization, and writing—original draft, review, and editing.