


Upon invasion into the host cell, a subset of bacterial pathogens resides exclusively in the cytosol. While previous research revealed how they reshape the plasma membrane during invasion, subvert the immune response, and hijack cytoskeletal dynamics to promote their motility, it was unclear if these pathogens also interacted with the organelles in this crowded intracellular space. Here, we examined if the obligate intracellular pathogen Rickettsia parkeri interacts with the endoplasmic reticulum (ER), a large and dynamic organelle spread throughout the cell. Using live-cell microscopy and transmission and focused-ion-beam scanning electron microscopy, we show that R. parkeri forms extensive contacts with the rough ER that are ∼55 nm apart and cover more than half the bacterial surface. Depletion of the ER-specific tethers VAPA and VAPB reduced rickettsia–ER contacts, and VAPA and VAPB were localized around intracellular rickettsiae. Overall, our findings illuminate an interkingdom ER contact uniquely mediated by rickettsiae that mimics some characteristics of traditional host membrane contact sites.
Introduction
Several human pathogens live freely inside the host cytosol, including the tick-borne bacterium Rickettsia parkeri, which causes a mild spotted fever disease in humans (Walker and Ismail, 2008; Sit and Lamason, 2024). Similar to other intracellular bacteria like Listeria monocytogenes and Shigella flexneri, R. parkeri invades host cells, escapes to the cytosol, hijacks the actin cytoskeleton to move intracellularly, and then disseminates through our tissues using a process known as cell-to-cell spread (Lamason and Welch, 2017; Raab et al., 2024). Unlike L. monocytogenes and S. flexneri, though, Rickettsia species are obligate intracellular pathogens entirely dependent on their host cell for survival. Consequently, this dependency has led to unique adaptations, including unexpected mimicry of host cell biology (Lamason and Welch, 2017; McGinn and Lamason, 2021).
In uninfected settings, eukaryotic organelles do not exist in isolation and can interact through various forms of dynamic or stable interactions. Indeed, the largest organelle, the endoplasmic reticulum (ER), acts as a major cellular scaffold bridging multiple organelles to itself through interorganelle contacts (Prinz et al., 2020; Wu et al., 2018). Contact sites with the smooth ER span 10–30 nm, while interactions with the rough ER can reach up to 80-nm wide (Giacomello and Pellegrini, 2016; Scorrano et al., 2019). Their cellular functions are diverse, impacting lipid metabolism and transport, organelle dynamics and function, calcium transfer, autophagy, and apoptosis (Phillips and Voeltz, 2016). Many contacts also rely on a cadre of protein tethers. The most well-characterized of which are the vesicle-associated membrane protein-associated protein-A and -B (VAPA and VAPB) (Costello et al., 2017; Alpy et al., 2013; De Vos et al., 2012; Lehto et al., 2005; Rocha et al., 2009; Wyles et al., 2002), and recent evidence suggests these are vulnerable to intracellular pathogen manipulation. For example, infection with β-herpesvirus human cytomegalovirus increases VAPA and VAPB expression to impact the dynamics of ER-mediated membrane contact sites (MCS) with other organelles (Cook et al., 2022). In contrast, the pathogenic bacterium Chlamydia trachomatis hijacks VAPA and VAPB to connect its host-derived vacuolar compartment to the ER (Derré et al., 2011; Stanhope et al., 2017). These examples demonstrate the diversity of mechanisms pathogens have evolved to subvert these eukaryotic membrane interfaces, suggesting a critical role for MCS in host–pathogen interactions. However, it is unclear if cytosolic bacterial pathogens like R. parkeri can similarly interact with eukaryotic organelles.
Here, we used a combination of imaging modalities to investigate if R. parkeri interacted with the ER. We discovered that a subset of R. parkeri makes stable, close contacts with the rough ER (RER), but L. monocytogenes or S. flexneri never formed these same structures. The frequency of these RER contacts also dramatically increased for a mutant R. parkeri strain that cannot undergo actin-based motility. Interactions with the RER and rickettsiae were extensive and typically enveloped more than half of the surface of R. parkeri. We further provide evidence that VAPA and VAPB are recruited to R. parkeri and are required for the bacteria–ER contacts, suggesting that an unknown VAP target mediates this novel interkingdom contact between the RER and rickettsiae.
Results and discussion
R. parkeri forms stable interactions with the ER
To identify putative interactions between the ER and R. parkeri, we infected A549 cells stably expressing a fluorescent ER marker (mCherry-Sec61β) (Zurek et al., 2011) with TagBFP-expressing R. parkeri (RpBFP). Using live-cell imaging, we found that 3–4% of RpBFP colocalized with the ER at 28 and 48 h post-infection (hpi), and these interactions were subdivided into two distinctive patterns: vacuole-like and protrusive ER structures (Fig. 1, A–C). Protrusive ER structures were found extending into the nucleus or through the cytoplasm (Fig. 1 B). Vacuole-like ER structures around bacteria were only found in the cytoplasm (Fig. 1 B). These colocalization patterns were independent of the fluorescent ER marker used, as we obtained similar results with another ER marker (BiP-mNeonGreen-KDEL) (Fig. S1 A) (Friedman et al., 2011). The interactions also appeared to be specific to R. parkeri because no interactions were seen with the ER during infection with L. monocytogenes or S. flexneri (Fig. S1, B and C).

R. parkeri interacts with the ER. (A) Percentage of bacteria interacting with the ER structures in B. The mean ± SEM of three independent experiments (large outlined circles) is superimposed over the raw data (small unlined circles) representing the percentage per FOV (>2,000 bacteria counted per independent experiment, data are colored by experiment). (B) Live-cell imaging snapshots at 28 hpi of WT R. parkeri (magenta, RpBFP) in vacuole-like (arrowhead) or protrusive (arrow) ER structures (cyan, mCherry-Sec61β). Scale bar, 5 µm; inset, 2.5 µm. (C) Relative frequency of bacteria interacting with the ER in B that are forming protrusive or vacuole-like structures at 28 or 48 hpi. Error bars indicate SEM from three independent experiments (>80 bacteria counted per independent experiment). (D) Relative frequency of bacteria interacting with the ER that display an actin tail at 48 hpi (as in E). Data presented are mean ± SD. Approximately 10 FOVs were imaged per strain for each replicate (n = 2) and >100 bacteria interacting with the ER were quantified. (E) From part D, live-cell imaging snapshots at 48 hpi of SIR-actin (yellow, open arrowhead) and RpBFP (magenta) in vacuole-like (arrowhead) or protrusive (arrow) ER structures (cyan, BiP-mNeonGreen-KDEL). Scale bar, 5 µm. (F and G) Live-cell imaging snapshots of vacuole-like rickettsia–ER structures (arrowhead) over time. Scale bar, 2.5 µm. Seconds, s; minutes, min.
R. parkeri interacts with the ER. (A) Percentage of bacteria interacting with the ER structures in B. The mean ± SEM of three independent experiments (large outlined circles) is superimposed over the raw data (small unlined circles) representing the percentage per FOV (>2,000 bacteria counted per independent experiment, data are colored by experiment). (B) Live-cell imaging snapshots at 28 hpi of WT R. parkeri (magenta, RpBFP) in vacuole-like (arrowhead) or protrusive (arrow) ER structures (cyan, mCherry-Sec61β). Scale bar, 5 µm; inset, 2.5 µm. (C) Relative frequency of bacteria interacting with the ER in B that are forming protrusive or vacuole-like structures at 28 or 48 hpi. Error bars indicate SEM from three independent experiments (>80 bacteria counted per independent experiment). (D) Relative frequency of bacteria interacting with the ER that display an actin tail at 48 hpi (as in E). Data presented are mean ± SD. Approximately 10 FOVs were imaged per strain for each replicate (n = 2) and >100 bacteria interacting with the ER were quantified. (E) From part D, live-cell imaging snapshots at 48 hpi of SIR-actin (yellow, open arrowhead) and RpBFP (magenta) in vacuole-like (arrowhead) or protrusive (arrow) ER structures (cyan, BiP-mNeonGreen-KDEL). Scale bar, 5 µm. (F and G) Live-cell imaging snapshots of vacuole-like rickettsia–ER structures (arrowhead) over time. Scale bar, 2.5 µm. Seconds, s; minutes, min.

Vacuole-like ER interactions are a unique adaptation by R. parkeri. (A) Live-cell imaging snapshots of A549 cells expressing an ER marker (BiP-mNeonGreen-KDEL, cyan) infected with R. parkeri expressing BFP (magenta) at 28 hpi. The arrowhead in the inset points to R. parkeri in vacuole-like ER structure. Arrows in the inset point to R. parkeri in protrusive structures. Scale bars, 5 µm. (B) Live-cell imaging snapshots at 4 hpi of A549-mCh-Sec61β cells (cyan) infected with DasherGFP-expressing WT or GFP-expressing ΔactA mutant strains of L. monocytogenes (magenta). Scale bar, 5 µm; inset, 1 µm. (C) Live-cell imaging snapshots at 2 hpi of A549-mCh-Sec61β cells (cyan) infected with GFP-expressing WT or icsA::Ω mutant strains of S. flexneri (magenta). Scale bar, 5 µm; inset, 1 µm. Data are representative of three independent experiments.

Vacuole-like ER interactions are a unique adaptation by R. parkeri. (A) Live-cell imaging snapshots of A549 cells expressing an ER marker (BiP-mNeonGreen-KDEL, cyan) infected with R. parkeri expressing BFP (magenta) at 28 hpi. The arrowhead in the inset points to R. parkeri in vacuole-like ER structure. Arrows in the inset point to R. parkeri in protrusive structures. Scale bars, 5 µm. (B) Live-cell imaging snapshots at 4 hpi of A549-mCh-Sec61β cells (cyan) infected with DasherGFP-expressing WT or GFP-expressing ΔactA mutant strains of L. monocytogenes (magenta). Scale bar, 5 µm; inset, 1 µm. (C) Live-cell imaging snapshots at 2 hpi of A549-mCh-Sec61β cells (cyan) infected with GFP-expressing WT or icsA::Ω mutant strains of S. flexneri (magenta). Scale bar, 5 µm; inset, 1 µm. Data are representative of three independent experiments.
A subpopulation of R. parkeri polymerizes an actin tail (Haglund et al., 2010; Reed et al., 2014), and ER protrusions may form from motile R. parkeri running into the ER. To investigate this hypothesis, we labeled A549-BiP-mNeonGreen-KDEL cells with the filamentous actin (F-actin) probe SIR-actin (Lukinavičius et al., 2014) and found that most protrusive structures are associated with actin, whereas none of the vacuole-like ER structures had actin tails (Fig. 1, D and E). These results suggest that ER protrusive structures are formed by actin-propelled bacteria interacting with the ER.
We next investigated the vacuole-like ER structures, which appeared more stably associated with bacteria than the protrusive structures (Fig. 1 B). In uninfected settings, ER interactions with other organelles are either short-lived, lasting several seconds (Friedman et al., 2011; Guo et al., 2018; Rowland et al., 2014), or more stable, lasting several minutes (Lee et al., 2020; Valm et al., 2017). Using live-cell imaging, we quantified the duration of the vacuole-like ER interactions around bacteria over a 3-min period and observed over 90% of the vacuole-like ER structures persisted for >2 min, despite the highly dynamic nature of the ER (Fig. 1 F and Video 1). More significant stability was also observed, with a fraction of these structures persisting over our extended, hour-long imaging sessions (Fig. 1 G). Occasionally, we also observed these interactions spontaneously form around a bacterium in the cytoplasm (Video 2). These data demonstrate that non-motile R. parkeri form stable interactions with the ER.
R. parkeri forms stable interactions with the ER A549-mCh-Sec61β cells (cyan) infected with RpBFP (magenta) for 28 h show stable vacuole-like ER structures around the bacterium (arrow) (see alsoFig. 1 F ). A single z slice is shown, and frames were captured every 20 s. Timestamp shows seconds (s). Scale bar, 2.5 µm. Playback speed is 1×.
R. parkeri forms stable interactions with the ER A549-mCh-Sec61β cells (cyan) infected with RpBFP (magenta) for 28 h show stable vacuole-like ER structures around the bacterium (arrow) (see alsoFig. 1 F ). A single z slice is shown, and frames were captured every 20 s. Timestamp shows seconds (s). Scale bar, 2.5 µm. Playback speed is 1×.
Formation of a vacuole-like ER interaction around R. parkeri A549-BiP-mNeonGreen-KDEL cells (cyan) infected with RpBFP (magenta) for 28 h showing the formation of a vacuole-like ER structure around a bacterium (arrow). A single z slice is shown, and frames were captured every 20 s. Timestamp shows seconds (s). Scale bar, 2.5 µm. Playback speed is 1×.
Formation of a vacuole-like ER interaction around R. parkeri A549-BiP-mNeonGreen-KDEL cells (cyan) infected with RpBFP (magenta) for 28 h showing the formation of a vacuole-like ER structure around a bacterium (arrow). A single z slice is shown, and frames were captured every 20 s. Timestamp shows seconds (s). Scale bar, 2.5 µm. Playback speed is 1×.
Immobile bacteria display increased interactions with the ER
The stability and lack of actin tails associated with the vacuole-like ER structures prompted us to speculate that an R. parkeri mutant that cannot hijack the actin cytoskeleton would form more vacuole-like ER structures relative to WT R. parkeri. To test this, we used a mutant with a transposon insertion in sca2, a rickettsial gene that encodes a human formin mimic protein required for bacterial actin-based motility (Kleba et al., 2010; Reed et al., 2014; Haglund et al., 2010), and compared it to WT (RpBFP) using live-cell imaging. We observed that the frequency of sca2::Tn mutant bacteria interacting with the ER was nearly 25-fold higher than WT (Fig. 2 A). Additionally, the sca2::Tn mutant completely lacked any protrusive structures (Fig. 2 B), supporting our earlier conclusion that ER protrusions result from actin-propelled R. parkeri. Finally, these interactions were not observed with mutants of L. monocytogenes (ΔactA) and S. flexneri (icsA::Ω) also impaired in actin-based motility (Bernardini et al., 1989; Domann et al., 1992; Kocks et al., 1992; Makino et al., 1986) (Fig. S1, B and C). Together, these data show that a lack of actin-based motility increases the incidence of the unique interactions between rickettsiae and the ER.

The sca2::Tn mutant displays increased interactions with the ER. (A) Percentage of RpBFP or sca2::Tn mutant bacteria forming vacuole-like ER structures at 48 hpi. RpBFP data are independent of that shown in Fig. 1. Each dot represents the mean percentage of bacteria interacting with the ER for three independent experiments (>4,000 bacteria per independent experiment). Error bars represent SEM (unpaired two-tailed t test). (B) Relative frequency of RpBFP or sca2::Tn mutant bacteria forming protrusive or vacuole-like ER structures at 48 hpi. Error bars indicate SEM from three independent experiments (>100 bacteria counted per independent experiment). (C) Live-cell imaging snapshots at 48 hpi of sca2::Tn mutant bacteria (magenta) infecting A549-mCherry-Sec61β cells (cyan). Scale bar, 5 µm; inset, 1 µm. (D) Live-cell imaging snapshots as in C showing cells with (present) or without (absent) vacuole-like ER structures at 48 hpi. Scale bar, 5 µm; inset, 1 µm. (E) Number of bacteria in cells at 48 hpi with vacuole-like ER structures present or absent (images in D). The mean ± SEM of three independent experiments (large outlined circles) are superimposed over the raw data from individual cells (small unlined circles) (>10 cells counted per independent experiment, data are colored by experiment).
The sca2::Tn mutant displays increased interactions with the ER. (A) Percentage of RpBFP or sca2::Tn mutant bacteria forming vacuole-like ER structures at 48 hpi. RpBFP data are independent of that shown in Fig. 1. Each dot represents the mean percentage of bacteria interacting with the ER for three independent experiments (>4,000 bacteria per independent experiment). Error bars represent SEM (unpaired two-tailed t test). (B) Relative frequency of RpBFP or sca2::Tn mutant bacteria forming protrusive or vacuole-like ER structures at 48 hpi. Error bars indicate SEM from three independent experiments (>100 bacteria counted per independent experiment). (C) Live-cell imaging snapshots at 48 hpi of sca2::Tn mutant bacteria (magenta) infecting A549-mCherry-Sec61β cells (cyan). Scale bar, 5 µm; inset, 1 µm. (D) Live-cell imaging snapshots as in C showing cells with (present) or without (absent) vacuole-like ER structures at 48 hpi. Scale bar, 5 µm; inset, 1 µm. (E) Number of bacteria in cells at 48 hpi with vacuole-like ER structures present or absent (images in D). The mean ± SEM of three independent experiments (large outlined circles) are superimposed over the raw data from individual cells (small unlined circles) (>10 cells counted per independent experiment, data are colored by experiment).
The interactions between the ER and sca2::Tn mutant bacteria were also extremely stable, with >90% of the bacteria stably associated with the ER for the entire hour of imaging (Fig. 2 C and Video 3). We also observed that 39 ± 8.1% (SEM; n >50 cells from three independent experiments) of host cells displayed nearly uniform interactions between the sca2::Tn mutant and the ER, while other host cells were devoid of these interactions (Fig. 2 D). The bimodal nature of these interactions was not correlated with differences in intracellular bacterial burdens because cells that had these rickettsia–ER structures had similar bacterial loads to cells that lacked these structures (Fig. 2 E). Additionally, we could often see bacteria with septa wrapped by the ER, showcasing they are capable of replicating. Next, we considered if these structures were associated with autophagy. The sca2::Tn mutant was previously shown not to localize with ubiquitin (Engström et al., 2019), and we did not observe colocalization with p62 at timepoints showing rickettsia–ER structures (Fig. S2, A and B). The frequency of interactions between sca2::Tn mutant bacteria and the ER also remained unchanged in HeLa cells lacking the key autophagy protein ATG5 (Nezich et al., 2015) (Fig. S2C, D). Moreover, an ompB::Tn mutant targeted by autophagy (Engström et al., 2019; Lamason et al., 2018) forms rickettsia–ER structures at similar frequencies to WT rickettsiae (Fig. S2, E and F). These observations suggest that rickettsia–ER structures do not grossly impact bacterial replication and are distinct from rickettsial interactions with autophagosomal membranes. Consequently, the sca2::Tn mutant strain emerged as a valuable model for further dissection of the rickettsia–ER interactions.
The sca2::Tn mutant forms long-lived interactions with the ER A549-mCh-Sec61β cells (cyan) infected with the sca2::Tn mutant (magenta) for 24 h show very stable vacuole-like ER structures around the bacterium. A single z slice is shown, and frames were captured every 5 min. Timestamp shows minutes (min). Scale bar, 2.5 µm. Playback speed is 1×.
The sca2::Tn mutant forms long-lived interactions with the ER A549-mCh-Sec61β cells (cyan) infected with the sca2::Tn mutant (magenta) for 24 h show very stable vacuole-like ER structures around the bacterium. A single z slice is shown, and frames were captured every 5 min. Timestamp shows minutes (min). Scale bar, 2.5 µm. Playback speed is 1×.
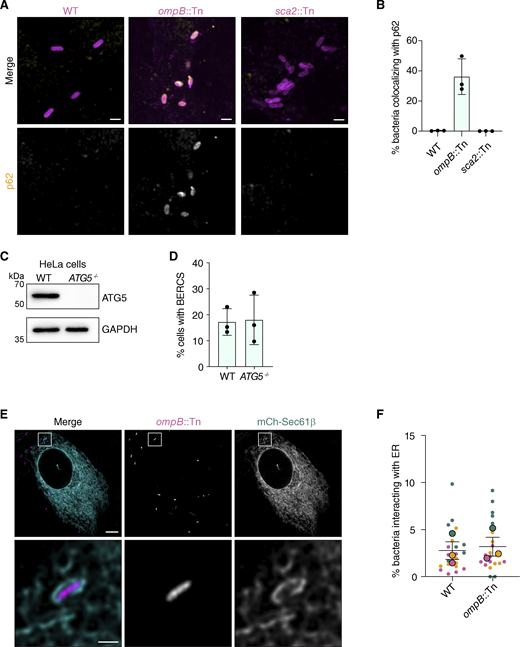
The vacuole-like structures are not associated with the autophagic clearance of R. parkeri. (A) Immunofluorescence microscopy of infected A549 cells at 24 hpi showing endogenous p62 localization and indicated bacterial strains. Scale bar, 1 µm. (B) Percentage of indicated bacteria in A showing p62 localization. Data are mean ± SD of three independent experiments (≥4 FOV with ≥200 bacteria quantified per condition per independent experiment). (C) Western blot analysis of ATG5 expression in HeLa cell lysates from D. GAPDH, loading control. (D) Percentage of WT or ATG5−/− HeLa cells displaying BERCs with sca2::Tn mutant bacteria (48 hpi). The mean ± SEM of three independent experiments (large outlined circles) are superimposed over the raw data the percent of cells with BERCs per FOV (small unlined circles) (>75 cells quantified per condition per independent experiment) (one-way ANOVA with Dunnett’s post hoc test). (E) Live-cell imaging snapshots at 28 hpi of ompB::Tn mutant (magenta) infecting A549-mCherry-Sec61β cells (cyan). Scale bar, 5 µm; inset scale bar, 1 µm. (F) Percentage of RpBFP or ompB::Tn mutant bacteria forming vacuole-like ER structures. RpBFP data are independent from that shown in Figs. 1 and 2. Each dot represents the mean percentage of bacteria interacting with the ER for three independent experiments (>500 bacteria per independent experiment). Error bars represent SEM. Source data are available for this figure: SourceData FS2.

The vacuole-like structures are not associated with the autophagic clearance of R. parkeri. (A) Immunofluorescence microscopy of infected A549 cells at 24 hpi showing endogenous p62 localization and indicated bacterial strains. Scale bar, 1 µm. (B) Percentage of indicated bacteria in A showing p62 localization. Data are mean ± SD of three independent experiments (≥4 FOV with ≥200 bacteria quantified per condition per independent experiment). (C) Western blot analysis of ATG5 expression in HeLa cell lysates from D. GAPDH, loading control. (D) Percentage of WT or ATG5−/− HeLa cells displaying BERCs with sca2::Tn mutant bacteria (48 hpi). The mean ± SEM of three independent experiments (large outlined circles) are superimposed over the raw data the percent of cells with BERCs per FOV (small unlined circles) (>75 cells quantified per condition per independent experiment) (one-way ANOVA with Dunnett’s post hoc test). (E) Live-cell imaging snapshots at 28 hpi of ompB::Tn mutant (magenta) infecting A549-mCherry-Sec61β cells (cyan). Scale bar, 5 µm; inset scale bar, 1 µm. (F) Percentage of RpBFP or ompB::Tn mutant bacteria forming vacuole-like ER structures. RpBFP data are independent from that shown in Figs. 1 and 2. Each dot represents the mean percentage of bacteria interacting with the ER for three independent experiments (>500 bacteria per independent experiment). Error bars represent SEM. Source data are available for this figure: SourceData FS2.
R. parkeri is partially wrapped by the rough ER in different cell types
Stable interactions with the ER could occur by rickettsiae gaining access to the ER lumen or from cytosolic bacteria being wrapped by the ER network. To differentiate between these possibilities, we used transmission electron microscopy (TEM) to resolve the rickettsia–ER interactions in A549 cells infected with the sca2::Tn mutant. We did not detect rickettsiae inside the lumen of single-membrane structures. Instead, bacteria were partially wrapped by double membranes that contained ribosomes, indicating that the RER network specifically wrapped around cytosolic bacteria (Fig. 3 A). We additionally observed similar RER-specific structures in infected human microvascular endothelial cells (HMEC-1) (Fig. 3 B), a physiologically relevant target of Rickettsia species (Bradford et al., 1979; Kim et al., 2004; Roggli et al., 1985). Thus, the rickettsia–RER interaction is conserved in distinct cell types.

R. parkeri is partially wrapped by the rough ER in different cell types. (A and B) TEM images at 30 hpi of A549 (A) and HMEC-1 (B) cells infected with sca2::Tn mutant bacteria. R, rickettsia (arrowhead), RER-wrapped bacterium (arrow), mitochondria–RER interaction. Insets—bacteria (magenta) and ER (cyan). Scale bar, 1 µm; inset, 500 nm. (C) 2D morphometric analysis examples are used to quantify the average bacterial perimeter covered by the RER (left) or the average distance between RER and bacterial membranes (right) (from cells in A). ER, cyan; yellow lines represent traces measured. (D and E) Percentage of the bacterial or mitochondrial perimeter covered by the RER and the average distance between the membranes. Each dot represents an individual bacterium or mitochondrion (>10 counted). Each dot represents an individual bacterium or mitochondrion. Data shown are mean ± SD from an independent replicate (unpaired two-tailed t test).
R. parkeri is partially wrapped by the rough ER in different cell types. (A and B) TEM images at 30 hpi of A549 (A) and HMEC-1 (B) cells infected with sca2::Tn mutant bacteria. R, rickettsia (arrowhead), RER-wrapped bacterium (arrow), mitochondria–RER interaction. Insets—bacteria (magenta) and ER (cyan). Scale bar, 1 µm; inset, 500 nm. (C) 2D morphometric analysis examples are used to quantify the average bacterial perimeter covered by the RER (left) or the average distance between RER and bacterial membranes (right) (from cells in A). ER, cyan; yellow lines represent traces measured. (D and E) Percentage of the bacterial or mitochondrial perimeter covered by the RER and the average distance between the membranes. Each dot represents an individual bacterium or mitochondrion (>10 counted). Each dot represents an individual bacterium or mitochondrion. Data shown are mean ± SD from an independent replicate (unpaired two-tailed t test).
R. parkeri forms extensive interkingdom contacts with the RER
The ER interacts with mitochondria and other organelles to form MCS that regulate a variety of cell processes (Scorrano et al., 2019; Prinz et al., 2020; Voeltz et al., 2024). Partial wrapping of the RER around rickettsiae is akin to recent observations of RER wrapping around mitochondria in liver cells (Hung et al., 2017; Anastasia et al., 2021), prompting us to examine if they had shared features to mitochondrial–ER MCS. Mitochondria–RER contacts are often 25–80 nm apart (Anastasia et al., 2021; Wang et al., 2015; Parlakgül et al., 2024) with a large fraction of the mitochondria perimeter wrapped by the RER (Dai et al., 2005; Giacomello and Pellegrini, 2016; Rizzuto et al., 1998; Vance, 1990; Parlakgül et al., 2024). Using 2D-morphometric analysis of our TEM data, we observed that ∼58.7% of the bacterial perimeter was surrounded by the RER (Fig. 3, C and D) maintaining consistent intermembrane distances. The extent of this interaction appeared to be specific because nearby mitochondria only showed interactions with the RER across ∼8.4% of their perimeter (Fig. 3, C and D). We next measured the average distance between the RER membrane and the bacterial or mitochondrial surface along the perimeter of the contacts. We found that the RER had comparable average distances of ∼55.7 and 50 nm to the rickettsial and mitochondrial surfaces, respectively (Fig. 3, C and E). Importantly, these distances match those reported for mitochondria–RER contacts under chemical-fixation conditions (Parlakgül et al., 2024). Consequently, we have named these bacterium–ER contacts, or BERCs, for the ability of rickettsiae to form interkingdom contacts with the ER.
We next used focus ion beam electron microscopy (FIB-SEM) to capture a greater extent of the rickettsial surface and attain a 3D view of BERCs. Using deep learning segmentation, we generated 3D models of the rickettsia–ER structures during infection (Fig. 4 A and Video 4). These models confirmed our TEM data showing that >50% of the rickettsial surface is covered by the ER and showed that BERCs are connected to the greater ER network (Fig. 4 A and Video 5). We also observed regions of high-electron density connecting the ER to the bacterial membrane (Fig. 4 B). These structures exist throughout the rickettsia–ER interface and were present in all bacteria interacting with the ER.

Extensive interactions between R. parkeri and the RER network. (A) FIB-SEM image stacks and 3D rendering of ER–rickettsia structures in A549 cells infected with the sca2::Tn mutant (magenta) at 30 hpi. The top image shows a subvolume of the FIB-SEM image stack acquired with the entire ER network (cyan) and the sca2::Tn mutant displayed. The bottom image only shows 3D rendering of the ER membranes adjacent to the bacterial membranes. Scale bar, 1 µm. (B) FIB-SEM slice of a sca2::Tn mutant bacterium (magenta) from A. Insets at right show electron-dense regions (arrow) connecting the rickettsial (magenta) and ER (cyan) membranes. Scale bar, 100 nm.
Extensive interactions between R. parkeri and the RER network. (A) FIB-SEM image stacks and 3D rendering of ER–rickettsia structures in A549 cells infected with the sca2::Tn mutant (magenta) at 30 hpi. The top image shows a subvolume of the FIB-SEM image stack acquired with the entire ER network (cyan) and the sca2::Tn mutant displayed. The bottom image only shows 3D rendering of the ER membranes adjacent to the bacterial membranes. Scale bar, 1 µm. (B) FIB-SEM slice of a sca2::Tn mutant bacterium (magenta) from A. Insets at right show electron-dense regions (arrow) connecting the rickettsial (magenta) and ER (cyan) membranes. Scale bar, 100 nm.
Segmentation of R. parkeri–associated ER membranes during infection. A549 cells infected with the sca2::Tn mutant for 30 h were imaged using FIB-SEM (data from Fig. 4). The initial frame shows a subregion of the FIB-SEM image stack followed by vertical slicing. Then, segmentation results showing the ER (cyan) and bacteria (magenta) appear on the FIB-SEM image stack, followed by vertical slicing to reveal the segmentation of both structures on each image slice. Playback speed is 1×.
Segmentation of R. parkeri–associated ER membranes during infection. A549 cells infected with the sca2::Tn mutant for 30 h were imaged using FIB-SEM (data from Fig. 4). The initial frame shows a subregion of the FIB-SEM image stack followed by vertical slicing. Then, segmentation results showing the ER (cyan) and bacteria (magenta) appear on the FIB-SEM image stack, followed by vertical slicing to reveal the segmentation of both structures on each image slice. Playback speed is 1×.
R. parkeri–associated ER membranes are connected to the greater ER network. The initial frame shows the subregions shown in Video 4 followed by vertical slicing to reveal the 3D-rendered ER (cyan) and bacteria (magenta). Horizontal slicing of the ER network follows to highlight the connection between the rickettsia-associated ER and the greater ER network. Playback speed is 1×.
R. parkeri–associated ER membranes are connected to the greater ER network. The initial frame shows the subregions shown in Video 4 followed by vertical slicing to reveal the 3D-rendered ER (cyan) and bacteria (magenta). Horizontal slicing of the ER network follows to highlight the connection between the rickettsia-associated ER and the greater ER network. Playback speed is 1×.
VAPA and VAPB associate with R. parkeri and are required for BERC formation
The stability and consistent spacing of BERCs suggested that tethering proteins promote BERC formation. VAMP-associated proteins (VAPs) are ER-specific tethers that link the ER to different organelles, including the mitochondria, and are a common target for pathogen-mediated ER subversion (Vormittag et al., 2023; Paul and Tiwari, 2023). We occasionally observed that endogenous VAPA and VAPB localized around 0.5 ± 0.05% and 0.6 ± 0.1% of WT bacteria, respectively (SD from three independent experiments). As expected, a much higher frequency of colocalization was apparent with the sca2::Tn mutant (Fig. 5, A and B), with 7 ± 3% and 9 ± 0.6% of bacteria colocalizing with VAPA and VAPB, respectively (SD from three independent experiments). To determine if VAPs were required for BERC formation, we used RNA interference to deplete VAPA and VAPB in A549 cells (Fig. 5 C) and quantified BERC frequency using live-cell imaging. Knockdown of VAPA or VAPB expression led to a partial but significant decrease in the frequency of host cells containing BERCs, while simultaneous knockdown further reduced this frequency (Fig. 5 D). The frequency of BERCs was also nearly abolished in a previously published VAPA and VAPB double knockout (DKO) HeLa cell line (Dong et al., 2016), relative to WT HeLa cells (Fig. 5, E and F). Loss of VAPs was also not correlated with apparent differences in intracellular bacterial burdens (Fig. S3, A and B), in agreement with our data that BERCs do not grossly impact fitness (Fig. 2 E).

Interactions between R. parkeri and the ER are dependent on VAPA and VAPB. (A and B) Immunofluorescence detection of endogenous VAPA or VAPB localization around sca2::Tn mutant bacteria (magenta) at 24 hpi. Images are representative of three independent experiments. Scale bar, 10 µm; inset scale bar, 1 µm. (C) Western blot analysis of A549-mCh-Sec61β cell lysates after indicated siRNA treatment at 72 h after transfection. GAPDH, loading control. (D) Percentage of A549-mCh-Sec61β cells displaying BERCs with sca2::Tn mutant bacteria at 24 hpi after the indicated siRNA treatment in C. (E) Western blot analysis of VAPA and VAPB expression in HeLa cell lysates from F. GAPDH, loading control. (F) Percentage of WT or VAPA/B DKO HeLa cells displaying BERCs with sca2::Tn mutant bacteria (28 hpi). For D and F, the mean ± SEM of three independent experiments (large outlined circles) are superimposed over the raw data the percent of cells with BERCs per FOV (small unlined circles) (>100 cells quantified per condition per independent experiment) (one-way ANOVA with Dunnett’s post hoc test). (G) Live-cell imaging snapshots at 24 hpi of Halo-VAPAΔTM-I3-01 or Halo-VAPBΔTM-I3-01 (grey) fusions (WT versus KD/MD FFAT-binding mutant) during infection with sca2::Tn mutant bacteria (magenta). Scale bar, 10 µm; inset scale bar, 1 µm. (H) Percentage of sca2::Tn mutant bacteria in transiently transfected A549 cells showing Halo-VAPΔTM-I3-01 localization. Data are mean ± SD of three independent experiments (≥4 FOV with ≥200 bacteria quantified per condition per independent experiment) (unpaired two-tailed t test). Source data are available for this figure: SourceData F5.
Interactions between R. parkeri and the ER are dependent on VAPA and VAPB. (A and B) Immunofluorescence detection of endogenous VAPA or VAPB localization around sca2::Tn mutant bacteria (magenta) at 24 hpi. Images are representative of three independent experiments. Scale bar, 10 µm; inset scale bar, 1 µm. (C) Western blot analysis of A549-mCh-Sec61β cell lysates after indicated siRNA treatment at 72 h after transfection. GAPDH, loading control. (D) Percentage of A549-mCh-Sec61β cells displaying BERCs with sca2::Tn mutant bacteria at 24 hpi after the indicated siRNA treatment in C. (E) Western blot analysis of VAPA and VAPB expression in HeLa cell lysates from F. GAPDH, loading control. (F) Percentage of WT or VAPA/B DKO HeLa cells displaying BERCs with sca2::Tn mutant bacteria (28 hpi). For D and F, the mean ± SEM of three independent experiments (large outlined circles) are superimposed over the raw data the percent of cells with BERCs per FOV (small unlined circles) (>100 cells quantified per condition per independent experiment) (one-way ANOVA with Dunnett’s post hoc test). (G) Live-cell imaging snapshots at 24 hpi of Halo-VAPAΔTM-I3-01 or Halo-VAPBΔTM-I3-01 (grey) fusions (WT versus KD/MD FFAT-binding mutant) during infection with sca2::Tn mutant bacteria (magenta). Scale bar, 10 µm; inset scale bar, 1 µm. (H) Percentage of sca2::Tn mutant bacteria in transiently transfected A549 cells showing Halo-VAPΔTM-I3-01 localization. Data are mean ± SD of three independent experiments (≥4 FOV with ≥200 bacteria quantified per condition per independent experiment) (unpaired two-tailed t test). Source data are available for this figure: SourceData F5.

Reduced VAPA and VAPB expression does not alter intracellular bacterial burdens, and overexpressed full-length VAP proteins localize throughout the ER. (A) Number of bacteria in cells infected with sca2::Tn mutant bacteria (28 hpi) after the indicated siRNA treatment. The mean ± SEM of three independent experiments (large outlined circles) are superimposed over the raw data from individual cells (small unlined circles) (>25 cells counted per condition per independent experiment). (B) Number of bacteria in WT or VAPA/B DKO HeLa cells infected with sca2::Tn mutant bacteria (28 hpi). The mean ± SEM of three independent experiments (large outlined circles) is superimposed over the raw data from individual cells (small unlined circles) (>25 cells counted per condition per independent experiment). (C and D) Live-cell imaging snapshots at 28 hpi of sca2::Tn mutant (magenta) infecting A549-mCherry-Sec61β cells (cyan) transiently expressing HaloTag-VAPA (A) or HaloTag-VAPB (yellow) (B). Scale bar, 5 µm; inset, 2.5 µm.

Reduced VAPA and VAPB expression does not alter intracellular bacterial burdens, and overexpressed full-length VAP proteins localize throughout the ER. (A) Number of bacteria in cells infected with sca2::Tn mutant bacteria (28 hpi) after the indicated siRNA treatment. The mean ± SEM of three independent experiments (large outlined circles) are superimposed over the raw data from individual cells (small unlined circles) (>25 cells counted per condition per independent experiment). (B) Number of bacteria in WT or VAPA/B DKO HeLa cells infected with sca2::Tn mutant bacteria (28 hpi). The mean ± SEM of three independent experiments (large outlined circles) is superimposed over the raw data from individual cells (small unlined circles) (>25 cells counted per condition per independent experiment). (C and D) Live-cell imaging snapshots at 28 hpi of sca2::Tn mutant (magenta) infecting A549-mCherry-Sec61β cells (cyan) transiently expressing HaloTag-VAPA (A) or HaloTag-VAPB (yellow) (B). Scale bar, 5 µm; inset, 2.5 µm.
VAP recruitment to contacts requires recognition of two phenylalanines in an acidic tract (FFAT) and FFAT-like motifs in their protein binding partners (Alpy et al., 2013; Loewen et al., 2003; Di Mattia et al., 2020). Though the BERC-specific target is unknown at this time, we hypothesized that the localization of VAPs to R. parkeri also required recognition of an FFAT-like motif. Previous work showed that overexpressed VAP proteins are found throughout the ER and are not enriched at most ER contact sites (Alpy et al., 2013; Dong et al., 2016; Barman et al., 2022; Obara et al., 2024), and we also were unable to detect enrichment of HaloTag fusions of full-length VAP proteins to BERCs (Fig. S3, C and D). Therefore, we sought a tool that would eliminate ER targeting while still maintaining the needed VAP multimerization for FFAT binding (Nishimura et al., 1999; Kim et al., 2010). We removed the VAP transmembrane domain and fused the remaining Halo-VAP∆TM protein to the self-oligomerizing tag I3-01 (Hsia et al., 2016). Using these fusions, we detected robust localization of Halo-VAPA∆TM-I3-01 and Halo-VAPB∆TM-I3-01 around 24% and 42% of sca2::Tn mutant bacteria, respectively (Fig. 5, G and H). This localization was also largely bimodal, similar to what we observed for BERCs. Importantly, mutations in residues that mediate FFAT-binding in VAPA and VAPB (Kaiser et al., 2005) inhibited these interactions (see KD/MD fusions; Fig. 5, G and H). Together, these data indicate that VAPA and VAPB associate with the bacterium in a manner dependent on an FFAT-motif-containing protein.
Concluding remarks
The increased appreciation of interorganelle interactions in recent years has unveiled a set of closely apposed and tethered membranes that facilitate numerous cellular processes, making them prime candidates for microbial control or mimicry (Kors et al., 2022; Vormittag et al., 2023). Thus far, examples of pathogenic manipulation of ER-mediated interactions have been limited to contact sites between eukaryotic membrane compartments (Cook et al., 2022; Derré et al., 2011; Stanhope et al., 2017). Here, we report an example of a cytosolic bacterial pathogen forming an extensive, stable interkingdom contact with the RER during infection. We refer to these as BERCs and propose that these contacts rely on VAPA and VAPB binding partners.
Most contacts studied between the ER and other organelles involve the smooth ER. However, recent work has observed extensive wrapping of the RER around mitochondria in structures called riboMERCs (ribosome-studded Mitochondria-ER contacts) and wrappER (curved wrapping-type of RER) (Hung et al., 2017; Anastasia et al., 2021; Wang et al., 2015; Cardoen et al., 2024). It is curious that rickettsiae, whose evolutionary origins are linked with mitochondria (Sit and Lamason, 2024), also form extensive and stable interactions with the RER. Whether BERCs mimic the functional consequences of mitochondrial–ER contact sites or are distinct structures that perform their own unique function remains to be determined. Identification of all the molecular players key to forming BERCs will be needed to facilitate their functional dissection during infection.
Previous work has reported ER membranes near Rickettsia conorii, but these were attributed to autophagy and distinct from BERCs (Walker et al., 1997). ER dilation has also been observed during R. rickettsii infection, with the enlarged ER occasionally ramming into nearby organelles and bacteria (Silverman and Wisseman, 1979). Our observations were made well before obvious changes to the ER occurred, suggesting that these are separate phenomena. Intriguingly, a single example of the RER partially surrounding rickettsiae when inside tick cells was reported (Munderloh et al., 1998), but this report did not determine the nature of this interaction, and it is unknown if these structures match the BERCs we observed. Additional comparative studies between Rickettsia species and eukaryotic cell environments are needed.
BERCs were observed for only 3–4% of WT rickettsiae at the infection stages tested in this report. To what extent this frequency changes at different stages or under different cellular conditions remains to be determined. Importantly, though, heterogeneity within the intracellular rickettsial population is well known. For example, actin-based motility is highly heterogenous with motile bacteria present only 2% of the time at early stages versus 17% of the time at later stages of infection (Reed et al., 2014). Despite these low frequencies, loss of motility reduces virulence (Kleba et al., 2010), highlighting the importance of studying variable phenotypes in the rickettsial population.
We observed an inverse relationship between actin-based motility and BERC formation, as the tail-less mutant sca2::Tn shows roughly 25-fold more interactions with the ER than WT R. parkeri. One of two scenarios could explain this observation: lacking actin-based motility increases the likelihood of a bacterium forming BERCs or decreases the chances of escaping BERCs once they are formed. Additionally, the bimodal phenotype of BERC formation observed with the sca2::Tn mutant indicates that motility is not the only layer of regulation. Understanding the role motility plays and what triggers BERC formation through host- or bacterial-specific mechanisms should elucidate whether BERC formation is driven by a subset of bacteria or if all bacteria can form BERCs but do so at different phases of their life cycle.
It is unlikely that BERCs grossly impair bacterial survival through processes such as autophagy because BERCs were not correlated with lower bacterial burdens and BERC frequency did not increase when the autophagosome-targeted ompB::Tn mutant (Engström et al., 2019) was tested. Moreover, decreasing BERC frequency via VAP depletion does not alter bacterial loads. In addition to autophagy, the ER regulates lipid metabolism, organelle trafficking, carbohydrate metabolism, apoptosis, inflammasome formation, and calcium signaling (Prinz et al., 2020; Wu et al., 2018). The obligate lifestyle of R. parkeri highlights that these pathogens are reliant on their host to survive, and one or more of these functions could be regulated by BERCs under specific conditions or in certain cell types. For example, BERCs might promote metabolite exchange between the ER and the bacterium, and it will be important to investigate this possibility once our understanding of rickettsial metabolism improves. It is also possible that BERCs represent a unique adaptation to modulate host or bacterial function that remains to be identified.
Our discovery of a stable, interkingdom interaction between the bacterial pathogen R. parkeri and the ER challenges our traditional view of their cytosolic infectious life cycle. Indeed, this unique adaptation by R. parkeri, which was not found for other cytosolic pathogens we tested, exemplifies the exceptional strategies this pathogen has evolved and underscores the importance of better understanding its biology. It also remains to be seen if R. parkeri interacts with other organelle membranes, potentiating large-scale changes to the cellular landscape in favor of pathogen or host fitness. In the end, this work highlights an unexpected mode of host–pathogen interaction whose study may also deepen our understanding of ER function.
Materials and methods
Cell lines
A549 (human lung epithelial, RRID:CVCL_A549), Vero (monkey kidney epithelial, RRID:CVCL_0059), and HEK293T (human embryonic kidney, RRID:CVCL_0063) cells were obtained from the University of California, Berkeley Cell Culture Facility (Berkeley, CA, USA). HMEC-1 (human microvascular endothelial cell line-1, RRID:CVCL_0307) was a gift from Dr. Matthew Welch at the University of California (Berkeley, CA, USA). VAPA/B DKO HeLa cells (Dong et al., 2016) were a gift from Dr. Pietro De Camilli. ATG knockout HeLa cells (ATG5−/−) (Nezich et al., 2015) were a gift from Dr. Richard Youle at the National Institute of Neurological Disorders and Stroke (Bethesda, MD, USA). A549 cells, HEK293T cells, and HeLa cells were maintained in Dulbecco’s modified Eagle’s medium (DMEM, 11965118; Gibco), supplemented with 10% fetal bovine serum (FBS). Vero cells were maintained in DMEM supplemented with 5% FBS. HMEC-1 cells were maintained in MCDB 131 liquid medium with no glutamine (10372019; Thermo Fisher Scientific), supplemented with 10% FBS, 1 µg/ml hydrocortisone (50-23-7; Sigma-Aldrich), 10 ng/ml epidermal growth factor (354001; Corning), and 2 mM L-glutamine (56-85-9; Sigma-Aldrich).
A549 cells expressing mCherry-Sec61β or the BiP signal sequence fused to mNeonGreen were generated using lentiviral transduction, as previously described (Lamason et al., 2016). Briefly, the mCherry-Sec61β fusion was subcloned from mCh-Sec61β (49155; Addgene) into the lentiviral plasmid FCW2IB-Lifeact-mWasabi (Lamason et al., 2016) by replacing the LifeAct-mWasabi fusion, upstream of the IRES. For the BiP-mNeonGreen-KDEL fusion, the BiP signal sequence (Friedman et al., 2011) and a KDEL sequence were fused to the N- and C- termini of mNeonGreen, respectively. The BiP-mNeonGreen-KDEL fusion was then subcloned upstream of the IRES of FCW2IB-LifeAct-mWasabi by replacing the LifeAct-mWasabi fusion. Viral particles were packaged by transfecting HEK293T cells plated the day before at 2.5 × 10⁵ cells/ml (2 ml/well, 6-well plate) using calcium phosphate with 400 ng pMDL-RRE, 400 ng pCMV-VSVg, 400 ng RSV-Rev, and 800 ng FCW2IB-mCherry-Sec61β (or FCW2IB-BiP-mNeonGreen-KDEL). Roughly, 24 h after transfection, the media was replaced with 1.2 ml of fresh media to concentrate the virus. 48 h after transfection, the concentrated supernatant was filtered through a 0.45-µm syringe filter and added to A549 cells at ∼2 × 10⁵ cells/ml. After 24 h of adding the filtered supernatant, cells were overlaid with fresh media containing 12 µg/ml of blasticidin (3513-03-9; Sigma-Aldrich).
To achieve similar fluorescence levels, A549-mCherrySec61β cells were sorted based on mCherry fluorescence using the FACS Aria II Cell Sorter (BD Biosciences) at the Whitehead Institute for Biomedical Research Flow Cytometry Core Facility (Cambridge, MA, USA). All sorted and parental cell lines were confirmed to be mycoplasma-negative in a MycoAlert PLUS assay (LT07-710; Lonza) performed by the Koch Institute High-Throughput Sciences Facility (Cambridge, MA, USA).
To generate HeLa cell lines (WT, VAP DKO, and ATG5−/−) expressing mCherry-Sec61β, viral particles were packaged by transfecting HEK293T cells plated the day before at 7.5 × 10⁵ cells/ml (2 ml/well, 6-well plate) using TransIT-LT1 transfection reagent (2300; Mirus Bio) with 625 ng pMDL-RRE, 625 ng pCMV-VSVg, 625 ng RSV-Rev, and 1,250 ng FCW2IB-mCherry-Sec61β, and centrifuged at 1,000 × g for 30 min. 6 h after transfection, the media was replaced with 5 ml fresh DMEM with 10% FBS and 1% bovine serum albumin (BSA) and incubated for 36 h. Viral supernatant was filtered through a 0.45-µm syringe filter and concentrated to 1/10 the original volume in fresh DMEM + 10% FBS using Lenti-X concentrator (631321; Takara Bio) following manufacturer protocols. 0.1 ml of concentrated virus, diluted to a final volume of 2 ml in DMEM + 10% FBS + 8 µg/ml polybrene (TR-1003-G; EMD Millipore), was added to HeLa cells seeded at 9 × 10⁴ cells/ml (2 ml/well, 6-well plate), centrifuged at 1,000 × g for 30 min, and incubated for 5 h. After initial incubation, cells were washed with PBS and were recovered in 2 ml fresh DMEM with 10% FBS for 24 h before adding 3 µg/ml blasticidin to select for mCherry-Sec61β expressing cells.
Bacteria plasmids and strains used in this study
RpBFP (Lamason et al., 2016, 2018), the sca2::Tn mutant (Reed et al., 2014), the ompBSTOP::Tn mutant (Engström et al., 2019; Lamason et al., 2018) (a kind gift from Dr. Matthew Welch), and the sca2::Tn transformed with pRAM18dSGA-OmpApr-GFPuv (sca2::Tn pRAM GFP) (Lamason et al., 2016) were generated as previously described. RpBFP refers to R. parkeri expressing two TagBFP cassettes cloned into pRAM18dRA (Lamason et al., 2016, 2018). All rickettsial strains were propagated at 33°C in Vero cells with DMEM containing 2% FBS and isolated by mechanical disruption, as previously described (Lamason et al., 2016, 2018). Bacteria were aliquoted in brain heart infusion media (BHI, DF0037-17-8; Thermo Fisher Scientific) and stored at −80°C to decrease variability between replicates due to freeze–thaw cycles. Bacterial titers were determined as previously described via plaque assay (Lamason et al., 2016).
The DasherGFP-expressing strain (LmDasher, strain PL1938 10403S:DasherGFP) was a kind gift from Dr. Erin Benanti (Aduro Biotech). To generate LmDasher, DasherGFP was codon-optimized for L. monocytogenes expression, cloned downstream of the actA promoter, and integrated at the tRNA-Arg locus using pPL2. L. monocytogenes strains were grown in BHI. The GFP L. monocytogenes ActA deletion strain (ΔactA) was a gift from Dr. Michelle Reniere (University of Washington) and Dr. Dan Portnoy (University of California Berkeley) and was generated by integrating pPL2-gfp (Lauer et al., 2002) into the DP-L3078 (ΔactA) strain (Skoble et al., 2000).
WT S. flexneri 2457T (Labrec et al., 1964) and the isogenic IcsA mutant icsA::Ω (specR) (Steinhauer et al., 1999) were gifts from Dr. Marcia Goldberg (Massachusetts General Hospital, Boston, MA, USA). S. flexneri strains were grown on tryptic soy agar supplemented with 0.01% Congo Red (LC133507; LabChem) and supplemented with 100 μg/μl spectinomycin (22189-32-8; Sigma-Aldrich) or 100 μg/μl ampicilin (69-52-3; Sigma-Aldrich) as needed. WT S. flexneri and 2457T icsA::Ω (specR) were transfected with the GFPmut3-expressing plasmid pFPV25.1 (Rathman et al., 2000; Valdivia and Falkow, 1996) (20668; Addgene) using electroporation, as previously described (Warren, 2011).
Live microscopy of bacterial infections
All experiments were imaged with the Olympus IXplore Spin microscope system using an environmental chamber set to 5% CO2 and 37°C for L. monocytogenes and S. flexneri infections or 33°C for R. parkeri infections. This system was also equipped with four lasers, a Yokogawa CSU-W1 spinning disc unit, and ORCA-Flash4.0 sCMOS camera. Movies were acquired using a 100× UPlanSApo objective (1.35 numerical aperture) and Z Drift Compensation. Movies were deconvolved using Olympus CellSens software. All data quantification was performed in ImageJ, where bacteria were manually counted on the last frame of each movie.
To determine if L. monocytogenes interacts with the ER, 2 ml of BHI cultures were inoculated with L. monocytogenes and grown for 16–18 h overnight at 30°C without shaking. A549-mCh-Sec61β cells at 2.5 × 10⁵ cells/cm2 were grown in 20-mm Mattek dishes (P35G-1.5-20-C; MatTek Corporation). Bacteria from 0.5 ml of culture grown overnight were pelleted by centrifugation at 10,000 × g for 30 s at room temperature and resuspended in 500 μl PBS (Phosphate-buffered saline). Resuspended bacteria (LmDasher or ΔactA) were used to infect cells by adding suspension directly to cells at an MOI of 1–2. Infections were carried out at 37°C for at least 4 h before imaging. Before imaging, the dishes were washed two times and overlayed with FluoroBrite DMEM (A1896702; Thermo Fisher Scientific) containing 10% FBS. Movies were acquired at 20-s intervals for at least 3 min. Infections with both strains were imaged and >30 cells representing >1,000 total bacteria were imaged per strain for each replicate (n = 3).
To determine if S. flexneri forms interactions with the ER, S. flexneri was grown overnight in tryptic soy broth at 37°C with shaking. Overnight cultures were subcultured 1:200 and grown at 37°C with shaking for 2–3 h until cultures reached exponential phase (OD600 ≈ 0.4–0.6). Bacteria from 1 ml of culture were pelleted by centrifugation and resuspended in 250 μl PBS. Resuspended bacteria were used to infect A549-mCh-Sec61β cells at 0.6 × 10⁵ cells/cm2 in an 8-well chambered coverglass with a No. 1.5 borosilicate glass bottom (155360; Thermo Fisher Scientific) at an MOI of 100. Infected cells were incubated for 30 min at 37°C and 5% CO2. Cells were washed twice with warm PBS and media was replaced with FluoroBrite DMEM containing 10% FBS and 25 µg/ml gentamicin. Cells were incubated for an additional 1–1.5 h until intracellular bacteria were clearly visible. Movie acquisition and processing were done as with L. monocytogenes infections.
To determine the frequency of ER–rickettsia interactions, A549-mCh-Sec61β cells on 8-well chambered coverglass (at 0.6 × 10⁵ cells/cm2) were infected with RpBFP (WT), sca2::Tn (sca2::Tn pRAM-GFP), or ompB::Tn (ompBSTOP::Tn) at an MOI of 0.5–2 for 28 and 48 h at 33°C (note, R. parkeri requires a longer incubation to accommodate its slower replication rate relative to L. monocytogenes and S. flexneri). Before imaging, each well was washed two times and overlayed with FluoroBrite DMEM containing 10% FBS. Movies were collected at 20-s intervals for at least 3 min. Approximately 10 fields of view (FOVs) were imaged for each replicate (n = 3) and >2,000 bacteria were quantified. To determine the frequency of host cells displaying BERCs, three replicates were manually quantified on ImageJ representing a total of 30 FOVs and >50 cells.
To visualize actin dynamics in the context of ER–rickettsia interactions, A549-BiP-mNeonGreen-KDEL cells on 8-well chambered coverglass (at 0.6 × 10⁵ cells/cm2) were infected at an MOI of 0.5–1 with RpBFP and incubated at 33°C for 48 h. Before imaging, each well was washed two times with FluoroBrite DMEM containing 10% FBS. Then, cells were overlaid with SIR-Actin (CY-SC001; Cytoskeleton) at a final concentration of 1 µM in FluoroBrite DMEM containing 10% FBS and incubated for 1 h. Imaging was done as described above for live-cell imaging of rickettsial infections. Approximately 10 FOVs were imaged per strain for each replicate (n = 2) and >100 bacteria interacting with the ER were quantified.
To determine the stability of ER interactions with the WT or sca2::Tn mutant rickettsiae over a 1-h period, A549-mCh-Sec61β cells (2.5 × 10⁵ cells/cm2) in an 8-well chambered coverglass were infected by centrifuging cells at 200 × g for 5 min at room temperature with an MOI of 1.5–2. Infected cells were incubated at 33°C for 24 h, and imaging proceeded as above for rickettsial infections. Approximately 10 infected cells displaying ER interactions with rickettsiae were imaged per replicate (n = 3). Movies were captured at 5-min intervals and ER interactions were tracked over the 1 h period. >20 cells were quantified per replicate.
To determine the frequency of ER–rickettsia interactions after loss of ATG5, WT, and ATG5−/− HeLa-mCh-Sec61β cells (1.25 × 10⁵ cells/cm2) in an 8-well chambered coverglass were infected by centrifuging cells at 300 × g for 5 min at room temperature with an MOI of 1–2. Infected cells were incubated at 33°C for 48 h, and imaging proceeded as above for rickettsial infections. At least 10 FOVs were imaged for each replicate (n = 3), and the frequency of BERC-positive cells was manually quantified on ImageJ, representing >30 FOVs and >270 cells per condition.
TEM
A549 and HMEC-1 cells seeded at ∼3.0 × 10⁵ or 1.5 × 10⁵ cells/cm2, respectively, in a 10-cm2 dish were infected with the sca2::Tn mutant at an MOI of 0.5–1. Briefly, media was aspirated from cells, and cells were washed one time with PBS and overlaid with 1 ml of BHI covering the entire layer of cells. Then, the bacteria were added to cells and incubated via slow rocking at 37°C for 30 min. After, the infected cells were overlaid with DMEM containing 10% FBS (A549) or MCDB 131 liquid medium without glutamine, supplemented as described above (HMEC-1), and incubated at 33°C for 30 h. Cells were then fixed using Karnovsky Fixative Reagent Grade (3% glutaraldehyde and 2% formaldehyde in 0.1 M phosphate buffer, pH 7.4) (15732-10; Electron Microscopy Sciences) for 1 h at room temperature. After incubation, cells were scraped and centrifuged at 10,000 × g for 5 min at room temperature in 50-ml conicals. The pellet was transferred to a 1.5-ml Eppendorf, where it was centrifuged again at 10,000 × g for 2 min at room temperature and stored in fresh Karnovsky Fixative Reagent at 4°C until embedding.
Fixed cells were postfixed in 1% osmium tetroxide in veronal-acetate buffer. The cells were stained en block overnight with 0.5% uranyl acetate in veronal-acetate buffer (pH 6.0), and then dehydrated and embedded in Embed-812 resin. Sections were cut on a Leica Ultra Microtome with a diatom diamond knife at a thickness setting of 50 nm and stained with 2% uranyl acetate and lead citrate. The sections were examined using a Hitachi 7800 TEM 80KV and photographed with an AMT CCD camera. Sample preparation after fixation and imaging was performed at the Harvard University Center for Nanoscale Systems (Cambridge and Allston, MA, USA). Two replicates were performed per cell line.
2D morphometric analysis to determine the percent bacterial or mitochondrial perimeter covered by the ER as well as the average distance between the ER and bacterial or mitochondrial membrane was performed in A549 cells by tracing the subcellular structures in Image J. To determine the average distance between the ER and bacterial or mitochondrial membrane, distances were quantified every 100 nm for ER membranes that were separated ≤130 nm from the surface of either bacteria or mitochondria. To determine the percent perimeter covered, the bacterial and mitochondrial surface that was ≤130 nm from an ER membrane was traced. Approximately >10 bacteria and >10 mitochondria were quantified per replicate (n = 2).
FIB-SEM
To locate an infected cell for 3D FIB-SEM imaging, a thin plastic section was lifted off the block face using a microtome knife, transferred onto a TEM grid, and scanned in a TEM for the presence of bacteria (Leica Ultramicrotome, 7800 TEM; Hitachi). To reduce the search area and facilitate determining the orientation of the thin section, the block was trimmed prior to a trapezoidal cross-section with an approximate edge length of 500 µm. Once a cell with the desired ultrastructure was identified, a series of images were recorded at cascading magnifications keeping the region of interest in the image center. The magnification was lowered until a block edge or corner was visible in the image. This approach made it possible to start the search in the SEM on an easily recognizable region of the block and use characteristic features at varying length scales in the corresponding back-scatter image to trace a path back to the actual region of interest.
FIB-SEM data were acquired on a Zeiss Crossbeam 550 using the Atlas software package. The cell was prepared for automatic serial sectioning by first covering its visible region with a 1-µm-thick Pt film via ion beam–assisted deposition. A series of line markings carved into the film with the ion beam act as fiducial markers for drift correction and the measurement of the progression of the ion beam during the run. The grooves are subsequently covered with a 1-µm-thick carbon film to reduce curtaining artifacts, generate contrast, and ultimately preserve the markings throughout the run. After clearing material in front of the region of interest to a visual depth of 20 µm, data were recorded using the energy-selective back-scatter detector with the electron beam operating at 1.5 kV and 2 nA. Cross-section images with a 5-nm pixel size and a dwell time of 10 µs were recorded in 10 nm slice intervals. Milling was performed with the ion beam set to 30 kV and a current of 700 pA.
Images were aligned via cross-correlation and denoised with the non-local means filter using an in-house Matlab-based software package. Due to the relatively long dwell time, images contained small distortions along the slow scan direction. A stripe-based cross-correlation approach was designed to carefully measure displacements within stripes of consecutive images, which allowed to construct a displacement field for each image that was subsequently used to correct for locally varying drift and to ensure exact alignment throughout the volume of the dataset. Analysis scripts are available upon request through the corresponding author. The final data volume of 15 × 15 × 15 µm3 ultimately contained 17 bacteria enveloped by the cell ER. Deep-learning data segmentation was performed using the Object Research Systems (ORS) Dragonfly software to extract the organelles of interest. A U-Net model with five depth levels, a starting number of 64 convolutional kernels, and a patch size of 64 pixels was successfully trained using three manually segmented image slices. The model was then applied to the rest of the FIB-SEM image stack. 3D models were generated using the segmentation data and the 3D visualizer in ORS Dragonfly.
Endogenous p62 and VAP localization assays
A549-BiP-mNeonGreen-KDEL cells were seeded at 4 × 10⁵ cells/ml (0.5 ml/well, 24-well plate) on glass coverslips. The next day, cells were infected by centrifugation at 200 × g for 5 min at room temperature with an MOI of 1–2 (for strains: RpBFP, sca2::Tn mutant, or ompB::Tn mutant) and incubated at 33°C for 24 h. Following infection, infected cells were fixed in 4% paraformaldehyde (PFA) for 1 h by removing 0.2 ml of media and adding 0.3 ml of 8% PFA diluted in DMEM + 10% FBS. Fixed cells were incubated in 0.1 M glycine for 10 min at room temperature to quench residual PFA and then washed three times with PBS. For staining of endogenous p62, cells were permeabilized with 0.5% triton X-100 in PBS for 5 min and then washed three times in PBS. Samples were blocked for 1 h in a blocking buffer (2% BSA and 10% normal goat serum in PBS). Samples were then incubated for 1 h with mouse anti-p62 (610833; BD Transduction Laboratories) and rabbit anti-Rickettsia I7205 (kindly provided by Dr. Ted Hackstadt) diluted 1/200 and 1/500, respectively, in blocking buffer. Samples were then washed three times with PBS and incubated for 1 h in goat anti-mouse conjugated to Alexa Fluor 647 (A-21236; Invitrogen) and goat anti-rabbit conjugated to Alexa Fluor 405 (A-31556; Invitrogen), both diluted 1/200 in blocking buffer. Coverslips were then washed three times with PBS and then mounted on glass slides using ProLong Gold Antifade Mountant (P36934; Invitrogen). For staining of endogenous VAPs, cells were permeabilized with 10 μg/ml digitonin in PBS and incubated for 15 min, as previously demonstrated for imaging endogenous VAPs (Zhao et al., 2018). Samples were then blocked for 1 h in blocking buffer before being incubated overnight at 4°C in blocking buffer with either 1/200 diluted rabbit anti-VAPA (15275-1-AP; Proteintech) or 1/100 diluted rabbit anti-VAPB (144-77-1-AP; Proteintech) with 1/1,000 diluted mouse anti-Rickettsia 14–13. The next day coverslips were washed three times with PBS and then incubated for 1 h at room temperature with goat anti-mouse conjugated to Alexa Fluor 405 (A-31553; Invitrogen) and goat anti-rabbit conjugated to Alexa Fluro 647 (A-21244; Invitrogen), both diluted 1/200 in blocking buffer. Coverslips were then washed in PBS and mounted on glass slides as described above.
All fixed and stained coverslips were imaged with the Olympus IXplore Spin microscope system using a 100× objective. Both p62 and VAP localization are expressed as a percent total of all counted R. parkeri within an independent experiment. All data were quantified manually using ImageJ with ≥4 FOV counted containing a total of ≥200 bacteria per independent experiment (n = 3).
Exogenous VAP localization assays
A549-mCh-Sec61β cells were grown on an 8-well chambered coverglass (at 1.2 × 10⁵ cells/cm2) and were transfected the next day with 250 ng of HaloTag-VAPA or HaloTag-VAPB construct (a kind gift from Dr. Jennifer Lippincott-Schwartz) (Obara et al., 2024) using Lipofectamine 3000 (catalog number L3000001; Thermo Fisher Scientific) following the manufacturer’s instructions. After 4 h, cells were washed twice with warm PBS and the media was replaced with fresh DMEM containing 10% FBS. At 8 h after transfection, cells were infected by centrifugation at 200 × g for 5 min at room temperature with an MOI of 2–3. Infected cells were incubated at 33°C for an additional 12 h. Before imaging, media was replaced with FluoroBrite DMEM containing 10% FBS and 50 nM of the fluorogenic dye JF635-HaloTag ligand (Janelia Materials), and cells were incubated at 33°C for 30 min, followed by two washes and overlay with FluoroBrite DMEM containing 10% FBS. Live-cell imaging proceeded as described above for rickettsial infections. Approximately 15 HaloTag expressing, infected cells displaying ER interactions with the sca2::Tn mutant were imaged per replicate (n = 3).
To examine exogenous VAP localization frequency independent of their ER localization, HaloTag-VAPA and HaloTag-VAPB were first subcloned without their ER transmembrane domains (aka “VAP∆TM”; amino acids 228–248 of VAPA and amino acids 223–243 of VAPB). The C-terminal domain of these mutants was then fused to the I3-01 oligomerization domain (Hsia et al., 2016). HaloTag-VAPA∆TM and HaloTag-VAPB∆TM KD/MD mutants were similarly generated by first fusing a HaloTag to VAPA or VAPB KD/MD mutants without their ER transmembrane domains using pEGFPC1-hVAP-A KD/MD (mutant K94D/M96D, unable to bind FFAT motifs) (#104449; Addgene) or pEGFPC1-hVAP-B KD/MD (mutant K87D/M89D, unable to bind FFAT motifs) (#104450; Addgene) as a template. A549-mCh-Sec61β cells or A549 cells grown on an 8-well chambered coverglass (at 1.2 × 10⁵ cells/cm2) were first infected with sca2::Tn mutant bacteria as above at an MOI of 1–2. At 6 hpi, 750 ng of the I3-01 fusion constructs were transfected into cells. At 12 h after transfection, HaloTag labeling and live-cell imaging proceeded as described above. Data quantification was manually performed on ImageJ where the percent of bacteria colocalizing with I3-01 was quantified from at least four FOV representing ≥200 bacteria per replicate.
BERC quantification in VAPA- and VAPB-depleted cells
We first determined the frequency of cells containing BERCs using pooled siRNA-mediated silencing of VAPA or VAPB, similar to prior work (Derré et al., 2011). Here, A549-mCh-Sec61β at ∼0.6 × 10⁵ cells/cm2 in an 8-well chambered coverglass were transfected with 10 nM of pooled siRNAs against VAPA (L-021382-00-0005; Horizon Discovery), VAPB (L-017795-00-0005; Horizon Discovery), or a non-target control (D-001810-10-05; Horizon Discovery) using Lipofectamine RNAiMAX Transfection Reagent (13778030; Thermo Fisher Scientific). Cells were grown for 48 h at 37°C. At 48 h after transfection, cells were infected at an MOI of 1.5–2 with the sca2::Tn mutant by centrifuging cells at 200 × g for 5 min at room temperature. The infected cells were then incubated at 33°C for 24 h. Imaging was performed as described above, with ∼10 FOV imaged per condition for each replicate (n = 3) and >300 cells quantified. Data quantification was manually performed on ImageJ where cells containing ≥1 BERC(s) were deemed BERC-positive and quantified per FOV.
To determine the frequency of cells containing BERCs in WT and VAPA/B DKO HeLa cells, cells were grown on an 8-well chambered coverglass (at 1.2 × 10⁵ cells/cm2) for 24 h. Then sca2::Tn mutant bacteria were used to infect cells by centrifugation at 200 × g for 5 min at room temperature with an MOI of 1–2. At 28 hpi, live-cell imaging proceeded as above for rickettsial infections. Approximately 15 FOVs imaged per condition for each replicate (n = 3) and >700 cells were quantified. Data quantification was manually performed on ImageJ where cells containing ≥1 BERC(s) were deemed BERC-positive and quantified per FOV.
VAPA (L-021382-00-0005; Horizon Discovery) target sequences:
5′-CCUGAGAGAUGAAGGUUUA-3′
5′-UAGGGAAAUUCAUCUUGUA-3′
5′-GGAUAAACCUGGAUCAACC-3′
5′-GGCAAAACCUGAUGAAUUA-3′
VAPB (L-017795-00-0005; Horizon Discovery) target sequences:
5′-UGUUACAGCCUUUCGAUUA-3′
5′-CCACGUAGGUACUGUGUGA-3′
5′-GCUCUUGGCUCUGGUGGUU-3′
5′-GUAAUUAUUGGGAAGAUUG-3′
Western blot
To confirm siRNA-mediated silencing of VAPA and VAPB expression, transfections were completed as above except cells were plated in 24-well dishes. Cells were collected at 48 and 72 h and lysed on ice for 10 min in immunoprecipitation lysis buffer (50 mM HEPES, 150 mM NaCl, 1 mM EDTA, 10% glycerol, 1% IGEPAL). The cell debris was then cleared via centrifugation at 16,100 × g 4°C for 10 min. Lysates were analyzed by western blotting using rabbit anti-VAPA (15275-1-AP; Proteintech) and mouse anti-VAPB (66191-1-Ig; Proteintech) and rabbit anti-GAPDH (2118S, RRID:AB_561053; Cell Signaling). Acquisition of blot images was performed on a BioRad ChemiDoc MP Imaging System.
To confirm loss of ATG5, VAPA, and VAPB expression in the indicated knockout lines, lysates were collected as described above and analyzed by western blotting using rabbit anti-ATG5 (12994T, RRID:AB_2630393; Cell Signaling Technology), rabbit anti-VAPA (15275-1-AP; Proteintech), mouse anti-VAPB (66191-1-Ig; Proteintech), and rabbit anti-GAPDH (2118S; Cell Signaling).
Statistics
The statistical analysis and significance are noted in the figure legends for each respective graph. Data are determined to be statistically significant when P < 0.05 by unpaired t test (two-tailed) and one-way ANOVA with post hoc Dunnett’s test. Statistical analyses and tests for normality (via Shapiro–Wilk or Kolmogorov–Smirnov tests) were performed using GraphPad PRISM 9. For combined replicate experiments, data distribution was assumed to be normal but this could not be formally tested.
Online supplemental material
Fig. S1 shows vacuole-like rickettsia–ER interactions with the BiP-mNeonGreen-KDEL ER marker, and the absence of interactions between the ER and L. monocytogenes or S. flexneri. Fig. S2 shows p62 localization across three rickettsial strains, the frequency of ER interactions in ATG5−/− cells, the expression of ATG via western blot, and the frequency of rickettsia–ER interactions by the ompB::Tn strain. Fig. S3 shows the bacterial burdens per cell in RNAi-treated or VAP DKO cells, along with the localization of overexpressed full-length Halo-VAP fusions. Videos 1, 2, and 3 show live-cell imaging of rickettsia–ER interactions. Videos 4 and 5 show segmented FIB-SEM image stacks of rickettsia–ER interactions.
Data availability
The data generated and analyzed in this study are available from the corresponding author upon request. Further information and requests for reagents may be directed to and will be fulfilled by R.L. Lamason, [email protected].
Acknowledgments
We thank Matt Welch (UC Berkeley, Berkeley, CA, USA), Erin Benanti (UC Berkeley, Berkeley, CA, USA), Michelle Reniere (University of Washington, Seattle, WA, USA), Dan Portnoy (UC Berkeley, Berkeley, CA, USA), Jennifer Lippincott-Schwartz (HHMI Janelia Research Campus, Ashburn, VA, USA), Marcia Goldberg (Harvard Medical School, Boston, MA, USA), Iain Cheeseman (Whitehead Institute, Cambridge, MA, USA), and Pietro De Camilli (Yale School of Medicine, New Haven, CT, USA) for the reagents. We thank Jon McGinn, Iain Cheeseman, Adam Martin, and Allison Scott for critical feedback on the manuscript. We thank Nicki Watson for help preparing and imaging the TEM samples.
This work was performed in part at the Harvard University Center for Nanoscale Systems, a member of the National Nanotechnology Coordinated Infrastructure Network, which is supported by the National Science Foundation award no. ECCS-2025158. This work was also performed in part at the Flow Cytometry Core Facility at the Whitehead Institute for Biomedical Research. This work was supported in part by National Institutes of Health Grants no. T32GM007287 (Y. Acevedo-Sánchez), R01GM141025 (R.L. Lamason), and R01AI155489 (R.L. Lamason).
Author contributions: Y. Acevedo-Sánchez: Conceptualization, Data curation, Formal analysis, Funding acquisition, Investigation, Methodology, Project administration, Resources, Software, Supervision, Validation, Visualization, Writing - original draft, Writing - review & editing, P.J. Woida: Conceptualization, Data curation, Formal analysis, Investigation, Methodology, Visualization, Writing - original draft, Writing - review & editing, C. Anderson: Data curation, Formal analysis, Investigation, Methodology, Validation, Visualization, Writing - review & editing, S. Kraemer: Data curation, Formal analysis, Methodology, Resources, Software, Writing - review & editing, R.L. Lamason: Conceptualization, Data curation, Formal analysis, Funding acquisition, Investigation, Methodology, Project administration, Resources, Supervision, Validation, Visualization, Writing - original draft, Writing - review & editing.

