


Severe acute respiratory syndrome coronavirus 2 (SARS-CoV-2) and severe acute respiratory syndrome coronavirus (SARS-CoV) exhibit differences in their inflammatory responses and pulmonary damage, yet the specific mechanisms remain unclear. Here, we discovered that the SARS-CoV-2 nucleocapsid (N) protein inhibits the activation of the nuclear factor-κB (NF-κB) pathway and downstream signal transduction by impeding the assembly of the transforming growth factor β-activated kinase1 (TAK1)–TAK1 binding protein 2/3 (TAB2/3) complex. In contrast, the SARS-CoV N protein does not impact the NF-κB pathway. By comparing the amino acid sequences of the SARS-CoV-2 and SARS-CoV N proteins, we identified Glu-290 and Gln-349 as critical residues in the C-terminal domain (CTD) of the SARS-CoV-2 N protein, essential for its antagonistic function. These findings were further validated in a SARS-CoV-2 trans-complementation system using cellular and animal models. Our results reveal the distinctions in inflammatory responses triggered by SARS-CoV-2 and SARS-CoV, highlighting the significance of specific amino acid alterations in influencing viral pathogenicity.
Introduction
Severe acute respiratory syndrome coronavirus 2 (SARS-CoV-2) and severe acute respiratory syndrome coronavirus (SARS-CoV) are both members of the β-coronavirus family, responsible for the severe acute respiratory syndrome known as COVID-19 (caused by SARS-CoV-2) and SARS (caused by SARS-CoV) (Wu et al., 2020b). While these diseases share some similarities, there are notable differences in transmission speed, incubation period, clinical manifestations, and fatality rates (Hu et al., 2020; Zhu et al., 2020). SARS-CoV-2 is more transmissible than SARS-CoV, has a longer incubation period, and can be spread by asymptomatic individuals (He et al., 2020; Li et al., 2020; Wang et al., 2020). The incubation period for COVID-19 ranges from 2 to 14 days, whereas for SARS it ranges from 2 to 10 days (Huang et al., 2020; Lauer et al., 2020; Qin et al., 2020; Varia et al., 2003). In COVID-19 patients, a high viral load is detected in respiratory secretions early on, even during the incubation period, peaking around the onset of symptoms. In contrast, SARS-CoV reaches its peak viral load ∼10–15 days after symptom onset (Chan et al., 2020; To et al., 2020). Both viruses can cause respiratory symptoms such as fever, cough, and shortness of breath. However, SARS-CoV-2 often leads to mild or asymptomatic disease, contributing to its stealthy spread (Huang et al., 2020; Lee et al., 2003; Zhou et al., 2020). Studies on SARS have shown that a high initial viral load is linked to mortality, whereas no significant differences in viral loads were found between mild and severe cases of COVID-19 (Chu et al., 2004; To et al., 2020). The crude mortality rate of COVID-19 (0.25–5%) is notably lower than that of SARS (∼10%) (Cao et al., 2020; Parashar and Anderson, 2004; Xia et al., 2021). Nonetheless, the increased transmissibility of SARS-CoV-2 has resulted in a higher overall number of fatalities (Petersen et al., 2020; Zhang et al., 2020). Comparative genomic analysis reveals a 79.5% homology between SARS-CoV-2 and SARS-CoV, with 380 amino acid substitution sites identified, which may contribute to the differences in pathogenicity between these two viruses (Chen et al., 2020b; Wu et al., 2020a).
The clinical manifestations of COVID-19 and SARS are closely linked to the immune response and inflammatory reactions triggered by viral infections (Bouayad, 2020; Cameron et al., 2008; Lamers and Haagmans, 2022; Mehta et al., 2020; Wong et al., 2004). Research indicates that a strong viral replication with a lack of inflammatory response in the early stage of infection and low viral replication with a strong inflammatory response in the later stages may contribute to the progression of COVID-19 (Duan et al., 2024; Tian et al., 2020). The SARS-CoV-2 nucleocapsid (N) protein, a structural protein involved in viral replication and assembly, plays a crucial role in the pathogenesis of COVID-19 and antiviral immunity against SARS-CoV-2 (Gorkhali et al., 2021; Wang et al., 2022b; Yu et al., 2023). During the early stages of SARS-CoV-2 infection, the N protein inhibits retinoic acid-inducible gene I (RIG-I)–mediated phosphorylation of TANK binding kinase 1 and interferon regulatory factor 3, thereby preventing their nuclear translocation and the expression of IFN-β (Chen et al., 2020a; Gori Savellini et al., 2021; Wang et al., 2021; Zheng et al., 2022). Furthermore, caspase-6–mediated cleavage of the N protein inhibits the host IFN response to promote efficient viral replication (Chu et al., 2022). The N protein also inhibits RNA interference (RNAi) to evade the innate immune system (Cui et al., 2015; Mu et al., 2020). As the infection progresses, viral replication, transcription, and assembly continue with the involvement of various viral proteins and inflammatory pathways, potentially leading to excessive activation of the innate immune system, resulting in cytokine storm syndrome and disease progression (Chen et al., 2022a; Gao et al., 2022; Nakayama et al., 2022; Pan et al., 2021; Qian et al., 2021; Wu et al., 2021; Xia et al., 2021). In isolated human lung tissue, SARS-CoV-2 exhibited a notably higher viral load and a wider range and intensity of N protein expression compared with SARS-CoV. Despite this, SARS-CoV-2 triggered relatively low levels of IFN and proinflammatory cytokines/chemokines (Chu et al., 2020; Stukalov et al., 2021). Notably, the N proteins of SARS-CoV-2 and SARS-CoV share a significant amino acid sequence homology of 90% (Peng et al., 2020). Current evidence indicates that both SARS-CoV-2 N protein and SARS-CoV N protein have similar functions, interacting with various host cell proteins such as TRIM25 (Gori Savellini et al., 2021; Hu et al., 2017), Smad3 (Wang et al., 2022a; Zhao et al., 2008), and 14-3-3 (Surjit et al., 2005; Tugaeva et al., 2021). However, there remains a gap in comprehensive research regarding the functional differences between the N proteins of SARS-CoV and SARS-CoV-2.
In this study, we analyzed the interactions between the N proteins of SARS-CoV-2 and SARS-CoV with the TAK1–TAB2/3 complex. Our results revealed significant disparities at key sites that affect the activation of the nuclear factor κB (NF-κB) pathway and subsequent inflammatory response. These findings enhance our understanding of the distinct pathogenicity between the two viruses, shedding light on the molecular mechanisms behind the early latent infection and initially subtle clinical symptoms of SARS-CoV-2. This study also refines the principle that specific amino acid alterations influence viral pathogenicity, providing valuable insights for future prevention and control strategies against similar virus outbreaks.
Results
SARS-CoV-2 N protein inhibits NF-κB pathway, unlike SARS-CoV N protein
NF-κB plays a pivotal role in inflammation and significantly influences the development and progression of various diseases (Lawrence, 2009). To investigate the effects of SARS-CoV-2 proteins on NF-κB activation, we constructed 15 eukaryotic expression plasmids encoding SARS-CoV-2 proteins (NSP1, NSP2, NSP3N, NSP7, NSP8, NSP9, NSP13, NSP15, NSP16, ORF3a, ORF7a, ORF8, and ORF9a) and two variants of the SARS-CoV-2 spike protein receptor-binding domain (RBD V1 and RBD V2). Western blot analysis confirmed the successful expression of all these proteins (Fig. S1 A). Subsequently, we evaluated the impact of SARS-CoV-2 proteins on NF-κB promoter activation. HEK293 cells were transiently transfected with either an empty plasmid or plasmids expressing SARS-CoV-2 proteins, along with an NF-κB promoter-driven luciferase reporter plasmid (NF-κB-Luc) and a control pRL-TK plasmid. After 24 h, the cells were stimulated with Sendai virus (SeV) for 10 h or interleukin-1β (IL-1β) for 4 h, and luciferase activity was measured (Fig. S1 B). The results showed that NSP3N, NSP13, and N proteins significantly inhibited NF-κB activation triggered by SeV and IL-1β, whereas NSP1 proteins had an opposing effect (Fig. 1, A and B). These findings suggest that SARS-CoV-2 proteins exhibit a multifaceted role in modulating the host’s inflammatory immune response.
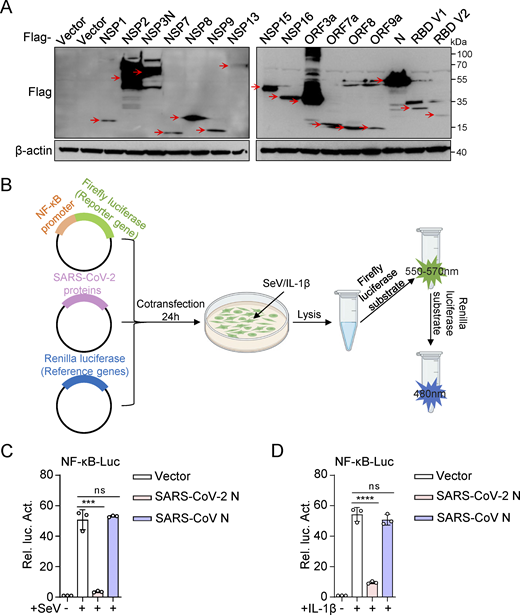
SARS-CoV-2 N protein inhibits SeV and IL-1β–mediated NF-κB promoter’s activation. (A) HEK293 cells were transfected with plasmids expressing the indicated SARS-CoV-2 proteins. At 48 h after transfection, lysates were subjected to immunoblot analysis. (B) Dual luciferase reporter system screened SARS-CoV-2 proteins that interfered with the activation of the NF-κB pathway. (C and D) HEK293 cells were transfected with NF-κB-Luc, along with plasmids encoding Flag-SARS-CoV-2 N protein or Flag-SARS-CoV N protein. At 24 h after transfection, cells were stimulated by SeV for 10 h (C) or IL-1β for 4 h (D), and luciferase activity was measured. Graphs show mean ± SEM (n = 3 in C and D). ***P < 0.001, ****P < 0.0001, ns, not significant (unpaired, two-tailed Student’s t test). Data in A are expressed at least twice in independent experiments, and one representative is shown. Data in C and D are expressed in at least three independent experiments. Source data are available for this figure: SourceData FS1.
SARS-CoV-2 N protein inhibits SeV and IL-1β–mediated NF-κB promoter’s activation. (A) HEK293 cells were transfected with plasmids expressing the indicated SARS-CoV-2 proteins. At 48 h after transfection, lysates were subjected to immunoblot analysis. (B) Dual luciferase reporter system screened SARS-CoV-2 proteins that interfered with the activation of the NF-κB pathway. (C and D) HEK293 cells were transfected with NF-κB-Luc, along with plasmids encoding Flag-SARS-CoV-2 N protein or Flag-SARS-CoV N protein. At 24 h after transfection, cells were stimulated by SeV for 10 h (C) or IL-1β for 4 h (D), and luciferase activity was measured. Graphs show mean ± SEM (n = 3 in C and D). ***P < 0.001, ****P < 0.0001, ns, not significant (unpaired, two-tailed Student’s t test). Data in A are expressed at least twice in independent experiments, and one representative is shown. Data in C and D are expressed in at least three independent experiments. Source data are available for this figure: SourceData FS1.
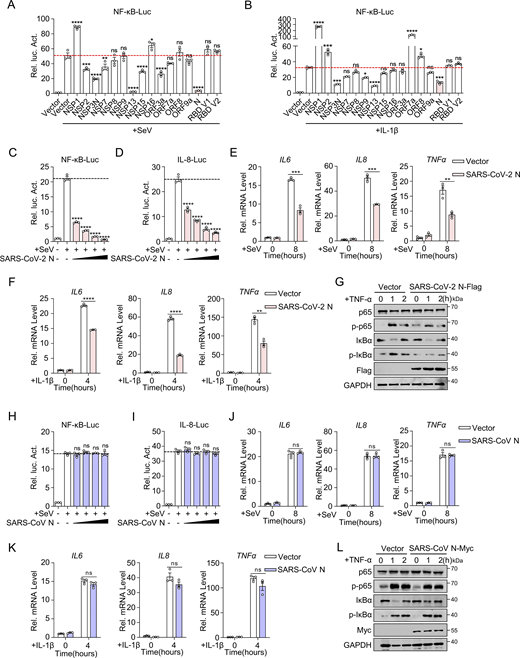
SARS-CoV-2 N protein inhibits NF-κB pathway, unlike SARS-CoV N protein. (A and B) HEK293 cells were transfected with NF-κB-Luc, along with plasmids encoding the indicated Flag-SARS-CoV-2 proteins. At 24 h after transfection, cells were infected with SeV (A) for 10 h or stimulated by IL-1β (B) for 4 h, and luciferase activity was measured. (C and D) HEK293 cells were transfected with NF-κB-luc (C) or IL-8-luc (D), along with increasing amounts of plasmids encoding Flag-SARS-CoV-2 N protein. Cells were infected with SeV for 10 h and assayed for luciferase activity. (E and F) HeLa cells were transfected with the plasmid encoding Flag-SARS-CoV-2 N protein for 24 h, cells were infected with SeV (E) for 8 h or stimulated by IL-1β (F) for 4 h, and total RNA extracted from the cells was evaluated by RT-qPCR. (G) A549 cells were transfected with the plasmid encoding Flag-SARS-CoV-2 N protein at 24 h after transfection; cells were stimulated by TNF-α for 0, 1, 2 h. The lysates were harvested for immunoblot analysis. (H and I) HEK293 cells were transfected with NF-κB-Luc (H) or IL-8-Luc (I), along with increasing amounts of plasmids encoding Flag-SARS-CoV N protein. Cells were infected with SeV for 10 h and assayed for luciferase activity. (J and K) HeLa cells were transfected with the plasmid encoding Flag-SARS-CoV N protein for 24 h, cells were infected with SeV (J) for 8 h or stimulated by IL-1β (K) for 4 h, and total RNA extracted from the cells was evaluated by RT-qPCR. (L) A549 cells were transfected with the plasmid encoding Myc-SARS-CoV N protein, at 24 h after transfection, cells were stimulated by TNF-α for 0, 1, 2 h. The lysates were harvested for immunoblot analysis. Horizontal lines in figures represent the average value of the positive control group. Graphs show mean ± SEM (n = 3 in A–F and H–K) from one representative experiment. *P < 0.05, **P < 0.01, ***P < 0.001, ****P < 0.0001, ns, not significant (unpaired, two-tailed Student’s t test). Data in G and L are done at least twice, and one representative is shown. Data in A–F and H–K are done in at least three independent experiments. Source data are available for this figure: SourceData F1.
SARS-CoV-2 N protein inhibits NF-κB pathway, unlike SARS-CoV N protein. (A and B) HEK293 cells were transfected with NF-κB-Luc, along with plasmids encoding the indicated Flag-SARS-CoV-2 proteins. At 24 h after transfection, cells were infected with SeV (A) for 10 h or stimulated by IL-1β (B) for 4 h, and luciferase activity was measured. (C and D) HEK293 cells were transfected with NF-κB-luc (C) or IL-8-luc (D), along with increasing amounts of plasmids encoding Flag-SARS-CoV-2 N protein. Cells were infected with SeV for 10 h and assayed for luciferase activity. (E and F) HeLa cells were transfected with the plasmid encoding Flag-SARS-CoV-2 N protein for 24 h, cells were infected with SeV (E) for 8 h or stimulated by IL-1β (F) for 4 h, and total RNA extracted from the cells was evaluated by RT-qPCR. (G) A549 cells were transfected with the plasmid encoding Flag-SARS-CoV-2 N protein at 24 h after transfection; cells were stimulated by TNF-α for 0, 1, 2 h. The lysates were harvested for immunoblot analysis. (H and I) HEK293 cells were transfected with NF-κB-Luc (H) or IL-8-Luc (I), along with increasing amounts of plasmids encoding Flag-SARS-CoV N protein. Cells were infected with SeV for 10 h and assayed for luciferase activity. (J and K) HeLa cells were transfected with the plasmid encoding Flag-SARS-CoV N protein for 24 h, cells were infected with SeV (J) for 8 h or stimulated by IL-1β (K) for 4 h, and total RNA extracted from the cells was evaluated by RT-qPCR. (L) A549 cells were transfected with the plasmid encoding Myc-SARS-CoV N protein, at 24 h after transfection, cells were stimulated by TNF-α for 0, 1, 2 h. The lysates were harvested for immunoblot analysis. Horizontal lines in figures represent the average value of the positive control group. Graphs show mean ± SEM (n = 3 in A–F and H–K) from one representative experiment. *P < 0.05, **P < 0.01, ***P < 0.001, ****P < 0.0001, ns, not significant (unpaired, two-tailed Student’s t test). Data in G and L are done at least twice, and one representative is shown. Data in A–F and H–K are done in at least three independent experiments. Source data are available for this figure: SourceData F1.
The SARS-CoV-2 N protein is crucial in the viral life cycle and host antiviral immunity (Gorkhali et al., 2021). Given the structural and functional similarities of the N proteins in SARS-CoV and SARS-CoV-2 (Kannan et al., 2020; Maghsood et al., 2023), we conducted a comparative experiment to identify the impact of the SARS-CoV N protein on the NF-κB pathway. Interestingly, the exogenous expression of the SARS-CoV N protein did not significantly affect NF-κB promoter activation triggered by SeV and IL-1β (Fig. S1, C and D). This observation prompted us to redirect our investigation toward elucidating the differences in the regulatory roles of the SARS-CoV-2 N protein and the SARS-CoV N protein within the NF-κB pathway.
We found that the SARS-CoV-2 N protein exhibited a dose-dependent inhibition of NF-κB and IL-8 reporter activations (Fig. 1, C and D). Furthermore, the SARS-CoV-2 N protein suppressed the mRNA levels of SeV and IL-1β–induced proinflammatory cytokines, including IL6, IL8, and TNFα (Fig. 1, E and F). Additionally, tumor necrosis factor-α (TNF-α)–induced phosphorylation of RELA (p65) and inhibitor κ B α (IκBα), indicative of NF-κB activation, was notably reduced in cells with overexpressing the N protein (Fig. 1 G). These results illustrate that the SARS-CoV-2 N protein hinders NF-κB signaling activity triggered by SeV, IL-1β, and TNF-α. Conversely, the SARS-CoV N protein did not affect the activity of NF-κB and IL-8 promoters triggered by SeV (Fig. 1, H and I), nor the expression of proinflammatory cytokines (IL6, IL8, and TNFα) induced by SeV and IL-1β (Fig. 1, J and K). Moreover, the SARS-CoV N protein did not affect the phosphorylation of p65 and IκBα during TNF-α–mediated NF-κB signaling activation compared with the control group (Fig. 1 L). This indicates that the NF-κB pathway triggered by SeV, IL-1β, and TNF-α was not markedly influenced by the SARS-CoV N protein. These results collectively suggest potential variations in the control of inflammatory immune response between the N proteins of SARS-CoV-2 and SARS-CoV, underscoring the importance of further research into their molecular mechanisms and biological implications.
SARS-CoV-2 N protein triggers a weaker inflammatory response than SARS-CoV N protein during viral infection
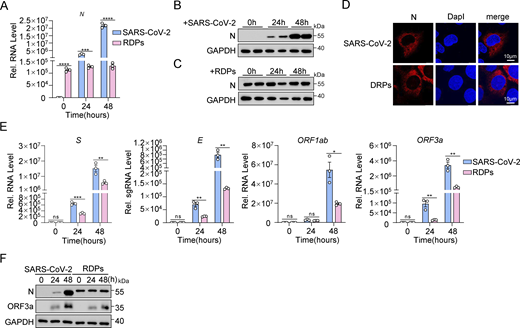
Subsequently, we investigated the actual impact of the N protein on the inflammatory response at the cellular level during SARS-CoV-2 infection. Previous studies have indicated that the presence of the N protein can exacerbate inflammatory reactions (Gao et al., 2022; Nakayama et al., 2022; Wu et al., 2021). However, it is challenging to determine if this heightened response is solely due to the N protein or if viral replication induced by the N protein also contributes to inflammation. Recent work by Ju et al. (2021) addressed some of these limitations. Building on this foundation, we developed an optimized high-throughput SARS-CoV-2 dual reporter transcomplementation system (Li et al., 2024). We engineered SARS-CoV-2 ΔN-GFP-HiBiT replicon delivery particles (RDPs) and established Caco-2-N* cell lines expressing stable levels of SARS-CoV-2 N and SARS-CoV N proteins (Caco-2-SARS-CoV-2 N and Caco-2-SARS-CoV N cells). The titer of RDPs was determined by TCID50 analysis, and the cells were subsequently infected with RDPs at a multiplicity of infection (MOI) of 0.01. GFP fluorescence and viral RNA levels were assessed at 12, 24, and 48 h after infection using flow cytometry and quantitative RT-PCR (RT-qPCR), respectively (Fig. 2 A). Within 48 h after infection, strong GFP fluorescence was observed in both cell types, indicating active viral genome replication and transcription (Fig. 2 B). When expression levels of the two N proteins were consistent (Fig. 2 C), the replication level of RDPs was significantly higher in Caco-2-SARS-CoV-2 N cells compared with Caco-2-SARS-CoV N cells, as shown by RT-qPCR and flow cytometry analysis (Fig. 2, D and E). Interestingly, mRNA levels of IL6, TNFα, IL1β, IL8, and CCL2 were notably lower in RDPs-infected Caco-2-SARS-CoV-2 N cells compared with Caco-2-SARS-CoV N cells (Fig. 2 F). These results suggest that the SARS-CoV-2 N protein triggers a weaker inflammatory response than the SARS-CoV N protein during viral infection.

SARS-CoV-2 N protein induces a weaker inflammatory response than SARS-CoV N protein during viral infection. (A) Schematic representation of N variant function assessment. Caco-2 cells stably expressing N variants via lentiviral transduction were infected with RDPs, followed by analysis of GFP expression through flow cytometry or microscopy, and viral RNA analyzed by RT-qPCR. (B–F) Caco-2 cells stably expressing N variants were infected with RDPs for 12, 24, or 48 h, and the GFP expression was analyzed by microscopy (B) or flow cytometry (D). Scale bars, 100 μm. Total RNA extracted from the cells was evaluated by RT-qPCR (C, E, and F). Graphs show mean ± SEM (n = 3 in C, E, and F) from one representative experiment. **P < 0.01, ***P < 0.001, ****P < 0.0001, ns, not significant (unpaired, two-tailed Student’s t test). Data are representative of three independent experiments.
SARS-CoV-2 N protein induces a weaker inflammatory response than SARS-CoV N protein during viral infection. (A) Schematic representation of N variant function assessment. Caco-2 cells stably expressing N variants via lentiviral transduction were infected with RDPs, followed by analysis of GFP expression through flow cytometry or microscopy, and viral RNA analyzed by RT-qPCR. (B–F) Caco-2 cells stably expressing N variants were infected with RDPs for 12, 24, or 48 h, and the GFP expression was analyzed by microscopy (B) or flow cytometry (D). Scale bars, 100 μm. Total RNA extracted from the cells was evaluated by RT-qPCR (C, E, and F). Graphs show mean ± SEM (n = 3 in C, E, and F) from one representative experiment. **P < 0.01, ***P < 0.001, ****P < 0.0001, ns, not significant (unpaired, two-tailed Student’s t test). Data are representative of three independent experiments.
Additionally, we compared viral protein expression and N protein localization in Caco-2 cells infected with SARS-CoV-2 (MOI 0.01) and in Caco-2-SARS-CoV-2 N cells infected with RDPs at the same MOI. RT-qPCR and western blot analyses revealed differences in N protein expression between the two infection models (Fig. S2, A–C). The expression of the N protein in SARS-CoV-2–infected cells increased gradually, correlating with the viral titer and duration of infection. In contrast, N protein expression in Caco-2-N cells infected with RDPs did not exhibit a gradual increase over time but was instead influenced by cell density and growth conditions. Confocal microscopy analysis demonstrated that the exogenously expressed N protein exhibited the same intracellular localization as the virus-expressed N protein in both infection models (Fig. S2 D). Moreover, mRNA levels of S, E, ORF1ab, and ORF3a were lower in RDP-infected cells than in SARS-CoV-2–infected cells, though all increased similarly over time (Fig. S2 E). Western blot analysis also showed that ORF3a protein expression rose in both infections, but was higher in SARS-CoV-2–infected cells, while the growth trends were comparable (Fig. S2 F). Overall, these findings suggest that, aside from the level of N protein expression, viral RNA levels in RDP-infected cells closely resemble those observed in authentic SARS-CoV-2 infections, indicating that the RDP system effectively mimics the actual virus.
The RDP system simulates SARS-CoV-2 infection. (A–C) Caco-2 cells were infected with SARS-CoV-2 at an MOI of 0.01 and Caco-2-SARS-CoV-2 N cells were infected with RDPs at an MOI of 0.01 for 24 and 48 h. RNA extracted from the cells was evaluated by RT-qPCR (A) and lysates were subjected to immunoblot analysis (B and C). (D) Caco-2 cells were infected with SARS-CoV-2 at an MOI of 0.05 and Caco-2-SARS-CoV-2 N cells were infected with RDPs at an MOI of 0.05 for 48 h. Nucleus marker DAPI (blue) and SARS-CoV-2 N (red) were then visualized with confocal microscopy. Scale bars, 10 μm. (E and F) Caco-2 cells were infected with SARS-CoV-2 at an MOI of 0.01 and Caco-2-SARS-CoV-2 N cells were infected with RDPs at an MOI of 0.01 for 24 and 48 h. RNA extracted from the cells was evaluated by RT-qPCR (E), and lysates were subjected to immunoblot analysis (F). Graphs show mean ± SEM (n = 3 in A and E). *P < 0.05, **P < 0.01, ***P < 0.001, ****P < 0.0001, ns, not significant (unpaired, two-tailed Student’s t test). Data in B–D and F are expressed at least twice in independent experiments, and one representative is shown. Data in A and E are expressed in at least three independent experiments. Source data are available for this figure: SourceData FS2.
The RDP system simulates SARS-CoV-2 infection. (A–C) Caco-2 cells were infected with SARS-CoV-2 at an MOI of 0.01 and Caco-2-SARS-CoV-2 N cells were infected with RDPs at an MOI of 0.01 for 24 and 48 h. RNA extracted from the cells was evaluated by RT-qPCR (A) and lysates were subjected to immunoblot analysis (B and C). (D) Caco-2 cells were infected with SARS-CoV-2 at an MOI of 0.05 and Caco-2-SARS-CoV-2 N cells were infected with RDPs at an MOI of 0.05 for 48 h. Nucleus marker DAPI (blue) and SARS-CoV-2 N (red) were then visualized with confocal microscopy. Scale bars, 10 μm. (E and F) Caco-2 cells were infected with SARS-CoV-2 at an MOI of 0.01 and Caco-2-SARS-CoV-2 N cells were infected with RDPs at an MOI of 0.01 for 24 and 48 h. RNA extracted from the cells was evaluated by RT-qPCR (E), and lysates were subjected to immunoblot analysis (F). Graphs show mean ± SEM (n = 3 in A and E). *P < 0.05, **P < 0.01, ***P < 0.001, ****P < 0.0001, ns, not significant (unpaired, two-tailed Student’s t test). Data in B–D and F are expressed at least twice in independent experiments, and one representative is shown. Data in A and E are expressed in at least three independent experiments. Source data are available for this figure: SourceData FS2.
SARS-CoV-2 N protein interacts with TAB2 and TAB3
To investigate the inhibitory effect of the SARS-CoV-2 N protein on the NF-κB pathway, we co-transfected plasmids encoding the SARS-CoV-2 N protein with those encoding NF-κB pathway adaptors and assessed NF-κB promoter activity (Fig. S3 A). Our results showed that the SARS-CoV-2 N protein inhibited NF-κB promoter activity induced by RIG-I, MDA5, MAVS, TRAF6, TAK1, TAB1, TAB2, and TAB3, but not IKKβ or p65. Conversely, the SARS-CoV N protein did not impact NF-κB activation induced by these adaptors (Fig. S3 B). Additionally, we observed that the SARS-CoV-2 N protein dose-dependently inhibited NF-κB promoter activation triggered by MDA5, MAVS, TAK1 and TAB1, TAB2, or TAB3 (Fig. S3 C). Overexpression of the SARS-CoV-2 N protein also suppressed the activation of TAK1 and TAB1, TAB2, and TAB3-mediated IL-8 promoter (Fig. S3 D). These findings suggested that the SARS-CoV-2 N protein targets the upstream of the IKK complex, potentially targeting the TAK1–TAB1/2/3 complex.
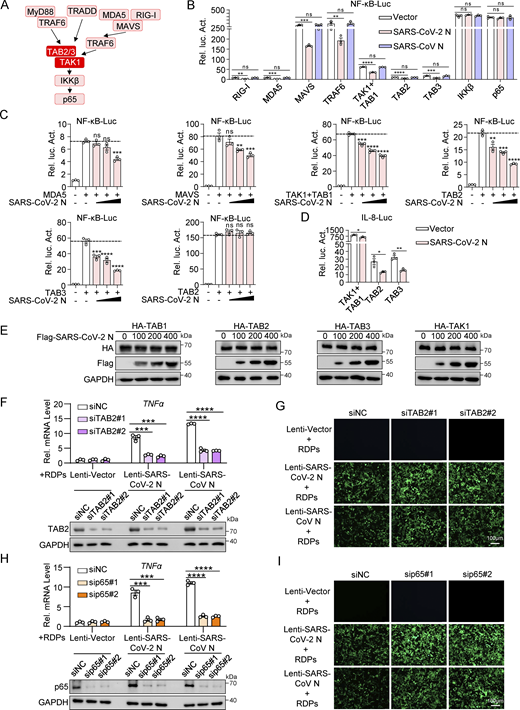
SARS-CoV-2 N protein inhibits the activation of NF-κB promoter by TAK1-TAB1/2/3 complex. (A) Schematic diagram of the NF-κB pathway. (B) HEK293 cells were transfected with NF-κB-luc, Flag-empty vector, Flag-SARS-CoV-2 N protein, or Flag-SARS-CoV N protein together with plasmids encoding Flag-RIG-I, Flag-MDA5, Flag-MAVS, Flag-TRAF6, Flag-TAK1, Flag-TAB1, Flag-TAB2, Flag-TAB3, Flag-IKKβ, and Flag-p65. Lysates were collected at 24 h after transfection and luciferase activities were tested. (C) HEK293 cells were transfected with NF-κB-luc, Flag-empty vector, and the increasing amount of Flag-SARS-CoV-2 N protein together with plasmids encoding Flag-MDA5, Flag-MAVS, Flag-TAK1, Flag-TAB1, Flag-TAB2, Flag-TAB3, and Flag-IKKβ. Lysates were collected at 24 h after transfection and luciferase activities were tested. (D) HEK293 cells were transfected with IL-8-luc, Flag-empty vector, and Flag-SARS-CoV-2 N protein together with plasmids encoding Flag-TAK1, Flag-TAB1, Flag-TAB2, and Flag-TAB3. Lysates were collected at 24 h after transfection and luciferase activities were tested. (E) HEK293T cells were transfected with increasing amounts of Flag-SARS-CoV-2 N protein together with HA-TAK1/TAB1/TAB2/TAB3. Lysates were subjected to immunoblot analysis. (F–I) Caco-2 cells stably expressing either SARS-CoV-2 or SARS-CoV N proteins were transfected with siRNA targeting TAB2, p65, or negative control siRNA (siNC). 48 h after transfection, the cells were infected with RDPs for another 48 h. RNA was extracted from the cells for RT-qPCR analysis and lysates were subjected to immunoblot analysis (F and H), or GFP expression was analyzed by microscopy (G and I). Horizontal lines in figures represent the average value of the positive control group. Graphs show mean ± SEM (n = 3 in B–D, F, and H). *P < 0.05, **P < 0.01, ***P < 0.001, ****P < 0.0001, ns, not significant (unpaired, two-tailed Student’s t test). Data in E–I are expressed at least twice in independent experiments, and one representative is shown. Data in B–D are expressed in at least three independent experiments. Source data are available for this figure: SourceData FS3.
SARS-CoV-2 N protein inhibits the activation of NF-κB promoter by TAK1-TAB1/2/3 complex. (A) Schematic diagram of the NF-κB pathway. (B) HEK293 cells were transfected with NF-κB-luc, Flag-empty vector, Flag-SARS-CoV-2 N protein, or Flag-SARS-CoV N protein together with plasmids encoding Flag-RIG-I, Flag-MDA5, Flag-MAVS, Flag-TRAF6, Flag-TAK1, Flag-TAB1, Flag-TAB2, Flag-TAB3, Flag-IKKβ, and Flag-p65. Lysates were collected at 24 h after transfection and luciferase activities were tested. (C) HEK293 cells were transfected with NF-κB-luc, Flag-empty vector, and the increasing amount of Flag-SARS-CoV-2 N protein together with plasmids encoding Flag-MDA5, Flag-MAVS, Flag-TAK1, Flag-TAB1, Flag-TAB2, Flag-TAB3, and Flag-IKKβ. Lysates were collected at 24 h after transfection and luciferase activities were tested. (D) HEK293 cells were transfected with IL-8-luc, Flag-empty vector, and Flag-SARS-CoV-2 N protein together with plasmids encoding Flag-TAK1, Flag-TAB1, Flag-TAB2, and Flag-TAB3. Lysates were collected at 24 h after transfection and luciferase activities were tested. (E) HEK293T cells were transfected with increasing amounts of Flag-SARS-CoV-2 N protein together with HA-TAK1/TAB1/TAB2/TAB3. Lysates were subjected to immunoblot analysis. (F–I) Caco-2 cells stably expressing either SARS-CoV-2 or SARS-CoV N proteins were transfected with siRNA targeting TAB2, p65, or negative control siRNA (siNC). 48 h after transfection, the cells were infected with RDPs for another 48 h. RNA was extracted from the cells for RT-qPCR analysis and lysates were subjected to immunoblot analysis (F and H), or GFP expression was analyzed by microscopy (G and I). Horizontal lines in figures represent the average value of the positive control group. Graphs show mean ± SEM (n = 3 in B–D, F, and H). *P < 0.05, **P < 0.01, ***P < 0.001, ****P < 0.0001, ns, not significant (unpaired, two-tailed Student’s t test). Data in E–I are expressed at least twice in independent experiments, and one representative is shown. Data in B–D are expressed in at least three independent experiments. Source data are available for this figure: SourceData FS3.
We next investigated the interaction between SARS-CoV-2 N proteins and the TAK1–TAB1/2/3 complex. Co-immunoprecipitation assays indicated that the SARS-CoV-2 N protein is specifically bound to TAB2 and TAB3, but not TAK1 or TAB1 (Fig. 3, A and B). To confirm this interaction, we conducted His pull-down experiments using E. coli-purified His-SARS-CoV-2 N protein along with GST-TAK1, GST-TAB2, and GST-TAB3 proteins, which demonstrated a direct interaction between the SARS-CoV-2 N protein and TAB2/TAB3 (Fig. 3 C). Confocal microscopy analysis demonstrated significant colocalization between the SARS-CoV-2 N protein and TAB2/TAB3 in HeLa cells expressing DsRed-SARS-CoV-2 N and GFP-TAB2/GFP-TAB3 (Fig. 3 D). Endogenous immunoprecipitation assays consistently showed an interaction between the N protein and TAB2/TAB3 in HEK293T cells, independent of TNF-α treatment (Fig. 3 E). Moreover, this interaction was also observed during viral replication in SARS-CoV-2–infected Caco-2 cells (Fig. 3 F). Immunofluorescence analysis in Huh7 cells showed increased colocalization of the N protein with TAB2 and TAB3 as SARS-CoV-2 infection progressed (Fig. 3, G and H). These results collectively suggest that the SARS-CoV-2 N protein specifically targets TAB2 and TAB3 to inhibit NF-κB activation.
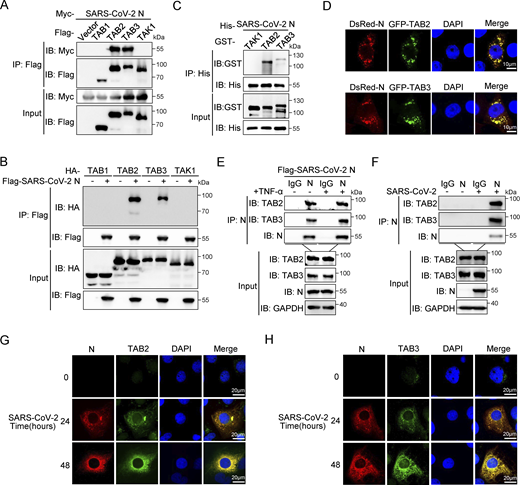
SARS-CoV-2 N protein interacts with TAB2 and TAB3. (A) Immunoprecipitation (IP) (anti-Flag) and immunoblot (IB) analysis of the interaction between Flag-TAB1/TAB2/TAB3/TAK1 and Myc-SARS-CoV-2 N protein in co-transfected HEK293T cells. (B) Immunoprecipitation (anti-Flag) and immunoblot analysis of the interaction between Flag-SARS-CoV-2 N protein and HA-TAB1/TAB2/TAB3/TAK1 in co-transfected HEK293T cells. (C) His-SARS-CoV-2 N protein, purified from E. coli, was incubated with E. coli–purified GST-TAK1/TAB2/TAB3 proteins for 6 h, the mixture was subjected to immunoprecipitation (anti-His) and immunoblot analysis. (D) HeLa cells were transfected with plasmids encoding DsRed-SARS-CoV-2 N and GFP-TAB2/TAB3 for 24 h. Nucleus marker DAPI (blue), DsRed-SARS-CoV-2 N (red), and GFP-TAB2/TAB3 (green) were then visualized with confocal microscopy. Scale bars, 10 μm. (E) HEK293T cells were transfected with the plasmid encoding Flag-SARS-CoV-2 N protein for 48 h, followed by TNF-α treatment for 4 h. Lysates were subjected to immunoprecipitation (anti-SARS-CoV-2 N protein) and immunoblot analysis. (F) Caco-2 cells were infected with SARS-CoV-2 at an MOI of 0.02 for 24 h. Lysates were subjected to immunoprecipitation (anti-SARS-CoV-2 N protein) and immunoblot analysis. (G and H) Huh7 cells were infected with SARS-CoV-2 at an MOI of 0.05 for 24 and 48 h, Nucleus marker DAPI (blue), SARS-CoV-2 N (red), and TAB2 (G)/TAB3 (H) (green) were then visualized with confocal microscopy. Scale bars, 20 μm. Data are done at least twice, and one representative is shown. Source data are available for this figure: SourceData F3.
SARS-CoV-2 N protein interacts with TAB2 and TAB3. (A) Immunoprecipitation (IP) (anti-Flag) and immunoblot (IB) analysis of the interaction between Flag-TAB1/TAB2/TAB3/TAK1 and Myc-SARS-CoV-2 N protein in co-transfected HEK293T cells. (B) Immunoprecipitation (anti-Flag) and immunoblot analysis of the interaction between Flag-SARS-CoV-2 N protein and HA-TAB1/TAB2/TAB3/TAK1 in co-transfected HEK293T cells. (C) His-SARS-CoV-2 N protein, purified from E. coli, was incubated with E. coli–purified GST-TAK1/TAB2/TAB3 proteins for 6 h, the mixture was subjected to immunoprecipitation (anti-His) and immunoblot analysis. (D) HeLa cells were transfected with plasmids encoding DsRed-SARS-CoV-2 N and GFP-TAB2/TAB3 for 24 h. Nucleus marker DAPI (blue), DsRed-SARS-CoV-2 N (red), and GFP-TAB2/TAB3 (green) were then visualized with confocal microscopy. Scale bars, 10 μm. (E) HEK293T cells were transfected with the plasmid encoding Flag-SARS-CoV-2 N protein for 48 h, followed by TNF-α treatment for 4 h. Lysates were subjected to immunoprecipitation (anti-SARS-CoV-2 N protein) and immunoblot analysis. (F) Caco-2 cells were infected with SARS-CoV-2 at an MOI of 0.02 for 24 h. Lysates were subjected to immunoprecipitation (anti-SARS-CoV-2 N protein) and immunoblot analysis. (G and H) Huh7 cells were infected with SARS-CoV-2 at an MOI of 0.05 for 24 and 48 h, Nucleus marker DAPI (blue), SARS-CoV-2 N (red), and TAB2 (G)/TAB3 (H) (green) were then visualized with confocal microscopy. Scale bars, 20 μm. Data are done at least twice, and one representative is shown. Source data are available for this figure: SourceData F3.
SARS-CoV-2 N protein inhibits the TAK1–TAB2/3 complex formation
The formation of the TAK1–TAB2/3 complex is a crucial step in activating the NF-κB pathway (Braun and Staal, 2020; Shinohara et al., 2016; Xu and Lei, 2021). To investigate whether the SARS-CoV-2 N protein inhibits the formation of the TAK1–TAB2/3 complex, we first examined the protein levels of TAK1, TAB1, TAB2, and TAB3 following the overexpression of the SARS-CoV-2 N protein. Our results showed that the levels of these proteins remained unchanged despite increasing doses of SARS-CoV-2 N protein (Fig. S3 E), suggesting that the SARS-CoV-2 N protein did not impact the stability of TAB2 and TAB3. Co-immunoprecipitation analysis showed that the SARS-CoV-2 N protein competed with TAK1 for binding to TAB2 (Fig. 4 A). Additionally, we observed that the SARS-CoV-2 N protein attenuated the interaction between endogenous TAK1 and TAB2, both in the resting state and upon TNF-α stimulation (Fig. 4 B). To investigate the interaction patterns between the SARS-CoV-2 N protein and the TAK1–TAB2 complex, we generated TAB2 truncated mutants of varying lengths (1–392aa, 1–496aa, 1–574aa, and 1–653aa) (Fig. 4 C). Co-immunoprecipitation analysis revealed that both TAK1 and SARS-CoV-2 N proteins specifically interacted with the 496–574aa region of TAB2 (Fig. 4, D and E). In contrast, the SARS-CoV N protein interacted with wild-type TAB2 and all four truncation mutants (Fig. 4 F). Notably, the interaction between TAK1 and TAB2 was unaffected by the presence of the SARS-CoV N protein (Fig. 4, G and H). These results suggest that the SARS-CoV-2 N protein disrupts the TAK1–TAB2 interaction by binding to the TBD (496–574aa) region of TAB2, while the SARS-CoV N protein does not impact the TAK1–TAB2 complex.
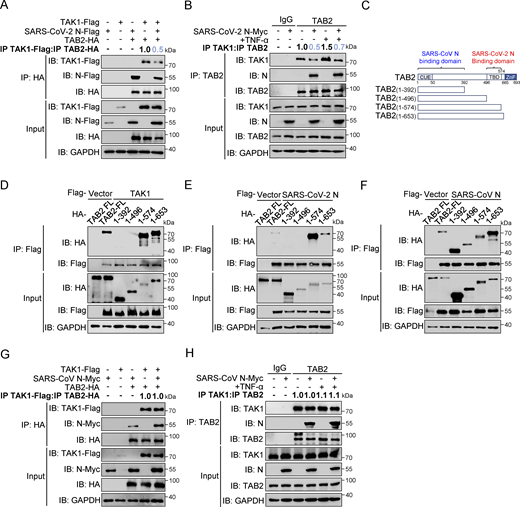
SARS-CoV-2 N protein inhibits the binding between TAK1 and TAB2, unlike SARS-CoV N protein. (A) HEK293T cells were transfected with Flag-TAK1, Flag-SARS-CoV-2 N, Flag-empty vector, HA-TAB2, and HA-empty vector. Lysates were collected for immunoprecipitation (IP) (anti-HA) and immunoblot (IB) analysis. The ratio of the gray value between IP TAK1-Flag and IP TAB2-HA was determined. (B) HEK293T cells were transfected with Myc-empty vector or Myc-SARS-CoV-2 N for 48 h, followed by TNF-α treatment for 4 h. Lysates were subjected to immunoprecipitation (anti-TAB2) and immunoblot analysis. The ratio of the gray value between IP TAK1 and IP TAB2 was determined. (C) Domain organization of TAB2 and its truncated mutants. CUE, Ubiquitin binding domain; TBD, TAK1 binding domain; NZF, NLP4-like zinc finger domain. (D–F) HEK293T cells were transfected Flag-empty vector, Flag-TAK1 (D), Flag-SARS-CoV-2 N (E), or Flag-SARS-CoV N (F) along with HA-TAB2 full-length (FL), HA-TAB2 (1–392aa), HA-TAB2 (1–496aa), HA-TAB2 (1–574aa), and HA-TAB2 (1–653aa). Lysates were subjected to immunoprecipitation (anti-Flag) and immunoblot analysis. (G) HEK293T cells were transfected with Flag-TAK1, Flag-empty vector, Myc-SARS-CoV N, Myc-empty vector, HA-TAB2, and HA-empty vector. Lysates were collected for immunoprecipitation (anti-HA) and immunoblot analysis. The ratio of the gray value between IP TAK1-Flag and IP TAB2-HA was determined. (H) HEK293T cells were transfected with Myc-empty vector or Myc-SARS-CoV N for 48 h, followed with TNF-α treatment for 4 h. Lysates were subjected to immunoprecipitation (anti-TAB2) and immunoblot analysis. The ratio of the gray value between IP TAK1 and IP TAB2 was determined. Data are done at least twice, and one representative is shown. Source data are available for this figure: SourceData F4.
SARS-CoV-2 N protein inhibits the binding between TAK1 and TAB2, unlike SARS-CoV N protein. (A) HEK293T cells were transfected with Flag-TAK1, Flag-SARS-CoV-2 N, Flag-empty vector, HA-TAB2, and HA-empty vector. Lysates were collected for immunoprecipitation (IP) (anti-HA) and immunoblot (IB) analysis. The ratio of the gray value between IP TAK1-Flag and IP TAB2-HA was determined. (B) HEK293T cells were transfected with Myc-empty vector or Myc-SARS-CoV-2 N for 48 h, followed by TNF-α treatment for 4 h. Lysates were subjected to immunoprecipitation (anti-TAB2) and immunoblot analysis. The ratio of the gray value between IP TAK1 and IP TAB2 was determined. (C) Domain organization of TAB2 and its truncated mutants. CUE, Ubiquitin binding domain; TBD, TAK1 binding domain; NZF, NLP4-like zinc finger domain. (D–F) HEK293T cells were transfected Flag-empty vector, Flag-TAK1 (D), Flag-SARS-CoV-2 N (E), or Flag-SARS-CoV N (F) along with HA-TAB2 full-length (FL), HA-TAB2 (1–392aa), HA-TAB2 (1–496aa), HA-TAB2 (1–574aa), and HA-TAB2 (1–653aa). Lysates were subjected to immunoprecipitation (anti-Flag) and immunoblot analysis. (G) HEK293T cells were transfected with Flag-TAK1, Flag-empty vector, Myc-SARS-CoV N, Myc-empty vector, HA-TAB2, and HA-empty vector. Lysates were collected for immunoprecipitation (anti-HA) and immunoblot analysis. The ratio of the gray value between IP TAK1-Flag and IP TAB2-HA was determined. (H) HEK293T cells were transfected with Myc-empty vector or Myc-SARS-CoV N for 48 h, followed with TNF-α treatment for 4 h. Lysates were subjected to immunoprecipitation (anti-TAB2) and immunoblot analysis. The ratio of the gray value between IP TAK1 and IP TAB2 was determined. Data are done at least twice, and one representative is shown. Source data are available for this figure: SourceData F4.
TAB3 contains a conserved ubiquitin-binding motif near its N-terminus and a conserved α-helical coiled-coil region in its C-terminus (NLP4-like zinc finger domain), similar to TAB2 (Kanayama et al., 2004). Previous studies have shown that TAB2 and TAB3 redundantly activate the IL-1 and TNF signaling pathways, with TAB3 compensating for the loss of TAB2 (Ishitani et al., 2003). We subsequently investigated the impact of the SARS-CoV-2 N protein and the SARS-CoV N protein on TAK1–TAB3 interaction. We observed that SARS-CoV-2 N protein competitively binds to TAB3 with TAK1, while SARS-CoV N protein does not affect this interaction (Fig. 5, A–D). We also generated truncated mutants of TAB3 (1–478aa and 1–661aa) (Fig. 5 E). Co-immunoprecipitation analysis showed that both TAK1 and SARS-CoV-2 N protein interacted with the 478–661aa region of TAB3 (Fig. 5, F and G), while SARS-CoV N protein was found to bind to the 1–478aa region of TAB3 (Fig. 5 H). These results indicate that the SARS-CoV-2 N protein hinders the formation of the TAK1–TAB2/3 complex, whereas the SARS-CoV N protein has no impact on the complex. The different functions of the N proteins of SARS-CoV-2 and SARS-CoV may be attributed to the fact that the binding region of the SARS-CoV-2 N protein with TAB2 and TAB3 overlaps with TAK1, whereas the SARS-CoV N protein binds to different regions of TAB2 and TAB3. Further exploration of these disparities will provide deeper insights into the subtle yet critical changes in the regulatory mechanisms of the NF-κB pathway in both coronaviruses.
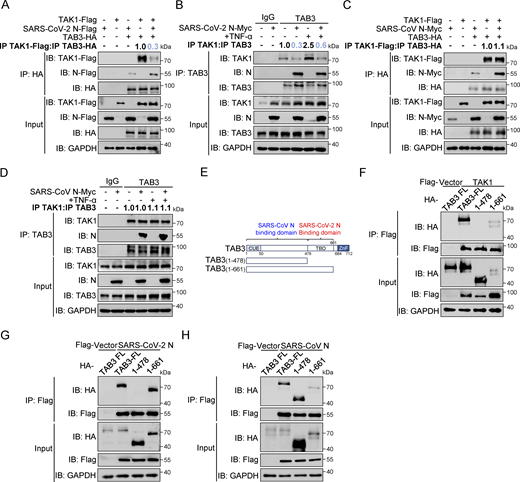
SARS-CoV-2 N protein inhibits the binding between TAK1 and TAB3, unlike SARS-CoV N protein. (A) HEK293T cells were transfected with Flag-TAK1, Flag-SARS-CoV-2 N, Flag-empty vector, HA-TAB3, and HA-empty vector. Lysates were collected for immunoprecipitation (IP) (anti-HA) and immunoblot (IB) analysis. The ratio of the gray value between IP TAK1-Flag and IP TAB3-HA was determined. (B) HEK293T cells were transfected with Myc-empty vector or Myc-SARS-CoV-2 N for 48 h, followed by TNF-α treatment for 4 h. Lysates were subjected to immunoprecipitation (anti-TAB3) and immunoblot analysis. The ratio of the gray value between IP TAK1 and IP TAB3 was determined. (C) HEK293T cells were transfected with Flag-TAK1, Flag-empty vector, Myc-SARS-CoV N, Myc-empty vector, HA-TAB3, and HA-empty vector. Lysates were collected for immunoprecipitation (anti-HA) and immunoblot analysis. The ratio of the gray value between IP TAK1-Flag and IP TAB3-HA was determined. (D) HEK293T cells were transfected with Myc-empty vector or Myc-SARS-CoV N for 48 h, followed by TNF-α treatment for 4 h. Lysates were subjected to immunoprecipitation (anti-TAB3) and immunoblot analysis. The ratio of the gray value between IP TAK1 and IP TAB3 was determined. (E) Domain organization of TAB3 and its truncated mutants. CUE, Ubiquitin binding domain; TBD, TAK1 binding domain; NZF, NLP4-like zinc finger domain. (F–H) HEK293T cells were transfected Flag-empty vector, Flag-TAK1 (F), Flag-SARS-CoV-2 N (G), or Flag-SARS-CoV N (H) along with HA-TAB3 full-length (FL), HA-TAB2 (1–478aa), and HA-TAB2 (1–661aa). Lysates were subjected to immunoprecipitation (anti-Flag) and immunoblot analysis. Data are done at least twice, and one representative is shown. Source data are available for this figure: SourceData F5.
SARS-CoV-2 N protein inhibits the binding between TAK1 and TAB3, unlike SARS-CoV N protein. (A) HEK293T cells were transfected with Flag-TAK1, Flag-SARS-CoV-2 N, Flag-empty vector, HA-TAB3, and HA-empty vector. Lysates were collected for immunoprecipitation (IP) (anti-HA) and immunoblot (IB) analysis. The ratio of the gray value between IP TAK1-Flag and IP TAB3-HA was determined. (B) HEK293T cells were transfected with Myc-empty vector or Myc-SARS-CoV-2 N for 48 h, followed by TNF-α treatment for 4 h. Lysates were subjected to immunoprecipitation (anti-TAB3) and immunoblot analysis. The ratio of the gray value between IP TAK1 and IP TAB3 was determined. (C) HEK293T cells were transfected with Flag-TAK1, Flag-empty vector, Myc-SARS-CoV N, Myc-empty vector, HA-TAB3, and HA-empty vector. Lysates were collected for immunoprecipitation (anti-HA) and immunoblot analysis. The ratio of the gray value between IP TAK1-Flag and IP TAB3-HA was determined. (D) HEK293T cells were transfected with Myc-empty vector or Myc-SARS-CoV N for 48 h, followed by TNF-α treatment for 4 h. Lysates were subjected to immunoprecipitation (anti-TAB3) and immunoblot analysis. The ratio of the gray value between IP TAK1 and IP TAB3 was determined. (E) Domain organization of TAB3 and its truncated mutants. CUE, Ubiquitin binding domain; TBD, TAK1 binding domain; NZF, NLP4-like zinc finger domain. (F–H) HEK293T cells were transfected Flag-empty vector, Flag-TAK1 (F), Flag-SARS-CoV-2 N (G), or Flag-SARS-CoV N (H) along with HA-TAB3 full-length (FL), HA-TAB2 (1–478aa), and HA-TAB2 (1–661aa). Lysates were subjected to immunoprecipitation (anti-Flag) and immunoblot analysis. Data are done at least twice, and one representative is shown. Source data are available for this figure: SourceData F5.
Furthermore, we investigated the impact of NF-kB signaling on viral replication levels in RDP-infected Caco-2-N cells. By employing RNAi to knock down TAB2 or p65 in Caco2-SARS-CoV-2 N/SARS-CoV N cells and subsequently infecting them with RDPs at an MOI of 0.01 for 48 h, we observed increased viral replication in cells with TAB2 or p65 knockdown. Notably, replication levels in Caco2-SARS-CoV-2 N remained higher than those in Caco2-SARS-CoV N (Fig. S3, F–I). These results suggested that the SARS-CoV-2 N protein inhibits cellular inflammation, leading to increased levels of viral replication.
Glu-290 and Gln-349 in the CTD of SARS-CoV-2 N protein are key sites for inhibiting the NF-κB pathway
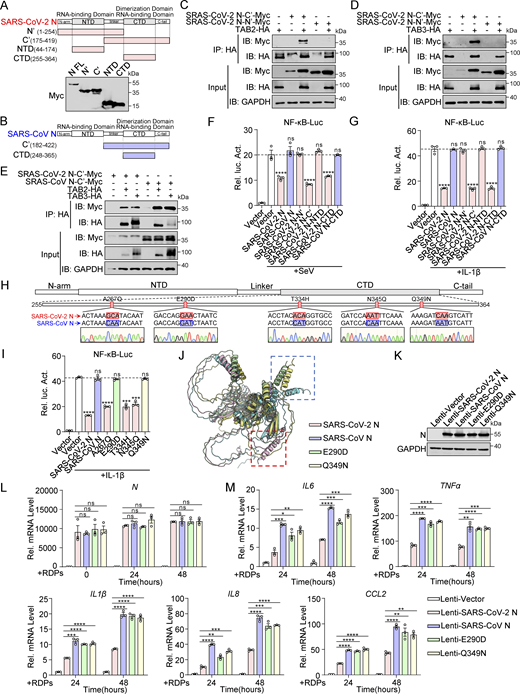
The N protein of β-CoV contains two well-defined domains, the RNA-binding domain (N-NTD) and the dimerization and RNA-binding domain (N-CTD), separated by disordered segments including the N-terminal arm (N-arm), C-terminal tail (C-tail), and a central linker region (LKR) (Ye et al., 2020). Truncated mutants of the SARS-CoV-2 N protein, including N′ (1–254aa), C′ (175–419aa), NTD (44–174aa), and CTD (255–364aa) (Fig. 6 A), as well as the SARS-CoV N protein, including C′ (182–422aa) and CTD (248–365aa) (Fig. 6 B), were generated to study the interaction with TAB2 and TAB3. Co-immunoprecipitation analysis showed both the SARS-CoV-2 and SARS-CoV N proteins interact with TAB2 and TAB3 through their C′ region (Fig. 6, C–E). Subsequently, we evaluated the impact of full-length SARS-CoV-2 N protein (SARS-CoV-2 N FL), full-length SARS-CoV N protein (SARS-CoV N FL), all truncated mutants of the SARS-CoV-2 N protein, and SARS-CoV N-CTD on NF-κB promoter activation. The results revealed that SARS-CoV-2 N FL, SARS-CoV-2 N-C′, and SARS-CoV-2 N-CTD suppressed SeV, IL-1β, and TNF-α–mediated activation of the NF-κB promoter, while SARS-CoV-2 N-N′, SARS-CoV-2 N-NTD, SARS-CoV N full-length, and SARS-CoV N-CTD did not show this inhibitory effect (Fig. 6, F and G; and Fig. S4 A). The results suggest that both SARS-CoV-2 N protein and SARS-CoV N proteins bind to TAB2 and TAB3 through their C′ region. However, only the SARS-CoV-2 N protein inhibits the NF-κB pathway through its CTD domain, unlike the SARS-CoV N protein.
Glu-290 and Gln-349 in the CTD of the SARS-CoV-2 N protein are crucial for inhibiting the NF-κB pathway. (A) Domain organization of SARS-CoV-2 N and its truncated mutants. HEK293T cells were transfected with Myc-N full-length (FL), Myc-N′, Myc-C′, Myc-NTD, and Myc-CTD. Lysates were collected for immunoblot analysis. (B) Domain organization of SARS-CoV N and its truncated mutants. (C and D) HEK293T cells were transfected with Myc-SARS-CoV-2 N-C′, Myc-SARS-CoV-2 N-N′, Myc-empty vector, HA-empty vector, HA-TAB2 (C), or HA-TAB3 (D). Lysates were collected for immunoprecipitation (IP) (anti-HA) and immunoblot (IB) analysis. (E) HEK293T cells were transfected with Myc-SARS-CoV-2 N-C′, Myc-SARS-CoV N-C′, Myc-empty vector, HA-TAB2, HA-TAB3, and HA-empty vector. Lysates were collected for immunoprecipitation (anti-HA) and immunoblot analysis. (F and G) HEK293 cells were transfected with NF-κB-Luc, along with plasmids encoding Myc-SARS-CoV-2 N full-length (FL), Myc-SARS-CoV N FL, Myc-SARS-CoV-2 N-N′, Myc-SARS-CoV-2 N-C′, Myc-SARS-CoV-2 N-NTD, Myc-SARS-CoV-2 N-CTD, or Myc-SARS-CoV N-CTD. At 24 h after transfection, cells were infected with SeV for 10 h (F) or IL-1β for 4 h (G), and luciferase activity was measured. (H) Domain organization of SARS-CoV-2 N and its amino acid point mutations. (I) HEK293 cells were transfected with NF-κB-Luc, along with plasmids encoding Myc-SARS-CoV-2 N wild type (WT), Myc-SARS-CoV N WT, or SARS-CoV-2 N single-point mutants (Myc-A267Q, Myc-E290D, Myc-T334H, Myc-N345Q, and Myc-Q349N). At 24 h after transfection, cells were stimulated by IL-1β for 4 h, and luciferase activity was measured. (J) The structure of N (SARS-CoV N, SARS-CoV-2 N, and SARS-CoV-2 N mutations) was predicted by Alphafold3. Blue box, SARS-CoV N and SARS-CoV-2 N mutations CTD terminal common structure; red box, SARS-CoV-2 CTD terminal structure. (K) Caco-2 cells stably expressing SARS-CoV-2 N, SARS-CoV N, or SARS-CoV-2 N mutations (E290D and Q349N) via lentiviral transduction were lysed for immunoblot analysis. (L and M) Caco-2 cells stably expressing SARS-CoV-2 N, SARS-CoV N, or SARS-CoV-2 N mutations (E290D and Q349N) were infected with RDPs for 24 or 48 h. Total RNA extracted from the cells was evaluated by RT-qPCR. Horizontal lines in figures represent the average value of the positive control group. Graphs show mean ± SEM (n = 3 in F, G, I, L, and M) from one representative experiment. *P < 0.05, **P < 0.01, ***P < 0.001, ****P < 0.0001, ns, not significant (unpaired, two-tailed Student’s t test). Data in C–E and K are done at least twice, and one representative is shown. Data in F, G, I, L, and M are done in at least three independent experiments. Source data are available for this figure: SourceData F6.
Glu-290 and Gln-349 in the CTD of the SARS-CoV-2 N protein are crucial for inhibiting the NF-κB pathway. (A) Domain organization of SARS-CoV-2 N and its truncated mutants. HEK293T cells were transfected with Myc-N full-length (FL), Myc-N′, Myc-C′, Myc-NTD, and Myc-CTD. Lysates were collected for immunoblot analysis. (B) Domain organization of SARS-CoV N and its truncated mutants. (C and D) HEK293T cells were transfected with Myc-SARS-CoV-2 N-C′, Myc-SARS-CoV-2 N-N′, Myc-empty vector, HA-empty vector, HA-TAB2 (C), or HA-TAB3 (D). Lysates were collected for immunoprecipitation (IP) (anti-HA) and immunoblot (IB) analysis. (E) HEK293T cells were transfected with Myc-SARS-CoV-2 N-C′, Myc-SARS-CoV N-C′, Myc-empty vector, HA-TAB2, HA-TAB3, and HA-empty vector. Lysates were collected for immunoprecipitation (anti-HA) and immunoblot analysis. (F and G) HEK293 cells were transfected with NF-κB-Luc, along with plasmids encoding Myc-SARS-CoV-2 N full-length (FL), Myc-SARS-CoV N FL, Myc-SARS-CoV-2 N-N′, Myc-SARS-CoV-2 N-C′, Myc-SARS-CoV-2 N-NTD, Myc-SARS-CoV-2 N-CTD, or Myc-SARS-CoV N-CTD. At 24 h after transfection, cells were infected with SeV for 10 h (F) or IL-1β for 4 h (G), and luciferase activity was measured. (H) Domain organization of SARS-CoV-2 N and its amino acid point mutations. (I) HEK293 cells were transfected with NF-κB-Luc, along with plasmids encoding Myc-SARS-CoV-2 N wild type (WT), Myc-SARS-CoV N WT, or SARS-CoV-2 N single-point mutants (Myc-A267Q, Myc-E290D, Myc-T334H, Myc-N345Q, and Myc-Q349N). At 24 h after transfection, cells were stimulated by IL-1β for 4 h, and luciferase activity was measured. (J) The structure of N (SARS-CoV N, SARS-CoV-2 N, and SARS-CoV-2 N mutations) was predicted by Alphafold3. Blue box, SARS-CoV N and SARS-CoV-2 N mutations CTD terminal common structure; red box, SARS-CoV-2 CTD terminal structure. (K) Caco-2 cells stably expressing SARS-CoV-2 N, SARS-CoV N, or SARS-CoV-2 N mutations (E290D and Q349N) via lentiviral transduction were lysed for immunoblot analysis. (L and M) Caco-2 cells stably expressing SARS-CoV-2 N, SARS-CoV N, or SARS-CoV-2 N mutations (E290D and Q349N) were infected with RDPs for 24 or 48 h. Total RNA extracted from the cells was evaluated by RT-qPCR. Horizontal lines in figures represent the average value of the positive control group. Graphs show mean ± SEM (n = 3 in F, G, I, L, and M) from one representative experiment. *P < 0.05, **P < 0.01, ***P < 0.001, ****P < 0.0001, ns, not significant (unpaired, two-tailed Student’s t test). Data in C–E and K are done at least twice, and one representative is shown. Data in F, G, I, L, and M are done in at least three independent experiments. Source data are available for this figure: SourceData F6.
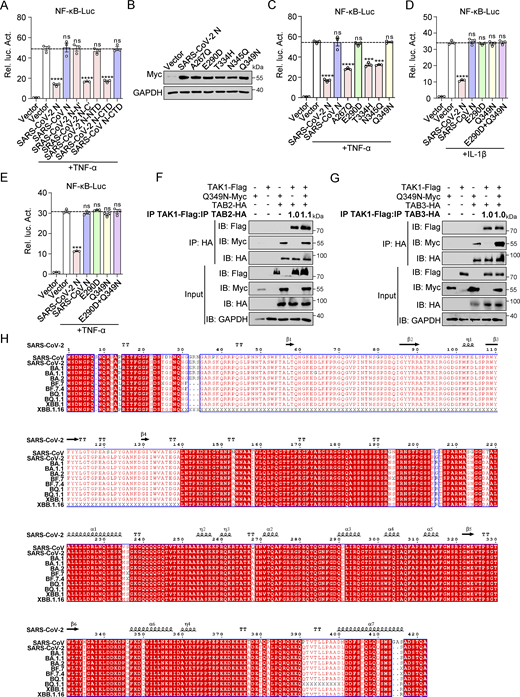
Glu-290 and Gln-349 in the CTD of SARS-CoV-2 N protein are key sites for inhibiting NF-κB pathway. (A) HEK293 cells were transfected with NF-κB-luc, along with plasmids encoding Myc-SARS-CoV-2 N full-length (FL), Myc-SARS-CoV N FL, Myc-SARS-CoV-2 N-N′, Myc-SARS-CoV-2 N-C′, Myc-SARS-CoV-2 N-NTD, Myc-SARS-CoV-2 N-CTD, or Myc-SARS-CoV N-CTD. At 24 h after transfection, cells were stimulated by TNF-α for 4 h, and luciferase activity was measured. (B) HEK293T cells were transfected with Myc-SARS-CoV-2 N wild type (WT) or single-point mutants (Myc-A267Q, Myc-E290D, Myc-T334H, Myc-N345Q, and Myc-Q349N). Lysates were collected for immunoblotting. (C) HEK293 cells were transfected with NF-κB-luc, along with plasmids encoding Myc-SARS-CoV-2 N WT, Myc-SARS-CoV N WT, or SARS-CoV-2 N single-point mutants (Myc-A267Q, Myc-E290D, Myc-T334H, Myc-N345Q, and Myc-Q349N). At 24 h after transfection, cells were stimulated by TNF-α for 4 h, and luciferase activity was measured. (D and E) HEK293 cells were transfected with NF-κB-luc, along with plasmids encoding Myc-SARS-CoV-2 N WT, Myc-SARS-CoV N WT, SARS-CoV-2 N single-point mutants (Myc-E290D or Myc-Q349N), or SARS-CoV-2 N double-point mutant (Myc-E290D+Q349N). At 24 h after transfection, cells were stimulated by IL-1β (D) or TNF-α (E) for 4 h, and luciferase activity was measured. (F and G) HEK293T cells were transfected with Flag-TAK1, Flag-empty vector, Myc-Q349N, Myc-empty vector, HA-empty vector, HA-TAB2 (F), or HA-TAB3 (G). Lysates were collected for immunoprecipitation (IP) (anti-HA) and immunoblotting (IB). The ratio of the gray value between IP TAK1-Flag and IP TAB2-HA or IP TAB3-HA was determined. (H) N protein sequence comparison between SARS-CoV-2, SARS-CoV, BA.1, BA.1.1, BA.2, BF.7, BF7.4, BQ.1, BQ.1.1, XBB.1, and XBB.1.16. The full-length N protein sequences of SARS-CoV-2 (YP_009724397.2), SARS-CoV (YP_009825061.1), BA.1 (EPI_ISL_10543999), BA.1.1 (EPI_ISL_10065996), BA.2 (EPI_ISL_10746692), BF.7 (EPI_ISL_16536280), BF7.4 (EPI_ISL_15800501), BQ.1 (EPI_ISL_16536390), BQ.1.1 (EPI_ISL_16549162), XBB.1 (EPI_ISL_16385568), and XBB.1.16 (EPI_ISL_17233345) were aligned using MUSCLE. The aligned sequences were further confirmed using a similarity plot implemented in Simplot 3.5.1. Horizontal lines in figures represent the average value of the positive control group. Graphs show mean ± SEM (n = 3 in A and C–E). ***P < 0.001, ****P < 0.0001, ns, not significant (unpaired, two-tailed Student’s t test). Data in B, F, and G are expressed at least twice in independent experiments, and one representative is shown. Data in A and C–E are expressed in at least three independent experiments. Source data are available for this figure: SourceData FS4.
Glu-290 and Gln-349 in the CTD of SARS-CoV-2 N protein are key sites for inhibiting NF-κB pathway. (A) HEK293 cells were transfected with NF-κB-luc, along with plasmids encoding Myc-SARS-CoV-2 N full-length (FL), Myc-SARS-CoV N FL, Myc-SARS-CoV-2 N-N′, Myc-SARS-CoV-2 N-C′, Myc-SARS-CoV-2 N-NTD, Myc-SARS-CoV-2 N-CTD, or Myc-SARS-CoV N-CTD. At 24 h after transfection, cells were stimulated by TNF-α for 4 h, and luciferase activity was measured. (B) HEK293T cells were transfected with Myc-SARS-CoV-2 N wild type (WT) or single-point mutants (Myc-A267Q, Myc-E290D, Myc-T334H, Myc-N345Q, and Myc-Q349N). Lysates were collected for immunoblotting. (C) HEK293 cells were transfected with NF-κB-luc, along with plasmids encoding Myc-SARS-CoV-2 N WT, Myc-SARS-CoV N WT, or SARS-CoV-2 N single-point mutants (Myc-A267Q, Myc-E290D, Myc-T334H, Myc-N345Q, and Myc-Q349N). At 24 h after transfection, cells were stimulated by TNF-α for 4 h, and luciferase activity was measured. (D and E) HEK293 cells were transfected with NF-κB-luc, along with plasmids encoding Myc-SARS-CoV-2 N WT, Myc-SARS-CoV N WT, SARS-CoV-2 N single-point mutants (Myc-E290D or Myc-Q349N), or SARS-CoV-2 N double-point mutant (Myc-E290D+Q349N). At 24 h after transfection, cells were stimulated by IL-1β (D) or TNF-α (E) for 4 h, and luciferase activity was measured. (F and G) HEK293T cells were transfected with Flag-TAK1, Flag-empty vector, Myc-Q349N, Myc-empty vector, HA-empty vector, HA-TAB2 (F), or HA-TAB3 (G). Lysates were collected for immunoprecipitation (IP) (anti-HA) and immunoblotting (IB). The ratio of the gray value between IP TAK1-Flag and IP TAB2-HA or IP TAB3-HA was determined. (H) N protein sequence comparison between SARS-CoV-2, SARS-CoV, BA.1, BA.1.1, BA.2, BF.7, BF7.4, BQ.1, BQ.1.1, XBB.1, and XBB.1.16. The full-length N protein sequences of SARS-CoV-2 (YP_009724397.2), SARS-CoV (YP_009825061.1), BA.1 (EPI_ISL_10543999), BA.1.1 (EPI_ISL_10065996), BA.2 (EPI_ISL_10746692), BF.7 (EPI_ISL_16536280), BF7.4 (EPI_ISL_15800501), BQ.1 (EPI_ISL_16536390), BQ.1.1 (EPI_ISL_16549162), XBB.1 (EPI_ISL_16385568), and XBB.1.16 (EPI_ISL_17233345) were aligned using MUSCLE. The aligned sequences were further confirmed using a similarity plot implemented in Simplot 3.5.1. Horizontal lines in figures represent the average value of the positive control group. Graphs show mean ± SEM (n = 3 in A and C–E). ***P < 0.001, ****P < 0.0001, ns, not significant (unpaired, two-tailed Student’s t test). Data in B, F, and G are expressed at least twice in independent experiments, and one representative is shown. Data in A and C–E are expressed in at least three independent experiments. Source data are available for this figure: SourceData FS4.
Despite sharing a high homology of 90% between the N proteins of SARS-CoV-2 and SARS-CoV, subtle differences or mutations can significantly impact their functionality (Peng et al., 2020). Comparing the amino acid sequences of the N proteins from both coronaviruses provides valuable insights into the disparities in NF-κB pathway regulation. Only five amino acid variations were identified when comparing the C-terminal domain (CTD) sequences of the SARS-CoV-2 and SARS-CoV N proteins. Point mutations were then introduced at these five amino acid positions in the SARS-CoV-2 N protein, replacing them with the corresponding amino acids from the SARS-CoV N protein. Specifically, the SARS-CoV-2 N protein was mutated as follows: A to Q at 267aa (A267Q), E to D at 290aa (E290D), T to H at 334aa (T334H), N to Q at 345aa (N345Q), and Q to N at 349aa (Q349N) (Fig. 6 H and Fig. S4 B). Luciferase assay indicated that A267Q, T334H, and N345Q maintained their inhibitory effect on the activation of NF-κB promoter mediated by IL-1β and TNF-α, while E290D and Q349N abolished this inhibitory effect (Fig. 6 I and Fig. S4 C). Subsequent analysis of a double-mutated SARS-CoV-2 N protein (E290D+Q349N) revealed similar effects on NF-κB promoter activation as the single-point mutations (Fig. S4, D and E). Additionally, structural prediction using AlphaFold3 revealed that mutations of amino acid 290 from E to D or amino acid 349 from Q to N in the CTD of the SARS-CoV-2 N protein resulted in a shift in the α-helix position. This alteration aligns the α-helix position with that of the CTD of the SARS-CoV N protein (Fig. 6, J). This suggests that these two mutations may affect the interaction with TAB2/3 by influencing the tertiary structure of the N protein. Co-immunoprecipitation assays confirmed that the Q349N mutation eliminated the inhibition of the TAK1–TAB2/3 complex formation (Fig. S4, F and G). The results suggested that Glu-290 and Gln-349 in the CTD of the SARS-CoV-2 N protein are crucial for inhibiting the NF-κB pathway.
Finally, we established the Caco-2-E290D and Caco-2-Q349N cells through lentiviral transduction, enabling stable expression of E290D and Q349N proteins. Western blot analysis confirmed the successful expression of SARS-CoV-2 N, SARS-CoV N, E290D, and Q349N proteins in Caco-2-N* cells (Fig. 6 K). These cells were then infected with RDPs at an MOI of 0.01. RT-qPCR analysis showed that when the RNA level of N remained consistent between cells, mRNA levels of IL6, TNFα, IL1β, IL8, and CCL2 in Caco-2-E290D and Caco-2-Q349N cells were comparable with those in Caco-2-SARS-CoV N cells and significantly higher than in Caco-2-SARS-CoV-2 N cells (Fig. 6, L and M). These findings suggest that Glu-290 and Gln-349 residues in the CTD of the SARS-CoV-2 N protein are important in suppressing the NF-κB pathway during RDP’s infection.
N protein homology analysis of SARS-CoV wild type, SARS-CoV-2 wild type, and SARS-CoV-2 Omicron variants (BA.1, BA.1.1, BA.2, BF.7, BF.7.4, BQ.1, BQ.1.1, XBB.1, and XBB.1.16) revealed no amino acid substitutions, deletions, or insertions in the CTD (255–364aa) of the SARS-CoV-2 N protein (Fig. S4 H). The CTD of the SARS-CoV-2 N protein remains unaltered, potentially indicating its critical role in viral function. Notably, five mutations were identified in the CTD of the N protein in both SARS-CoV-2 and SARS-CoV, implying distinct evolutionary pressures and adaptations to different hosts, environments, or transmission routes. Specifically, the key amino acid sites Glu-290 and Gln-349 were found to suppress inflammation and maintain low pathogenicity, possibly contributing to the virus’s long-term survival.
SARS-CoV-2 N protein triggers milder lung inflammation in mice than SARS-CoV N protein during viral infection
The K18-hACE2 KI mouse model is a valuable tool for studying SARS-CoV-2 infection and gaining insight into the pathophysiology of COVID-19 (Zhang et al., 2024; Zheng et al., 2021). We assessed the impact of SARS-CoV-2 N protein on pulmonary disease in the K18-hACE2 KI mouse model during SARS-CoV-2 infection. Mice were intranasally infected with Lenti-SARS-CoV-2 N, Lenti-SARS-CoV N, or Lenti-E290D/Q349N on Days 0 and 4. On Day 10, they received an intranasal administration of RDPs. Murine lung tissue and alveolar lavage fluid were collected on Day 16 for analysis (Fig. 7 A). Immunofluorescence and western blot analyses confirmed the successful expression of N proteins in lung tissues of lentivirus-infected mice (Fig. S5, A and B), and efficient infection by RDPs was observed (Fig. 7 B). RT-qPCR analysis showed that mice expressing the SARS-CoV-2 N protein had higher replication levels of RDPs in their lungs compared with mice expressing SARS-CoV-2 N, E290D, or Q349N mutants, despite similar RNA levels of N (Fig. 7, C and D). Conversely, the RNA levels of Tnfα, Il6, Il1β, Ccl2, and Cxcl10 in the lung tissues were significantly lower in mice expressing the SARS-CoV-2 N protein than in those expressing the SARS-CoV N protein or E290D/Q349N mutants (Fig. 7 E). Furthermore, ELISA analysis demonstrated that the protein levels of Tnf-a, Il-6, and Cxcl10 were also significantly lower in mouse lung tissue expressing the SARS-CoV-2 N protein compared with those expressing the SARS-CoV N protein or E290D/Q349N mutants (Fig. 7 F). Histological examination using hematoxylin-eosin (HE) staining showed that mouse lung tissue expressing the SARS-CoV-2 N protein had less severe features such as thickened alveolar walls, cellular infiltration, and exudate accumulation following infection with RDPs compared with tissues expressing SARS-CoV N protein or E290D/Q349N mutants (Fig. 7 G). The lung pathology of all mice was assessed using a grading scale from 0 to 5. A score of 0 indicated normal alveolar tissue; 1 represented mild inflammatory cell infiltration without thickening of alveolar walls; 2 denoted moderate infiltration with slight thickening; 3 indicated severe aggregation and thickening in certain areas, while scores of 4 and 5 represented severe inflammatory cell aggregation, thickening of alveolar walls, bronchiole obstruction, and lung consolidation. Consistent with previous observations, mice expressing the SARS-CoV-2 N protein exhibited lower levels of inflammation in lung tissue compared with those expressing the SARS-CoV N protein or E290D/Q349N mutants (Fig. 7 H). The results indicate that infection with RDPs efficiently induces lung inflammation in mice. The replication ability of the virus utilizing SARS-CoV-2 N protein is superior to that of the virus utilizing SARS-CoV N protein, yet there is a notable decrease in inflammation. Notably, the Glu-290 and Gln-349 residues of the SARS-CoV-2 N protein play a crucial role in the development of pulmonary inflammatory disease in mice.

SARS-CoV-2 N protein causes less lung inflammation in mice than SARS-CoV N protein during viral infection. (A) Schematic presentation of assessment of N variants function. RDPs were inoculated into K18-hACE2 KI mice expressing N variants via lentiviral transduction. Lung tissue and alveolar lavage fluid were collected 6 days after infection. (B) RDPs infected the lungs of K18-hACE2 KI mice expressing N variants for 6 days, the GFP expression analyzed by microscopy. Scale bars, 100 μm. (C–E) RDPs infected the lungs of K18-hACE2 KI mice expressing N variants for 6 days; the total RNA extracted from the lung tissue was evaluated by RT-qPCR, n = 6. (F) RDPs infected the lungs of K18-hACE2 KI mice expressing N variants for 6 days; Tnfα, Il-6, and Cxcl10 levels in the alveolar lavage fluid were evaluated by ELISA, n = 6. (G) RDPs infected the lungs of K18-hACE2 KI mice expressing N variants for 6 days. Histological abnormalities of the lung in mice were shown by HE staining. The arrows showed thickened alveolar walls, cellular infiltration, or exudate accumulation. Scale bar, 1,000 and 100 μm. (H) RDPs infected the lungs of K18-hACE2 KI mice expressing N variants for 6 days, Histological abnormalities of the lung in mice were shown by HE staining. The mice lungs were scored, n = 6. Graphs show mean ± SEM (n = 6 in C–F). ***P < 0.001, ****P < 0.0001, ns, not significant (unpaired, two-tailed Student’s t test).
SARS-CoV-2 N protein causes less lung inflammation in mice than SARS-CoV N protein during viral infection. (A) Schematic presentation of assessment of N variants function. RDPs were inoculated into K18-hACE2 KI mice expressing N variants via lentiviral transduction. Lung tissue and alveolar lavage fluid were collected 6 days after infection. (B) RDPs infected the lungs of K18-hACE2 KI mice expressing N variants for 6 days, the GFP expression analyzed by microscopy. Scale bars, 100 μm. (C–E) RDPs infected the lungs of K18-hACE2 KI mice expressing N variants for 6 days; the total RNA extracted from the lung tissue was evaluated by RT-qPCR, n = 6. (F) RDPs infected the lungs of K18-hACE2 KI mice expressing N variants for 6 days; Tnfα, Il-6, and Cxcl10 levels in the alveolar lavage fluid were evaluated by ELISA, n = 6. (G) RDPs infected the lungs of K18-hACE2 KI mice expressing N variants for 6 days. Histological abnormalities of the lung in mice were shown by HE staining. The arrows showed thickened alveolar walls, cellular infiltration, or exudate accumulation. Scale bar, 1,000 and 100 μm. (H) RDPs infected the lungs of K18-hACE2 KI mice expressing N variants for 6 days, Histological abnormalities of the lung in mice were shown by HE staining. The mice lungs were scored, n = 6. Graphs show mean ± SEM (n = 6 in C–F). ***P < 0.001, ****P < 0.0001, ns, not significant (unpaired, two-tailed Student’s t test).
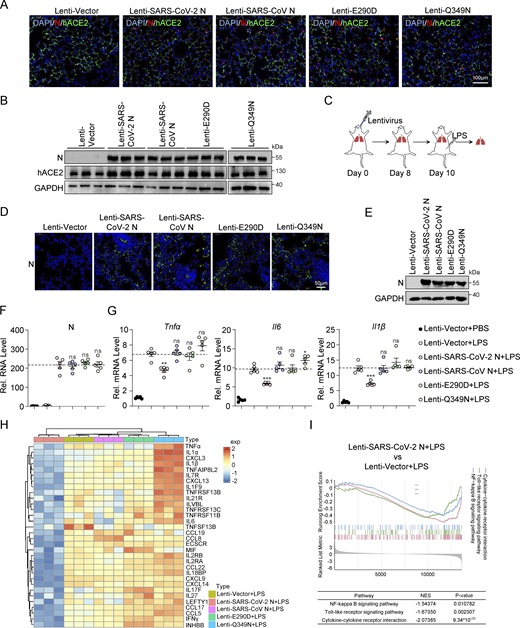
SARS-CoV-2 N protein suppresses LPS-induced pulmonary inflammation in mice. (A) The lungs of K18-hACE2 KI mice infected with lentivirus expressing SARS-CoV-2 N, SARS-CoV N, E290D, or Q349N. Nuclear markers DAPI (blue), SARS-CoV-2 N, SARS-CoV N, E290D, and Q349N (red), and hACE2 (green) were visualized by microscopy. Scale bars, 100 μm. (B) K18-hACE2 KI mice were infected with lentivirus expressing SARS-CoV-2 N WT, SARS-CoV N WT, E290D, or Q349N. Lung lysates were collected for immunoblotting, n = 3. (C) Establishment of lung models of K18-hACE2 KI mice infected with lentivirus expressing SARS-CoV-2 N, SARS-CoV N, E290D, or Q349N, and activation of the NF-κB pathway by LPS. (D) The lungs of K18-hACE2 KI mice were infected with lentivirus expressing SARS-CoV-2 N, SARS-CoV N, E290D, or Q349N. SARS-CoV-2 N, SARS-CoV N, E290D, and Q349N (green) were visualized by microscopy. Scale bars, 50 μm. (E) K18-hACE2 KI mice were infected with lentivirus expressing SARS-CoV-2 N WT, SARS-CoV N WT, E290D, or Q349N, and lung lysates were collected for immunoblotting. (F and G) Levels of N (F), Tnfα, Il6, and Il1β (G) were measured by RT-qPCR in the lungs of mice infected with either empty lentivirus or lentivirus expressing SARS-CoV-2 N, SARS-CoV N, E290D, or Q349N. LPS activated inflammatory pathways, PBS as control, n = 5. Horizontal lines in F represents the average value of the Lenti-SARS-CoV-2 N+LPS group. Horizontal lines in G represents the average value of the positive control group. (H) Heatmap of inflammatory genes in the Lenti-Vector, Lenti-SARS-CoV-2 N, Lenti-SARS-CoV N, Lenti-E290D, and Lenti-Q349N. LPS activated inflammatory pathways, PBS as control, n = 3. (I) GSEA plot depicting the enrichment of genes in cytokine-cytokine receptor interaction, NF-κB signaling pathway, and Toll-like receptor signaling pathway in the lungs of mice infected with empty lentivirus and lentivirus expressing SARS-CoV-2 N protein. LPS activated inflammatory pathways, PBS as control, n = 3. A positive normalized enrichment score (NES) indicates that the gene set is enriched in upregulated genes, while a negative NES suggests enrichment in downregulated genes. Graphs show mean ± SEM (n = 5 in F and G). *P < 0.05, **P < 0.01, ***P < 0.001, ns, not significant (unpaired, two-tailed Student’s t test). Source data are available for this figure: SourceData FS5.
SARS-CoV-2 N protein suppresses LPS-induced pulmonary inflammation in mice. (A) The lungs of K18-hACE2 KI mice infected with lentivirus expressing SARS-CoV-2 N, SARS-CoV N, E290D, or Q349N. Nuclear markers DAPI (blue), SARS-CoV-2 N, SARS-CoV N, E290D, and Q349N (red), and hACE2 (green) were visualized by microscopy. Scale bars, 100 μm. (B) K18-hACE2 KI mice were infected with lentivirus expressing SARS-CoV-2 N WT, SARS-CoV N WT, E290D, or Q349N. Lung lysates were collected for immunoblotting, n = 3. (C) Establishment of lung models of K18-hACE2 KI mice infected with lentivirus expressing SARS-CoV-2 N, SARS-CoV N, E290D, or Q349N, and activation of the NF-κB pathway by LPS. (D) The lungs of K18-hACE2 KI mice were infected with lentivirus expressing SARS-CoV-2 N, SARS-CoV N, E290D, or Q349N. SARS-CoV-2 N, SARS-CoV N, E290D, and Q349N (green) were visualized by microscopy. Scale bars, 50 μm. (E) K18-hACE2 KI mice were infected with lentivirus expressing SARS-CoV-2 N WT, SARS-CoV N WT, E290D, or Q349N, and lung lysates were collected for immunoblotting. (F and G) Levels of N (F), Tnfα, Il6, and Il1β (G) were measured by RT-qPCR in the lungs of mice infected with either empty lentivirus or lentivirus expressing SARS-CoV-2 N, SARS-CoV N, E290D, or Q349N. LPS activated inflammatory pathways, PBS as control, n = 5. Horizontal lines in F represents the average value of the Lenti-SARS-CoV-2 N+LPS group. Horizontal lines in G represents the average value of the positive control group. (H) Heatmap of inflammatory genes in the Lenti-Vector, Lenti-SARS-CoV-2 N, Lenti-SARS-CoV N, Lenti-E290D, and Lenti-Q349N. LPS activated inflammatory pathways, PBS as control, n = 3. (I) GSEA plot depicting the enrichment of genes in cytokine-cytokine receptor interaction, NF-κB signaling pathway, and Toll-like receptor signaling pathway in the lungs of mice infected with empty lentivirus and lentivirus expressing SARS-CoV-2 N protein. LPS activated inflammatory pathways, PBS as control, n = 3. A positive normalized enrichment score (NES) indicates that the gene set is enriched in upregulated genes, while a negative NES suggests enrichment in downregulated genes. Graphs show mean ± SEM (n = 5 in F and G). *P < 0.05, **P < 0.01, ***P < 0.001, ns, not significant (unpaired, two-tailed Student’s t test). Source data are available for this figure: SourceData FS5.
Additionally, we developed a mouse model stimulated with lipopolysaccharide (LPS) to assist in evaluating the effect of the SARS-CoV-2 N protein on pulmonary inflammation levels. Lentiviral vectors carrying genes encoding SARS-CoV-2 N, SARS-CoV N, or mutant (E290D/Q349N) proteins were administered via tracheal instillation to K18-hACE2 mice, resulting in successful protein expression. On the eighth day after inoculation, mice infected with Lenti-Vector (empty lentivirus) were either injected with phosphate buffer saline (PBS) as the control group or with LPS as the positive control group to activate the NF-κB pathway. Lung tissue was collected 8 h later for analysis (Fig. S5 C). Immunofluorescence and western blot analyses confirmed successful protein expression in the lung tissues of mice infected with the lentivirus (Fig. S5, D and E). RT-qPCR analysis demonstrated consistent RNA expression levels of the N protein in mouse lung tissue (Fig. S5 F), along with reduced mRNA expression of inflammatory cytokines (Tnfα, Il6, and Il1β) in the lungs of Lenti-SARS-CoV-2 N-infected mice compared with the control group. Conversely, there was a tendency toward upregulation of these cytokines in lung tissues of mice infected with Lenti-SARS-CoV N, Lenti-E290D, and Lenti-Q349N (Fig. S5 G). Subsequent RNA sequencing (RNA-seq) analysis revealed that 694 genes were downregulated in the lung tissues of mice infected with Lenti-SARS-CoV-2 N, while their expression either remained stable or showed a tendency to be upregulated in lung tissues from mice infected with Lenti-SARS-CoV N and Lenti-E290D/Q349N. Further investigation identified 32 of these genes to be associated with inflammation (Fig. S5 H). Gene set enrichment analysis (GSEA) unveiled that infection with Lenti-SARS-CoV-2 N in mouse lung tissue downregulates gene expression in pathways related to cytokine and cytokine receptors interactions, NF-κB signaling, and Toll-like receptors signaling (Fig. S5 I). These results suggest that the LPS-mediated NF-κB pathway is inhibited in the lung tissues of mice expressing the SARS-CoV-2 N protein, whereas it tends to be upregulated in the lung tissues of mice expressing the SARS-CoV N, E290D, and Q349N proteins.
Discussion
COVID-19 and SARS induce inflammation through multiple factors (Chen and Subbarao, 2007; Tay et al., 2020), while also inhibiting inflammation for their survival via distinct mechanisms (Blanco-Melo et al., 2020; DeDiego et al., 2014). Variations in transmission speed, incubation period, symptoms, and mortality rates between COVID-19 and SARS are linked to differences in immune and inflammatory responses (Cameron et al., 2008; Hu et al., 2020; Lamers and Haagmans, 2022; Zhu et al., 2020). The specific mechanisms underlying these differences remain incompletely understood. In this study, we identified the role of the SARS-CoV-2 N protein in suppressing SeV, IL-1β, TNF-α, and LPS-induced inflammation via the NF-κB pathway, highlighting its distinctions from the SARS-CoV N protein in this aspect. These results were validated using a SARS-CoV-2 trans-complementation system in both cellular and animal models. Specifically, the SARS-CoV-2 N protein competitively interacted with TAB2/3 and subsequently inhibited the formation of the TAK1–TAB2/3 complex. In contrast, the SARS-CoV N protein interacted with TAB2/3 without affecting the assembly of the TAK1–TAB2/3 complex. Through sequence comparison of the N proteins from SARS-CoV-2 and SARS-CoV, we identified the crucial role of Glu290 and Gln349 in the CTD domain of the SARS-CoV-2 N protein in suppressing the NF-κB pathway (Fig. 8).

A schematic diagram shows that two residues change in SARS-CoV-2 N protein trigger NF-κB inhibition. The SARS-CoV-2 N protein competitively binds TAB2/3 and inhibits the formation of the TAK1–TAB2/3 complex, thereby exerting its inhibitory effect on the NF-κB pathway. In contrast, the SARS-CoV N protein interacts with TAB2/3 without interfering with the assembly of the TAK1–TAB2/3 complex.
A schematic diagram shows that two residues change in SARS-CoV-2 N protein trigger NF-κB inhibition. The SARS-CoV-2 N protein competitively binds TAB2/3 and inhibits the formation of the TAK1–TAB2/3 complex, thereby exerting its inhibitory effect on the NF-κB pathway. In contrast, the SARS-CoV N protein interacts with TAB2/3 without interfering with the assembly of the TAK1–TAB2/3 complex.
Previous studies have indicated that the N protein may amplify the host’s inflammatory response during SARS-CoV-2 infection (Gao et al., 2022; Hasan et al., 2023; Nakayama et al., 2022; Wu et al., 2021). However, it is important to consider the limitations of this assessment method as it becomes challenging to determine whether the heightened activation of the inflammatory response is solely attributable to the presence of the N protein or if N protein–induced viral replication further stimulates inflammation. In our experimental system, reverse genetics were utilized to create RDPs for infecting Caco-2 cells or K18-hACE2 mouse models with stable expression of SARS-CoV-2 N or SARS-CoV N proteins, revealing distinct regulatory functions of these two N proteins on the host’s inflammatory response during infection, with consistent expression levels. Following infection with RDPs, viral replication increased, while proinflammatory cytokine expression decreased in Caco-2 cells and K18-hACE2 mice expressing SARS-CoV-2 N protein compared with those expressing SARS-CoV N protein. Notably, mice expressing SARS-CoV-2 N protein exhibited milder lung disease (Fig. 2 and Fig. 7). This finding is consistent with the results of SARS-CoV-2 and SARS-CoV infection in isolated lung tissue (Chu et al., 2020; Stukalov et al., 2021).
Utilizing an in vivo model, we demonstrated the impact of the SARS-CoV-2 N protein on the NF-κB pathway in the pulmonary system of K18-hACE2 mice. Our results illustrated a pronounced suppression of the NF-κB pathway in response to LPS stimulation or RDPs infection, with a corresponding downregulation of proinflammatory factors in lung tissue. Conversely, the N protein of SARS-CoV and specific mutants (E290D/Q349N) of SARS-CoV-2 did not exhibit a similar inhibitory effect on the NF-κB pathway, suggesting that the E290/Q349 amino acids of the SARS-CoV-2 N protein are key residues to regulate NF-κB signaling (Fig. S5 and Fig. 7). The loss of inhibitory function associated with the E290D/Q349N mutations underscores the importance of these specific residues in mediating the suppressive effects of the N protein on the NF-κB pathway. This observation provides valuable insights into the intricate regulatory mechanisms employed by the SARS-CoV-2 N protein and highlights the potential functional importance of these amino acid sites in modulating the host immune response during viral infection.
Virus mutation is a natural biological phenomenon that occurs during transmission and replication. These mutations can impact the viability, transmissibility, or pathogenicity of the virus (Chen et al., 2022b). Some viruses exhibit a conserved structure, with few mutations in critical functional parts. In SARS-CoV-2, the N protein is generally considered one of the relatively conserved parts. Based on our analysis of N protein homology among the SARS-CoV wild type, the SARS-CoV-2 wild type and the SARS-CoV-2 Omicron variant (BA.1, BA.1.1, BA.2, BF.7, BF.7.4, BQ.1, BQ.1.1, XBB.1, and XBB.1.16), no amino acid substitutions, deletions or insertions were found in the CTD of SARS-CoV-2 N proteins (Fig. S4 H). However, there are five mutations in the CTD of SARS-CoV-2 and SARS-CoV N proteins, which may indicate that these viruses have undergone adaptive changes during evolution or have been subjected to different selective pressures. One possible explanation is that SARS-CoV-2 may possess a highly conserved CTD within the N protein, leading to less damage to the respiratory mucosa, lungs, and other organs in human infections compared to SARS-CoV. Simultaneously, this characteristic also facilitates the virus in evading host immune responses, increasing its infectivity. Additionally, this feature accounts for the early infection phase of SARS-CoV-2, characterized by a high expression of N protein and a lack of obvious inflammation. Consequently, many COVID-19 patients do not show symptoms in the early stages of infection, resulting in a significant number of asymptomatic cases (Fan et al., 2023).
However, our experimental system has certain limitations. Despite simulating the infection process of SARS-CoV-2, there remains a discernible disparity between our system and actual infections caused by SARS-CoV-2 and SARS-CoV. We compared viral protein expression and N protein localization in Caco-2 cells infected with SARS-CoV-2 and in Caco-2-SARS-CoV-2 N cells infected with RDPs (Fig. S2). In Caco-2-N cells, the expression of the N protein remains constant throughout the infection period, primarily influenced by the density and growth of Caco-2-N cells. However, in SARS-CoV-2–infected Caco-2 cells, there is a gradual increase in N protein expression over time, predominantly influenced by the titer of SARS-CoV-2 and infection duration. Consequently, variations exist in the levels of N protein expression between these two conditions. Previous studies have reported that while SARS-CoV exhibits lower replication efficiency than SARS-CoV-2, it elicits a stronger inflammatory response compared with SARS-CoV-2 (Chu et al., 2020; Stukalov et al., 2021). However, it remains uncertain whether these disparities in cellular inflammation after infection are attributed solely to N proteins. Our objective is to compare the regulatory effects of SARS-CoV-2 N, SARS-CoV N, and mutant SARS-CoV-2 N proteins on inflammatory responses during viral infection. Therefore, we opted to simulate viral infection using the RDP system to quantify the disparity in N protein–induced inflammation during viral infection. Ideally, we would express E290D and/or Q349N mutated forms of the N protein within an authentic viral environment. However, current experimental limitations prevent us from achieving this goal. Moreover, mice are not natural hosts for SARS-CoV-2, which may limit the utility of mouse models in assessing the pathogenicity of this virus. Therefore, integrating multiple data sources will yield a more comprehensive understanding of the impact and extent of disease associated with SARS-CoV-2 infection in humans.
Both the pathogenesis and epidemiological dynamics of COVID-19 and SARS are influenced by multiple factors. The disparities in the NF-κB pathway modulation between SARS-CoV N protein and SARS-CoV-2 N protein suggest that these two coronaviruses may have different strategies for attenuating immune responses. This may explain the early latent infection and lack of obvious early clinical symptoms of SARS-CoV-2. Exploring the interaction between the SARS-CoV-2 N protein and host cell proteins can identify potential drug targets. This study provides new insights into coronavirus infections and related diseases.
Materials and methods
Cell culture
HEK293, HEK293T, HeLa, A549, Huh7, and Caco-2 cells were purchased from the China Center for Type Culture Collection, cultured, expanded, and cryopreserved in our laboratory. All cells were cultured in Dulbecco’s modified Eagle medium (DMEM, 11965092; Gibco) containing 10% fetal bovine serum (A5256701; Gibco) and 1% penicillin/streptomycin (15140122; Gibco) at 37°C in a 5% CO2 incubator. All cells are free of mycoplasma.
Plasmid and transfection
The 15 genes of SARS-CoV-2 (NSP1, NSP2, NSP3N NSP7, NSP8, NSP9, NSP13, NSP15, NSP16, ORF3a, ORF7a, ORF8, ORF9a, RBD V1, and RBD V2) were cloned into pCAG-Flag and previously preserved in our laboratory. pCMV-Tag 2B-SARS-CoV N-Flag, pET21a-SARS-CoV-2 N-His, pGL3-NF-κB-Luc, pGL3-IL-8-Luc, pRL-TK, psPAX2, pMD2.G, pLenti-EF1α-SARS-CoV-2 N/SARS-CoV N-Flag, and pRK5-RIG-I/MDA5/MAVS/TRAF6/TAK1/TAB1/TAB2/TAB3/IKKβ/P65-HA/Flag were also preserved in our laboratory. Various truncated forms of the SARS-CoV-2 N protein and the SARS-CoV N protein were cloned into pCDNA3.0(+)-Myc. Truncated forms of TAB2 and TAB3 were cloned into the pCAGGS-HA. pCDNA3.0(+)-SARS-CoV-2 N/SARS-CoV N/A267Q/E290D/T334H/N345Q/Q349N/E290D+Q349N-Myc, pLenti-EF1α-SARS-CoV-2 N/SARS-CoV N/E290D/Q349N-Flag, pCAGGS-TAB2/TAB3-HA, pEGFP-N1-TAB2/TAB3, pDsRed-N1-SARS-CoV-2 N, and pGEX-6P-1-TAK1/TAB2/TAB3-GST were constructed by standard molecular biology techniques. The primers and associated plasmid vectors used for cloning are listed in Table S1. The DNA transfection reagent using Lipofectamine 2000 (11668027; Invitrogen) or Neofect (TF201201; NEOFECT) and was conducted according to the manufacturer’s protocol. The siRNA transfection reagent using Lipofectamine RNAiMAX (13778075; Invitrogen) was conducted in accordance with the manufacturer’s protocol. The siRNA sequences used in this experiment were as follows:
siTAB2-1 S: 5′-GCUGGGUAUCUCAGUUUAATT-3′
siTAB2-1 A: 5′-UUAAACUGAGAUACCCAGCTT-3′
siTAB2-2 S: 5′-GCAUGGGUCCUGCCUUUAUTT-3′
siTAB2-2 A: 5′-AUAAAGGCAGGACCCAUGCTT-3′
siTAB2-3 S: 5′-CCAAAGAUCAAAGGUCCAUTT-3′
siTAB2-3 A: 5′-AUGGACCUUUGAUCUUUGGTT-3′
sip65-1 S: 5′-CGGAUUGAGGAGAAACGUAAATT-3′
sip65-1 A: 5′-UUUACGUUUCUCCUCAAUCCGTT-3′
sip65-2 S: 5′-CCUGAGGCUAUAACUCGCCUATT-3′
sip65-2 A: 5′-UAGGCGAGUUAUAGCCUCAGGTT-3′
sip65-3 S: 5′-GCAGGCUAUCAGUCAGCGCAUTT-3′
sip65-3 A: 5′-AUGCGCUGACUGAUAGCCUGCTT-3′.
Virus, reagents, and antibodies
For cell stimulation, recombinant human IL-1β (200-01B; Peprotech) and TNF-α (300-01A; Peprotech) were utilized at a final concentration of 10 ng/ml. LPS (L2630; Sigma-Aldrich) was administered at a final concentration of 25 mg/kg body weight through intraperitoneal injection for mouse experiments. For cell stimulation, SeV was employed at a final concentration of 50 hemagglutination unit (HU)/ml. SARS-CoV-2 wild type (WIV04, IVCAS 6.5712) was provided by the Wuhan Institute of Virology, Chinese Academy of Sciences. The protocols and procedures for handling infectious SARS-CoV-2 authentic virus in the Animal Biosafety Level III Laboratory facility were approved by the Institutional Biosafety Committee (IBC) at Wuhan University (animal use protocol [AUP] # WP20220044). Detailed information regarding the antibodies utilized in this study can be found in Table S2.
Lentivirus packaging and selection of Caco-2-N* cell line
HEK293T cells were seeded in 10-cm dishes and transfected with pLenti-EF1a-SARS-CoV-2 N-Flag, pLenti-EF1a-SARS-CoV N-Flag, pLenti-EF1a-E290D-Flag, pLenti-EF1a-Q349N-Flag, or a negative control empty vector, along with the packaging plasmids psPAX2 and pMD2G. The medium was replaced 12 h after transfection. At 36 and 60 h after transfection, cell supernatants containing lentivirus were collected and filtered using a 0.45-μm filter. Caco-2 cells were seeded in 10-cm dishes and transduced with 10 ml of the lentiviral supernatant in the presence of 10 μg/ml polybrene for 48 h. After transduction, the cells were transferred to a 15-cm dish and cultured in DMEM containing 50 μg/ml Blasticidin S. After 2 wk, colonies carrying the BSD gene were selected and transferred to 48-well plates for further expansion.
SARS-CoV-2 ΔN-GFP-HiBiT replicon delivery particles
SARS-CoV-2 ΔN-GFP-HiBiT RDPs were constructed by Li et al. (2024).
To quantify the infectivity and viral titer of RDPs, the 50% tissue culture infective dose (TCID50) endpoint method was employed. Caco-2-SARS-CoV-2 N cells were seeded into 96-well plates and grown to full confluence. The viral stock was then serially diluted 10-fold in serum-free medium at dilutions of 10−1, 10−2, 10−3, 10−4, 10−5, and 10−6 with eight replicates for each dilution. After removing the cell culture supernatant, the diluted virus solutions were added to the cells. Following a 48-h incubation period, the number of fluorescent cells in each well was counted under a fluorescence microscope. The TCID50 was calculated using the Reed-Muench method (Reed and Muench, 1938).
Follow-up experiments were conducted by infecting Caco-2-N* cell lines or mouse lung models expressing the N proteins with specific titers of RDPs. This system has been widely applied in viral mutation research (Deng et al., 2024; Ricardo-Lax et al., 2021; Wang et al., 2024).
Dual-luciferase assay
HEK293T or A549 cells were seeded onto 24-well plates and transfected with various plasmid combinations. A plasmid with 50 ng of firefly luciferase reporter controlled by NF-κB/IL-8–responsive element was utilized for conducting reporter activity assessments, while an additional 20 ng of Renilla luciferase control plasmid (pRL-TK) served as an internal reference. Following transfection for 24 h, cells underwent stimulation with SeV, TNF-α, or IL-1β for an additional duration of either 4 or 10 h. The cells were then lysed using a passive lysis buffer and subjected to dual-luciferase activity measurements utilizing the Luciferase Reporter Assay System (E1910; Promega). The Dual-Glo program on the Glomax 20/20 luminometer (Promega) was opened, the measurement time was set to 10 s, 20 μl of substrate I was added to 20 μl of cell lysate in each well to obtain value A, then 20 μl of substrate II was added and the value B was measured. The ratio of A to B indicates the relative expression level for each well. Three biological replicates were performed for each experimental group.
Immunoblot and co-immunoprecipitation assays
Cells were collected and lysed in NP-40 lysis buffer containing 50 mM Tris pH 7.4, 150 mM NaCl, and 1% NP-40 at 4°C for 30 min, and boiled in 1% SDS for 10 min. The lysates were subjected to SDS-PAGE, transferred onto nitrocellulose transfer (NT) membranes (66485; BioTrace), and then blotted with indicated antibodies. Immunoblots were developed with Western Chemiluminescent HRP Substrate (WBKLS0500; Millipore). Membranes were exposed to films or imaged with ChemiDoc Imaging System (12003154; Bio-Rad).
HEK293T cells were seeded onto 6-cm dishes and transfected with a total of 3 μg of empty plasmid or various expression plasmids. At 36 h after transfection, the cells were lysed in NP-40 lysis buffer and protease inhibitor cocktail (HY-K0010; MCE) at 4°C for 30 min. After centrifugation, the cell lysates were incubated with Anti-Flag Magnetic Beads (HY-K0207; MCE), Anti-HA Magnetic Beads (HY-K0201; MCE), or antibody and ProteinA/G Magnetic Beads (HY-K0202; MCE) mixture at 4°C overnight on a rotator. six washes with tris-buffered saline with tween-20 (TBST)/phosphate-buffered saline with tween-20 (PBST) wash buffer (CR10301S/CR10201S; Monad) was followed by SDS-PAGE and immunoblotting analysis. The grayscale quantification was carried out by ImageJ software.
RNA isolation and RT-qPCR
Total RNA was isolated with TRIzol reagent (15596026; Ambion) according to the manufacturer’s instructions. The total mRNA was reversely transcribed into cDNA with PrimeScript RT reagent Kit (RR037A; Takara). The RT-qPCR was performed with an ABI Q5 Real TIME PCR System using Hieff qPCR SYBR Green Master Mix (11202ES08; Yeasen). mRNA data were normalized to GAPDH relative to those of negative control cells. Three technical replicates were performed for each experimental group. The primers for qPCR are listed in Table S3.
His pull-down assay
The pET21a-SARS-CoV-2 N-His plasmid was transformed into E. coli (BL21) competent cells and a single colony was selected and added to the LB culture medium. When the culture reached an OD600 of 0.6–0.8, IPTG was added to a final concentration of 0.4 mM. Protein expression was induced overnight at 18°C for ∼18 h, after which the cells were collected and lysed. The lysate was incubated with Ni-NTA (L00250; Genscript) resin at 4°C for 4 h. After incubation, non-specific proteins were washed off and the His-tagged SARS-CoV-2 N protein was eluted. The eluate was quantified by measuring the OD280.
The pGEX-6P-1-TAK1/TAB2/TAB3-GST plasmids were also transformed into E. coli (BL21). The same steps as above were used to collect and lyse strains. The GST-tagged TAK1/TAB2/TAB3 proteins were purified by the GST Fusion Protein Purification Kit (L00207; Genscript). The eluate was quantified by measuring the OD280.
The E. coli–purified His-SARS-CoV-2 N protein was incubated with His magnetic beads (HY-K0209; MCE) for 4 h and then washed with precooled PBST three times. The E. coli–purified GST-TAK1, GST-TAB2, and GST-TAB3 proteins were added and incubated at 4°C overnight and then washed with precooled PBST five times. They were then boiled in 1% SDS for 15 min. The sample was followed by SDS-PAGE and immunoblotting analysis.
Confocal microscopy
HeLa cells were cultured on coverslips and transfected with GFP-TAB2 or GFP-TAB3 and DsRed-SARS-CoV-2 for 24 h. Then the cells were fixed for 15 min with 4% paraformaldehyde. Nuclei were stained with DAPI. Huh7 cells were cultured on coverslips and infected with SARS-CoV-2 for 24 or 48 h. The cells were fixed with 4% paraformaldehyde for 15 min, followed by treatment with 0.1% Triton X-100 (BL934B; Biosharp) for another 15 min. Then, the cells were blocked with 5% BSA for 1 h. Cells were incubated overnight with anti-N antibody, anti-TAB2 antibody, or anti-TAB3 antibody (1:200 in PBS) followed by staining with secondary antibodies (Alexa Fluor R488; Invitrogen or Alexa Fluor M568; Invitrogen) for 2 h at room temperature in the dark. The cell nucleus was stained with DAPI. Images were scanned on a Leica SP8 confocal laser scanning microscope with an HC PL APO CS2 63× oil immersion objective using photomultiplying tubes and hybrid detectors. The acquired images were processed with Leica Application Suite X software.
Flow cytometry analysis
Caco-2 cells were seeded in 24-well plates and infected with DRPs at an MOI of 0.01 when cells reached 80% confluency. After 2 h, the medium was replaced with a serum-free medium. At specific time points after infection, the supernatant was discarded and the cells were resuspended in PBS and filtered. Since DRPs carry a GFP signal, flow cytometry was performed directly without staining or compensation adjustment. Blank controls were used to set parameters, identifying live and single-cell populations. GFP-positive cells were gated based on the negative control and the data were analyzed by Flow cytometer (CytoFLEX) and FlowJo software.
Animal experiments
B6/JGpt-H11em1Cin(K18-ACE2)/Gpt mice (K18-hACE2 KI mice, heterozygote, # T037657) were purchased from GemPharmatech Co. Ltd. (Liu et al., 2023).
The animal experiments were performed by certified staff at the Center for Animal Experiments of Wuhan University (AAALAC # 001274). The protocols and procedures for handling lentivirus and SARS-CoV-2 RDP in the Animal Biosafety Level-II Laboratory facility were approved by the (IBC (AUP # 22100B, AUP # SKLV-AE2022-008, and AUP # SKLV-AE2023-007). All the samples were inactivated according to IBC-approved standard procedures for the removal of specimens from high containment.
Male mice (six per group, aged 8–10 wk) were infected with lentivirus (1 × 10⁷ copies/ml, 100 μl per mouse) expressing SARS-CoV-2 N, SARS-CoV N, E290D, and Q349N proteins via tracheal instillation for 7 days. On day 8, they received an intraperitoneal injection of LPS (5 mg/kg) or PBS (100 μl). Lung tissues were collected 10 h after the injection of LPS or PBS.
Male mice (six per group, aged 8–10 wk) were infected with lentivirus (1 × 10⁸ copies/ml, 100 μl per mouse) expressing SARS-CoV-2 N, SARS-CoV N, E290D, and Q349N protein via nasal drops on day 0 and day 4. On day 10, the RDPs (1 × 10⁷ TCID50, 100 μl per mouse) infected the lungs of K18-hACE2 KI mice expressing N variants via nasal drops for 6 days. Alveolar lavage fluid and lung tissue were collected on day 16. Alveolar lavage solution was utilized for the detection of the Mouse IL-6/TNF-α/CXCL10 ELISA Kit (MU30044/MU30030/MU30337; Bioswamp), while lung homogenate RNA was extracted for RT-qPCR. The HE and immunofluorescence stain and imaging were carried out by Wuhan Pinuofei Biological Technology company.
Hematoxylin-eosin staining
The tissue sections were prepared following Pinuofei’s experimental standard operating procedure (SOP). Paraffin sections were deparaffinized using two rounds of Environmental Friendly Dewaxing Transparent Liquid (20 min each), followed by immersion in anhydrous ethanol (5 min each), and 75% ethanol (5 min). After rinsing with tap water, the sections were treated with HD constant staining pretreatment solution (1 min), stained with Hematoxylin (3–5 min), differentiated, blued, and rinsed. Eosin was applied for 15 s, followed by dehydration in absolute ethanol and normal butanol (2 min each), and finally xylene (2 min each). The sections were sealed with neutral gum. Images were acquired using a 3DHISTECH PANNORAMIC MIDI scanner and analyzed with CaseViewer software.
RNA-seq analysis
Total RNA was extracted from the indicated cells using the TRIzol reagent (15596026; Ambion). DNA digestion was carried out after RNA extraction by DNase I (HY-108882; MCE). RNA quality was determined by examining A260/A280 with Nanodrop (Thermo Fisher Scientific). The integrity of the RNAs obtained was verified through 1.5% agarose gel electrophoresis analysis. Qualified RNAs were finally quantified by Qubit 3.0 with Qubit RNA Broad Range Assay kit (Q10210; Life Technologies). 1 μg total RNAs were used for stranded RNA-seq library preparation using Fast RNA-Seq Lib Prep Module kit (RK20306; ABclonal). PCR products corresponding to 200–500 bps were enriched, quantified, and finally sequenced on a Novaseq 6000 sequencer (Illumina) with a PE150 model. Quality analysis of RNA-seq data was performed. Raw reads were filtered by fastp (version 0.23.1). Clean reads were then mapped to the human genome (GRCm38) with parameters “–sjdbScore 1 –outFilterMultimapNmax 20 –outFilter-MismatchNmax 999 –outFilterMismatchNoverReadLmax0.04 –alignIntronMin 20 –alignIntronMax 1000000 –alignMatesGapMax 1000000 –alignSJoverhangMin 8 –alignSJDBoverhangMin 1.” Gene expression was calculated by featureCounts in SubReads package (v1.5.3) with the “-M” parameter. DESeq2 software was used to model the raw reads. Fold change >2 and P value <0.05 were used to determine whether a gene was significantly differentially expressed. The overall differentially expressed genes were obtained by comparison between samples. The intersection of all differentially expressed genes between samples was drawn into a Heatmap. GSEA was performed using the Cluster Profiler software package (v 3.14.3).
Statistical analysis
All data are presented as mean with SEM, generated by GraphPad Prism 8.4.0. The statistical significance analyses were performed using a two-sided unpaired t test (P values) between two groups. *P < 0.05, **P < 0.01, ***P < 0.001, and ****P < 0.0001. P < 0.05 was considered statistically significant. Data distribution was assumed to be normal but this was not formally tested.
Online supplemental material
Fig. S1 shows that the SARS-CoV-2 N protein inhibits SeV- and IL-1β–induced NF-κB activation, unlike the SARS-CoV N protein. Fig. S2 compares viral RNA levels, protein expression, and intracellular localization during RDPs infection and real virus infection. Fig. S3 shows that the SARS-CoV-2 N protein inhibits NF-κB promoter activation by interfering with the TAK1–TAB1/2/3 complex. Fig. S4 shows that Glu-290 and Gln-349 in the CTD of SARS-CoV-2 N protein are key sites for inhibiting the NF-κB pathway. Fig. S5 shows that the SARS-CoV-2 N protein suppresses LPS-induced pulmonary inflammation in mice. Table S1 displays the primers and plasmid vectors utilized for cloning. Table S2 presents detailed information on the antibodies employed in this study. Table S3 lists the qPCR primers.
Data availability
RNA-seq data have been deposited in the GSA database under the accession number: HRA004999. All other data are included in the article and supplemental information.
Acknowledgments
This work was supported by National Key R&D Program of China (2021YFC2300700 to L. Zhou and 2021YFF0702000 to Y. Chen), National Natural Science Foundation of China (grants 82372223, 82341061, and 82172243 to Y. Chen), Fundamental Research Funds for the Central Universities (2042023kf1028 and 2042022dx0003 to Y. Chen), Natural Science Foundation of Hubei Province (2022CFB624 to Z. Cai, 2022CFA047 to K. Xu, and 2024AFB906 to L. Zhou), and the Knowledge Innovation Program of Wuhan-Basic Research (2022020801010119 to L. Zhou and 2022020801010116 to K. Xu). The funders had no role in study design, data collection, and analysis, the decision to publish, or the preparation of the manuscript.
Author contributions: X. Guo: Conceptualization, Data curation, Formal analysis, Investigation, Methodology, Project administration, Supervision, Validation, Visualization, Writing - original draft, Writing - review & editing, S. Yang: Formal analysis, Investigation, Visualization, Z. Cai: Conceptualization, Data curation, Funding acquisition, Validation, Writing - original draft, Writing - review & editing, S. Zhu: Investigation, Validation, H. Wang: Investigation, Q. Liu: Methodology, Project administration, Z. Zhang: Investigation, Methodology, J. Feng: Resources, X. Chen: Resources, Y. Li: Resources, J. Deng: Conceptualization, Methodology, Resources, J. Liu: Resources, J. Li: Resources, X. Tan: Resources, Z. Fu: Resources, K. Xu: Funding acquisition, Methodology, Writing - review & editing, L. Zhou: Conceptualization, Data curation, Formal analysis, Funding acquisition, Investigation, Project administration, Supervision, Writing - original draft, Writing - review & editing, Y. Chen: Conceptualization, Data curation, Formal analysis, Funding acquisition, Investigation, Methodology, Project administration, Resources, Supervision, Validation, Visualization, Writing - original draft, Writing - review & editing.
References


