


Adult oligodendrocyte progenitors (aOPCs) generate myelinating oligodendrocytes like neonatal progenitors (nOPCs), and they also display unique functional features. Here, using unbiased histone proteomics analysis and ChIP sequencing analysis of PDGFRα+ OPCs sorted from neonatal and adult Pdgfra-H2B-EGFP reporter mice, we identify the activating H4K8ac histone mark as enriched in the aOPCs. We detect increased occupancy of the H4K8ac activating mark at chromatin locations corresponding to genes related to the progenitor state (e.g., Hes5, Gpr17), metabolic processes (e.g., Txnip, Ptdgs), and myelin components (e.g., Cnp, Mog). aOPCs showed higher levels of transcripts related to lipid metabolism and myelin, and lower levels of transcripts related to cell cycle and proliferation compared with nOPCs. In addition, pharmacological inhibition of histone acetylation decreased the expression of the H4K8ac target genes in aOPCs and decreased their proliferation. Overall, this study identifies acetylation of the histone H4K8 as a regulator of the proliferative capacity of aOPCs.
Introduction
Adult oligodendrocyte progenitors (aOPCs) are slowly proliferative cells, distributed throughout the gray and white matter and representing 5–8% of all adult brain cells (Dawson et al., 2003). These cells possess electrical signaling properties and have been shown to receive neuronal synapses (Bergles et al., 2000; Gallo et al., 2008; Lin and Bergles, 2004) and to retain the ability to form new myelin upon neuronal stimulation (Gibson et al., 2014; Ortiz et al., 2019). For instance, aOPCs differentiate in response to motor learning and other cognitive tasks (Bacmeister et al., 2020; McKenzie et al., 2014; Pan et al., 2020) and generate new myelinating oligodendrocytes following demyelination (Sim et al., 2002; Zawadzka et al., 2010). Adult OPCs share immunoreactivity for progenitor markers with neonatal oligodendrocyte progenitors (nOPCs), although they differ in terms of proliferation, migration (Wolswijk et al., 1990; Wolswijk and Noble, 1989), and response to external signals (Lin et al., 2009). Previous studies have reported transcriptional differences between nOPCs and aOPCs (Moyon et al., 2015; Marques et al., 2016; Neumann et al., 2019; Spitzer et al., 2019), although the underlying molecular mechanisms remain not well understood. We and others previously highlighted the importance of transcription factors (Emery and Lu, 2015; Hernandez and Casaccia, 2015; Pruvost and Moyon, 2024) and of histone and DNA modifications responsible for the differentiation of nOPCs into oligodendrocytes during developmental myelination (Dansu et al., 2021; Selcen et al., 2023). For instance, it was shown that proliferating nOPCs are characterized by euchromatic nuclei and enriched with acetylated lysine residues in the tail of histone H3. The transition from growth arrest to differentiation was shown to be initiated by repressive deacetylation, mediated by HDACs (Swiss et al., 2011; Shen et al., 2005), and to be responsible for the downregulation of transcriptional inhibitors of differentiation (Magri et al., 2014; Swiss et al., 2011; Wu et al., 2012). The deposition of methyl groups on specific lysine residues of Histone H3, mediated by SUV39H1/2 and EZH2, was also shown to play a critical role in repressing and downregulating genes associated with alternative lineages, cell cycle, and electrical properties (Boshans et al., 2019; Liu et al., 2015). Additional epigenetic mechanisms of gene repression such as DNMT1-mediated DNA methylation (Moyon et al., 2016) and recruitment of repressive heterochromatin to the nuclear lamina (Pruvost et al., 2023) were shown to be important for the acquisition and maintenance of the differentiated oligodendrocyte phenotype. Additional studies also reported the necessity of DNA hydroxymethylation (Moyon et al., 2021; Zhang et al., 2021) and ATP-dependent SWI/SNF chromatin-remodeling complexes (Yu et al., 2013). Overall, this suggests that specific epigenetic marks define the path leading nOPCs toward mature oligodendrocytes during developmental myelination, and possibly also toward the aOPC pool.
In this study, we hypothesized that by escaping differentiation during developmental myelination, aOPCs may adopt histone marks that are distinct from those used by nOPCs. This underlying epigenetic signature may account for the functional differences between the two cell states. Using RNA sequencing (RNA-seq), unbiased histone proteomics, and chromatin immunoprecipitation sequencing (ChIP-seq), we identify and characterize H4K8ac as a key regulator in defining the transcriptional identity and proliferative capacity of aOPCs.
Results
The transcriptome of aOPCs is distinct from that of nOPCs
To begin characterizing the intrinsic differences between nOPCs and aOPCs, we reanalyzed our RNA sequencing data of cells sorted from Pdgfra-H2B-EGFP reporter mice (Hamilton et al., 2003) at postnatal day 2 (P2) and 60 (P60), respectively (Fig. 1 A). Differential gene expression analysis revealed 2,747 genes significantly upregulated and 4,366 genes significantly downregulated in PDGFRα+ aOPCs, with a log2 fold change |log2FC| > 1 and a false discovery rate (FDR) < 0.01 (Fig. 1, A and B). Gene Set Enrichment Analysis (GSEA) (Yu et al., 2012) was performed to identify the classes of genes significantly over-represented among the differentially expressed genes. The gene ontology categories associated with the differentially expressed genes in PDGFRα+ aOPCs compared with nOPCs are shown in the dot plot (Fig. 1 C). Notably, downregulated genes included several cell cycle genes such as Ccnd1 and Ccnd2, which regulate the G1/S transition. In addition, the downregulated genes were associated with biological processes such as cell migration and extracellular matrix organization (Fig. 1 C), consistent with previously published transcriptomic datasets (Neumann et al., 2019; Spitzer et al., 2019). Conversely, upregulated genes included several transcripts characteristic of the differentiated state, such as those involved in myelin sheath formation (e.g., Cnp, Mog) and lipid metabolic process (e.g., Ptdgs, Pip4k2a). GSEA analysis further confirmed the upregulation of biological processes related to the metabolic process and autophagy (Fig. 1 C), consistent with recently published proteomic data on aOPCs (de la Fuente et al., 2020). Heat map representations further highlighted that downregulated genes in PDGFRα+ aOPCs were related to cell cycle and proliferation (Fig. 1 D), whereas upregulated genes were mostly related to lipid metabolism (Fig. 1 E) and myelin sheath (Fig. 1 F). Together, these results further highlight functional divergence reflected by the transcriptomic differences between PDGFRα+ aOPCs and nOPCs.

The transcriptome of PDGFRα + adult oligodendrocyte progenitors is distinct from that of the neonatal progenitors. (A) Flowchart of fluorescence-activated cell sorting of nOPCs (n = 3) and aOPCs (n = 3) from Pdgfra-H2B-EGFP reporter mice followed by RNA-seq analysis. (B) Volcano plot showing the differentially expressed genes between aOPCs and nOPCs. Differentially downregulated genes in aOPCs compared with nOPCs are shown in blue and differentially upregulated genes are shown in red. (C) Dot plot showing the GSEA gene ontology categories associated with the differentially expressed genes in aOPCs compared to nOPCs. (D–F) Heatmaps of selected biological processes with downregulated genes in aOPCs compared with nOPCs in blue and upregulated genes in red. Note that genes within cell cycle and proliferation ontologies are expressed at lower levels in aOPCs (D), while lipid metabolic process (E) and myelin sheath (F) are expressed at higher levels.
The transcriptome of PDGFRα + adult oligodendrocyte progenitors is distinct from that of the neonatal progenitors. (A) Flowchart of fluorescence-activated cell sorting of nOPCs (n = 3) and aOPCs (n = 3) from Pdgfra-H2B-EGFP reporter mice followed by RNA-seq analysis. (B) Volcano plot showing the differentially expressed genes between aOPCs and nOPCs. Differentially downregulated genes in aOPCs compared with nOPCs are shown in blue and differentially upregulated genes are shown in red. (C) Dot plot showing the GSEA gene ontology categories associated with the differentially expressed genes in aOPCs compared to nOPCs. (D–F) Heatmaps of selected biological processes with downregulated genes in aOPCs compared with nOPCs in blue and upregulated genes in red. Note that genes within cell cycle and proliferation ontologies are expressed at lower levels in aOPCs (D), while lipid metabolic process (E) and myelin sheath (F) are expressed at higher levels.
The enrichment plot revealed higher transcript levels of oligodendrocyte stage-specific genes, such as those related to the myelin sheath (Fig. 2 A). To rule out that these findings could be due to the potential contamination of the aOPC samples with mature oligodendrocytes, we used RNAscope fluorescent in situ hybridization and a probe specific for Pdgfra to unequivocally identify progenitors in the adult or neonatal brain. The co-detection of this progenitor marker and myelin transcripts such as Cnp (Fig. 2 B) in sections from the adult (P60) but not neonatal (P5) brain further supported the presence of myelin transcripts in PDGFRα+ aOPCs, but not in nOPCs. Similarly, GSEA enrichment plots revealed higher levels of lipid metabolism in aOPCs compared with nOPCs (Fig. 2 C), a finding supported also by the detection of the prostaglandin synthetic enzyme Ptgds transcript only in PDGFRα+ aOPCs and not in nOPCs (Fig. 2 D). Overall, these data suggest a unique pattern of gene expression in these cells, characterized by the co-expression of progenitor and mature cell markers.

Adult OPCs are characterized by higher transcript levels of oligodendrocyte stage-specific genes. (A) GSEA plot showing enrichment of genes related to the myelin sheath in aOPCs. (B) Confocal image of neonatal (P5) and adult (P60) mouse brain sections, after in situ hybridization using RNAscope and probes specific for the myelin gene Cnp (red), for the transcription factor Olig2+ (white) and the progenitor marker Pdgfrα+ (green). DAPI (blue) used as a nuclear counterstain. (C) GSEA plot showing enrichment of genes related to lipid metabolism in aOPCs. (D) Confocal image of neonatal (P5) and adult (P60) mouse brain sections after in situ hybridization using RNAscope and probes specific for the oligodendrocyte specific gene Ptgds (red), Olig2+ (white), and Pdgfrα+ (green). DAPI (blue) was used as a nuclear counterstain.
Adult OPCs are characterized by higher transcript levels of oligodendrocyte stage-specific genes. (A) GSEA plot showing enrichment of genes related to the myelin sheath in aOPCs. (B) Confocal image of neonatal (P5) and adult (P60) mouse brain sections, after in situ hybridization using RNAscope and probes specific for the myelin gene Cnp (red), for the transcription factor Olig2+ (white) and the progenitor marker Pdgfrα+ (green). DAPI (blue) used as a nuclear counterstain. (C) GSEA plot showing enrichment of genes related to lipid metabolism in aOPCs. (D) Confocal image of neonatal (P5) and adult (P60) mouse brain sections after in situ hybridization using RNAscope and probes specific for the oligodendrocyte specific gene Ptgds (red), Olig2+ (white), and Pdgfrα+ (green). DAPI (blue) was used as a nuclear counterstain.
Identification of histone posttranslational modifications distinguishing aOPCs and nOPCs
To begin addressing the question of age-induced epigenetic differences occurring in OPCs, we performed an unbiased proteomic analysis of the posttranslational modifications of nucleosomal histones extracted from the nuclei of nOPCs and aOPCs, sorted from the brain of Pdgfra-H2B-EGFP reporter mice (Fig. 3 A). The analysis identified several histone modifications of lysine residues in the tails of histones H3 and H4 (Fig. 3, B and C). While several modifications of histone H3 (e.g., H3K27ac, H3K27me3) were not consistently detected and validated as different between the two cell populations (Fig. 3, D–E, Fig. S1, A and B, and Table S1), the levels of several posttranslational modifications of residues in histone H4 were consistently found to be differentially abundant in PDGFRα+ aOPCs compared with nOPCs (Table S1). These findings were further validated through western blot analysis (Fig. 3, F and G; and Fig. S1, C and D). In PDGFRα+ aOPCs we identified higher levels of activating acetylation of lysine residues 8 (H4K8ac) and 12 (H4K12ac) on histone H4 (Fig. 3, F and G), alongside increased levels of repressive trimethylation of lysine 20 (H4K20me3) on histone H4 (Fig. S1, C and D). Interestingly, not all lysine residues in histone H4 showed higher levels of acetylation as, for instance, lysine 5 (H4K5ac) had lower levels of acetylation in aOPCs compared with nOPC (Fig. 3 G), a modification we previously reported to be associated with the differentiation of nOPCs into oligodendrocytes (Scaglione et al., 2018).

Adult oligodendrocyte progenitors are characterized by distinct histone H4 acetylation marks compared to neonatal progenitors. (A) Flowchart of the experimental approach conducted on histone extracts obtained from nOPCs (n = 3) and aOPCs (n = 3) sorted from Pdgfra-H2B-EGFP reporter mice. (B and C) Summary of the results of the unbiased histone proteomic analysis. The schematics show the amino acid sequence in the tail of histone H3 (B) and histone H4 (C), with all the histone PTMs identified by squares (acetylation), circles (methylation), and triangles (phosphorylation). (D) Western blots of histone extracts from three independent preparations of sorted nOPCs and aOPCs, probed with antibodies specific for the indicated acetylated lysine residues on histone H3 (H3K9ac, H3K18ac, and H3K27ac). Total H3 levels were used as a reference for equal loading. (E) Quantification of the immunoreactive bands for H3K9ac, H3K18ac, and H3K27ac relative to total H3. Data represented as mean ± SD for n = 3 independent biological samples (ns = not significant, two-tailed Student’s t test). (F) Western blots of histone extracts from three independent preparations of sorted nOPCs and aOPCs, probed with antibodies specific for the indicated acetylated lysine residues on histone H4 (H4K8ac, H4K12ac, H4K16ac, and H4K5ac). (G) Quantification of H4K8ac, H4K12ac, H4K16ac, and H4K5ac levels relative to the levels of total H4. Data represented as mean ± SEM for n = 3 independent biological samples (*P < 0.05, **P < 0.01 two-tailed Student’s t test). Source data are available for this figure: SourceData F3.
Adult oligodendrocyte progenitors are characterized by distinct histone H4 acetylation marks compared to neonatal progenitors. (A) Flowchart of the experimental approach conducted on histone extracts obtained from nOPCs (n = 3) and aOPCs (n = 3) sorted from Pdgfra-H2B-EGFP reporter mice. (B and C) Summary of the results of the unbiased histone proteomic analysis. The schematics show the amino acid sequence in the tail of histone H3 (B) and histone H4 (C), with all the histone PTMs identified by squares (acetylation), circles (methylation), and triangles (phosphorylation). (D) Western blots of histone extracts from three independent preparations of sorted nOPCs and aOPCs, probed with antibodies specific for the indicated acetylated lysine residues on histone H3 (H3K9ac, H3K18ac, and H3K27ac). Total H3 levels were used as a reference for equal loading. (E) Quantification of the immunoreactive bands for H3K9ac, H3K18ac, and H3K27ac relative to total H3. Data represented as mean ± SD for n = 3 independent biological samples (ns = not significant, two-tailed Student’s t test). (F) Western blots of histone extracts from three independent preparations of sorted nOPCs and aOPCs, probed with antibodies specific for the indicated acetylated lysine residues on histone H4 (H4K8ac, H4K12ac, H4K16ac, and H4K5ac). (G) Quantification of H4K8ac, H4K12ac, H4K16ac, and H4K5ac levels relative to the levels of total H4. Data represented as mean ± SEM for n = 3 independent biological samples (*P < 0.05, **P < 0.01 two-tailed Student’s t test). Source data are available for this figure: SourceData F3.
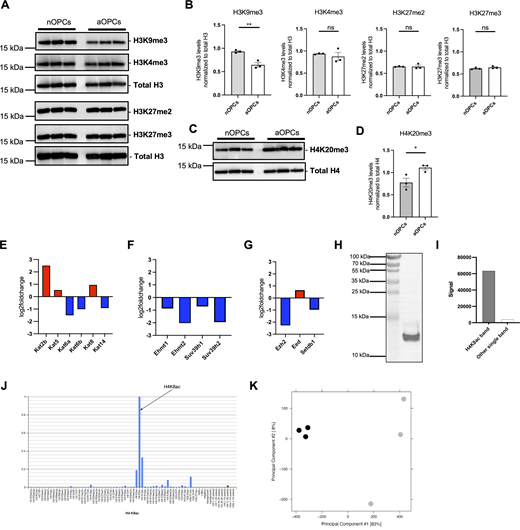
Differential histone methylation marks and differential expression of lysine acetyltransferases in aOPCs and validation of antibody specificity and overall quality assessment of ChIP-seq data. (A) Western blots of histone extracts from three independent preparations of sorted nOPCs and aOPCs, probed with antibodies specific for the indicated methylated lysine residues on histone H3 (H3K9me3, H3K4me3, H3K27me2, and H3K27me3) in histone extracts from nOPCs and aOPCs. The total H3 blot in this figure is the same as the total H3 blot in Fig. 3 D. The membrane was stripped and reprobed for different histone H3 marks. (B) Quantification of H3K9me3, H3K4me3, H3K27me2, and H3K27me3 levels after normalization to total H3. Data represented as mean ± SEM normalized to total histone H3 for n = 3 (**P < 0.01, two-tailed-Student’s t test). (C) Western blots of histone extracts from three independent preparations of sorted nOPCs and aOPCs, probed with antibodies specific for the histone H4K20me3 mark. The total H4 blot in this figure is the same as the total H4 blot in Fig. 3 F. The membrane was stripped and reprobed for different histone H4 marks. (D) Quantification of H4K20me3 levels after normalization to total H4. Data represented as mean ± SEM normalized to total histone H4 for n = 3 (*P < 0.05, two-tailed Student’s t test). (E–G) Differential expression of lysine acetyltransferases (KATs) (E), H3K9 histone methyltransferases (F), and H3K27 histone methyltransferases (G) in aOPCs compared with nOPCs. (H and I) Western blot analysis showing ∼16-fold enrichment of H4K8ac signal relative to any other band in whole cell extracts of Oli-neu ceIls (ENCODE guideline—primary characterization). (J) Results from the modified peptide array (Active Motif, 13005) were used to validate the specificity of the H4K8ac antibody in the presence of competing peptides (ENCODE guideline—secondary characterization). (K) PCA plot assessing the overall quality of ChIP sequencing performed on nOPCs (gray) and aOPCs (black). Source data are available for this figure: SourceData FS1.
Differential histone methylation marks and differential expression of lysine acetyltransferases in aOPCs and validation of antibody specificity and overall quality assessment of ChIP-seq data. (A) Western blots of histone extracts from three independent preparations of sorted nOPCs and aOPCs, probed with antibodies specific for the indicated methylated lysine residues on histone H3 (H3K9me3, H3K4me3, H3K27me2, and H3K27me3) in histone extracts from nOPCs and aOPCs. The total H3 blot in this figure is the same as the total H3 blot in Fig. 3 D. The membrane was stripped and reprobed for different histone H3 marks. (B) Quantification of H3K9me3, H3K4me3, H3K27me2, and H3K27me3 levels after normalization to total H3. Data represented as mean ± SEM normalized to total histone H3 for n = 3 (**P < 0.01, two-tailed-Student’s t test). (C) Western blots of histone extracts from three independent preparations of sorted nOPCs and aOPCs, probed with antibodies specific for the histone H4K20me3 mark. The total H4 blot in this figure is the same as the total H4 blot in Fig. 3 F. The membrane was stripped and reprobed for different histone H4 marks. (D) Quantification of H4K20me3 levels after normalization to total H4. Data represented as mean ± SEM normalized to total histone H4 for n = 3 (*P < 0.05, two-tailed Student’s t test). (E–G) Differential expression of lysine acetyltransferases (KATs) (E), H3K9 histone methyltransferases (F), and H3K27 histone methyltransferases (G) in aOPCs compared with nOPCs. (H and I) Western blot analysis showing ∼16-fold enrichment of H4K8ac signal relative to any other band in whole cell extracts of Oli-neu ceIls (ENCODE guideline—primary characterization). (J) Results from the modified peptide array (Active Motif, 13005) were used to validate the specificity of the H4K8ac antibody in the presence of competing peptides (ENCODE guideline—secondary characterization). (K) PCA plot assessing the overall quality of ChIP sequencing performed on nOPCs (gray) and aOPCs (black). Source data are available for this figure: SourceData FS1.
The differential levels of H4K8ac detected in sorted nuclei were further validated by immunohistochemistry (IHC) of brain sections from neonatal and adult Pdgfra-H2B-EGFP reporter mice using antibodies specific to H4K8ac. Consistent with the findings from histone proteomics and western blot analyses, confocal analysis conducted on brain sections revealed higher intensity of H4K8ac in PDGFRα+ aOPCs compared with nOPCs both in the cortex (Fig. 4, A and B) and in the corpus callosum (Fig. 4, C and D). However, this increase was not limited to cells of the oligodendrocyte lineage. Furthermore, transcripts of the enzymes responsible for H4K8ac deposition, such as KAT2B and KAT5, were differentially upregulated in PDGFRα+ aOPCs compared with nOPCs, whereas methylation histone marks did not show significant differences (Fig. S1, E–G). Taken together, these results highlight the prominence of specific posttranslational modifications on lysine residues in histone H4 as more prevalent in aOPCs compared with nOPCs and suggest that they may contribute to the transcriptional and functional differences between these two cell types.

Adult OPCs in the adult mouse brain have higher levels of H4K8ac compared with neonatal OPCs in the developing mouse brain. (A) Confocal image of cortical areas in coronal brain sections from neonatal (P5) and adult (P60) Pdgfra-H2B-EGFP mice, stained with H4K8ac specific antibodies (red) and DAPI (blue) as a nuclear counterstain. PDGFRα+ cells identified by EGFP expression (green). Scale bar = 50 μm (insert = 2 μm). (B) Violin plots of the nuclear intensity of H4K8ac immunoreactivity in PDGFRα+ cells in developing (nOPCs) and adult (aOPCs) brains. Data represent the H4K8ac immunoreactivity measured in 200 cells from brain sections of three mice (****P < 0.0001, Mann–Whitney non-parametric test). (C) Confocal image of corpus callosum areas in coronal brain sections from neonatal (P5) and adult (P60) Pdgfra-H2B-EGFP mice, stained with H4K8ac specific antibodies (red) and DAPI (blue) as nuclear counterstain. PDGFRα+ cells identified by EGFP expression (green). Scale bar = 50 μm (insert = 2 μm). (D) Violin plots of nuclear intensity of H4K8ac immunoreactivity in PDGFRα+ cells in developing (nOPCs) and adult (aOPCs) brains. Data represent the H4K8ac immunoreactivity measured in 225 cells from n = 3 mice (**P < 0.01, Mann–Whitney non-parametric test).
Adult OPCs in the adult mouse brain have higher levels of H4K8ac compared with neonatal OPCs in the developing mouse brain. (A) Confocal image of cortical areas in coronal brain sections from neonatal (P5) and adult (P60) Pdgfra-H2B-EGFP mice, stained with H4K8ac specific antibodies (red) and DAPI (blue) as a nuclear counterstain. PDGFRα+ cells identified by EGFP expression (green). Scale bar = 50 μm (insert = 2 μm). (B) Violin plots of the nuclear intensity of H4K8ac immunoreactivity in PDGFRα+ cells in developing (nOPCs) and adult (aOPCs) brains. Data represent the H4K8ac immunoreactivity measured in 200 cells from brain sections of three mice (****P < 0.0001, Mann–Whitney non-parametric test). (C) Confocal image of corpus callosum areas in coronal brain sections from neonatal (P5) and adult (P60) Pdgfra-H2B-EGFP mice, stained with H4K8ac specific antibodies (red) and DAPI (blue) as nuclear counterstain. PDGFRα+ cells identified by EGFP expression (green). Scale bar = 50 μm (insert = 2 μm). (D) Violin plots of nuclear intensity of H4K8ac immunoreactivity in PDGFRα+ cells in developing (nOPCs) and adult (aOPCs) brains. Data represent the H4K8ac immunoreactivity measured in 225 cells from n = 3 mice (**P < 0.01, Mann–Whitney non-parametric test).
Adult OPCs are characterized by increased H4K8ac chromatin occupancy at loci related to oligodendrocyte-specific genes
To explore the functional relevance of specific histone marks in aOPCs, we used ChIP-seq analysis to interrogate the genomic distribution of the H4K8ac mark for loci with differential occupancy in the nuclei of PDGFRα+ nOPCs and aOPCs (Fig. 5 A). We used ChIP-grade antibodies specific for H4K8ac, which were validated using western blot (Fig. S1, H and I) and antibody arrays (Fig. S1 J) according to the ENCODE guidelines. High-quality reads were obtained from six samples (three independent biological chromatin samples each from aOPCs and nOPCs) (Fig. S1 J). A principal component analysis of the data revealed a clear separation of the peaks from PDGFRα+ aOPC and nOPC samples (Fig. S1 K). Comparing PDGFRα+ aOPCs to nOPCs, we detected a similar pattern of distribution of peaks when plotted relative to the transcriptional start site. However, we observed much greater H4K8ac genomic occupancy in chromatin samples from aOPCs than those from nOPCs (Fig. 5 B), correlating with the higher levels of H4K8ac detected in aOPCs. We next performed differential binding analysis to identify genomic locations differentially bound by H4K8ac between these two cell populations (Fig. 5 C). When the peak distribution was analyzed using the genomic features, we noted that 43.2% of the peaks localized at the promoter region, 34.2% at introns, and 18.3% at distal intergenic regions (Fig. 5 D). To assign biological meaning to the chromatin regions with greater deposition of H4K8ac marks in aOPCs, we used the Genomic Regions Enrichment of Annotations Tool (GREAT) (McLean et al., 2010). This analysis revealed that genes underlying biological processes related to protein folding, DNA replication, and mitochondrial DNA metabolic process were among the 4,458 genes with higher levels of the H4K8ac mark at the promoter region. For the genes with differentially acetylated peaks localized to the intronic (2,170 genes) and distal intergenic (1,154 genes) regions, we identified biological processes related to axonal ensheathment and myelination (Fig. 5 E). Together, these results identify H4K8ac occupancy in PDGFRα+ aOPCs at chromatin loci regulating transcription and myelination.

Adult oligodendrocyte progenitors are characterized by increased H4K8ac chromatin occupancy. (A) Flowchart showing the analysis of the H4K8ac ChIP sequencing data from three individual preparations of sorted nOPCs and aOPCs. (B) Genomic heatmaps showing the distribution of H4K8ac peaks in nOPCs and aOPCs at 3 kilobases (kb) around the transcription start site (TSS). (C) Volcano plot showing the differentially called H4K8ac peaks in aOPCs vs nOPCs (significance cut-off at FDR < 0.01). The red circles identify greater genomic occupancy of the H4K8ac mark in aOPCs, while the blue circles represent the few peaks that were present in nOPCs. (D) Pie chart showing the genomic distribution of the H4K8ac differential peaks in the genome of aOPCs, with greater occupancy at promoters, introns, and intergenic regions. (E) Functional annotation of genes with greater H4K8ac genomic occupancy at the promoter, intron, and distal intergenic regions of aOPCs.
Adult oligodendrocyte progenitors are characterized by increased H4K8ac chromatin occupancy. (A) Flowchart showing the analysis of the H4K8ac ChIP sequencing data from three individual preparations of sorted nOPCs and aOPCs. (B) Genomic heatmaps showing the distribution of H4K8ac peaks in nOPCs and aOPCs at 3 kilobases (kb) around the transcription start site (TSS). (C) Volcano plot showing the differentially called H4K8ac peaks in aOPCs vs nOPCs (significance cut-off at FDR < 0.01). The red circles identify greater genomic occupancy of the H4K8ac mark in aOPCs, while the blue circles represent the few peaks that were present in nOPCs. (D) Pie chart showing the genomic distribution of the H4K8ac differential peaks in the genome of aOPCs, with greater occupancy at promoters, introns, and intergenic regions. (E) Functional annotation of genes with greater H4K8ac genomic occupancy at the promoter, intron, and distal intergenic regions of aOPCs.
To better understand the transcriptional consequences of the greater genomic occupancy of the histone H4 mark in aOPCs, we overlapped H4K8ac ChIP-seq data (FDR < 0.01, log2FC [aOPC/nOPC] ≥ 1.5) with RNA-seq data (FDR < 0.01, log2FC [aOPC/nOPC] > 1). We noted that over 60% of the transcripts with higher levels in aOPCs corresponded to genes with chromatin regions bearing the H4K8ac mark (Fig. 6 A). Ontology analysis of these genes identified prominent categories related to the regulation of transcription from RNA polymerase II (19.5%), myelin/lipid metabolic process (16.2%), apoptotic process (11.2%), and protein transport (10.4%) (Fig. 6 B). Visualization of genomic occupancy led to highly reproducible patterns of peak enrichment in aOPCs (compared with nOPCs) in genomic regions corresponding to genes involved in metabolic processes (e.g., Txnip, Ptgds) (Fig. 6 C), progenitor stage genes (e.g., Hes5, Gpr17) (Fig. 6 D), and myelin proteins (e.g., Cnp, Mog) (Fig. 6 E). Together, these data are consistent with the interpretation of H4K8ac as an important activating histone mark, occupying chromatin regions corresponding to genes highly expressed in aOPCs.

Adult OPCs are characterized by H4K8ac occupancy at genomic regions containing lipid metabolic process, transcription factor regulation, and myelin protein. (A) Venn diagram showing the overlap between genes characterized by greater H4K8ac occupancy, as detected by ChIP-seq (FDR < 0.01, log2FC[aOPC/nOPC] ≥ 1.5), and genes upregulated in aOPCs, as detected by RNA-seq (FDR < 0.01, log2FC [aOPC/nOPC] ≥ 1). (B) Pie chart showing the biological processes regulated by genes with greater H4K8ac occupancy and higher expression levels in aOPCs (corresponding to the area of overlap in A). (C–E) Representative Integrative Genomics Viewer (IGV) tracks showing H4K8ac enrichment of aOPC genomic regions containing the genes related to lipid metabolic process (C), transcription factor regulation (D), and myelin protein (E) compared with nOPC genomic regions. Data from nOPCs (blue, n = 3) and aOPCs (red, n = 3) chromatin samples are shown. For each panel, the RefSeq gene track (black) is shown.
Adult OPCs are characterized by H4K8ac occupancy at genomic regions containing lipid metabolic process, transcription factor regulation, and myelin protein. (A) Venn diagram showing the overlap between genes characterized by greater H4K8ac occupancy, as detected by ChIP-seq (FDR < 0.01, log2FC[aOPC/nOPC] ≥ 1.5), and genes upregulated in aOPCs, as detected by RNA-seq (FDR < 0.01, log2FC [aOPC/nOPC] ≥ 1). (B) Pie chart showing the biological processes regulated by genes with greater H4K8ac occupancy and higher expression levels in aOPCs (corresponding to the area of overlap in A). (C–E) Representative Integrative Genomics Viewer (IGV) tracks showing H4K8ac enrichment of aOPC genomic regions containing the genes related to lipid metabolic process (C), transcription factor regulation (D), and myelin protein (E) compared with nOPC genomic regions. Data from nOPCs (blue, n = 3) and aOPCs (red, n = 3) chromatin samples are shown. For each panel, the RefSeq gene track (black) is shown.
O4+ oligodendrocyte progenitors isolated from neonatal and adult brains are also characterized by higher H4K8ac levels and a distinct transcriptome
To manipulate histone marks using pharmacological inhibitors, we switched to a magnetic bead-activated immunosorting (MACS) strategy to isolate O4+ progenitors from the brains of neonatal (P5) and adult (P60) mice (Fig. 7 A). To ascertain differences in histone acetylation marks and transcriptome between cultured neonatal (nO4+OPC) and adult (aO4+OPCs), we assessed the levels of H4K8ac on histone extracts from these two cell populations and also conducted RNA-seq on RNA samples. Consistent with the results previously described in PDGFRα+ aOPCs (Fig. 3, F and G), we observed significantly elevated levels of H4K8ac in aO4+OPCs compared to nO4+OPCs (Fig. 7 B).

O4+oligodendrocyte progenitors isolated from neonatal and adult brains are also characterized by higher H4K8ac levels and a distinct transcriptome. (A) Workflow of magnetic-bead-activated immunosorting of O4+ cells from the brain of neonatal (P5) and adult (P60) mice. (B) Western blots of histone extracts from nO4+OPCs and aO4+OPCs. The H4K8ac levels after normalization to total H4 is shown (right). Data represented as mean ± SD normalized to total histone H4 for n = 3 independent cultures (*P < 0.05, two-tailed Student’s t test). (C) Flowchart of the RNA-seq analysis of samples from nO4+OPC and aO4+OPC. (D) Dot plot showing the GSEA gene ontology categories associated with the differentially expressed genes in aO4+OPCs compared to nO4+OPCs. (E) GSEA showing enrichment of genes related to negative regulation of cell cycle in aO4+OPCs. (F) Representative confocal image of cultured nO4+OPCs and aO4+OPCs after 5 h of EdU incorporation for assessment of cell proliferation. DAPI+ and EdU+ cells are shown in blue and green respectively. Scale bar = 50 μm. (G) Quantification of the percentage of EdU+ cells in nO4+OPCs and aO4+OPCs. Data are represented as mean ± SEM normalized to nO4+OPC samples for n = 3 (***P < 0.001, two-tailed Student’s t test). Source data are available for this figure: SourceData F7.
O4+oligodendrocyte progenitors isolated from neonatal and adult brains are also characterized by higher H4K8ac levels and a distinct transcriptome. (A) Workflow of magnetic-bead-activated immunosorting of O4+ cells from the brain of neonatal (P5) and adult (P60) mice. (B) Western blots of histone extracts from nO4+OPCs and aO4+OPCs. The H4K8ac levels after normalization to total H4 is shown (right). Data represented as mean ± SD normalized to total histone H4 for n = 3 independent cultures (*P < 0.05, two-tailed Student’s t test). (C) Flowchart of the RNA-seq analysis of samples from nO4+OPC and aO4+OPC. (D) Dot plot showing the GSEA gene ontology categories associated with the differentially expressed genes in aO4+OPCs compared to nO4+OPCs. (E) GSEA showing enrichment of genes related to negative regulation of cell cycle in aO4+OPCs. (F) Representative confocal image of cultured nO4+OPCs and aO4+OPCs after 5 h of EdU incorporation for assessment of cell proliferation. DAPI+ and EdU+ cells are shown in blue and green respectively. Scale bar = 50 μm. (G) Quantification of the percentage of EdU+ cells in nO4+OPCs and aO4+OPCs. Data are represented as mean ± SEM normalized to nO4+OPC samples for n = 3 (***P < 0.001, two-tailed Student’s t test). Source data are available for this figure: SourceData F7.
Transcriptional differences were also identified by differential gene expression analysis which revealed 420 transcripts with lower levels and 401 with higher levels in aO4+OPCs compared with nO4+OPCs (FDR < 0.05, |log2FC| > 1) (Fig. 7 C). GSEA analysis of the differentially expressed genes in aO4+OPCs revealed similar gene ontology categories to those previously detected in sorted PDGFRα+ aOPC, such as DNA repair, cell cycle, and lipid metabolism (Fig. 7 D). Overall, the data suggested a lower proliferative rate, consistent with increased levels of negative regulators of the cell cycle (Fig. 7 E), and higher metabolism, consistent with lower expression of genes involved in catabolic pathways.
To assess the lower proliferative rate, we measured the incorporation of 5-ethynyl-2′-deoxyuridine (EdU) over 5 h in cultured nO4+OPCs and aO4+OPCs. In accordance with previous reports (Wolswijk et al., 1990; Wolswijk and Noble, 1989), we detected a lower percentage of EdU incorporation in aO4+OPCs (22.0% ± 2.5%, n = 274 cells counted from three biological experiments) compared with nO4+OPCs (41.8% ± 0.6% n = 204 cells counted from three biological experiments) (Fig. 7, F and G).
Together, these data validated the existence of differential H4K8ac levels and transcriptional and functional differences between aO4+OPCs and nO4+OPCs, which were thereby used in our subsequent studies using pharmacological inhibitors.
Pharmacological inhibition of histone acetylation results in decreased transcripts of cell cycle regulators and functional decrease in cell proliferation in aO4+OPC but not in nO4+OPC
To define whether inhibition of histone acetylation would similarly impact nO4+OPCs and aO4+OPCs, we treated cultured OPCs with two pharmacological inhibitors of histone acetyltransferases responsible for H4K8ac deposition, namely garcinol, an inhibitor of KAT2B and KAT3B (Balasubramanyam et al., 2004) and NU-9056, an inhibitor of KAT5, KAT2B, and KAT3B (Coffey et al., 2012). We reasoned that the combination (KATi) would allow to effectively target the acetyltransferases responsible for histone H4K8 acetylation, such as KAT2B and KAT5 (Kim et al., 2020; Kimura and Horikoshi, 1998), which are expressed at higher levels in aOPCs compared with nOPCs (Fig. S1 E). A reduction of the H4K8ac nuclear fluorescent intensity was used to assess the effectiveness of the pharmacological inhibitor treatment in reducing this histone mark in adult OPCs (Fig. 8, A and B).

Pharmacological inhibition of histone acetylation results in decreased transcripts of cell cycle regulators in aO4 + OPCs but not in nO4 + OPCs. (A) Representative confocal images of aO4+OPCs treated with KATi (5 μM Garcinol and 0.2 μM NU-9056) or with DMSO (as control) for 48 h and stained with DAPI (blue) and H4K8ac (green). Scale bar = 50 μm. (B) Violin plots showing the nuclear intensity of H4K8ac in KATi treated aO4+OPCs and DMSO controls. Data represent H4K8ac nuclear immunoreactivity measured in a total of 150 cells from three biological replicates (****P < 0.0001, Mann–Whitney non-parametric test). (C) Experimental workflow of RNA-seq analysis on samples from nO4+OPCs (n = 5) and aO4+OPCs (n = 4) treated with KATi and DMSO used as control. (D) Dot plots showing differentially upregulated (red) and downregulated (blue) genes in aO4+OPCs compared to nO4+OPCs after KATi treatment. (E–G) Quantitative real-time PCR (RT-qPCR) validation of selected transcripts that were downregulated in aO4+OPCs but not in nO4+OPCs upon KATi treatment. These transcripts are associated with progenitor markers (Gpr17, Hes5) (E), metabolic process (Txnip) (F) and negative regulation of proliferation (Cdkn1a) (G). (E–G) One-tailed paired sample t test with Bonferroni correction (*P < 0.05; **P < 0.01).
Pharmacological inhibition of histone acetylation results in decreased transcripts of cell cycle regulators in aO4 + OPCs but not in nO4 + OPCs. (A) Representative confocal images of aO4+OPCs treated with KATi (5 μM Garcinol and 0.2 μM NU-9056) or with DMSO (as control) for 48 h and stained with DAPI (blue) and H4K8ac (green). Scale bar = 50 μm. (B) Violin plots showing the nuclear intensity of H4K8ac in KATi treated aO4+OPCs and DMSO controls. Data represent H4K8ac nuclear immunoreactivity measured in a total of 150 cells from three biological replicates (****P < 0.0001, Mann–Whitney non-parametric test). (C) Experimental workflow of RNA-seq analysis on samples from nO4+OPCs (n = 5) and aO4+OPCs (n = 4) treated with KATi and DMSO used as control. (D) Dot plots showing differentially upregulated (red) and downregulated (blue) genes in aO4+OPCs compared to nO4+OPCs after KATi treatment. (E–G) Quantitative real-time PCR (RT-qPCR) validation of selected transcripts that were downregulated in aO4+OPCs but not in nO4+OPCs upon KATi treatment. These transcripts are associated with progenitor markers (Gpr17, Hes5) (E), metabolic process (Txnip) (F) and negative regulation of proliferation (Cdkn1a) (G). (E–G) One-tailed paired sample t test with Bonferroni correction (*P < 0.05; **P < 0.01).
RNA sequencing was also performed on both nO4+OPCs and aO4+OPCs after KATi treatment and vehicle-treated controls to identify the transcriptional consequences of inhibiting histone acetylation (Fig. 8 C). Intriguingly only the expression of very few genes were differentially affected by the treatment (Fig. 8 D). The genes characterized by greater H4K8ac occupancy on chromatin of aOPCs were also the ones whose expression was decreased by treatment with the pharmacological inhibitors in aO4+OPCs, but not in nO4+OPCs. They included transcripts characteristic of the progenitor stage such as Hes5 and Gpr17 (Fig. 8 E), and those involved in metabolic regulation of growth, such as Txnip (Fig. 8 F). In addition, we detected the upregulation of negative regulators of proliferation, such as Cdkn1a, likely contributing to establishing a less proliferative phenotype (Fig. 8 G).
To address the functional implications of inhibiting histone acetylation in neonatal versus adult OPCs, we measured EdU incorporation over 5 h to assess the proliferative rate (Fig. 9 A). Consistent with the transcriptional data of increased Cdkn1a levels in cultured aO4+OPCs and not in nO4+OPCs after KATi treatment, we detected a significant reduction of proliferation in treated aO4+OPCs (n = 3,226 cells counted from four biological experiments) and not in nO4+OPCs (n = 2,785 cells counted from three biological experiments) (Fig. 9 B). In contrast, the viability of aO4+OPCs and nO4+OPCs was similarly impacted by treatment with the pharmacological inhibitor (Fig. 9 C), as measured by MTT assays, a result which is also consistent with previous reports (Hegarty et al., 2016; Zhang et al., 2020). Finally, despite the fact that myelin genes such as Cnp and Mog were characterized by H4K8ac occupancy in chromatin samples from aOPCs, and that lower Cnp transcript levels were detected in treated aO4+OPCs (data not shown), we did not detect any difference in the number of cultured oligodendrocyte bearing myelin membranes (Fig. 9, D and E). Similar experiments were also performed with pharmacological inhibitors of histone H4K20me3 (SUV420i), which effectively reduced this mark in cultured cells (Fig. S2, A and B). We also performed RNA-seq analysis, which detected a small number of transcriptional changes (Fig. S2 C), without changes in the functional characteristics of these cells (Fig. S2, D–F). Overall, these data suggest that the histone H4 acetylation mark detected in aOPC functionally modulates the ability of these progenitors to proliferate and maintain markers of the progenitor state.

Pharmacological inhibition of histone acetylation decreases cell proliferation in aO4 + OPCs but not in nO4 + OPCs. (A) Representative confocal images of cultured nO4+OPCs and aO4+OPCs in proliferation medium (20 ng/ml PDGF-AA and 20 ng/ml b-FGF) and EdU incorporation for 5 h, stained for EdU (green), OLIG2 (red) and DAPI after 48-h treatment with DMSO or KATi. Scale bar = 50 μm. (B) Quantification of the percentage of EdU+/OLIG2+ cells in nO4+OPCs (DMSO = 3,218 cells, KATi = 2,785 cells) and aO4+OPCs (DMSO = 2,638 cells, KATi = 2,256 cells). Data represented as mean ± SD for three independent preparations of nO4+OPCs and four independent preparations of aO4+OPCs (one-tailed paired sample t test with Bonferroni correction). (C) Cell viability of nO4+OPCs and aO4+OPCs evaluated by MTT assay after treatment with DMSO or KATi. Data represented as mean ± SD from three biological replicates from three independent cultures (One-way ANOVA). (D) Representative confocal images of nO4+OPCs and aO4+OPCs treated with either KATi or DMSO for 48 h and then switched to differentiation medium for 72 h prior to staining with O1 (red) and OLIG2 (green) antibodies. Scale bar = 50 μm. (E) Quantification of the membranous O1+/OLIG2+ cell ratios in nO4+OPCs and aO4+OPCs. Data represented as mean ± SD for three independent experiments in nO4+OPCs and five independent experiments in aO4+OPCs treated with DMSO control and KATi (one-tailed paired sample t test with Bonferroni correction).
Pharmacological inhibition of histone acetylation decreases cell proliferation in aO4 + OPCs but not in nO4 + OPCs. (A) Representative confocal images of cultured nO4+OPCs and aO4+OPCs in proliferation medium (20 ng/ml PDGF-AA and 20 ng/ml b-FGF) and EdU incorporation for 5 h, stained for EdU (green), OLIG2 (red) and DAPI after 48-h treatment with DMSO or KATi. Scale bar = 50 μm. (B) Quantification of the percentage of EdU+/OLIG2+ cells in nO4+OPCs (DMSO = 3,218 cells, KATi = 2,785 cells) and aO4+OPCs (DMSO = 2,638 cells, KATi = 2,256 cells). Data represented as mean ± SD for three independent preparations of nO4+OPCs and four independent preparations of aO4+OPCs (one-tailed paired sample t test with Bonferroni correction). (C) Cell viability of nO4+OPCs and aO4+OPCs evaluated by MTT assay after treatment with DMSO or KATi. Data represented as mean ± SD from three biological replicates from three independent cultures (One-way ANOVA). (D) Representative confocal images of nO4+OPCs and aO4+OPCs treated with either KATi or DMSO for 48 h and then switched to differentiation medium for 72 h prior to staining with O1 (red) and OLIG2 (green) antibodies. Scale bar = 50 μm. (E) Quantification of the membranous O1+/OLIG2+ cell ratios in nO4+OPCs and aO4+OPCs. Data represented as mean ± SD for three independent experiments in nO4+OPCs and five independent experiments in aO4+OPCs treated with DMSO control and KATi (one-tailed paired sample t test with Bonferroni correction).

Pharmacological inhibition of H4K20 trimethylation does not alter the functional properties of both nO4 + OPCs and aO4 + OPCs. (A) Representative confocal images of aO4+OPCs after treatment with either DMSO or SUV420i (5 μM, A-196) for 48 h and stained with DAPI (blue) and H4K20me3 (red). Scale bar = 20 μm. (B) Violin plots showing nuclear intensity of H4K20me3 in SUV420i treated aO4+OPCs and DMSO controls. Data represent H4K20me3 nuclear immunoreactivity measured in a total of 150 cells from three biological replicates (****P < 0.0001, Mann–Whitney non-parametric test). (C) Experimental workflow of RNA-seq analysis on samples from nO4+OPCs and aO4+OPCs treated with SUV420i and DMSO as control. (D) Quantification of the percentage of EdU+/OLIG2+ cells in nO4+OPCs and aO4+OPCs after 5 h of EdU incorporation. Data are represented as mean ± SD three independent preparations of nO4+OPCs and four independent preparations of aO4+OPCs. (E) Quantification of the membranous O1+/OLIG2+ cell ratios in nO4+OPCs and aO4+OPCs treated for 48 h with the SUV40i or DMSO and then maintained for 72 h in differentiation medium prior to staining with the indicated antibodies. Data represent the mean ± SD for three independent experiments in nO4+OPCs and four for aO4+OPCs treated with DMSO control and SUV420i (two-tailed paired sample t test). (F) Cell viability of nO4+OPCs and aO4+OPCs evaluated by MTT assay after treatment with DMSO or SUV420i. Data are represented as mean ± SD for three separate wells (one-way ANOVA).
Pharmacological inhibition of H4K20 trimethylation does not alter the functional properties of both nO4 + OPCs and aO4 + OPCs. (A) Representative confocal images of aO4+OPCs after treatment with either DMSO or SUV420i (5 μM, A-196) for 48 h and stained with DAPI (blue) and H4K20me3 (red). Scale bar = 20 μm. (B) Violin plots showing nuclear intensity of H4K20me3 in SUV420i treated aO4+OPCs and DMSO controls. Data represent H4K20me3 nuclear immunoreactivity measured in a total of 150 cells from three biological replicates (****P < 0.0001, Mann–Whitney non-parametric test). (C) Experimental workflow of RNA-seq analysis on samples from nO4+OPCs and aO4+OPCs treated with SUV420i and DMSO as control. (D) Quantification of the percentage of EdU+/OLIG2+ cells in nO4+OPCs and aO4+OPCs after 5 h of EdU incorporation. Data are represented as mean ± SD three independent preparations of nO4+OPCs and four independent preparations of aO4+OPCs. (E) Quantification of the membranous O1+/OLIG2+ cell ratios in nO4+OPCs and aO4+OPCs treated for 48 h with the SUV40i or DMSO and then maintained for 72 h in differentiation medium prior to staining with the indicated antibodies. Data represent the mean ± SD for three independent experiments in nO4+OPCs and four for aO4+OPCs treated with DMSO control and SUV420i (two-tailed paired sample t test). (F) Cell viability of nO4+OPCs and aO4+OPCs evaluated by MTT assay after treatment with DMSO or SUV420i. Data are represented as mean ± SD for three separate wells (one-way ANOVA).
Discussion
While aOPCs represent the most abundant progenitor population of the adult brain, relatively little is known about the molecular mechanisms that make aOPCs distinct from their neonatal counterparts. It is well accepted that these two cell populations share immunoreactivity for progenitor markers and differ in their ability to proliferate, migrate, and respond to external signals (Chari et al., 2003; Gensert and Goldman, 2001; Lin et al., 2009; Wolswijk et al., 1990; Wolswijk and Noble, 1989). Although the molecular mechanisms underlying these functional differences are not completely understood, several studies identified important transcriptional and proteomic differences between these two states (de la Fuente et al., 2020; Moyon et al., 2021; Neumann et al., 2019; Spitzer et al., 2019). Using oligodendrocyte progenitor reporter mice to directly sort PDGFRα+ cells from neonatal and adult brains, we showed that the transcriptome of PDGFRα+ aOPCs is distinct from nOPCs, in accordance with previous reports (Moyon et al., 2015; Marques et al., 2016; Neumann et al., 2019; Spitzer et al., 2019). As the epigenetic landscape is unique to each cell type and developmental stage, we used an unbiased histone proteomic analysis to identify the histone posttranslational modifications with differential abundance between PDGFRα+ aOPCs and nOPCs. We focused on two modifications, namely H4K8ac, a mark previously associated with active transcription initiation and elongation (Agalioti et al., 2002; Radzisheuskaya et al., 2021; Wang et al., 2008), and H4K20me3, a mark previously reported to be associated with heterochromatin (Gabellini and Pedrotti, 2022; Schotta et al., 2004). These modifications were detected in several histone peptides and were validated in our preparations. Of note, while previous work from our lab had focused on neonatal progenitors and the acetylation and methylation of lysine residues in the tail of histone H3 (Marin-Husstege et al., 2002; Liu et al., 2015), we identified here histone H4 residues as the most abundant PTM in aOPCs. This is of interest, as we previously reported on the important crosstalk between acetylation of K5 and symmetric methylation of arginine R3 in the tail of histone H4 (Scaglione et al., 2018).
The genome-wide distribution of H4K8ac in aOPCs was predominantly observed at promoter regions of genes with higher transcript levels in these cells, such as the metabolic regulators Ptgds and Txnip. Greater H4K8ac occupancy was also found at introns and distal intergenic regions of myelin genes such as Cnp and Mog, a distribution that was consistent with previous studies identifying this mark at enhancer regions (Goudarzi et al., 2016; Li et al., 2019). The detection of greater H4K8ac occupancy in aOPCs at loci corresponding to oligodendrocyte stage-specific genes was also consistent with previous studies reporting the transcriptional signature of aOPCs to be more similar to mature oligodendrocytes than to nOPCs (Moyon et al., 2015) and with proteomic studies identifying oligodendrocyte specific proteins in aOPCs (de la Fuente et al., 2020). A >60% overlap between transcript levels in aOPCs and chromatin regions with high H4K8ac occupancy supported the role in transcriptional activation previously reported for this mark (Gupta et al., 2017; Li et al., 2019). Our own data further supported H4K8ac as an activating mark. Indeed, treatment of cultured Ο4+ adult OPCs with pharmacological inhibitors of histone acetyl transferases resulted in decreased expression levels of the gene targets, including those encoding for progenitors specific genes, such as Hes5 (Liu et al., 2006; Wu et al., 2012) and Gpr17 (Miralles et al., 2023; Viganò et al., 2016), as well as regulators of metabolic processes, such as Txnip, which positively regulates proliferation (Fei et al., 2024; Niitsu et al., 2023). In contrast, treatment of adult OPCs with KAT inhibitors increased the levels of cell cycle inhibitors, such as Cdkn1a (Ghiani et al., 1999; Zezula et al., 2001). These transcriptional effects were significant in the adult OPCs and to a smaller extent in the neonatal OPC samples and were functionally associated with statistically significant decreased proliferation detected in adult OPCs but not neonatal OPCs. Interestingly, while H4K8ac marks were also detected at chromatin loci encoding for myelin genes, the functional relevance of this finding remains unclear, as pharmacological inhibition did not impact the ability of adult OPCs to differentiate into myelinating oligodendrocytes, although it affected their survival. Collectively, these data identify the H4K8ac mark in adult OPCs as important for the maintenance of a proliferative progenitor state in the adult brain. Previous studies suggested that this mark promotes transcriptional activation by favoring the recruitment of the transcription initiation complex such as the bromodomain protein TAFIID (Jacobson et al., 2000) and by facilitating elongation by promoting the binding of BRD4 (Muhar et al., 2018), which requires dual acetylated sites on histone H4K5ac and H4K8ac (Filippakopoulos et al., 2012; Zaware and Zhou, 2019). While we noted that H4K5ac is less abundant in aOPCs compared to nOPCs, it is conceivable that the presence of the two marks may account for the recruitment of BRD4 to specific genomic regions encoding for the genes whose transcripts are upregulated in aOPCs. Perhaps, this complex pattern of activation may be needed for some genes involved in survival. This could explain, at least in part, the negative effect of pharmacological inhibition on the survival of both neonatal OPCs and adult OPCs, which is consistent with previous reports in other cell types (Hegarty et al., 2016; Zhang et al., 2020).
Importantly, we also detected the abundance of the repressive mark H4K20me3 (Karachentsev et al., 2005) in aOPCs. This mark had been previously reported in senescent (Nelson et al., 2016) and progeroid cells (Shumaker et al., 2006), and its levels increase with aging (Sarg et al., 2002). Despite its higher abundance in aOPCs, the functional role of this mark in oligodendrocyte lineage cells remains unclear, as pharmacological inhibition of the enzyme responsible for its deposition, did not have any detectable functional effects.
Together, these data identify histone H4 posttranslational acetylation as important for the identity and proliferation of adult oligodendrocyte progenitor cells. Future studies will be needed to carefully define all the other modifications that render the epigenetic landscape of these cells unique.
Materials and methods
Animal models (sex, age, and mouse lines)
All experiments were performed in male and female mice according to the Institutional Animal Care and Use Committee (IACUC)-approved protocols of the Advanced Science Research Center (ASRC), City University of New York (CUNY). Mice were maintained in a temperature- and humidity-controlled facility on a 12-h light–dark cycle with food and water ad libitum. Mice from either sex were used for all experiments. Pdgfra-H2B-EGFP reporter mouse line (RRID: IMSR_JAX:007669) was used to sort for oligodendrocyte progenitor cells and for immunohistochemistry in the neonatal (P2-P5) and adult (P60) brains (Klinghoffer et al., 2002).
Fluorescence-activated cell sorting (FACS)
Oligodendrocyte progenitors were isolated from the forebrains of postnatal day 5 (P5) and 60 (P60) Pdgfra-H2B-EGFP mice using fluorescence-activated cell sorting (FACS) (Moyon et al., 2021). The tissues were dissected in HBSS 1X (HBSS 10X (Invitrogen), 0.01 M HEPES buffer, 0.75% sodium bicarbonate (Invitrogen), and 1% penicillin/streptomycin followed by mechanical and enzymatic dissociation (30 μg/ml of papain in DMEM-Glutamax, with 0.24 μg/ml L-cysteine and 40 μg/ml DNase I) to obtain cell suspension. The cell preparation was then carefully layered on top of a preformed Percoll density gradient and centrifuged for 15 min at 20,000 × g at 4°C. Cells were collected and stained with propidium iodide (PI) for 2 min at RT. GFP-positive and PI-negative cells were sorted by fluorescence-activated cell sorting (FACSAria, Becton Dickinson Biosciences). For OPC isolation in the adult mice, only the population with the strongest GFP+ signal was collected as true aOPCs.
Fluorescence-activated nuclei sorting (FANS)
Nuclei of oligodendrocyte progenitors were sorted from frozen forebrains harvested from Pdgfra-H2B-EGFP mice using fluorescence-activated nuclei sorting (FANS) (Jiang et al., 2008). Frozen forebrain tissues were cut into small pieces and homogenized in lysis buffer (0.32 M sucrose, 3 mM Mg(Ac)2, 0.1 mM EDTA, 10 mM Tris HCL pH 8.0, and 0.1% Triton X-100) using a Dounce tissue grinder on ice. The homogenate was filtered with a 70-µm strainer and transferred into an ultracentrifuge tube (331372; Beckman Coulter). Sucrose solution (1.8 M sucrose, 3 mM Mg(Ac)2, and 10 mM Tris HCL, pH 8) was added to the bottom of the tube drop by drop to form a gradient. The sample was centrifuged at 24,000 rpm for 75 min at 4°C. The supernatant was discarded, the pellet resuspended in FACS buffer (2% FBS, 2 mM EDTA, 0.2% Saponin, and 0.01% Sodium azide in PBS), and then filtered with a 40-µm strainer. Nuclei were incubated with 4′,6-diamidino-2-phenylindole (DAPI) for 15 min on ice. GFP+ and DAPI+ nuclei were sorted by fluorescence-activated nuclei sorting. For aOPC nuclei isolation, only the population with the strongest GFP+ signal was collected as true aOPCs.
Primary O4+oligodendrocyte progenitors cell isolation and culture
Primary cortical neonatal O4+ cells (nO4+OPCs) and adult O4+ cells (aO4+OPCs) were isolated from P5 and P60 C57BL/6 mice (purchased from Jackson Laboratories) following the protocols described in the Adult Brain Dissociation Kit (130-107-677; ABDK, Miltenyi). Briefly, neonatal and adult mice were euthanized, the cortices dissected, and immediately placed in cold Hibernate A Low Fluorescence (HALF) medium (NC0285514; Thermo Fisher Scientific). The cortices were cut into 0.5-cm pieces and placed in C-tubes (130-093-237; Miltenyi) containing the enzyme and buffers provided in the kit. The C-tubes containing the cortices were placed in the gentleMACS Octo Dissociator with Heaters for dissociation (130-094-427; Miltenyi; Program: 37C_ABDK_01). The resulting cell suspension was strained using a 70-μm MACS SmartStrainer (130-098-462; Miltenyi), and the filtrate was centrifuged at 300 × g for 10 min at 4°C. The supernatant was completely aspirated and debris removal performed using the Debris Removal Solution (130-109-398; Miltenyi). Next, red blood cells were lysed by resuspending the cell pellet in a cold Red Blood Cell Lysis Solution (130-094-183; Miltenyi). To prevent non-specific binding to the antibodies, the cells were preincubated with the FcR Blocking Reagent (130-059-901; Miltenyi) and then labeled with mouse O4 antibody-conjugated microbeads (130-094-543; Miltenyi). O4+ oligodendrocyte progenitors were isolated by applying the cell suspension onto an MS column (130-042-201; Miltenyi) placed on a magnetic field separator. The magnetically labeled cells were washed with PBS/BSA buffer (120-091-376; Miltenyi) three times and immediately flushed out with 1 ml of SATO media by firmly pushing the plunger into the column. The cells were cultured on poly-D-lysine (PDL)-coated plates. The isolated primary OPCs were cultured in SATO medium (Dulbecco’s modified Eagle’s medium [DMEM], 100 μg/ml BSA, 100 μg/ml apo-transferrin, 16 μg/ml putrescine, 62.5 ng/ml progesterone, 40 ng/ml selenium, 10 μg/ml insulin, 1 mM sodium pyruvate, 5 μg/ml N-acetyl-cysteine, 10 ng/ml biotin, 5 μM forskolin, 1% GlutaMAX Supplement [Gibco], B27 Supplement and Trace Element B) supplemented with Platelet-Derived Growth Factor-AA (PDGF-AA) (30 ng/ml) and basic Fibroblast Growth Factor (bFGF, Peprotech, 100-18B) (30 ng/ml) for the first day. Media change was performed on the second and all other days with SATO medium supplemented with 20 ng/ml PDGF-AA and 20 ng/ml bFGF.
Primary O4+oligodendrocyte progenitors cell differentiation assay
To differentiate O4+OPCs into oligodendrocytes, growth factors were removed, and the cells previously treated with either KATi or DMSO vehicle control for 48 h were cultured in SATO medium supplemented with 3,3′,5′-Triiodo-L-thyronine (T3, 45 nM, T5516; Sigma-Aldrich) for 72 h. The cells were fixed with 4% paraformaldehyde (PFA) at RT for 20 min and non-specific binding blocked with blocking buffer (PGBA containing 10% Goat Serum and 0.5% Triton-X). The cells were then immunostained with mouse IgM anti-O1 Antibody (MAB1327; R&D Systems, RRID:AB_357618) diluted at 1 μg/ml and rabbit IgG anti-OLIG2 antibody (AB9610; Millipore, RRID:AB_570666) diluted at 1:500 in blocking buffer overnight at 4°C. After washing with PBS, the cells were incubated with AlexaFluor 555-conjugated anti-Mouse IgM antibody (A21426; Life Technologies, RRID:AB_2535847) diluted at 4 μg/ml in blocking buffer at RT for 1 h. After washing with PBS, cells were mounted with Epredia Immu-Mount (9990402; Thermo Fisher Scientific). Samples were imaged using a Zeiss LSM 800 Confocal Laser Scanning Microscope with 10-20× objectives. The morphology of individual cells was recorded, and the number of membranous cells, characterized by the presence of a wide O1+ membrane in lieu of complex branching processes, was used as a metric of differentiation.
RNA extraction
For RNA sequencing of nOPCs and aOPCs sorted from forebrains of Pdgfra-H2B-EGFP mice, RNA was isolated from washed FACS-sorted cells using an AllPrep DNA/RNA Micro Kit (80284; Qiagen). For the RNA sequencing and RT-qPCR of cultured nO4+OPCs and aO4+OPCs, RNA was extracted using TRIzol (Invitrogen) and the RNeasy Mini Kit (74106; Qiagen). RNA samples were further purified using RNeasy columns with on-column DNase treatment and then resuspended in nuclease-free water. RNA purity was assessed by measuring the A260/A280 ratio with a NanoDrop, and RNA quality was checked using an Agilent 2100 Bioanalyzer (Agilent Technologies).
RNA sequencing
For RNA-seq of nOPCs sorted from forebrains harvested from three P2 Pdgfra-H2B-EGFP mice, 85 ng of total RNA per sample was used for library construction with the Ultra-Low-RNA-seq RNA Sample Prep Kit (Illumina) and pair-end sequenced using the Illumina HiSeq 2000 instrument, according to the manufacturer’s instructions for paired end read runs (Moyon et al., 2016). For aOPCs sorted from forebrains harvested from three P60 Pdgfra-H2B-EGFP mice, 250 ng of total RNA per sample was used for library construction with the TruSeq RNA Sample Prep Kit (Illumina) and pair-end sequenced using the Illumina HiSeq 2500 instrument, according to the manufacturer’s instructions for paired-end read runs (Moyon et al., 2021).
RNA-seq of magnetic-bead-activated immune-sorted and cultured O4+ OPCs was performed at the Epigenetics Core facility at the Advanced Science Research Center of City University of New York. The quality of the RNA was assessed by Tapestation 4200 (Agilent Technologies). Only RNA with RIN >= 8 was used for subsequent library construction. 100 ng of total RNA per sample was used for library construction using KAPA mRNA Hyperprep kit (Roche). The libraries were sequenced on an Illumina Novaseq X Plus platform. Depths of 40–50 million paired-end 150 bp reads were generated for each sample.
High-quality reads were aligned to the mouse reference genome (mm10) using the subread package toolset (RRID:SCR_009803, Liao et al., 2013). The featureCounts program (RRID:SCR_012919, Liao et al., 2014) was used to count mapped reads, and DESeq2 (RRID:SCR_015687, Love et al., 2014) was used for differential gene expression analysis. We used a cut-off of FDR < 0.01 and |foldchange| >1 to identify differentially expressed genes and for the GSEA in the nOPC and aOPC dataset. For the nO4+OPCs and aO4+OPCs dataset, a cut-off of FDR < 0.05 and |foldchange| > 1 was used to identify differentially expressed genes and for the GSEA. For the KATi or SUV420i treatments, we used a cut-off of FDR < 0.05 and |foldchange| > 0.5 to identify differentially expressed genes and for the GSEA. Data deposited in GEO: GSE66047 for nOPCs, GSE122446 for aOPCs, and GSE263808 for nO4+OPCs and aO4+OPCs untreated and treated with DMSO, KATi, or SUV420i.
RNAScope
Paraffin-embedded P5 and P60 wild-type mice brain sections were first deparaffinized. In situ hybridization was performed using RNAScope probe and detection reagents from Advanced Cell Diagnostics (ACD) in accordance with the manufacturer’s guidelines. RNAScope probes were hybridized for 2 h at 40°C in a humidity-controlled oven (HybEZ II, ACDbio). The signal of the target RNA was visualized through probe-specific horseradish-peroxidase-based detection. Slides were then counterstained with DAPI, coverslipped with Prolong Gold Antifade (Thermo Fisher Scientific), and imaged at RT using a Zeiss LSM800 Confocal Microscope with Airyscan detector (Axis Observer.Z1 equipped of 10xEC Plan-Neofluor, Plan-Apochromat 20X, and Plan-APO 40X and 63XOil immersion lens, with the motorized microscope stage and Airy Scan Super resolution Detector 4 Laser Modules 405, 488, 561, 635, and Real Time controller Imaging system and ZEN Blue image acquisition software). Image acquisition using ZEN BLUE software and fluorescence quantification using ImageJ software. The following RNAScope probes were used; mouse-Pdgfrα (480661-C3; ACD), mouse-Olig2 (447091; ACD), mouse-Ptgds (492781-C2; ACD), and mouse-Cnp (472241). Three plex-positive control probe sets were used (320881; ACD).
Quantitative real-time PCR
RNA was reverse transcribed with qScript Ultra Supermix cDNA synthesis kit (95217; Quantabio). Quantitative real-time PCR (RT-qPCR) reactions were run with PerfeCTa SYBR GREEN FastMix, ROX reagent (95072; Quantabio) at the Epigenetics Core facility of ASRC. Samples were analyzed in triplicates, and the relative quantification of target gene expression was determined using the comparative Ct cycle threshold (Ct) method. (2−ΔΔCT) (Livak and Schmittgen, 2001). The expression levels for each transcript were normalized to the Geometric mean (GEO-mean) of these housekeeping genes; Ppia, Rpl13a, and Pgk1. P values were calculated by performing a one-tailed paired sample t test. The sequences of primers used for RT-qPCR are listed below:
Cnp: F- 5′-TTCTGGAGATGAACCCAAGG-3′ and R- 5′-TGGGTGTCACAAAGAGAGCA-3′
Gpr17: F- 5′-CACCCTGTCAAGTCCCTCAAG-3′ and R- 5′-GTGGGCTGACTAGCAGTGG-3′
Hes5: F- 5′-AGTCCCAAGGAGAAAAACCGA-3′ and R- 5′-GCTGTGTTTCAGGTAGCTGAC-3′
Pgk1: F- 5′-GATGCTTTCCGAGCCTCACTGT-3′ and R- 5′-ACCAGCCTTCTGTGGCAGATTC-3′
Ppia: F- 5′-GGGTGGTGACTTTACACGCC-3′ and R- 5′-CTTGCCATCCAGCCATTCAG-3′
Rpl13a: F- 5′-AGGGGCAGGTTCTGGTATTG-3′ and R- 5′-TGTTGATGCCTTCACAGCGT-3′
Txnip: F- 5′-TCTTTTGAGGTGGTCTTCAACG-3′ and R- 5′-GCTTTGACTCGGGTAACTTCACA-3′
Cdkn1a: F- 5′-CCTGGTGATGTCCGACCTG-3′ and R- 5′-CCATGAGCGCATCGCAATC-3′
Chromatin isolation and chromatin immunoprecipitation
Fluorescence-activated nuclei sorting (FANS) was performed on frozen Pdgfra-H2B-EGFP P5 and P60 forebrain homogenate after it was crosslinked with 1% PFA and quenched with 125 mM glycine. The nuclear pellets were lysed with lysis buffer (50 mM Tris-HCl, 10 mM EDTA, 1% SDS, pH 8) and then sonicated with Bioruptor (Diagenode, 15 cycles, 30 s ON/30 s OFF). The size of the DNA in the sheared chromatin fragments was checked before precipitation by a Tapestation system (4200; Agilent) to ensure that the majority of fragment size was 200–400 bp. Protein A-Dynabeads (10002D; Thermo Fisher Scientific) were washed three times with PBS/BSA buffer (5 mg/ml) and antibody-bead conjugation was carried out for 2 h on a rotator at 4°C. Immunoprecipitation was performed with 9 μg of rabbit anti-H4K8ac (61103; Active Motif, RRID: AB_2793506) per ChIP sample after preclearing chromatin with protein A-Dynabeads. As a negative control, immunoprecipitation was performed with 15 μg of normal rabbit IgG (NI01; Sigma-Aldrich, RRID:AB_490574). For each biological replicate, a total of 2.25 × 10⁶ nuclei were used for H4K8ac immunoprecipitation, and 7.5 × 10⁵ nuclei were used for normal IgG immunoprecipitation. A total of three biological replicates were used per age. The immunoprecipitation reaction was performed overnight on a rotator at 4°C. The supernatants of the negative control samples were saved as “Input” while reverse crosslinking was performed on the H4K8ac immunoprecipitated chromatin using elution buffer (100 mM NaHCO3 and 1% SDS) supplemented with proteinase K (20 mg/ml, 3115887001; Millipore Sigma) and incubated at 68°C in a thermomixer at 1,300 rpm for 2 h. DNA extraction was then performed with Phenol:Chloroform:Isoamyl Alcohol (25:24:1) (15593049; Thermo Fisher Scientific) and precipitated with 3 M Sodium acetate, 2.5% linear acrylamide carrier, and cold 100% ethanol at −20°C for 2 h. The precipitated DNA was washed with cold 70% ethanol, dissolved in ddH2O, and placed at 4°C overnight for complete elution. DNA yield was then measured using Qubit 3 (High Sensitivity DNA Assay, Thermo Fisher Scientific). Libraries were prepared using 2 ng of ChIP DNA and 10 ng of Input DNA (KAPA Hyper Prep Kit, KK8502). The input and ChIP samples were sequenced by Illumina HiSeq 4000.
ChIP-seq analysis
In this ChIP-seq experiment, the reading depths of six samples are presented to show the sequencing read distribution and intensity. The input samples for the nOPCs (n = 3) have filtered read counts of 68.4, 61, and 70 M reads, respectively. The input samples for the aOPCs (n = 3) have filtered read counts of 60.5, 65, and 43.7 M reads, respectively. The experimental samples, “nOPC-A,” “ nOPC-B,” and “nOPC-C” exhibit filtered read counts of 57.3, 75, and 61.4 M reads, respectively. The experimental samples, “aOPC-A,” “aOPC-B,” and “aOPC-C” exhibit filtered read counts of 48.7, 62.5, and 68.1 M reads, respectively. FASTQC (RRID:SCR_014583) was used for quality control. The adapter sequences were removed from the FASTQ files using Trim Galore (RRID:SCR_011847, Krueger et al., 2021). Trimmed reads were aligned to the Mus musculus reference genome GRCm38 using the Bowtie2 (v.2.4.5) program (RRID:SCR_016368, Langmead and Salzberg, 2012). SAMTools (RRID:SCR_002105, Li et al., 2009) was used to remove PCR duplicates and reads mapped to blacked list regions (Amemiya et al., 2019) and alignments with low mapping quality (q < 20). The deepTools bamCompare function (RRID:SCR_016366, Ramírez et al., 2016) was used to normalize the ChIP samples to their respective input samples. The peaks in the ChIP sample in reference to the input sample in nOPCs and nOPCs were called from read alignments by the MACS2 algorithm (RRID:SCR_013291, Zhang et al., 2008). DiffBind (RRID:SCR_012918, Stark and Brown, 2011) was used for the differential binding of H4K8ac in aOPCs compared with nOPCs. A total of 35,820 significantly differential sites were identified with FDR < 0.01. Annotation of the H4K8ac peaks was performed with ChIPseeker in the R package (RRID:SCR_021322, Yu et al., 2015), and the functional enrichment of annotation was performed with the GREAT tool (RRID:SCR_005807, McLean et al., 2010). Finally, the coverage of normalized ChIP-seq data was visualized with the integrative genomics viewer (IGV) program (RRID:SCR_011793, Robinson et al., 2011).
Histone extraction
Histones were extracted from fluorescence-activated sorted OPC nuclei using the acid extraction method (Shechter et al., 2007). A total of 5 × 10⁶ OPC nuclei per biological replicate was suspended into 400 μl of 0.4 N H2SO4 and incubated overnight at 4°C on a rotator. After incubation, a 10-minute centrifugation at 16,000 × g 4°C was used to remove nuclear debris. The supernatant containing the histones was transferred into a new tube and precipitated with 20% trichloroacetic acid (TCA) for 1 h on ice. Histones were pelleted by centrifugation at 16,000 × g for 10 min at 4°C. The supernatant was discarded and histone pellets were washed twice with 1 ml of cold acidified acetone (0.1% HCl) and then with 1 ml of cold acetone. The pellets were left to air-dry on ice for 1 h after which the pellets were resuspended in 100 μl of ddH2O by pipetting up and down and with mild vortexing. The histones were left to fully dissolve overnight at 4°C.
Quantitative histone proteomics analysis
Unbiased proteomics analysis was carried out on extracted histones from fluorescence-activated nuclei-sorted oligodendrocyte progenitors. The extracted histones were first derivatized using propionic anhydride as described (Garcia et al., 2007). Briefly, the sample was diluted with methanol 1:1 (vol:vol) at pH 8.0. The propionic anhydride reagent mixture was prepared by mixing 75 μl propionic anhydride with 25 μl methanol. An aliquot equal to one-quarter of the total volume of the histone sample was added and ammonium hydroxide was immediately used to titrate the pH back to 8.0 when necessary. The reaction was allowed to incubate for 20 min. The sample was dried to ∼5 μl in the Speedvac and the derivatization was repeated as described. After another concentration using the Speedvac, the samples were resuspended in ammonium bicarbonate and digested overnight with 0.2 µg of sequencing grade modified trypsin (Promega) at 37°C. The samples were again concentrated using the Speedvac and resuspended in 50% methanol as above and the propionic anhydride derivatization was repeated as described above. The dried sample was resuspended in 0.5% acetic acid and the samples were loaded onto an equilibrated microspin Harvard apparatus using a microcentrifuge and rinsed three times with 0.1% trifluoroacetic acid (TFA). The extracted samples were further washed with 0.5% acetic acid and eluted with 40% acetonitrile in 0.5% acetic acid followed by the addition of 80% acetonitrile in 0.5% acetic acid. The organic solvent was removed using a Speedvac, reconstituted in 0.5% acetic acid, and then analyzed by liquid chromatography–mass spectrometry (LC-MS). LC separation was performed online on an EASY-nLC 1,200 (Thermo Fisher Scientific) utilizing Acclaim PepMap 100 (75 µm × 2 cm) precolumn and PepMap RSLC C18 (2 µm, 100A × 50 cm) analytical column. Peptides were gradient eluted from the column directly into an Orbitrap Eclipse (Thermo Fisher Scientific) mass spectrometer using a 120 min acetonitrile gradient from 5 to 60% B followed by a ramp to 100% B in 20 min and final equilibration in 100% B for 15 min (A = 2% ACN 0.5% AcOH/B = 80% ACN 0.5% AcOH). The flowrate was set at 200 nl/min. High-resolution full MS spectra were acquired with a resolution of 120,000, an AGC target of 4e5, a maximum ion time of 50 ms, and a scan range of 400–1,500 m/z. All MS/MS spectra were collected using the following instrument parameters: resolution of 30,000, AGC target of 2e5, maximum ion time of 200 ms, one microscan, 2 m/z isolation window, fixed first mass of 150 m/z, and NCE of 27.
MS/MS spectra were searched against a Uniprot Mus musculus database using Sequest within P.D 1.4 for the entire database analysis and Byonic for H3.1 and H4 PTM analysis. The search parameters for Sequest were as follows: mass accuracy better than 10 ppm for MS1 and 0.02 Da for MS2, two missed cleavages, fixed modification carbamidomethyl on cysteine, variable modification of oxidation on methionine. The data was filtered using a 1% FDR cut-off for peptides and proteins against a decoy database and only proteins with at least two unique peptides were reported. For the PTM analysis on histones, H3.1 and H4, the search parameter was as follows: mass accuracy better than 10 ppm for MS1 and 0.02 Da for MS2, two missed cleavages, fixed modification carbamidomethyl on cysteine, variable modification of oxidation on methionine, monomethylation and propionic anhydride, dimethylation, trimethylation and acetylation on lysine residues, mono and demethylation on arginine, and phosphorylation on serine, threonine, and tyrosine residue. For data analysis, the area under the curve for each peptide isoform was integrated and all the areas for a given peptide isoform were summed and represented as 100% of the peptide intensity for a given peptide sequence. The percentage area allocated for each peptide isoform was calculated and the average percentage was calculated for nOPCs and aOPCs. The fold change of the average abundance of aOPCs vs. nOPCs was then calculated and those modifications that showed consistency across samples and were represented in more than two peptide sequences were further analyzed.
Western blot analysis
Western blotting was carried out on histone extracts from FAC-sorted nOPCs and aOPCs and on immune-sorted nO4+OPCs and aO4+OPCs using sodium dodecyl sulfate–polyacrylamide gel electrophoresis (SDS-PAGE). The proteins were then transferred onto a 0.2 μm polyvinylidene fluoride (PVDF) membrane (1620177; Biorad). The membranes were blocked for 1 h in 5% BSA and 0.1% Tween in Tris-buffered saline (TBS). Primary antibodies were incubated overnight at 4°C in 5 % BSA and 0.1% Tween/TBS. Membranes were washed with 0.1% Tween/TBS and incubated at RT for 1 h with horseradish peroxidase-conjugated secondary antibodies (Mouse anti-rabbit, 1:10,000, 211-032-171; Jackson Immunoresearch, RRID:AB 2339149 and Goat anti-mouse, 1:10,000, 15-035-174; Jackson Immunoresearch, RRID:AB 2338512) in 5% BSA and 0.1% Tween/TBS. ECL Prime Western blotting Detection Reagent kit (RPN2232; GE Healthcare) was then used to develop the membrane and visualized with ChemiDoc Imaging System (Bio-Rad). ImageJ software was used to quantify the intensity of the histone bands. The visualized membrane was stripped (46430; Thermo Fisher Scientific) and reprobed multiple times for different histone marks. The antibodies used for western blotting were: rabbit antiH3K9ac (1:2,000, ab4441; Abcam, RRID:AB_2118292), rabbit anti-H3K18ac (1:2,000, ab1191; Abcam, RRID:AB_298692), rabbit anti-H3K27ac (1:2,000, ab4729; Abcam, RRID:AB_2118291), rabbit anti-H3K4me3 (1:2,000, ab8580; Abcam, RRID:AB_306649), rabbit anti-H3K9me3 (1:1,000, ab8898; Abcam, RRID:AB_306848), rabbit anti-H3K27me2 (1:2,000, 9728; Cell Signaling, RRID:AB_1281338), rabbit anti-H3K27me3 (1:2,000, C1541095; Diagenode, RRID:AB_1281338), rabbit anti-Total H3 (1:5,000, 12648; Cell Signaling, RRID:AB_2797978), rabbit anti-H4K5ac (1:2,000, 39699; Active Motif, RRID:AB_2793311), rabbit anti-H4K8ac (1:2,000, 61103; Active Motif, RRID:AB_2793506), rabbit anti-H4K12ac (1:2,000, 39927; Active Motif, RRID:AB_2793396), rabbit anti-H4K16ac (1:2,000, ab109463; Abcam, RRID:AB_10858987), rabbit anti-H4K20me3 (1:2,000, 07-463; Millipore, RRID:AB_310636), and mouse anti-Histone H4 (1:5,000, ab197517; Abcam, RRID:AB_3099684).
Immunohistochemistry (IHC) and immunocytochemistry (ICC)
For IHC, mice were anesthetized with ketamine/xylazine (150 mg/kg and 15 mg/kg) and perfused with 4% PFA. Brains were removed from the skull and stripped of meninges and left immersed in fixative (4% PFA) overnight at 4°C. The fixed brains were cryo-protected in sucrose solutions, embedded in OCT (Optimum Cutting Temperature, Tissue-Tek), and processed for cryosectioning. Tissue sections (12 μm) were permeabilized and incubated in PGBA (0.1 M pH 7.4, 0.1% gelatin porcine type A, 1% BSA, and 0.002% sodium azide), 10% normal goat or donkey serum and 0.1% Triton X-100 for 1 h at RT. Sections were then left overnight at 4°C in the presence of the appropriate dilution of primary antibodies, rinsed, and then incubated with Alexa-Fluor secondary antibodies for 1 h at RT. Stained tissues were cover-slipped in DAPI Fluoromount G mounting medium (0100-20; SouthernBiotech), allowed to dry, and imaged at RT using a Zeiss LSM800 Confocal Microscope with Airyscan detector (Axis Observer.Z1 equipped with 10xEC Plan-Neofluor, Plan-Apochromat 20X, and Plan-APO 40X and 63XOil immersion lens, with motorized microscope stage and Airy Scan Super resolution Detector 4 Laser Modules 405, 488, 561, 635 and Real Time controller Imaging system and ZEN Blue image acquisition software). Image acquisition using ZEN BLUE software and fluorescence quantification using ImageJ software were performed.
For ICC, cells were fixed with 4% PFA for 20 min at RT, and non-specific binding was blocked by incubation in PGBA, 10% normal goat serum, and 0.1% Triton X-100 1 h at RT. The fixed cells were then incubated with primary antibodies overnight at 4°C, rinsed, and then incubated with Alexa-Fluor secondary antibodies for 1 h at RT. Stained cells were cover-slipped in DAPI Fluoromount G mounting medium (0100-20; SouthernBiotech), allowed to dry, and imaged at RT with Zeiss LSM800 Confocal Microscope with Airyscan, using ZEN Blue software for image acquisition and ImageJ for quantification of immunofluorescence intensity. The antibodies used for immunohistochemistry and immunocytochemistry and relative dilutions were as follows: mouse anti-OLIG2 (1:500, MABN50; Millipore, RRID:AB_10807410), rabbit anti-OLIG2 (1:500, AB9610; Millipore, RRID:AB_570666), rabbit anti-H4K5ac (1:1,000, 39699; Active Motif, RRID:AB_2793311), rabbit anti-H4K8ac (1:1,000, ab15823; Abcam, RRID:AB_880455), rabbit anti-H4K20me3 (1:500, 07-463; Millipore, RRID:AB_310636), goat anti-rabbit Alexa-Fluor-488 (1:500, A11034; Invitrogen, RRID:AB_2576217), goat anti-mouse Alexa-Fluor-488 (1:500, A28175; Invitrogen, RRID:AB_2536161), goat anti-rabbit Alexa-Fluor-555 (1:500, A21428; Invitrogen, RRID:AB_2535849), and goat anti-mouse Alexa-Fluor-555 (1:500, A21422; Invitrogen, RRID:AB_2535844).
EdU incorporation assay
Click-iT EdU Cell Proliferation Kit (C10337; Invitrogen) was used to measure cell proliferation. Briefly, isolated primary nO4+OPCs and aO4+OPCs were plated in PDL-coated eight-well chamber slides and allowed to recover overnight (154739; Thermo Fisher Scientific). The cells were incubated with 10 µM EdU for 5 h in proliferating culture conditions. The cells were then washed and fixed with 4% PFA for 15 min at RT, washed twice with 3% BSA in PBS, and permeabilized with 0.5% Triton for 20 min at RT. The permeabilization buffer was removed and cells were washed twice with 3% BSA in PBS. Next, 0.5 ml of Click-iT reagent was added and incubated in the dark for 30 min at RT. The cells were washed once with 3% BSA in PBS and wells were removed. The slide was then cover-slipped in DAPI Fluoromount G mounting medium (0100-20; SouthernBiotech), allowed to dry, and imaged at RT using a Zeiss LSM800 Confocal Microscope with Airyscan detector (Axis Observer.Z1 equipped with 10xEC Plan-Neofluor, Plan-Apochromat 20X and Plan-APO 40X and 63X oil immersion lens, with the motorized microscope stage and Airy Scan Super resolution Detector 4 Laser Modules 405, 488, 561, 635 and Real Time controller Imaging system and ZEN Blue image acquisition software). Image acquisition using ZEN BLUE software and fluorescence quantification using ImageJ software.
Pharmacological inhibition of KATs and SUV420H1/H2 in aOPCs
For the KAT inhibition experiment, primary O4+OPCs were treated with a combination of KAT inhibitors (Garcinol, 5 μM and NU-9056, 0.2 μM) for 48 h. For the SUV420H1/H2 inhibition, O4+OPCs were treated with the highly specific SUV420H1/H2 specific inhibitor (A-196, 5 μM) for 48 h. Control cultures were treated with dimethyl sulfoxide (DMSO). The dose and duration of the inhibitors used were selected based on previous studies conducted on cells (Bromberg et al., 2017; Scaglione et al., 2018). Garcinol was purchased from Abcam (ab141503), NU-9056 from Sigma-Aldrich (5005110001), and A-196 from Sigma-Aldrich Millipore (SML1565).
MTT assay
To assess cell viability, an MTT assay was performed. Cells were seeded in 96-well plates at a 50% confluency under proliferating culture conditions. Following treatment with KATi and DMSO for 24 h, the medium was carefully aspirated and 100 μl of fresh culture medium containing 0.5 mg/ml MTT reagent (3-(4,5-dimethylthiazol-2-yl)-2,5-diphenyltetrazolium bromide) was added to each well. The plates were then incubated at 37°C in a 5% CO2 atmosphere for 3–4 h, allowing viable cells to convert MTT into insoluble formazan crystals. After incubation, the medium was gently removed and 100 μl of DMSO was added to each well to dissolve the formazan crystals. Absorbance was measured at 570 and 630 nm using a microplate reader. The optical density (OD) values were directly proportional to the number of viable cells. Cell viability was expressed as a percentage relative to DMSO control wells, with untreated cells set as 100%.
Blinding and confocal-related data analysis
All the experiments performed on cells and mouse sections were performed on slides identified by a code, known only to the code-generator. Assessment was performed blindly by three investigators, who disclosed their results at a lab meeting, when the code was revealed and analysis was subsequently performed.
Gene set enrichment analysis (GSEA) and ontology analysis
Functional analysis of the differentially called H4K8ac peaks in aOPCs compared with nOPCs was carried out with the GREAT tool (RRID:SCR_005807, McLean et al., 2010). Enrichment analysis was performed with the GSEA (RRID:SCR_003199, Mootha et al., 2003; Subramanian et al., 2005) using the clusterProfiler package (RRID:SCR_016884, Yu et al., 2012). Gene ontology categories were sorted by lowest adj. P value and selected categories were represented.
Quantification and statistical analysis
Confocal images were analyzed using Fiji-ImageJ (RRID:SCR_002285, RRID:SCR_003070). Volcano-plots were generated with VolcaNoseR (Goedhart and Luijsterburg, 2020). An integrative genomics viewer (IGV) program (RRID:SCR_011793, Robinson et al., 2011) was used to visualize chromatin occupancy of H4K8ac ChIP-seq peaks on the genome. GraphPad Prism (RRID:SCR_002798) was used to generate all other graphs and used for statistical analysis. Data are represented as mean ± standard deviation (SD) or standard error of the mean (SEM). Regarding the data presented in Figs. 8 and 9, due to the fact that neonatal and adult OPCs were characterized by different growth rates and survival, it was technically difficult to get both cells ready for drug treatment at the same time and passage number. To ensure reproducibility and consistency, therefore, the experiments were carried out separately and therefore we did not deem it statistically suitable to analyze our results within the framework of a two-way ANOVA, as previously suggested for similar experimental designs (Nieuwenhuis et al., 2011). Rather, we carried out paired, one-tailed t tests comparing the effect of the KAT pharmacological inhibitor on the control vehicle. We opted to use the one-tailed t tests due to our directional hypotheses since we expected the transcript levels of genes regulated by histone acetylation to decrease in response to treatment with the KAT inhibitors (Fig. 8) and proliferation to decrease (in Fig. 9). In addition, since age was the main comparison carried out in the experiments presented in Figs. 8 and 9, we carried out a Bonferroni correction on the P values from our t tests and considered any comparison with a P value <0.025 as significant evidence for the rejection of the null hypothesis. A detailed description of the numerical values of the error bars and all the statistical tests is provided in Table S2. In cases where the number of points was too few to measure the distribution, data distribution was assumed to be normal.
Online supplemental material
Fig. S1 shows additional data on histone methylation marks, expression of lysine acetyltransferases in aOPCs, validation of antibody specificity, and overall quality assessment of ChIP-seq data. Fig. S2 shows the effect of treatment with pharmacological inhibitors of H4K20me3 on nO4+OPCs and aO4+OPCs. Table S1 lists the histone PTMs on histone H3 and histone H4 detected in nOPC and aOPC by unbiased quantitative histone proteomics. Table S2 shows the detailed description of the statistical tests used in the study.
Data availability
The mass spectrometry raw files related to histone proteomic data from nOPCs and aOPCs are accessible at https://massive.ucsd.edu under MassIVE ID: MSV000092613. RNA sequencing data from nOPCs and aOPCs were previously published and deposited in the Gene Expression Omnibus (GEO): GSE66047 nd GSE122446, respectively. RNA sequencing data from nO4+OPCs and aO4+OPCs untreated and treated with DMSO, KATi, and SUV42Oi are deposited in GEO: GSE263808. ChIP sequencing data from nOPCs and aOPCs are deposited in GEO: GSE240522. All other data are available from the authors upon reasonable request.
Acknowledgments
We thank the Epigenetics core facility at the Advanced Science Research Center, NY for their help with sorting nOPCs and aOPCs, library preparation for RNA and ChIP sequencing, and the in situ hybridization experiment, and the NYU Proteomic Core for their contribution in performing and analyzing unbiased quantitative histone proteomics on our samples. We would like to thank Dr. Abhilash Lakshman for his help with statistical analysis, Dr. Jia Liu for constant support and advice, and the Casaccia lab members for their constructive feedback during all stages of the project.
This project was supported by R35-NS111604 from the National Institute of Neurological Disorders and Stroke of Health to P. Casaccia. The mass spectrometry experiments are in part supported by a shared instrumentation grant from the National Institutes of Health, 1S10OD010582-01A1, for the purchase of an Orbitrap Eclipse.
Author contributions: D.K. Dansu: Conceptualization, Data curation, Formal analysis, Investigation, Methodology, Project administration, Validation, Visualization, Writing—original draft, Writing—review & editing, I. Selcen: Conceptualization, Data curation, Formal analysis, Investigation, Methodology, Project administration, Validation, Visualization, Writing—review & editing, S. Sauma: Investigation, Writing—review & editing, E. Prentice: Investigation, Writing—review & editing, D. Huang: Data curation, Formal analysis, Visualization, Writing—review & editing, M. Li: Formal analysis, Writing—review & editing, S. Moyon: Investigation, Writing—review & editing, P. Casaccia: Conceptualization, Funding acquisition, Project administration, Supervision, Writing—original draft, Writing—review & editing.

