The architecture of the actin cytoskeleton that concentrates at presynapses remains poorly known, hindering our understanding of its roles in synaptic physiology. In this work, we measure and visualize presynaptic actin by diffraction-limited and super-resolution microscopy, thanks to a validated model of bead-induced presynapses in cultured neurons. We identify a major population of actin-enriched presynapses that concentrates more presynaptic components and shows higher synaptic vesicle cycling than their non-enriched counterparts. Pharmacological perturbations point to an optimal actin amount and the presence of distinct actin structures within presynapses. We directly visualize these nanostructures using Single Molecule Localization Microscopy (SMLM), defining three distinct types: an actin mesh at the active zone, actin rails between the active zone and deeper reserve pools, and actin corrals around the whole presynaptic compartment. Finally, CRISPR-tagging of endogenous actin allows us to validate our results in natural synapses between cultured neurons, confirming the role of actin enrichment and the presence of three types of presynaptic actin nanostructures.
Introduction
In the human brain and nervous system, hundreds of trillions (∼1014) of synapses ensure fast communication between neurons (DeWeerdt, 2019; Cano-Astorga et al., 2021). Chemical synapses are intricate assemblies connecting the emitting neuron, usually from a presynapse located along the axon, to the receiving neuron, typically along its dendrites. Following calcium elevation, synaptic vesicles fuse at the presynaptic active zone, releasing neurotransmitters through the synaptic cleft (Südhof, 2021). Since their discovery by pioneering electron microscopy (EM) works in the middle of the 20th century (Sotelo, 2020), the architecture of presynapses and their diversity have been progressively unraveled. Decades of studies have defined the presence and role of hundreds of specific synaptic proteins, culminating in elaborate molecular models of the presynaptic compartment (Wilhelm et al., 2014). Presynaptic boutons and terminals exhibit unique molecular specialization and structural plasticity, yet the detailed arrangement of the presynaptic cytoskeleton supporting these processes remains poorly known compared with their postsynaptic counterpart. This is particularly true for actin, despite its prominent enrichment in both pre- and postsynapses (Cingolani and Goda, 2008; Gentile et al., 2022).
The presence of actin at presynapses has been recognized from early EM studies, but its precise organization was difficult to pinpoint because of the challenging size, lability, and low contrast of actin filaments in EM preparations (Papandréou and Leterrier, 2018; Leterrier, 2021a). Short actin filaments are seen within the cytomatrix of the active zone, contacting closely apposed synaptic vesicles that form the readily releasable pool (RRP, Hirokawa et al., 1989; Li et al., 2010). Actin filaments are also present deeper in the presynapse, where they are found around or within the vesicle clusters of the reserve pool, which can be mobilized by prolonged or intense stimulation (Landis and Reese, 1983; Siksou et al., 2007). Actin also forms larger structures between the periphery of the active zone, where endocytosis occurs for synaptic vesicle recycling, and the reserve pool (Bloom et al., 2003; Shupliakov et al., 2002; Del Signore et al., 2021; Ogunmowo et al., 2023). The overall view of presynaptic actin organization from EM studies points to the existence of different nanostructures (Dillon and Goda, 2005) but is still too fragmented for a comprehensive architectural model to emerge. Fluorescence optical microscopy can provide much better throughput and molecular specificity to visualize presynaptic components, but its limited spatial resolution (∼250 nm) precludes obtaining details within the ∼1 µm presynaptic bouton. Fortunately, super-resolution microscopy techniques can bypass this limitation, easily reaching resolutions down to tens of nanometers in fixed samples (Jacquemet et al., 2020). Single Molecule Localization Microscopy (SMLM) techniques, such as Stochastic Optical Reconstruction Microscopy (STORM; Rust et al., 2006) or DNA-Point Accumulation in Nanoscale Topography (PAINT; Jungmann et al., 2014) work by localizing single emitters in “blinking” samples, progressively building an image from single fluorophore coordinates with a resolution down to 10–15 nm (Lelek et al., 2021). At the presynapse, SMLM has been used to delineate the organization of specific components, but the organization of presynaptic actin has not been addressed so far (Dani et al., 2010; Carvalhais et al., 2021; Nosov et al., 2020; Glebov et al., 2017). This is likely due to the challenge of densely labeling presynaptic actin (Reshetniak and Rizzoli, 2019) and distinguishing it from the high concentration and dense meshwork of postsynaptic actin that is evident in platinum-replica EM images of synapses (Korobova and Svitkina, 2010).
This lack of a comprehensive view of the presynaptic actin architecture keeps us from understanding the roles of actin in presynaptic physiology and its functions in the various steps of the synaptic vesicle cycle. The diversity of synaptic types studied cannot alone explain the large span of different and often contradictory results on presynaptic functions obtained after perturbation of the actin cytoskeleton (Cingolani and Goda, 2008; Rust and Maritzen, 2015; Wu and Chan, 2022). Applications of drugs that perturb actin assembly have led to reduced, unchanged, or elevated vesicular release depending on the model, drug, and experimental conditions used, leading to a number of conclusions on a driving, resisting, or merely the scaffolding role of presynaptic actin in the synaptic vesicle cycle (Morales et al., 2000; Cole et al., 2000; Li and Murthy, 2001; Sakaba and Neher, 2003; Sankaranarayanan et al., 2003; Bleckert et al., 2012; Rampérez et al., 2019). A plausible explanation of these contrasted results is that distinct actin structures co-exist within presynapses that have different functions in the synaptic vesicle cycle, with a net effect dependent on the precise experimental conditions (Cingolani and Goda, 2008; Papandréou and Leterrier, 2018). This further highlights the need to directly visualize and identify these presynaptic actin nanostructures to generate meaningful hypotheses on their function.
In this work, we thus aimed at delineating and characterizing the presynaptic actin nanostructures. We first set up and validated a bead-induced model of presynapses in cultured hippocampal neurons that allowed us to distinguish presynaptic actin by both diffraction-limited and super-resolution microscopy. We could characterize the actin enrichment in a dominant subpopulation of induced presynapses and its effect on the presynapse composition and cycling activity. We assessed the effect of acute perturbations and modulations of the actin cytoskeleton on presynapses, validating induced presynapses against natural synapses in the same cultures. We then used super-resolution STORM and PAINT to directly visualize presynaptic actin nanostructures, demonstrating the existence of three main types of actin assemblies likely responsible for distinct functions within induced presynapses. Finally, we used CRISPR-tagging of endogenous actin to confirm the role of actin enrichment and the presence of three types of actin nanostructures within natural synapses between neurons.
Results
Bead-induced presynapses allow isolating presynaptic actin for imaging and quantification
The gold standard reagent to label filamentous actin in fixed neurons is fluorescent phalloidin (Melak et al., 2017). It provides a dense labeling of actin filaments, allowing for both quantification of the amount of actin on diffraction-limited images, and visualization of the nanoscale actin structures in super-resolution microscopy (Jimenez et al., 2020; Lavoie-Cardinal et al., 2020). However, phalloidin stains all neurons in a fixed culture, labeling both the presynaptic and postsynaptic actin at synapses. As postsynapses are highly enriched in actin, notably within the dendritic spine heads (Allison et al., 1998), their close apposition hides the lower amount of presynaptic actin (Zhang and Benson, 2002; Fig. S1). This is true not only for diffraction-limited images, where pre- and post-synapses are not resolved (Fig. S1, A and D), but also for STORM images, where despite their better resolution, the highly enriched dendrites and spines mask the presynaptic actin structures (Fig. S1, B, C, E, and F). In neurons after 9–10 d in culture, this is true for both excitatory (VGLUT-positive) synapses contacting spines and filopodia and inhibitory (VGAT-positive) synapses opposed to the actin-rich dendritic shaft (Fig. S1, D–F).
To visualize the specific enrichment and organization of presynaptic actin, we turned to a validated model of presynaptic induction using polylysine-coated beads. As discovered more than 40 yr ago (Burry, 1980), polylysine-coated beads seeded on neuronal cultures will induce the formation of presynaptic compartments within tens of minutes after contacting axons, whereas non-coated beads fail to attach or don’t induce presynaptic specializations (Lucido et al., 2009). These induced specializations show all the structural hallmark of presynapses, including synaptic vesicle pools, and are enriched in presynaptic protein components and are competent for vesicular release (Burry, 1980; Burry et al., 1986; Lucido et al., 2009). They form by inducing recruitment of heparan sulfate proteoglycans harbored by neurexins (Zhang et al., 2018) and have been used to dissect the mechanism of presynapse formation, in particular the need for local axonal translation (Taylor et al., 2013; Batista et al., 2017).
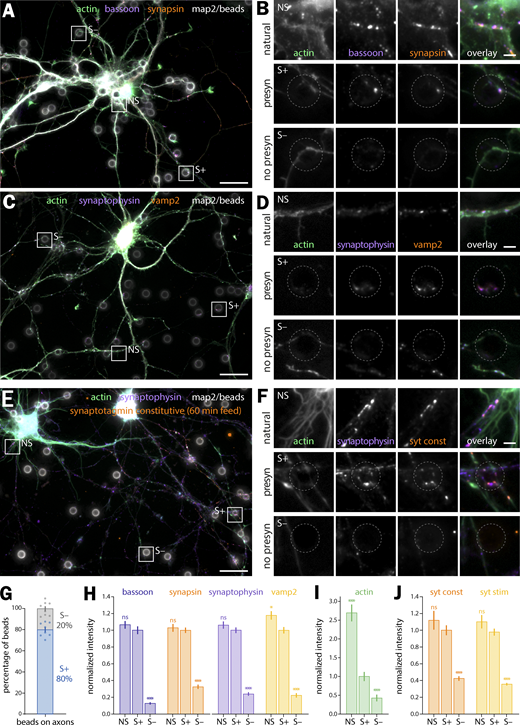
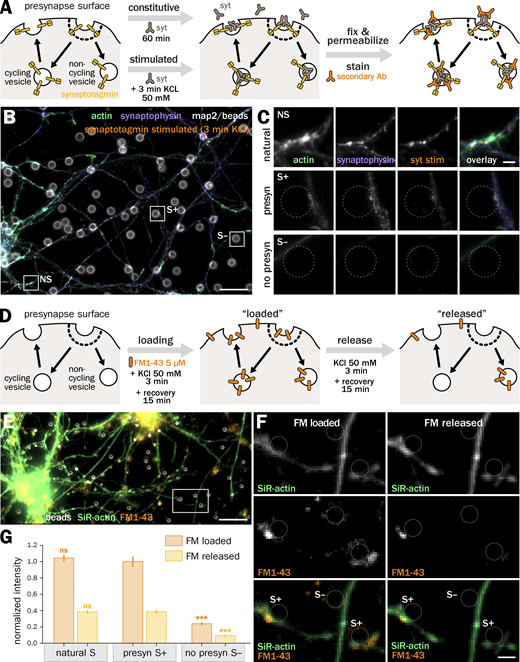
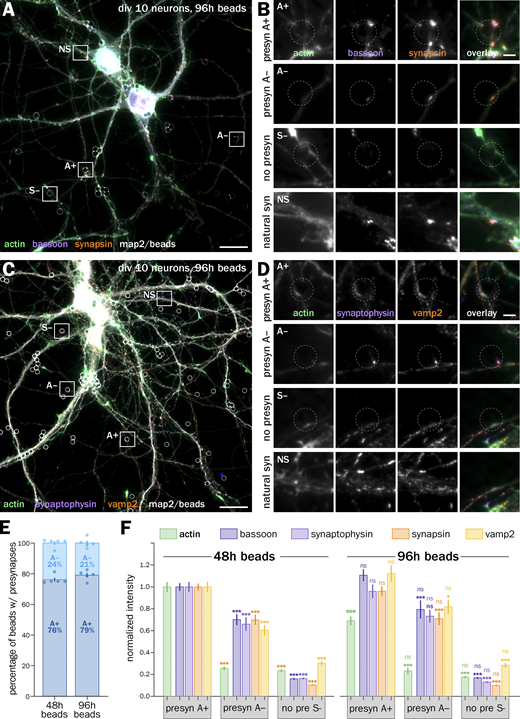
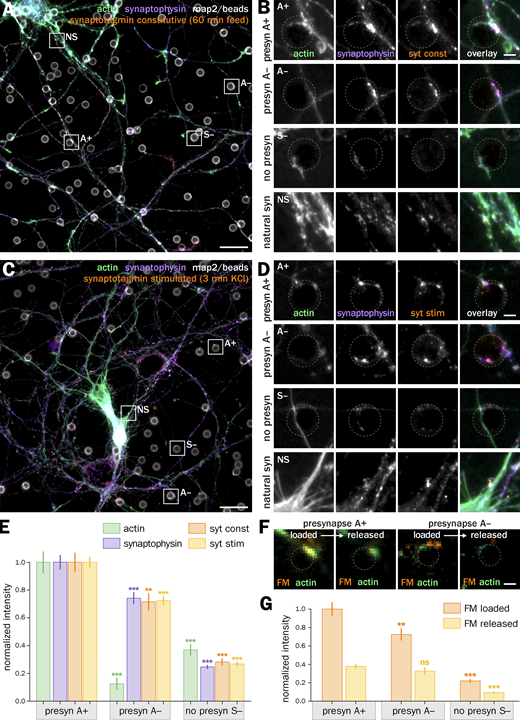
We thus seeded neurons after 7–8 d in vitro (div) with 3–5 µm-diameter polylysine-coated beads to induce isolated presynapses. After 48 h, we fixed and immunolabeled neurons for presynaptic markers to check for presynaptic induction (Fig. 1). Fluorescence images show beads readily inducing the concentration of presynaptic components when contacting axons: scaffold proteins bassoon and synapsin (Fig. 1, A and B) as well as synaptic vesicle proteins synaptophysin and vamp2 (Fig. 1, C and D). 80 ± 2.3% of axon-contacting beads induce such presynaptic components accumulation (S+ population, mean ± SEM, Fig. 1 G), whereas 20 ± 2.3% of beads do not result in visible presynaptic specialization along the contacted axon (S− population; see all statistics and tests for significance in Data S1). We next assessed if the induced presynaptic specializations were competent for vesicular cycling. We first used an antibody against an extracellular epitope of synaptotagmin that accumulates in presynapses either during constitutive cycling via a prolonged incubation or during stimulated cycling via a short incubation together with KCl (Kraszewski et al., 1995; Fig. S2 A). In our bead-seeded cultures, the anti-synaptotagmin antibody readily labels bead-induced presynaptic specializations in both the constitutive (Fig. 1, E and F) and stimulated (Fig. S2, B and C) versions of the assay. We also used the styryl dye FM1-43 to label cycling synaptic vesicles in living neurons (Gaffield and Betz, 2006), loading and then releasing the FM dye using two successive short KCl incubations (Fig. S2 D). FM dye readily accumulates in most enlarged contacts between axons and beads (as visualized using the live-cell actin probe SiR-actin; Lukinavičius et al., 2014) and is released after the second stimulation (Fig. S2, E and F).
In these 9–10 div neurons 48 h after beads seeding, we quantitatively assessed the enrichment of presynaptic components at axon–bead contacts where a presynaptic specialization has developed (S+) compared with the ones where it did not happen (S−), and to “natural” synapses between axons and dendrites in the same culture (NS, Fig. 1 H). Intensity measurements at axon–bead contacts show that induced presynaptic specializations S+ contain 3.1–7.7 times more bassoon, synapsin, synaptophysin, and vamp2 than non-presynaptic contacts S−. This enrichment is similar to natural synapses NS (Fig. 1 H), whereas natural synapses have a 2.7 times higher actin intensity due to the presence of dendritic and postsynaptic actin (Fig. 1 I). In addition, we measured vesicular cycling at axon–bead contacts using the anti-synaptotagmin (syt) antibody feeding assay: induced presynaptic specializations accumulate 2.4–2.7 times more syt antibody than non-presynaptic contacts, an accumulation similar to natural synapses (Fig. 1 J). This was confirmed using FM1-43 loading experiments, where bead-induced presynapses had similar staining intensities to natural synapses after loading and release of the dye (Fig. S2 G). In conclusion, we confirmed that the bead-seeding model robustly induces isolated, functional presynapses in cultured hippocampal neurons, making it a valid model to discriminate presynaptic actin enrichment and organization.
Actin is enriched in a major subpopulation of induced presynapses, which shows higher accumulation of presynaptic components and higher synaptic cycling
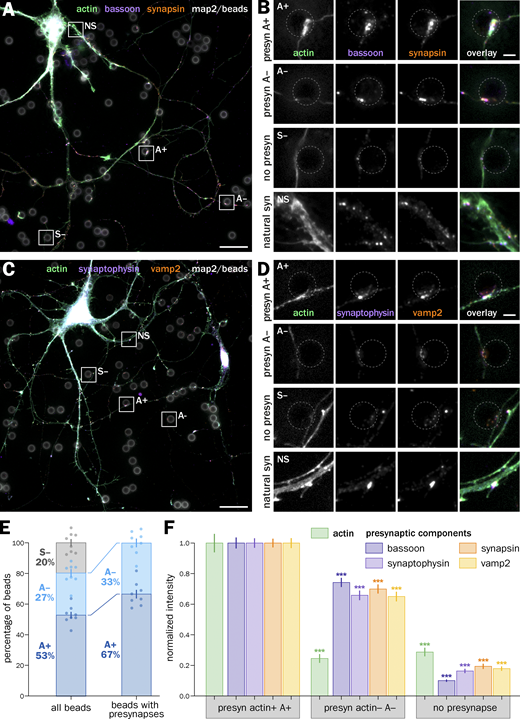
We next focused on the actin content at induced presynapses (Fig. 2). A majority of axon–bead contacts where a presynaptic specialization was induced (labeled S+ in Fig. 1) show visible enrichment in actin compared with the nearby axon shaft after phalloidin staining (Fig. 2, A–D) and were labeled “actin +” (A+), whereas a minority of induced presynapses do not show actin enrichment and were labeled “actin −” (A−). A+ and A− induced presynapses are often found along the same axon arborization, suggesting it is not dependent on a cell-wide state (Fig. 2, A–D). Quantitatively, 67 ± 2.8% of all S+ induced presynapses are A+ (actin-enriched), corresponding to 53 ± 2.1% of all axon-bead contacts (Fig. 2 E). We measured the intensity of presynaptic components clusters at A+, A−, and S− axon–bead contacts to compare the accumulation of components in each type of contact (Fig. 2 F). In all quantifications, we normalized the cluster intensities to the dominant A+ population. By definition, actin intensity is much lower in A− than in A+ presynapses, similar to non-presynaptic contacts S− (0.25 ± 0.03 and 0.29 ± 0.03, respectively; Fig. 2 F). The intensity of presynaptic component clusters in A− presynapses is significantly below that of A+ presynapses (below 1 after normalizing to A+ presynapses: 0.74 ± 0.03 for bassoon; 0.66 ± 0.03 for synaptophysin; 0.70 ± 0.03 for synapsin; 0.65 ± 0.03 for vamp2; Fig. 2 F). Altogether, two-thirds of induced presynapses are specifically enriched in actin, and this enrichment is associated with a 30–50% enrichment in all presynaptic components assessed.
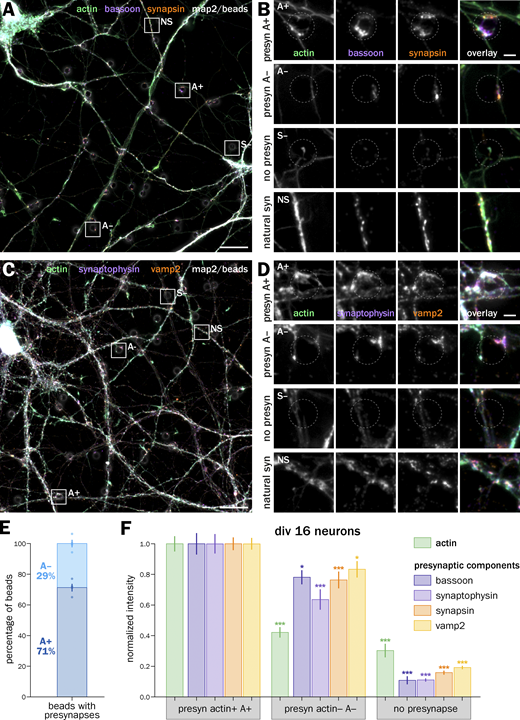
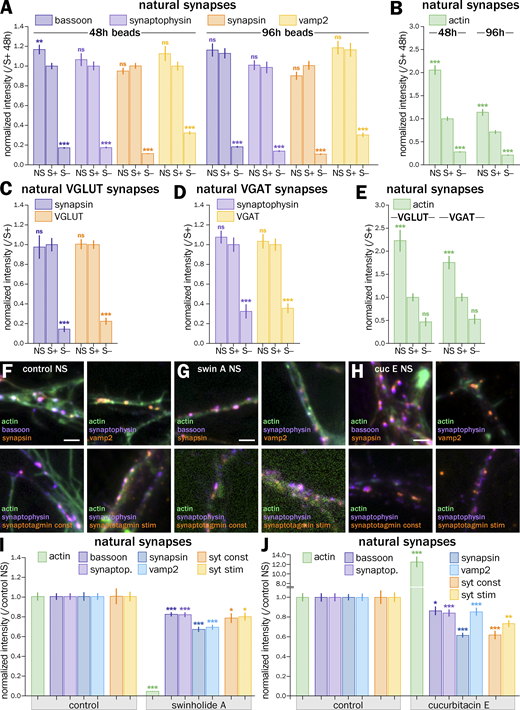
We then explored what are the factors for this selective enrichment of actin at induced presynapses. First, we tested if the maturity of seeded neurons could have an effect on actin enrichment (Fig. S3). We seeded neurons during the third week in culture (polylysine beads seeded at 14 div and fixation at 16 div) instead of the second week. Classification of axon-bead contacts into A+, A−, and S−, and quantification of presynaptic clusters intensities show similar results to neurons seeded with beads between 8 and 10 d (Fig. S3, A–F, see Data S1 for precise values and statistics). This shows that the maturation stage of neurons is not a key factor in the development of induced presynapses and that second-week neurons are as competent as third-week ones for developing isolated presynapses. We then assessed if the ∼30% proportion of induced presynapses that are not enriched in actin (A−) is due to a lack of synaptic maturation 48 h after bead seeding. We thus compared neurons seeded at 6 div and incubated with beads for 48 h (endpoint 8 div) or 96 h (endpoint 10 div, Figs. S4 and S6). We found that induced presynapses had levels of presynaptic components similar to natural presynapses at both time points (Fig. S6 A). The proportion of A− induced presynapses was similar after 48 and 96 h (Fig. S4 E), and in both conditions, A+ induced presynapses showed a similar 30–50% enrichment in presynaptic components and synaptic vesicle cycling (Fig. S4 F). This shows that synaptic maturation is not a factor for the existence of the A+ and A− populations of induced presynapses and their distinct accumulation of presynaptic components.
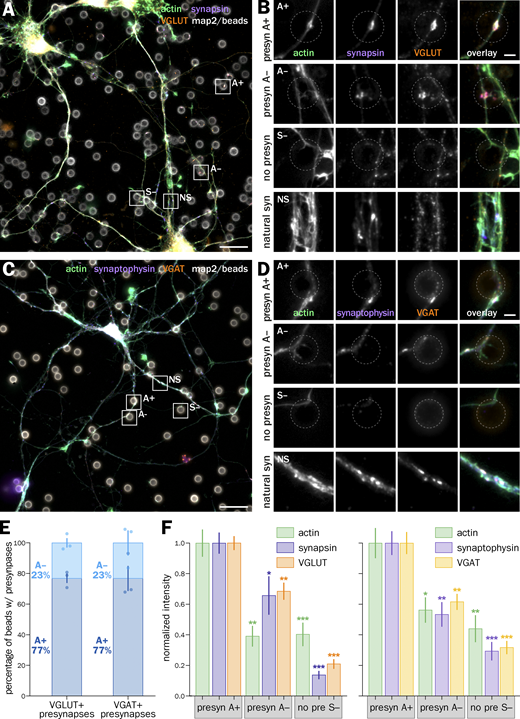
Next, we tested if the proportion of A+ and A− induced presynapses is different between presynapses induced along axons from excitatory (glutamatergic) and inhibitory (GABAergic) neurons. In cultures of embryonic rat hippocampal neurons, only 6% of neurons are GABAergic (Benson et al., 1994), but their synapses represent between 20% and 40% of all synapses (Harms and Craig, 2005; Danielson et al., 2021). We labeled bead-seeded neurons using markers for glutamatergic (VGLUT) and GABAergic (VGAT) presynapses (Fig. S5, A–D) and measured the proportion of A+ vs. A− induced presynapses as well as the intensity of presynaptic component clusters in each population. Actin-enriched presynapses are similarly dominant in the two synapse types (Fig. S5 E). In both types, actin enrichment is associated with a higher accumulation of presynaptic components (including VGLUT and VGAT), with normalized cluster intensities below 1 for the A− presynapses (Fig. S5 F). In addition, we verified that bead-induced presynapses had similar presynaptic component levels as natural synapses in the same cultures (Fig. S6, C and D), except that actin was 2.2 and 1.8 times higher at natural synapses for glutamatergic and GABAergic synapses, respectively, due to the presence of postsynaptic actin (Fig. S6 E). This shows that selective actin enrichment is similar in excitatory- and inhibitory-induced presynapses, suggesting a general phenomenon that does not depend on the presynapse type.
Finally, we assessed whether actin enrichment in induced presynapses is associated with a difference in synaptic vesicle cycling. It has been shown that actin was involved in activating silent synapses after stimulation, suggesting that non-enriched presynapses could even be silent in our cultures (Yao et al., 2006). We used the syt antibody feeding assay (Fig. S2 A) to measure the constitutive and stimulated vesicular cycling at actin-enriched and non-enriched induced presynapses while monitoring the synaptophysin accumulation in the same experiment (Fig. 3, A–D). A+ presynapses showed a 20–40% more intense syt accumulation than A− presynapses, with the A− normalized intensity of syt clusters being below 1 for both constitutive and stimulated versions of the assay (0.71 ± 0.06 for constitutive cycling and 0.72 ± 0.03 for stimulated cycling; Fig. 3 E). We confirmed these results using FM1-43 staining experiments in living neurons co-stained with SiR-actin to reveal the actin enrichment at induced presynapses, measuring FM1-43 intensity after dye loading and release by two successive short KCl incubations (Fig. 3 F). Actin-enriched presynapses A+ could accumulate more FM1-43 than non-actin enriched ones A− that had a lower normalized intensity (0.72 ± 0.07), while the intensity level after dye release was similarly low (0.38 ± 0.03 for A+ and 0.33 ± 0.04 for A− after release, normalized to the loaded A+ intensity; Fig. 3 G). Thus, lack of actin enrichment is not associated with silent presynapses, but actin-enriched induced presynapses tend to have a significantly higher vesicular cycling activity.
Both acute disassembly and over-stabilization of actin content lower the accumulation of presynaptic components and vesicular cycling in presynapses
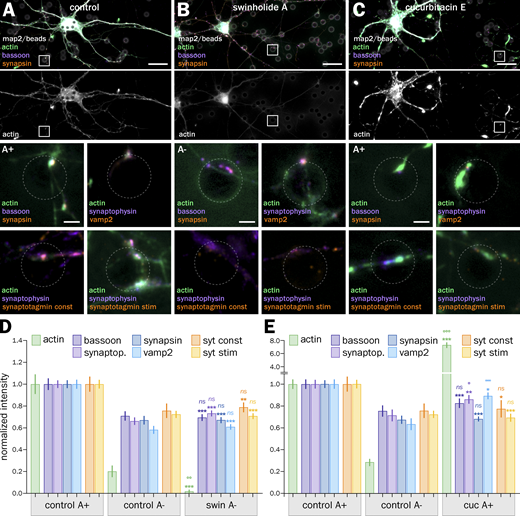
To test if actin enrichment was responsible for the higher accumulation of presynaptic components and higher cycling rate of A+ presynapses, we perturbed actin using drugs able to either disassemble and sever actin filaments (swinholide A; Spector et al., 1999) or inhibit their depolymerization and overstabilize them (cucurbitacin E; Sörensen et al., 2012). We used acute perturbations with strong drugs to avoid indirect effects from impacting other aspects of neuronal physiology (Fig. 4; Vassilopoulos et al., 2019). 1 h treatment with 1 µM swinholide A (swin) results in the near-complete disappearance of filamentous actin at induced presynapses, as evidenced by comparing phalloidin staining between the control and swin conditions (Fig. 4, A and B), and all treated presynapses were classified as A− with their actin normalized intensity dropping to 0.02 ± 0.01 (Fig. 4 D). Conversely, phalloidin staining is strongly elevated after a 3 h treatment with 5 µM cucurbitacin E (cuc; Fig. 4 C), which caused all treated presynapses to be classified as A+, and a rise of the normalized intensity to 7.3 ± 0.43 (Fig. 4 E).
We then measured the accumulation of presynaptic components and vesicular cycling after swin and cuc treatments. Swin treatment decreased the accumulation of all labeled components to values very similar to those from untreated A− presynapses (normalized intensities of 0.69 ± 0.03 for bassoon, 0.74 ± 0.03 for synaptophysin, 0.67 ± 0.03 for synapsin, and 0.61 ± 0.03 for vamp2; Fig. 4 D). In addition, actin disassembly by swin also reduced the vesicular cycling in both constitutive and KCl-stimulated assays to values similar to control A− presynapses (syt normalized intensities of 0.79 ± 0.04 for constitutive and 0.71 ± 0.03 for stimulated; Fig. 4 D). Interestingly, elevated polymerization and stabilization of actin by cuc also reduced the accumulation of presynaptic components and vesicular cycling at induced presynapses to values similar to untreated A− presynapses (normalized intensities of 0.83 ± 0.04 for bassoon, 0.86 ± 0.04 for synaptophysin, 0.68 ± 0.02 for synapsin, 0.89 ± 0.03 for vamp2, 0.77 ± 0.08 for syt constitutive, and 0.69 ± 0.04 for syt stimulated; Fig. 4 E).
This drop in presynaptic component clustering and vesicular cycling after both swin and cuc treatments suggests that an optimal level of presynaptic actin enrichment is needed to ensure their efficient functioning. To further confirm the validity of these findings, we measured the accumulation of presynaptic components and the amount of vesicular cycling in natural synapses (dendrite-axon contact) on the same images as the bead-induced presynapses. Actin disassembly by swin and overstabilization by cuc leads to a 10–40% drop in presynaptic component accumulation and vesicular cycling, in line with the effects observed in bead-induced presynapses (Fig. S6, F–J).
Inhibition of actin nucleators results in different effects on actin and presynaptic components in induced presynapses, suggesting action on distinct presynaptic actin structures
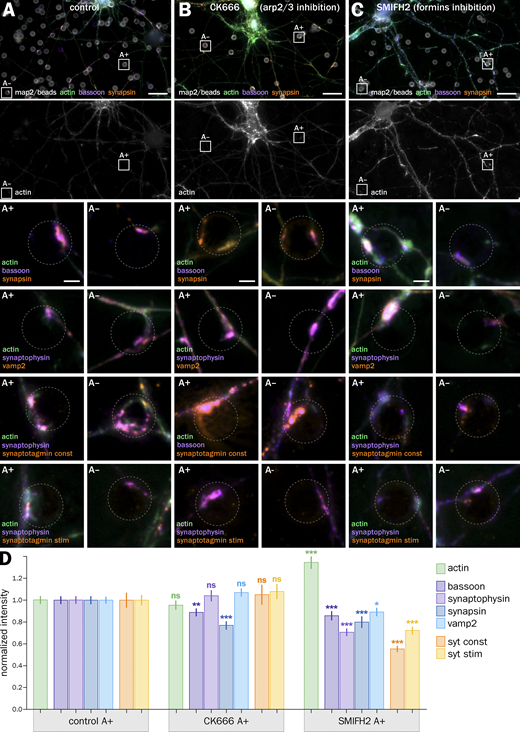
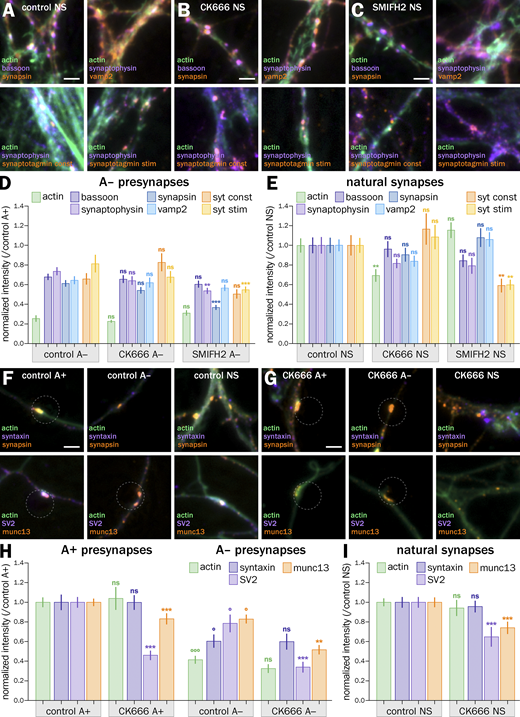
The fact that both actin disassembly and overstabilization lead to a less efficient vesicular cycling is consistent with the idea that distinct actin structures coexist within a presynapse and can have opposing effects on presynaptic function. To address this hypothesis more finely, we used drugs that target distinct actin filament nucleation mechanisms: CK666 inhibits Arp2/3-mediated branched actin nucleation (Nolen et al., 2009), whereas SMIFH2 inhibits the nucleation of linear actin structures mediated by formins (Rizvi et al., 2009). We thus evaluated the effect of CK666 and SMIFH2 treatments on actin-enriched induced presynapses (A+; Fig. 5, A–C). 1 h treatment with 50 μM CK666 results in a contrasted modulation of presynaptic components (Fig. 5 D): total filamentous actin in A+ presynapses is not significatively affected (normalized intensity of 0.95 ± 0.04), indicating a shift of actin polymerization toward other nucleation mechanisms. Scaffold proteins bassoon and synapsin are downregulated (0.89 ± 0.04 for bassoon and 0.77 ± 0.04 for synapsin), whereas synaptic vesicle proteins and vesicular cycling are not significantly affected (1.04 ± 0.05 for synaptophysin, 1.07 ± 0.04 for vamp2, 1.05 ± 0.09 for syt constitutive, and 1.08 ± 0.07 for syt stimulated). We further tested the effect of CK666 on presynaptic scaffold protein Munc13 and synaptic vesicle proteins syntaxin and SV2 and measured a reduction in the accumulation of SV2 and Munc13, but not syntaxin, in bead-induced presynapses after CK666 treatment (Fig. S7, F–H). Treatment with 30 µM SMIFH2 for 1 h results in a significantly higher amount of actin in A+ presynapses (normalized intensity 1.35 ± 0.06), but this compensation is associated with a general downregulation of presynaptic components (0.86 ± 0.04 for bassoon, 0.71 ± 0.03 for synaptophysin, 0.80 ± 0.05 for synapsin, and 0.89 ± 0.04 for vamp2) and a significant drop of vesicular cycling (0.55 ± 0.03 for syt constitutive and 0.72 ± 0.04 for syt stimulated, Fig. 5 D).
By contrast, CK666 has no effect on induced presynapses non-enriched in actin and SMIFH2 has a limited effect on synapsin and synaptophysin content, as well as KCl-stimulated cycling (Fig. S7 D). Here again, we verified the effects found on induced presynapses by quantifying the effect of CK666 and SMIFH2 on natural synapses in the same neuronal culture (Fig. S7, A–C, E, and I). The same treatments resulted in small variations for presynaptic components’ accumulation, suggesting a tighter control or higher stability of the presynaptic compartment in natural synapses. Of note, vesicular cycling is strongly affected by inhibiting formins with SMIFH2, similar to induced presynapses (Fig. S7 E). Overall, the effect of CK666 and SMIFH2 on induced presynapses content and function reveals some insight into the role of different actin structures: small, contrasted effects of inhibiting Arp2/3 likely result from the inhibition of several different branched Arp2/3-dependent actin structures, whereas the global downregulation observed with SMIFH2 suggests the presence of linear, formin-dependent actin structures that favor synaptic cycling.
STORM of actin at induced presynapses reveals three types of nanostructures
At this point, these inferred distinct actin structures remained undiscernible due to the small size of the presynapses and the limited resolution of diffraction-limited fluorescence microscopy. We thus used STORM to directly visualize actin nanostructures within induced presynapses with a lateral resolution of around 15 nm (Fig. 6; Leterrier et al., 2015). In contrast to natural axon-dendrite synapses (Fig. 6, A and B, top), STORM clearly resolves presynaptic actin at axon–bead presynapses (Fig. 6, A and B, bottom and Fig. 6 C). The 190-nm spaced actin rings found along the axon shaft (Leterrier, 2021b; Vassilopoulos et al., 2019) usually stop at the presynaptic bouton, confirming previous results suggesting that boutons are devoid of the axonal actin/spectrin periodic scaffold (He et al., 2016; Sidenstein et al., 2016). However, it is sometimes possible to see a continuity of the periodic scaffold along the membrane dorsal to the presynaptic contact, consistent with the idea that en-passant boutons are laterally adjacent to a continuous axonal shaft. In addition, the vicinity of presynapses often shows fine longitudinal actin bundles, reminiscent of the actin trails that can transport actin and presynaptic components between adjacent boutons (Fig. 6 C; Ganguly et al., 2015; Chenouard et al., 2020).
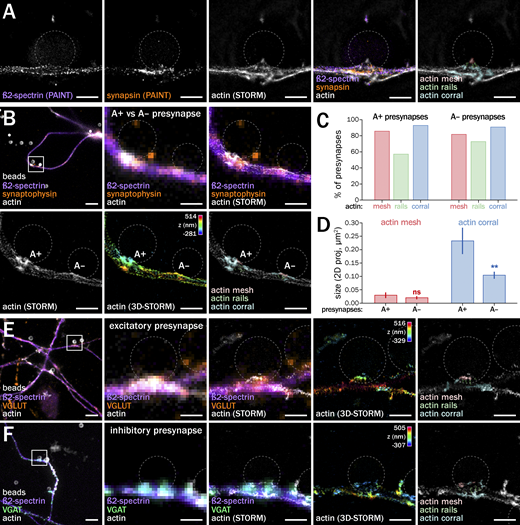
Within induced presynapses themselves, STORM allowed us to delineate distinct nanostructures that we could classify into three types (Fig. 6 D): a small, often faint cluster of actin mesh at the bead contact, corresponding to the localization of the active zone (in red on Fig. 6 D); linear actin rails often connecting the active zone to deeper compartments within the bouton (green on Fig. 6 D); and larger, branched structures surrounding the whole presynapse (synapsin-positive area) that we called actin corrals (in cyan on Fig. 6 D). Similar to natural presynapses, induced presynapses show significant variability in size, shape, and architecture. Despite this, the three types of presynaptic actin structures (mesh, rails, and corrals) were consistently identified in most of the >90 presynapses imaged by STORM in control conditions (Fig. 6 E). To refine the relationship between actin and presynaptic components, we performed three-color STORM/PAINT acquisition, imaging actin with STORM before performing two-color DNA-PAINT (Jimenez et al., 2020) for ß2-spectrin, which forms rings along the axon shaft, and synapsin, which delineates the pools of synaptic vesicles. This confirmed that the spectrin submembrane scaffold stops at the bouton and that the actin corral encases the synaptic vesicle cluster, with rails pointing to the active zone (Fig. 7 A).
As our diffraction-limited experiment revealed two populations of actin-enriched (A+) and non-enriched (A−) induced presynapses (see Fig. 2), we next assessed the difference between these two types at the nanoscale by imaging A+ and A− induced presynapses with STORM. Both A+ and A− induced presynapses contain the three types of actin nanostructures (mesh, rails, and corrals), and actin enrichment at the diffraction-limited level corresponds to the presence of larger actin corrals at the periphery of the presynapse (Fig. 7 B). To quantify this, we blindly scored the presence of actin mesh, rails, and corrals within each A+ and A− induced presynapse by visual inspection of high-resolution 3D-STORM images (see Materials and methods). This confirmed that most A+ and A− induced presynapses contain an actin mesh (86% and 82%, respectively), rails (57% and 73%, with the faint rails more visible in A− presynapses with smaller corrals), and corrals (93% and 91%, Fig. 7 C). Measuring the size of the mesh and corrals from images showed that corrals are indeed significantly larger in A+ than in A− induced presynapses (0.23 ± 0.05 µm2 vs. 0.10 ± 0.01 µm2; Fig. 7 D). We next assessed if the three types of actin nanostructures are present in excitatory and inhibitory presynapses induced by coated beads (see Fig. S5). Anti-VGLUT and -VGAT antibodies revealed no qualitative difference in actin nanoarchitecture between these two types of induced presynapses, most of which contain actin mesh, rails, and corrals (Fig. 7, E and F).
Presynaptic actin nanostructures are distinctly dependent on arp2/3 and formins nucleators
The nanoscale texture of the mesh and corrals suggest that they are made of branched actin filaments, while the rails are made of linear filaments, and could be differentially dependent on Arp2/3 and formins-mediated actin nucleation. To test this, we performed 3D-STORM of induced presynapses after a short treatment of bead-seeded cultures with CK666 (50 µM, 1 h) and SMIFH2 (30 µM, 1 h) and blindly scored the presence of actin mesh, rails, and corrals (Fig. 8, A–C). Inhibition of Arp2/3-mediated branched actin nucleation with CK666 resulted in a lower proportion of presynapses containing actin mesh (from 71% to 62% of presynapses) and actin corrals (from 69% to 62%), whereas it led to slightly more presynapses with actin rails (from 46% to 54%; Fig. 8 D). Inhibition of formins-mediated linear actin nucleation minimally elevated meshes and corrals (71–78% and 69–72%, respectively), but led to a drop in the proportion of presynapses containing actin rails (46–33%). These effects of treatments are quite small and the semiquantitative evaluation precludes assessing their significance. To confirm the distinct dependence of presynaptic actin nanostructures on different actin nucleators, we imaged actin together with the Arp2/3 complex at the nanoscale using two-color spectral demixing STORM (Friedl et al., 2023 Preprint). Within bead-induced presynapses, we could resolve the Arp2/3 complexes as discrete puncta that are associated with the actin mesh and corrals, but not along the actin rails (Fig. 8 E). Overall, these experiments suggest that the actin mesh and corrals are Arp2/3-dependent, while the actin rails rely on formin-mediated nucleation, confirming that they are indeed distinct structures.
CRISPR-tagging of endogenous actin confirms actin enrichment and organization into distinct nanostructures within natural presynapses
Finally, we aimed at verifying our findings on natural presynapses—formed between an axon and a dendrite or cell body. To obtain a high labeling density of actin in a small subset of neurons in culture, we implemented the HiUGE method (Gao et al., 2019) to insert small peptide tags at the aminoterminus of endogenous ß-actin via CRISPR-mediated recombination. We used an optimized triple-AAV infection method to obtain a good knock-in efficiency in our rat hippocampal cultures (Ogawa et al., 2023 Preprint). We first devised a HA tag knock-in and verified that the insertion of a small tag allowed us to selectively label actin in a small subset of neurons, with a similar organization to unlabeled actin and without impairing neuronal growth or morphology for several weeks in culture (Fig. 9 A). We could follow individual axons from knocked-in neurons and visualize presynapses as well as probe synaptic vesicle cycling along these identified axons (Fig. 9, B and C). Like the bead-induced presynapses, a majority (75 ± 1.5%) of these natural presynapses were enriched in actin compared with the nearby axon shaft. Moreover, the actin-enriched (A+) presynapses exhibited a ∼40% higher synaptophysin content compared with non-enriched (A−) ones (synaptophysin intensity in A− presynapses 0.78 ± 0.06, normalized to the A+ intensity) and a ∼50% higher level of vesicular cycling (syt feeding intensity in A− presynapses 0.67 ± 0.09, Fig. 9 D). These figures were very similar to bead-induced presynapses (see Figs. 2 and 3), confirming our key findings that a majority of presynapses are enriched in actin and that enrichment correlates with higher presynapse component accumulation and vesicular cycling.
We next optimized the endogenous actin-tagging strategy to obtain high-quality SMLM images and reveal the nanoarchitecture of actin within natural presynapses. The best results were obtained with the ALFA tag (Götzke et al., 2019; Fig. 10, A and B). To obtain a high-enough number of localizations for good structural imaging of presynaptic actin using STORM, we labeled the ALFA tag with primary and secondary antibodies, visualizing actin rings along the axon shaft and presynapses formed on the dendrites and cell body of unlabeled neurons (Fig. 10 C). Antibody labeling led to more punctate labeling than phalloidin. Nonetheless, when these presynapses were oriented sideways, we could identify the three nanostructures previously observed within bead-induced presynapses: a small mesh at the central point of the presynapse close to the dendrite, linear rails inside the presynaptic protein cluster, and larger actin corrals at the presynapse periphery (Fig. 10, C and D). To further validate these findings using smaller probes than primary and secondary antibodies, we used a triple-ALFA tag together with an anti-ALFA nanobody coupled to a DNA docking strand and performed 3D-PAINT of knocked-in actin at natural presynapses. These images also showed that natural presynapses contain the actin mesh, rails, and corrals (Fig. 10, E and F), confirming our findings on bead-induced presynapses.
Discussion
In this work, we addressed a long-standing gap in our understanding of neuronal architecture by delineating and characterizing the presence of actin nanostructures within presynapses. We first made presynaptic actin visible by inducing isolated presynapses on polylysine-coated beads. This revealed that around two-thirds of presynapses are enriched in actin, an enrichment associated with a higher accumulation of presynaptic components (scaffolds and synaptic vesicle-associated proteins), and an elevated rate of constitutive and stimulated vesicular cycling. This 30–50% strengthening of presynapses depends on a set level of actin enrichment, as it disappears after both disassembly or over-stabilization of axonal actin. Acute modulation of actin assembly by Arp2/3 and formins inhibitors results in more subtle effects on presynaptic component accumulation and vesicular cycling, suggesting that they target distinct actin structures within presynapses. We were able to directly visualize these presynaptic actin structures using super-resolution SMLM in bead-induced presynapses, revealing that presynaptic actin forms three main types of nanostructures: an Arp2/3-dependent actin mesh at the active zone, formin-sensitive actin rails between the active zone and the deeper presynapse containing the reserve pool of synaptic vesicles, and Arp2/3-dependent dense, branched actin corrals surrounding the whole presynaptic compartment. Finally, we confirmed these results in natural presynapses using CRISPR-mediated tagging of endogenous actin. This first comprehensive view of presynaptic actin architecture provides a structural basis for its multiple previously proposed functions and will foster new hypotheses on the role of actin at presynapses (Fig. 10 G).
Visualizing the arrangement of actin within presynapses presents several challenges. Brain mammalian synapses are usually small and packed with a high density of components, with actin being the most abundant one (Wilhelm et al., 2014). In addition, actin filaments are hard to optimally preserve and not readily visible on classic EM thin sections (Papandréou and Leterrier, 2018). Finally, the close apposition of an even greater amount of postsynaptic actin makes optical fluorescence approaches, even super-resolutive ones, challenging (see Fig. S1). Selective labeling of presynaptic actin using over-expressed probes such as LifeAct-GFP is possible (Reshetniak and Rizzoli, 2019), but avoiding perturbative effects requires very low labeling densities, below what is necessary to resolve the fine organization of actin filaments. To benefit from the high density of actin labeling provided by fluorescent phalloidin without interference from the postsynaptic side, we used a validated model of bead-induced presynapses (Lucido et al., 2009). We have confirmed that bead-induced presynapses concentrate all tested presynaptic components and are competent for synaptic vesicle cycling using anti-synaptotagmin antibody feeding and FM1-43 staining experiments. We have carefully verified that experiments that do not involve measuring actin content, such as presynaptic component accumulation and vesicular cycling after pharmacological treatments, give similar results in bead-induced presynapses and natural (axon-dendrite) presynapses present in the same neuronal cultures. Finally, we have used a complementary strategy of endogenous actin knock-in to confirm our key finding in natural presynapses.
Being able to specifically visualize presynaptic actin, we first found that a major subpopulation of presynapses is enriched in actin and that these actin-enriched presynapses are structurally and functionally stronger than the non-enriched presynapses. Numerous studies have examined the role of actin at presynapses, with a large variability in results and conclusions (Cingolani and Goda, 2008; Papandréou and Leterrier, 2018; Wu and Chan, 2022). Among them, actin disassembly has been shown to impact immature synapses (5–6 div) but not established synapses in mature neurons (12–16 div; Zhang and Benson, 2001). Here, we have induced presynapses between 8 and 10 div when neurons are fully competent for presynapse formation. In addition, presynapses form within minutes after bead contact (Suarez et al., 2013), allowing them to maturate over 48 h after seeding in our experiments. We further verified that incubating more mature neurons, as well as incubating them with beads for up to 96 h, generate the same proportions of actin-enriched and non-enriched presynapses, suggesting that these two populations of presynapses are unlikely to be at a transient developmental stage of maturation. Actin has also been shown to drive activity-induced unsilencing of presynaptically non-functional synapses in 7–11 div neurons (Yao et al., 2006; Shen et al., 2006). In bead-induced presynapses, we did not see such a clear on/off difference in vesicular cycling between actin-enriched and non-enriched presynapses. However, the absence of actin enrichment is associated with lower presynaptic content and less constitutive and stimulated cycling. In addition, acutely disassembling actin brings actin-enriched presynapses to the component and cycling levels of non-enriched ones. It would be interesting to determine which stages of the vesicular cycle are regulated by actin enrichment, as well as if the selective actin enrichment is induced by an existing nucleator concentration, or can be influenced by the activity patterns at each presynapse. Indeed, in the light of more recent studies (Glebov et al., 2017; O’Neil et al., 2021), the interplay between neuronal activity, the concentration and organization of presynaptic actin, and the resulting regulation of presynaptic strength is a key question for future studies.
In bead-induced presynapses, we visualized the nanoscale organization of actin with the resolution required to discern distinct structures. Optimized SMLM consistently revealed the presence of three main actin nanostructures: an active zone mesh, rails between the active zone and the deeper reserve pools, and corrals around the whole presynaptic compartment. Importantly, we validated the generality of these nanostructures: they are present in both actin-enriched and non-enriched induced presynapses, the difference being the size of the actin corrals, and are present in both excitatory and inhibitory presynaptic specializations. Using endogenous actin tagging, we could finally detect these three types of actin nanostructures in natural presynapses between axons and dendrites.
We further determined that the presynaptic actin nanostructure has a distinct dependency on Arp2/3 and formins, which could explain why inhibition of these actin nucleators has distinct effects on presynaptic content and vesicular cycling, with further variations depending on the presynaptic component assessed. The nanoscale association of Arp2/3 with the presynaptic actin mesh and corrals is in line with its recently described role in presynaptic plasticity (O’Neil et al., 2021). Of note, the strong effect of formins inhibition is likely partly due to a reduction of intersynaptic vesicle trafficking by actin trails (Ganguly et al., 2015; Chenouard et al., 2020). It should also be kept in mind that the formins inhibitor SMIFH2 can inhibit non-muscular myosin II (NMII) activity partially. While SMIFH2 is three to six times less potent on NMII than on formins, NMII is implicated in the synaptic vesicle cycle (Peng et al., 2012; Chandrasekar et al., 2013). However, NMII is differentially implicated in constitutive and evoked release (Peng et al., 2012), a selective effect we do not see when applying SMIFH2 to induced presynapses. Finally, formins implication in the synaptic vesicle cycle has been confirmed independently of SMIFH2 by knockdown of the formin mDia1 (Soykan et al., 2017).
This direct visualization brings together decades of scattered EM observation and structural speculations from perturbation experiments (Dillon and Goda, 2005), allowing for functional hypotheses. The presence of branched actin at the active zone (Hirokawa et al., 1989) could have a resistive effect on exocytosis and define exocytic sites (Aunis and Bader, 1988; Morales et al., 2000); the actin rails (Siksou et al., 2007) might allow myosin-mediated trafficking of vesicles between the reserve pool and the readily releasable pool at the active zone (Maschi et al., 2018; Sakaba and Neher, 2003); and the perisynaptic branched actin corrals (Li et al., 2010) could help in constraining, shaping, or retaining components of the reserve pool (Sankaranarayanan et al., 2003). Each of these nanostructures could also have a role in the retrieval of new synaptic vesicles via endocytosis, in particular, the actin corrals: presynaptic endocytosis has been shown to involve actin at the periphery of the active zone, where corrals are localized (Bloom et al., 2003; Shupliakov et al., 2002; Del Signore et al., 2021). A recent study using STED microscopy confirmed the presence of perisynaptic actin corrals, proposing that they confine excess membrane from exocytosed vesicles within the presynaptic area, allowing for fast compensatory endocytosis near the corrals (Ogunmowo et al., 2023).
Isolated presynapses in culture are undoubtedly a reductionist approach to the myriad of processes influencing synapse physiology in vivo, but they have allowed us to uniquely isolate and reveal core principles of presynaptic actin organization. Multiple additional layers are added to further shape the presynaptic actin architecture through maturation and plasticity. Feedback mechanisms from the postsynaptic compartments, such as cannabinoid regulation of the presynaptic architecture (McFadden et al., 2018,Preprint) or neuroligin-driven strengthening of presynaptic scaffolds (Wittenmayer et al., 2009), are absent from our experimental model. This also prevents further refinements, like the formation of cross-synaptic nanocolumns that align the release machinery to the clusters of postsynaptic receptors (Tang et al., 2016)—although it should be noted that recent works hint at a primary role of the presynaptic side in organizing nanocolumns (Ramsey et al., 2021). Our study provides the first comprehensive visualization of presynaptic actin structures at the nanoscale, replacing the inferred cartoons of past studies with experimental data. We look forward to this structural insight to help revisit functional hypotheses and elaborate new ones toward a better understanding of actin’s multiple roles at presynapses.
Materials and methods
Animals, cell culture, and polylysine-coated bead treatment
All procedures were in agreement with the guidelines established by the European Animal Care and Use Committee (86/609/CEE) and were approved by the local ethics committee (agreement G13O555). Experiments were performed on pregnant female Wistar rats (Janvier labs). Animals were sacrificed by decapitation and embryo brains were used for primary neuronal cell culture.
Rat hippocampal neurons were cultured following the Banker method above a feeder glia layer (Kaech and Banker, 2006). Rapidly, 18-mm diameter round, #1.5H coverslips were affixed with paraffine dots as spacers and then treated with poly-L-lysine. Hippocampi from E18 rat pups were dissected, homogenized by trypsin treatment followed by mechanical trituration, and seeded on the coverslips at a density of 6,000 cells/cm2 for 3 h in a serum-containing plating medium (MEM with 10% fetal bovine serum, 0.6% added glucose, 0.08 mg/ml sodium pyruvate, and 100 UI/ml penicillin-streptomycin). Coverslips were then transferred, cells down, to Petri dishes containing confluent glia cultures conditioned in NB+ medium (Neurobasal medium supplemented with 2% B-27, 100 UI/ml penicillin/streptomycin and 2.5 µg/ml amphotericin) and cultured in these dishes for up to 16 d at 37°C, 5% CO2. For most bead-induced presynapse experiments (except Fig. S3), neurons were cultured for 8 d in vitro (8 div) before the addition of beads (6 div for the comparison between 48 and 96 h of bead induction). Poly-D-lysine beads are prepared as follows: 30 million of 3 or 4.5-µm aliphatic amine latex beads (A3736 or A37370, respectively; Thermo Fisher Scientific) were incubated with poly-D-lysine (P7405, 63 µg/ml; Sigma-Aldrich) in Dulbecco’s phosphate buffered saline (PBS; Thermo Fisher Scientific) for 3 h at room temperature with rotary agitation. Beads were then washed twice in sterile water and once with NB+ medium. Beads were resuspended in NB+ medium and added dropwise to the neurons at a concentration of 3 million beads/coverslip, neurons facing up. After 3 h, the coverslips were then flipped back, neurons facing the astrocytes for 2 d before further treatments.
Pharmacological treatments and anti-synaptotagmin vesicular cycling assays
Neurons at 10 div were treated 1 h with 1 µM swinholide A (Sigma-Aldrich), 3 h with 5 µM cucurbitacin E (Sigma-Aldrich), 1 h with 50 μM CK666 (Bio-Techne), or 1 h with 30 µM SMIFH2 (Bio-Techne). Drugs were directly added to the culture medium and controls included the same amount of dimethyl sulfoxide (DMSO) that was originally used to dissolve the drugs. Neurons were rinsed three times with PBS prior to fixation.
Vesicular cycling assays were performed using an antibody directed to an extracellular epitope of synaptotagmin 1 (syt, clone 604.2; Synaptic Systems) that was fed to neurons just before fixation. For assaying constitutive cycling, neurons were incubated with the syt antibody at 1.6 µg/μl in HBS medium (NaCl 136 mM, HEPES 10 mM, D-glucose 10 mM, CaCl2 2 mM, MgCl2 1.3 mM) for 1 h at 37°C, 5% CO2. For assaying stimulated cycling, neurons were treated with the syt antibody in an HBS medium supplemented with 50 mM KCl for 3 min at room temperature. Cells were then washed three times with PBS before fixation.
FM1-43 experiments on living cells
Neurons at 10 div were incubated for 1 h at 37°C, 5% CO2 in NB+ medium containing 100 nM SiR-actin (Spirochrome). Neurons were then incubated in an HBS medium for 10 min at 37°C. Following this incubation, the neurons were transferred to a live-cell imaging chamber (Life Imaging Services) containing HBS medium and placed at 37°C in the incubated chamber of an epifluorescence/TIRF microscope (Zeiss). HBS medium was then exchanged for HBS/KCL medium containing APV at 50 µM, CNQX at 25 µM, and FM1-43 (SynaptoGreen-C4; Biotium) at 5 µM for 180 s at 37°C. HBS/KCL medium was then changed back to HBS medium after three 1-min 30-s rinses with HBS medium. Neurons were then left to recover for 15 min in an HBS medium. Green (FM1-43) and far-red (SiR-actin) channel epifluorescence images were taken using a 40X objective for several fields of view selected for the presence of a number of beads induced. FM1-43 release was achieved following an additional 3-min incubation with HBS/KCl medium with APV/CNQX, followed by three rinses with HBS medium every 1 min 30 s, and 15 min recovery in HBS medium. After release, images of the same preselected fields of view were then acquired using the same settings as the post-loading images.
Immunocytochemistry and sample preparation
Neurons at 9–10 div were fixed and stained similarly to published procedures (Jimenez et al., 2020). Fixation used 4% PFA in PEM buffer (PIPES 80 mM, MgCl2 2 mM, EGTA 5 mM, pH 6.8) for 10 min at room temperature. After rinses in 0.1 M phosphate buffer (TpO4), neurons were blocked for 1 h in immunochemistry buffer (ICC: TpO4, gelatin 0.22%, Triton 0.1%) and incubated with primary antibodies diluted in ICC overnight at 4°C. Primary antibodies used are chicken anti-map2 (1:1,000, ab5392, RRID:AB_2138153; Abcam), mouse anti-ß2-spectrin (1:150, #612563, RRID:AB_399854; BD Bioscience), guinea pig anti-synaptophysin (1:400, 101 004, RRID:AB_1210382; Synaptic Systems), rabbit anti-synapsin (1:1,000, ab1543P, RRID:AB_90757; Merck), mouse anti-bassoon (1:200, clone SAP7F407, ab82958, RRID:AB_1860018; Abcam), mouse anti-vamp2 (1:200, clone 69.1, 104 211, RRID:AB_887811; Synaptic Systems), guinea pig anti-VGLUT (1:500, 135 304, RRID:AB_887878; Synaptics Systems), rabbit anti-VGAT (1:1,000, 131 003, RRID:AB_887869; Synaptic Systems), mouse anti-syntaxin1 (1:200, 110 011, RRID:AB_887844; Synaptic Systems), guinea pig anti-SV2A (1:300, 119 004, RRID:AB_10894884; Synaptic Systems), rabbit anti-munc13-1 (1:400, 126 103, RRID:AB_887733; Synaptic Systems), mouse anti-p34 Arc (1:300, 306 011, RRID:AB_887756; Synaptic Systems), rat anti-HA (1:200, clone 3F10, 11867423001, RRID:AB_390918; Roche), mouse anti-FLAG (1:500, clone M2, F3215, RRID:AB_259529; Sigma-Aldrich), and mouse anti-ALFA (1:200, N1582; Nanotag). After rinses in ICC, corresponding secondary antibodies conjugated to Alexa Fluor 488, 555, or 647 (Thermo Fisher Scientific), CF680 (Biotium), or DyLight 405 (Rockland) diluted in ICC (1:200–1:400) were incubated for 1 h at room temperature. Secondary antibodies were rinsed and neurons were incubated with Alexa Fluor 647-conjugated phalloidin (A2287, ∼500 nM in TpO4; Thermo Fisher Scientific), Alexa Fluor 647 Plus-conjugated phalloidin (A30107, ∼165 nM in TpO4; Thermo Fisher Scientific), or Atto 488-conjugated phalloidin (#AD488-81, ∼500 nM in TpO4; Atto-Tec) for 1 h 30 min at room temperature or overnight at 4°C. For epifluorescence imaging, coverslips were mounted in Prolong Glass containing fluorescent phalloidin (1:10 of the staining concentration). Alternatively, after the rinsing steps, stained coverslips were kept in PB + 0.02% sodium azide and fluorescent phalloidin at 4°C before STORM imaging.
CRISPR-mediated tagging of endogenous actin
A rat-optimized HiUGE methodology (Gao et al., 2019) was used to tag endogenous actin in cultured neurons. The necessary components were delivered via co-infection with three AAVs: gRNA, Cas9 protein (Mecp2-Cas9), and donor tag (Ogawa et al., 2023,Preprint). Different tags were designed and integrated into the donor plasmid to target in-frame fusion at the amino terminus of ß-actin, which is better tolerated than a carboxyterminal fusion (Nagasaki et al., 2017). Table S1 details the resulting DNA and amino-acid sequences after the insertion of the tags.
AAVs were produced by the NeuroTools facility (INT, Marseille) or using the following protocol: HEK 293T cells were plated in 12-well plates (200,000 cells/well in DMEM medium supplemented with 10% FBS). After 24 h, cells were transfected with the three AAV plasmids (see above), helper plasmid (Cat #240071; Agilent Technologies), and serotype PHP.S (plasmid #103006; Addgene, a gift from Viviana Gradinaru) using Lipofectamin 3000 (Invitrogen). The medium was exchanged the next day, reducing FBS concentration to 2%. 48 h later, cells were trypsinized and lysed in citrate lysis buffer (38 mM citric acid, 75 mM sodium citrate, 75 mM sodium chloride, and 100 mM magnesium chloride, pH 5). The cell lysate was centrifuged at 10,000 × g for 10 min and mixed with 10% vol/vol of 2 M Tris-HCl (pH 9.5). AAVs were titrated with a SYBR Green-qPCR procedure (Aurnhammer et al., 2012).
Hippocampal neurons were infected at 0 div: 3 h after plating at a density of 12,000 cells/cm2, the coverslips were transferred to the wells of a 12-well plate containing conditioned NB+ medium. Around 1×10⁹ particles of each of the three AAVs (Cas9, gRNA, and donor tag) were mixed in 100 μl conditioned NB+ medium and deposited dropwise in each well before returning the plate to 37°C, 5° CO2. 48 h later (2 div), the coverslips were transferred, cells down, to Petri dishes containing confluent glia cultures conditioned in NB+ medium. Neurons were cultured until 9 div before being fixed and stained for fluorescence microscopy.
Epifluorescence microscopy
Diffraction-limited epifluorescence images were obtained using an Axio-Observer upright microscope (Zeiss) equipped with a 40X NA 1.4 or 63X NA 1.4 objective and an Orca-Flash4.0 camera (Hamamatsu) controlled by Zen software (Zeiss). Appropriate hard-coated filters and dichroic mirrors were used for each fluorophore. A thin Z-stack of 3–10 slices spaced out by 0.2 µm was acquired to include the signal from all neuronal processes within the whole field of view. For illustrative images, image editing was performed using Fiji (Schindelin et al., 2012), and it included projection using the Extended Depth of Field plugin (Forster et al., 2004), linear contrast adjustment, and gamma adjustment (0.7–0.9) to highlight the faint actin labeling along axons. In the case of different treatment conditions labeled for the same targets, the contrast settings were kept constant for each channel across the different conditions/treatments.
SMLM: STORM and PAINT
For single-color SMLM, we used STORM. STORM was performed on an N-STORM microscope (Nikon Instruments). Stained coverslips were mounted in a silicone chamber filled with STORM buffer (Smart Buffer Kit; Abbelight). The N-STORM system uses an Agilent MLC-400B laser launch with 405 nm (50 mW maximum fiber output power), 488 nm (80 mW), 561 mW (80 mW), and 647 nm (125 mW) solid-state lasers, a 100X NA 1.49 objective, and an Ixon DU-897 camera (Andor). After locating an area with bead synapses using low-intensity illumination, a TIRF image was acquired, followed by a STORM acquisition. 30,000–60,000 images (256 × 256 pixels, 15 ms exposure time) were acquired at full 647 nm laser power. Reactivation of fluorophores was performed during acquisition by increasing illumination with the 405 nm laser. When imaging actin, 30 nM phalloidin-Alexa Fluor 647 was added to the STORM buffer to mitigate actin unbinding during imaging (Jimenez et al., 2020). For three-color SMLM (Fig. 7 A), we used STORM in combination with DNA-PAINT (Jimenez et al., 2020). Neurons were labeled using rabbit anti-synapsin and mouse anti-ß2-spectrin primary antibodies (see above), then anti-rabbit and anti-mouse secondary antibodies coupled to distinct PAINT DNA strands, as well as phalloidin-Alexa Fluor 647 for actin. Imaging was done sequentially, first for actin in STORM buffer (60,000 frames at 67 Hz), then for two immunostained proteins in PAINT buffer (0.1 M phosphate buffer saline, 500 mM NaCl, 5% dextran sulfate, pH 7.2) supplemented with 0.12–0.25 nM of PAINT imagers strands coupled to Atto565 and Atto650 (Metabion, two times 40,000 frames of alternating 561 and 647 nm excitation at 30 Hz). For single-color DNA-PAINT of 3ALFA-actin (Fig. 10, E and F), a custom nanobody conjugated with an F3 DNA-PAINT strand and an Alexa-488 fluorophore (1:200; Massive Photonics) was incubated together with the secondary antibodies for co-stained targets before being imaged using an Atto643-coupled imaging strand (0.1–1 nM) with 647 nm excitation for 100,000 frames at 30 Hz.
For 2D STORM and DNA-PAINT images, the N-STORM software (Nikon Instruments) was used for the localization of single fluorophore activations and corrected for drift using cross-correlation. For two-color PAINT acquisitions using alternating 561 and 647 nm excitation, lateral chromatic aberration correction was corrected within the N-STORM software using polynomial warping calibrated on sub-diffraction beads. The list of localizations was then exported as a text file. For 3D STORM and DNA-PAINT images, acquired stacks were processed using DECODE (Speiser et al., 2021). Briefly, the objective PSF was modeled using spline fitting in SMAP (Li et al., 2018) and used to simulate sequences of blinking events using characteristics (photon number range and lifetime distribution) inferred from real acquisition data from the N-STORM microscope. A Pytorch model was trained to infer the 3D coordinates and uncertainty of the simulated blinking events and then applied to the experimental acquired sequences (Speiser et al., 2021). The resulting localizations (fitted blinking events) were filtered based on uncertainty, and drift during acquisition was corrected in 3D using a redundant cross-correlation algorithm (Wang et al., 2014) implemented as an independent module of SMAP (Ries, 2020). After translation of the coordinate files obtained from N-STORM or DECODE/SMAP, image reconstructions were performed using the ThunderSTORM ImageJ plugin (Ovesný et al., 2014) in Fiji software. Custom scripts and macros were used to translate coordinate files, as well as automate image reconstruction for whole images at 16 nm/pixel and detailed zooms at 4 nm/pixel (https://github.com/cleterrier/ChriSTORM). For visualization of faint actin structures, the local contrast of monochrome (2D) or z-colored (3D) reconstructed images was enhanced using the Contrast Limited Adaptive Histogram Equalization (CLAHE) plugin.
For two-color STORM images (Fig. 8 E), a SAFe360 module (Abbelight) mounted on a Nikon Ti2 stand (Nikon), equipped with a LC4Cc laser combiner (Oxxius) and a 100X NA 1.49 objective, was used to perform spectral-demixing STORM (Friedl et al., 2023 Preprint). The sample, labeled for actin using Alexa Fluor 647 Plus-phalloidin and for Arp2/3 (p34 Arc) using a CF680-conjugated secondary antibody, was placed in STORM buffer and illuminated using a 640 nm laser (500 mW). Emitted fluorescence was split by a 700 nm dichroic toward two Flash v3 cameras (Hamamatsu). Separation of Alexa Fluor 647 and CF680 fluorescence was performed by demixing blinking events, resulting in two-channel coordinates files that were further processed and rendered using custom scripts and macros similar to single-color images (https://github.com/cleterrier/ChriSTORM).
Epifluorescence image analysis
Intensity quantifications were performed on the maximum projection of the raw data with no further adjustment (see below). Linear regions of interest (ROIs) were traced along an axon using the NeuronJ plugin in Fiji software, encompassing an axon–bead contact. Tracings were then translated into ImageJ ROIs. The ROI was then refined to the presynaptic cluster using the ProFitFeat script (available at https://github.com/cleterrier/Measure_ROIs/blob/master/Pro_Feat_Fit.js), restricting the ROI to the segment with an intensity above 50% of the maximum intensity point along the line ROI. The background-corrected intensities within these ROIs were then measured for each labeled channel. Induced presynapses were categorized as “actin-enriched” (A+) or “non-enriched” (A−) by visual inspection, comparing their actin staining level to neighboring axon shaft, as a simple threshold value was not adapted to local variation in actin staining. For natural synapses, ROIs were traced along the axon at axon–dendrite contacts where presynaptic proteins were visibly accumulated, and fluorescence intensities were measured for each labeled channel as described above.
STORM image analysis
To obtain the best STORM images with an interpretable pattern of actin staining, we carefully selected induced presynapses where the bead made a single “touch” contact on one side of a well-isolated, continuous axon. We avoided situations where the bead would deform the contacted axon, as well as axons crossing or bundling. We generated a high-magnification image (4 nm/pixel) for each bead-induced presynapse image. Actin structures present on the reconstructed image were scored as present, non-present, or not determined when their presence or absence could not be reliably determined by at least two experimenters in order to reduce bias (Fig. 7 C and Fig. 8 D). We used the following criteria to define the three types of presynaptic actin nanostructures:
- -
actin mesh: a small cluster of actin opposed to the bead contact and within the presynaptic marker cluster
- -
actin rails: linear structures within the presynaptic marker cluster
- -
actin corrals: large actin clusters at the periphery or just outside of the presynaptic marker cluster.
The size of the actin mesh and corrals (Fig. 7 D) was determined from manual outlines on 2D projection images in ImageJ.
Data presentation and statistical analysis
The Data S1 file recapitulates the statistics for all quantifications shown as graphs in the figures. Individual measurement points (number n) from independent experiments (number N) were pooled. All experiments were replicated between two- and eight-times using bead-seeded neurons from different cultures. Intensity profiles, graphs, and statistical analyses were generated using Prism. On bar graphs, dots (if present) are averages of each independent experiment, bars or horizontal lines represent the mean, and vertical lines are the SEM unless otherwise specified. Significances were tested using one-way, non-parametric ANOVA with Šídák post-hoc significance testing between selected conditions. All differences and variations mentioned in the text are significant unless specified as non-significant. In Data S1 and in figures, the results of the post-hoc significance are indicated as follows: ns or ns, non-significant; * or °, P < 0.05; ** or °°, P < 0.01; *** or °°°, P < 0.001.
Online supplemental material
Fig. S1 shows that postsynaptic actin impedes the visualization of presynaptic content and organization in hippocampal neurons, even using state-of-the-art super-resolution microscopy. Fig. S2 shows optical methods to assess vesicular cycling at bead-induced presynapses. Fig. S3 shows that presynapses induced 48 h after seeding more mature, 14-div neurons have a similar proportion of actin enrichment and with similar presynaptic content. Fig. S4 shows that presynapses induced for 48 and 96 h have a similar proportion of actin enrichment with similar presynaptic content. Fig. S5 shows that bead-induced inhibitory and excitatory presynapses have similar actin and presynaptic component content distribution. Fig. S6 shows that induced presynapses are similar to natural presynapses between 48 and 96 h after bead seeding and between inhibitory and excitatory presynapses; and that acute actin perturbation effect on the accumulation of presynaptic components is similar at natural synapses and induced presynapses. Fig. S7 shows that acute actin nucleators’ inhibition effect on the accumulation of presynaptic components is similar at natural synapses and induced presynapses; and that effect of CK666 on additional presynaptic components. Table S1 shows sequences of the inserted tags for endogenous tagging of rat ß-actin. Data S1 shows a spreadsheet file containing the statistics (mean, SEM, number of points, number of independent experiments, significance tests) for all values shown in figures and supplementary figures.
Data availability
The data are available from the corresponding authors upon reasonable request.
Acknowledgments
We would like to thank the Neuro-Cellular Imaging Service and Nikon Center for Neuro-NanoImaging at INP, funded by CPER-FEDER (PlateForme NeuroTimone PA0014842), the Fédération pour la Recherche sur le Cerveau (AOE 16 “Espoir en tête” 2021), and the Institut Marseille Imaging (A*MIDEX, AMX-19-IET-002). We also thank the NeuroVir facility at the Timone Neuroscience Institute (CNRS-AMU UMR 7289) for AAV production. We would like to thank Subhojit Roy for insightful discussions, Archan Ganguly for the initial help in setting up the bead-induced presynapse model, and Javier De Felipe for pointers on the total number of synapses in the brain.
This work has received support from the Centre National de la Recherche Scientifique ATIP program (AO 2016 to C. Leterrier), Fondation pour la Recherche Médicale (EQ202103012966 to C. Leterrier), A*MIDEX (ICN PhD Program, ANR-11-IDEX-0001-02 grant) funded by the French Government “Investissements d’Avenir” program (Pépinière to M.-J. Papandréou, NeuroSchool PhD program to D. Bingham, Master funding to D.M. van Bommel), and the Institut NeuroMarseille (A*MIDEX, AMX-19-IET-002).
Author contributions: Conceptualization: M.-J. Papandréou and C. Leterrier. Data curation: D. Bingham and C. Leterrier. Formal analysis: D. Bingham, C.E. Jakobs, F. Wernert, M.-J. Papandréou, and C. Leterrier. Funding acquisition: M.-J. Papandréou and C. Leterrier. Investigation: D. Bingham, C.E. Jakobs, F. Boroni-Rueda, N. Jullien, E. Schentarra, K. Friedl, J. Da Costa Moura, D.M. van Bommel, G. Caillol, M.-J. Papandréou, and C. Leterrier. Methodology: D. Bingham, C.E. Jakobs, F. Boroni-Rueda, N. Jullien, E. Schentarra, K. Friedl, J. Da Costa Moura, D.M. van Bommel, G. Caillol, Y. Ogawa, M.-J. Papandréou, and C. Leterrier. Project administration: M.-J. Papandréou and C. Leterrier. Resources: Y. Ogawa. Software: C. Leterrier. Supervision: M.-J. Papandréou and C. Leterrier. Visualization: D. Bingham, C.E. Jakobs, F. Wernert, E. Schentarra, K. Fried, M.-J. Papandréou, and C. Leterrier. Writing—original draft: C. Leterrier. Writing—review and editing: D. Bingham, C.E. Jakobs, F. Wernert, N. Jullien, E. Schentarra, K. Friedl, D.M. van Bommel, M.-J. Papandréou, and C. Leterrier.
References
Author notes
Disclosures: All authors have completed and submitted the ICMJE Form for Disclosure of Potential Conflicts of Interest. K. Friedl reported “Employee of Abbelight.” No other disclosures were reported.


