


Contact inhibition of locomotion (CIL) is a process that regulates cell motility upon collision with other cells. Improper regulation of CIL has been implicated in cancer cell dissemination. Here, we identify the cell adhesion molecule JAM-A as a central regulator of CIL in tumor cells. JAM-A is part of a multimolecular signaling complex in which tetraspanins CD9 and CD81 link JAM-A to αvβ5 integrin. JAM-A binds Csk and inhibits the activity of αvβ5 integrin-associated Src. Loss of JAM-A results in increased activities of downstream effectors of Src, including Erk1/2, Abi1, and paxillin, as well as increased activity of Rac1 at cell–cell contact sites. As a consequence, JAM-A-depleted cells show increased motility, have a higher cell–matrix turnover, and fail to halt migration when colliding with other cells. We also find that proper regulation of CIL depends on αvβ5 integrin engagement. Our findings identify a molecular mechanism that regulates CIL in tumor cells and have implications on tumor cell dissemination.
Introduction
Enhanced cell proliferation, motility, and invasion are central hallmarks of cancer (Hanahan and Weinberg, 2011). In normal epithelial tissues, these cellular activities are limited by cell–cell interaction, a phenomenon referred to as contact inhibition (Ribatti, 2017), either contact inhibition of proliferation or contact inhibition of locomotion (CIL). Contact inhibition of proliferation is mediated mainly by cell adhesion receptors located at adherens junctions (AJ) and tight junctions (TJ), such as E-cadherin, cell polarity protein Crumbs homolog 3 (CRB3), and protocadherins, which downregulate proliferation by stimulating Hippo-YAP signaling and by inhibiting growth factor signaling (Gumbiner and Kim, 2014; McClatchey and Yap, 2012). CIL, originally defined as “the prohibition, when contact between cells occurred, of continued movement such as would carry one cell over the surface of another” (Abercrombie, 1970; Abercrombie and Heaysman, 1954; Stramer and Mayor, 2016), is less well understood at the molecular level.
CIL has different functions during development and homeostasis. During embryonic development, CIL regulates the precise dispersion of cells in the developing organism (Carmona-Fontaine et al., 2008; Davis et al., 2015; Villar-Cervino et al., 2013). In the adult organism, CIL regulates wound healing and prevents cell overgrowth and invasive cell behavior (Astin et al., 2010). At the cellular level, CIL can be divided into several discrete stages, which include (1) initial cell–cell contact formation; (2) inhibition of protrusive activity, lamellipodial collapse, and contraction at the cell–cell contact site; (3) repolarization and formation of new protrusions; and (4) cell separation and migration in new directions (Roycroft and Mayor, 2016). Not all of these four steps are essential for CIL responses. While the regulation of cell dispersion in the embryo involves all four steps and is characterized by an active movement of cells away from their colliding partner (Type I CIL), the formation of new epithelial tissues, for example, during wound healing, involves only steps 1 and 2 and is characterized by a cessation of the movement and formation of stable cell–cell contacts (Type II CIL; Abercrombie, 1970; Carter, 1967; Stramer and Mayor, 2016).
Cell–cell adhesion receptors are localized at key positions to regulate CIL in response to initial cell–cell adhesion. Studies in myoblasts indicated that N-cadherin cooperates with α5 integrin to regulate cell migration and motility upon cell–cell contact formation (Huttenlocher et al., 1998). Neural crest cells switch cadherin expression from E-cadherin to N-cadherin, which prevents E-cadherin-driven formation of cell–cell contact-stabilizing protrusions and promotes the development of cellular forces that pull junctions apart to allow cell separation (Scarpa et al., 2015). N-cadherin further promotes cell separation and migration in new directions by weakening the cell–matrix adhesion at the sites of cell–cell contacts through the activation of Src kinase (Roycroft and Mayor, 2018). Recent studies in fibroblasts further confirmed the requirement of cadherins in the regulation of CIL (Singh et al., 2021).
Junctional adhesion molecule (JAM)-A is a member of the JAM family of cell adhesion molecules (Ebnet, 2017; Martin-Padura et al., 1998). cis-dimerization is a prerequisite for trans-homophilic interaction, which regulates JAM-A clustering at intercellular junctions (Steinbacher et al., 2018). Studies implicating JAM-A in tumor formation indicate that its contribution to tumor formation is tumor context-dependent (Czubak-Prowizor et al., 2021; Lauko et al., 2020). In this study, we have addressed the role of JAM-A in MCF7 cells, a human mammary gland-derived epithelial cancer cell line, with the characteristics of differentiated mammary epithelium (Lee et al., 2015). We find that the absence of JAM-A results in a severely impaired CIL response when cells collide. JAM-A-depleted cells show increased activities of critical regulators of protrusive activity, including Src, Erk1/2, and Abi1, and are unable to downregulate Rac1 when contacting other cells. JAM-A is part of a tetraspanin (Tspan)-based multimolecular signaling complex, in which Tspans CD9 and CD81 connect JAM-A to αvβ5 integrin, thus allowing the inhibition of αvβ5 integrin-associated Src by JAM-A-bound Csk. Our findings identify a novel mechanism that regulates CIL in tumor cells.
Results
JAM-A regulates contact inhibition of locomotion
To analyze the contribution of JAM-A to the process of cell–cell contact formation, we co-cultured JAM-A-depleted MCF7 cells with wildtype MCF7 cells at a low confluency on vitronectin (VN)-coated tissue culture dishes and analyzed cell clusters by immunofluorescence (IF) microscopy. JAM-A knockdown cells were frequently localized on top or beneath WT MCF7 cells (Fig. 1 A). Similarly, HEK293T cells, expressing a dominant-negative mutant of JAM-A (JAM-A E61R/K63E), frequently migrated across non-transfected cells (Fig. 1 B). These observations suggested that JAM-A is required to stop migration when cells form initial cell–cell contacts. We also observed that EGFP-JAM-A localizes to dynamic protrusions in both MCF7 cells (Fig. 1 C and Video 1) and HEK293T cells (Video 2), and that endogenous JAM-A co-localizes with αvβ5 integrin, focal adhesion kinase (FAK), and Src at membrane ruffle-like protrusions in migrating MCF7 cells (Fig. 1, D and E). These findings suggested that JAM-A is localized at membrane protrusions in migrating cells to halt cell migration in response to cell–cell interactions.

JAM-A prevents cell overgrowth and localizes to cellular protrusions. (A) Control MCF7 cells (pLVTHM, EGFP-positive) or JAM-A KD MCF7 cells (pLVTHM-JAM-A shRNA, EGFP-positive) were co-cultured with non-transfected MCF7 cells. Samples were stained for JAM-A. Right panels: Quantification of cellular overlap between Ctrl KD or JAM-A KD MCF7 cells (EGFP-positive) and WT MCF7 cells (LifeAct-mCherry-positive). Cell overlaps are depicted as pixels present in the area of overlap (Imaris software). Left diagram: JAM-A shRNA (number of analyzed contacts: n = 208 for Ctrl MCF7, n = 280 for JAM-A shRNA KD MCF7; three independent experiments). Right diagram: JAM-A siRNA pool (n = 166 for control siRNA pool, n = 196 for JAM-A siRNA pool; four independent experiments). (B) HEK293T cells transfected with WT JAM-A (Flag-JAM-A WT) or a dimerization mutant of JAM-A (Flag-JAM-A ER/KE) were co-cultured with untransfected HEK293T cells and stained with antibodies against Flag (green) and JAM-A (red). Collision events were divided into three categories: no overlap (coverage <10%), moderate overlap (coverage 10–50%), and strong overlap (coverage >50%). Number of events: n = 133 for Flag-JAM-A WT, n = 150 for Flag-JAM-A ER/KE. Data was obtained from three independent experiments. Frequency distributions were compared using a Chi-Square test. ****, P < 0.0001. Scale bars: 10 µm. (C) EGFP-JAM-A-expressing MCF7 cells were analyzed by live microscopy. Arrowheads indicate enrichment of JAM-A at protruding membranes. Scale bar: 10 µm. (D) Collectively migrating MCF7 cells were stained for αvβ5 integrin and JAM-A (top), or FAK and JAM-A (bottom). Arrowheads indicate co-localization of JAM-A with αvβ5 integrin (top) and FAK (bottom) at cell protrusions. Scale bars: 10 µm. (E) MCF7 cells were co-stained for αvβ5 integrin, JAM-A, and F-Actin (top), or for Src, JAM-A, and F-actin (bottom). Arrowheads indicate co-localization of JAM-A with αvβ5 integrin (top) and Src (bottom) at cell protrusions. Scale bars: 5 µm.
JAM-A prevents cell overgrowth and localizes to cellular protrusions. (A) Control MCF7 cells (pLVTHM, EGFP-positive) or JAM-A KD MCF7 cells (pLVTHM-JAM-A shRNA, EGFP-positive) were co-cultured with non-transfected MCF7 cells. Samples were stained for JAM-A. Right panels: Quantification of cellular overlap between Ctrl KD or JAM-A KD MCF7 cells (EGFP-positive) and WT MCF7 cells (LifeAct-mCherry-positive). Cell overlaps are depicted as pixels present in the area of overlap (Imaris software). Left diagram: JAM-A shRNA (number of analyzed contacts: n = 208 for Ctrl MCF7, n = 280 for JAM-A shRNA KD MCF7; three independent experiments). Right diagram: JAM-A siRNA pool (n = 166 for control siRNA pool, n = 196 for JAM-A siRNA pool; four independent experiments). (B) HEK293T cells transfected with WT JAM-A (Flag-JAM-A WT) or a dimerization mutant of JAM-A (Flag-JAM-A ER/KE) were co-cultured with untransfected HEK293T cells and stained with antibodies against Flag (green) and JAM-A (red). Collision events were divided into three categories: no overlap (coverage <10%), moderate overlap (coverage 10–50%), and strong overlap (coverage >50%). Number of events: n = 133 for Flag-JAM-A WT, n = 150 for Flag-JAM-A ER/KE. Data was obtained from three independent experiments. Frequency distributions were compared using a Chi-Square test. ****, P < 0.0001. Scale bars: 10 µm. (C) EGFP-JAM-A-expressing MCF7 cells were analyzed by live microscopy. Arrowheads indicate enrichment of JAM-A at protruding membranes. Scale bar: 10 µm. (D) Collectively migrating MCF7 cells were stained for αvβ5 integrin and JAM-A (top), or FAK and JAM-A (bottom). Arrowheads indicate co-localization of JAM-A with αvβ5 integrin (top) and FAK (bottom) at cell protrusions. Scale bars: 10 µm. (E) MCF7 cells were co-stained for αvβ5 integrin, JAM-A, and F-Actin (top), or for Src, JAM-A, and F-actin (bottom). Arrowheads indicate co-localization of JAM-A with αvβ5 integrin (top) and Src (bottom) at cell protrusions. Scale bars: 5 µm.
JAM-A localizes to membrane protrusions in MCF7 cells. Confocal laser scanning microscopy time lapse movie of MCF7 cells expressing JAM-A/EGFP. Z-stacks were taken every minute over a time period of 10 min. Note the accumulation of JAM-A/EGFP in ruffle-like membrane protrusions. Scale bar: 10 µm.
JAM-A localizes to membrane protrusions in MCF7 cells. Confocal laser scanning microscopy time lapse movie of MCF7 cells expressing JAM-A/EGFP. Z-stacks were taken every minute over a time period of 10 min. Note the accumulation of JAM-A/EGFP in ruffle-like membrane protrusions. Scale bar: 10 µm.
JAM-A localizes to membrane protrusions in HEK293T cells. Confocal laser scanning microscopy time lapse movie of Hek293T cells expressing JAM-A/EGFP. Z-stacks were taken every 2 min over a time period of 54 min. Note the accumulation of JAM-A/EGFP in ruffle-like protrusions. Scale bar: 10 µm.
JAM-A localizes to membrane protrusions in HEK293T cells. Confocal laser scanning microscopy time lapse movie of Hek293T cells expressing JAM-A/EGFP. Z-stacks were taken every 2 min over a time period of 54 min. Note the accumulation of JAM-A/EGFP in ruffle-like protrusions. Scale bar: 10 µm.
We next performed one-dimensional (1D) kinematic assays (Scarpa et al., 2013). JAM-A knockdown MCF7 cells were co-cultured with MCF7 WT cells on VN-coated stripes of 5 µm, which promotes cell collisions (Fig. 2 A). Cellular behavior after collisions was divided into four distinct categories. Type −2: repolarization and migration in the opposite direction (Video 3); type −1: anergic behavior, i.e., cessation of migration without repolarization or junction formation (Video 4); type 0: stable junction formation (Video 5); and type +1: continuous migration across the collided cell (Video 6; Fig. 2 A; see also Stramer and Mayor, 2016). The fraction of type +1 CIL behavior increased from about 10% (11.2 ± 4.7%) of collisions between control and MCF7 WT cells (Ctrl–WT collisions) to more than 60% (65.6 ± 2.7%) of collisions between JAM-A KD and MCF7 WT cells (JAM-A KD–WT collisions; Fig. 2 B). The fraction of type +1 CIL behavior did not further increase when both colliding cells were depleted for JAM-A (JAM-A KD–JAM-A KD collisions, 51.7 ± 3.0%; Fig. 2 B). These findings indicated that JAM-A halts cell migration when cells collide with other cells. They also indicated that this role depends on its trans-homophilic activity. Depletion of JAM-A did not affect cell–cell contact formation per se, as indicated by normal E-cadherin-positive puncta in cells undergoing contact formation (Fig. 2 C). We also performed 1D kinematic assays with MDA-MB-231 cells, a more aggressive breast cancer-derived cell line with tumorigenic properties (Price et al., 1990). As observed for MCF7 cells, the fraction of type +1 CIL behavior significantly increased after JAM-A depletion (16.2 ± 3.7% vs. 40.0 ± 2.7% in control vs. JAM-A KD collisions, respectively, Fig. 2 D), indicating that JAM-A-mediated inhibition of cell migration upon cell collisions operates in tumor cells with higher tumorigenic potential as well.

JAM-A regulates CIL. (A) 1D kinematic CIL assays. Ctrl KD MCF7 or JAM-A KD MCF7 cells (EGFP-positive) were co-cultured with WT MCF7 (LifeAct-mCherry-positive) on linear micropatterns (width: 5 µm) and observed by live microscopy for 15 h. Cartoons: Types of CIL behavior after cell–cell collision: opposite migration (Type −2), anergy (Type −1), cell–cell contact formation (Type 0), and continuous migration (Type +1). Bottom panels: Still images of movies representative of different CIL behavior. (B) Quantification of CIL types after cell collisions of scrambled shRNA-expressing MCF7 cells (Ctrl KD) and JAM-A shRNA-expressing MCF7 cells (JAM-A KD). Number of collisions: n = 113 for Ctrl KD–WT (four independent experiments), n = 56 for JAM-A KD–WT (four independent experiments), n = 88 for JAM-A KD—JAM-A KD (3 independent experiments). (C) Early cell–cell contact formation in JAM-A-depleted MCF7 cells. MCF7 cells with doxycycline-inducible KD of JAM-A (pEmU6proT plasmid; shRNA expression off (Ctrl KD), shRNA expression on (JAM-A KD) were fixed during early cell–cell contact formation. Arrowheads indicate sites of E-cadherin-positive puncta. Scale bars: 5 µm. (D) MDA-MB-231 cell collision assays of scrambled shRNA-expressing cells (Ctrl KD) or JAM-A shRNA-expressing cells (JAM-A KD) with wild-type cells (WT). Number of collisions: n = 73 for Ctrl KD–WT, n = 50 for JAM-A KD—WT (three independent experiments). (E) MCF7 cell collision assays of scrambled shRNA-expressing cells (Ctrl KD) or JAM-A shRNA-expressing cells (JAM-A KD) on laminin (LN) (n = 90 for Ctrl KD–WT, n = 157 for JAM-A KD–WT, four independent experiments) and fibronectin (FN) (n = 118 for Ctrl KD–WT, n = 143 for JAM-A KD—WT, four independent experiments). Symbols above horizontal bars represent comparisons with VN-cultured MCF7 cells shown in Fig. 2 B. (F) Mixing assays of MCF7 cells. Ctrl KD: pEmU6proT plasmid; − dox: shRNA expression off. JAM-A KD: pEmU6proT plasmid; + dox: shRNA expression on. Cells co-express either LifeAct-EGFP or LifeAct-mCherry as indicated. Left: Fluorescence images of cell collectives (top), and binary images highlighting areas of overlap between colliding leader cells (bottom). Right: Quantification of the areas of overlap. Data is derived from four independent experiments. Scale bars: 10 µm. All statistical analyses were performed with unpaired Student’s t test. Data are presented as mean values ± SD. NS, not significant; *, P < 0.05; **, P < 0.01; ***, P < 0.001; ****, P < 0.0001.
JAM-A regulates CIL. (A) 1D kinematic CIL assays. Ctrl KD MCF7 or JAM-A KD MCF7 cells (EGFP-positive) were co-cultured with WT MCF7 (LifeAct-mCherry-positive) on linear micropatterns (width: 5 µm) and observed by live microscopy for 15 h. Cartoons: Types of CIL behavior after cell–cell collision: opposite migration (Type −2), anergy (Type −1), cell–cell contact formation (Type 0), and continuous migration (Type +1). Bottom panels: Still images of movies representative of different CIL behavior. (B) Quantification of CIL types after cell collisions of scrambled shRNA-expressing MCF7 cells (Ctrl KD) and JAM-A shRNA-expressing MCF7 cells (JAM-A KD). Number of collisions: n = 113 for Ctrl KD–WT (four independent experiments), n = 56 for JAM-A KD–WT (four independent experiments), n = 88 for JAM-A KD—JAM-A KD (3 independent experiments). (C) Early cell–cell contact formation in JAM-A-depleted MCF7 cells. MCF7 cells with doxycycline-inducible KD of JAM-A (pEmU6proT plasmid; shRNA expression off (Ctrl KD), shRNA expression on (JAM-A KD) were fixed during early cell–cell contact formation. Arrowheads indicate sites of E-cadherin-positive puncta. Scale bars: 5 µm. (D) MDA-MB-231 cell collision assays of scrambled shRNA-expressing cells (Ctrl KD) or JAM-A shRNA-expressing cells (JAM-A KD) with wild-type cells (WT). Number of collisions: n = 73 for Ctrl KD–WT, n = 50 for JAM-A KD—WT (three independent experiments). (E) MCF7 cell collision assays of scrambled shRNA-expressing cells (Ctrl KD) or JAM-A shRNA-expressing cells (JAM-A KD) on laminin (LN) (n = 90 for Ctrl KD–WT, n = 157 for JAM-A KD–WT, four independent experiments) and fibronectin (FN) (n = 118 for Ctrl KD–WT, n = 143 for JAM-A KD—WT, four independent experiments). Symbols above horizontal bars represent comparisons with VN-cultured MCF7 cells shown in Fig. 2 B. (F) Mixing assays of MCF7 cells. Ctrl KD: pEmU6proT plasmid; − dox: shRNA expression off. JAM-A KD: pEmU6proT plasmid; + dox: shRNA expression on. Cells co-express either LifeAct-EGFP or LifeAct-mCherry as indicated. Left: Fluorescence images of cell collectives (top), and binary images highlighting areas of overlap between colliding leader cells (bottom). Right: Quantification of the areas of overlap. Data is derived from four independent experiments. Scale bars: 10 µm. All statistical analyses were performed with unpaired Student’s t test. Data are presented as mean values ± SD. NS, not significant; *, P < 0.05; **, P < 0.01; ***, P < 0.001; ****, P < 0.0001.
MCF7 CIL behavior Type −2 (Opposite Migration). Confocal laser scanning microscopy time lapse movie of MCF7 cells stably transfected with EGFP-expressing control vector (green) mixed with LifeAct-mCherry-expressing WT MCF7 cells (red). Cells were seeded on vitronectin-coated linear micropatterns. Z-stacks were taken every 10 min over a time period of 15 h. Note the repolarization and opposite migration of the EGFP-expressing cell after initial contact with the LifeAct-mCherry-expressing cell.
MCF7 CIL behavior Type −2 (Opposite Migration). Confocal laser scanning microscopy time lapse movie of MCF7 cells stably transfected with EGFP-expressing control vector (green) mixed with LifeAct-mCherry-expressing WT MCF7 cells (red). Cells were seeded on vitronectin-coated linear micropatterns. Z-stacks were taken every 10 min over a time period of 15 h. Note the repolarization and opposite migration of the EGFP-expressing cell after initial contact with the LifeAct-mCherry-expressing cell.
MCF7 CIL behavior Type −1 (Anergy). Confocal laser scanning microscopy time lapse movie of MCF7 cells stably transfected with EGFP-expressing control vector (green) mixed with LifeAct-mCherry-expressing WT MCF7 cells (red). Cells were seeded on vitronectin-coated linear micropatterns. Z-stacks were taken every 10 min over a time period of 15 h. Note that the EGFP-expressing cell does not show any reaction after contact with the LifeAct-mCherry-expressing cell.
MCF7 CIL behavior Type −1 (Anergy). Confocal laser scanning microscopy time lapse movie of MCF7 cells stably transfected with EGFP-expressing control vector (green) mixed with LifeAct-mCherry-expressing WT MCF7 cells (red). Cells were seeded on vitronectin-coated linear micropatterns. Z-stacks were taken every 10 min over a time period of 15 h. Note that the EGFP-expressing cell does not show any reaction after contact with the LifeAct-mCherry-expressing cell.
MCF7 CIL behavior Type 0 (Contact Formation). Confocal laser scanning microscopy time lapse movie of MCF7 cells stably transfected with EGFP-expressing control vector (green) mixed with LifeAct-mCherry-expressing WT MCF7 cells (red). Cells were seeded on vitronectin-coated linear micropatterns. Z-stacks were taken every 10 min over a time period of 15 h. Note that the EGFP-expressing cell stays in contact with the LifeAct-mCherry-expressing cell.
MCF7 CIL behavior Type 0 (Contact Formation). Confocal laser scanning microscopy time lapse movie of MCF7 cells stably transfected with EGFP-expressing control vector (green) mixed with LifeAct-mCherry-expressing WT MCF7 cells (red). Cells were seeded on vitronectin-coated linear micropatterns. Z-stacks were taken every 10 min over a time period of 15 h. Note that the EGFP-expressing cell stays in contact with the LifeAct-mCherry-expressing cell.
MCF7 CIL behavior Type +1 (Continuous Migration). Confocal laser scanning microscopy time lapse movie of MCF7 cells stably transfected with EGFP- and JAM-A shRNA-expressing vector (green) mixed with LifeAct-mCherry-expressing WT MCF7 cells (red). Cells were seeded on vitronectin-coated linear micropatterns. Z-stacks were taken every 10 min over a time period of 15 h. Note that the EGFP-expressing JAM-A KD cell overgrows the LifeAct-mCherry-expressing cell after initial contact.
MCF7 CIL behavior Type +1 (Continuous Migration). Confocal laser scanning microscopy time lapse movie of MCF7 cells stably transfected with EGFP- and JAM-A shRNA-expressing vector (green) mixed with LifeAct-mCherry-expressing WT MCF7 cells (red). Cells were seeded on vitronectin-coated linear micropatterns. Z-stacks were taken every 10 min over a time period of 15 h. Note that the EGFP-expressing JAM-A KD cell overgrows the LifeAct-mCherry-expressing cell after initial contact.
To test if the regulation of CIL by JAM-A occurs specifically on VN, we performed 1D kinematic assays on laminin (LN) and fibronectin (FN). Surprisingly, normal MCF7 cells showed a priori a high incidence of a defective CIL response on both substrates, i.e., impaired contact formation and increased continuous migration (Fig. 2 E). Depletion of JAM-A did not further enhance the lack-of-CIL response observed in normal MCF7 cells (Fig. 2 E). These findings revealed a central role of VN in the regulation of CIL, and they also suggested specific cooperation of JAM-A with a VN-binding integrin.
To test if JAM-A regulates CIL also in the colliding sheets of migrating cells, we performed mixing-assays, in which the leader cells at the front of a group of collectively migrating cells collide with the leader cells of another group migrating in the opposite direction (Scarpa et al., 2013). JAM-A KD–WT collisions as well as JAM-A KD–JAM-A KD collisions resulted in significantly larger areas of overlap at the collision zones than Ctrl–WT collisions (Fig. 2 F), indicating that JAM-A regulates CIL also during collisions between the sheets of collectively migrating cells.
When we analyzed the CIL behavior of 1D-cultured cells in more detail, we observed that in the majority of CIL type +1 cases the JAM-A KD cells migrated across the MCF7 WT cells (Fig. 3 A). In addition, JAM-A KD cells showed increased displacement along the micropatterned tracks as well as increased migration velocities (Fig. 3 B). Similar to cells grown on linear micropatterns, cells grown under 2D culture conditions showed increased motilities after JAM-A depletion (Fig. 3 C), as well as a similar specificity for VN (Fig. 3 D). Since changes in cell motility are frequently associated with changes in cellular stiffness (Luo et al., 2016), we performed atomic force microscopy (AFM) on single MCF7 cells. We observed that JAM-A depletion increased the stiffness of MCF7 cells (Fig. 3 E). These observations indicated that JAM-A not only regulates CIL in response to cell–cell contact formation, but also cellular motility and cellular stiffness in a cell-autonomous manner.

JAM-A limits cell motility in single cells. (A) Positioning of cells in CIL type +1 events observed after collisions of JAM-A KD MCF7 cells (pLVTHM JAM-A shRNA) with MCF7 WT cells. Cells were cultured on VN-coated linear micropatterns (5 µm width). Number of collisions analyzed: n = 68 (six independent experiments). (B) Quantification of displacement (left panel) and migration velocity (right panel) of single cells cultured on VN-coated linear micropatterns (5 µm width). Analysis was performed using the TrackMate Plugin for ImageJ software. Number of cells analyzed: n = 67 for MCF7 WT cells, n = 64 for JAM-A KD cells (three independent experiments). (C) Quantification of mean velocity, directionality and motility coefficient of single cells cultured on 2D areas of VN-coated micropatterns. Number of cells analyzed: n = 105 for control MCF7 cells (JAM-A shRNA not induced, Ctrl MCF7), n = 112 for JAM-A KD cells (JAM-A shRNA induced, JAM-A KD MCF7; five independent experiments). (D) Quantification of mean velocity of single cells cultured on 2D areas of LN-coated and FN-coated micropatterns. Number of cells analyzed: LN: n = 59 for control MCF7 cells (JAM-A shRNA not induced, Ctrl MCF7), n = 74 for JAM-A KD cells (JAM-A shRNA induced, JAM-A KD MCF7; three independent experiments). FN: n = 67 for control MCF7 cells, n = 78 for JAM-A KD cells (three independent experiments). (E) Analysis of cellular stiffness by AFM. Data is expressed as Relative Young’s Modulus (left panel, n = 522 for ctrl cells, pLVTHM-EGFP control vector, n = 516 for JAM-A KD cells, pLVTHM JAM-A shRNA vector, three independent experiments), and as peak adhesion force (right panel, n = 571 for ctrl cells, n = 578 for JAM-A KD cells, three independent experiments). Statistical analysis was performed using Wilcoxon Signed Rank Test. ****, P < 0.0001. Unless stated otherwise, all statistical analyses were performed with unpaired Student’s t test. Data are presented as mean values ± SD. NS, not significant; *, P < 0.05; **, P < 0.01; ****, P < 0.0001.
JAM-A limits cell motility in single cells. (A) Positioning of cells in CIL type +1 events observed after collisions of JAM-A KD MCF7 cells (pLVTHM JAM-A shRNA) with MCF7 WT cells. Cells were cultured on VN-coated linear micropatterns (5 µm width). Number of collisions analyzed: n = 68 (six independent experiments). (B) Quantification of displacement (left panel) and migration velocity (right panel) of single cells cultured on VN-coated linear micropatterns (5 µm width). Analysis was performed using the TrackMate Plugin for ImageJ software. Number of cells analyzed: n = 67 for MCF7 WT cells, n = 64 for JAM-A KD cells (three independent experiments). (C) Quantification of mean velocity, directionality and motility coefficient of single cells cultured on 2D areas of VN-coated micropatterns. Number of cells analyzed: n = 105 for control MCF7 cells (JAM-A shRNA not induced, Ctrl MCF7), n = 112 for JAM-A KD cells (JAM-A shRNA induced, JAM-A KD MCF7; five independent experiments). (D) Quantification of mean velocity of single cells cultured on 2D areas of LN-coated and FN-coated micropatterns. Number of cells analyzed: LN: n = 59 for control MCF7 cells (JAM-A shRNA not induced, Ctrl MCF7), n = 74 for JAM-A KD cells (JAM-A shRNA induced, JAM-A KD MCF7; three independent experiments). FN: n = 67 for control MCF7 cells, n = 78 for JAM-A KD cells (three independent experiments). (E) Analysis of cellular stiffness by AFM. Data is expressed as Relative Young’s Modulus (left panel, n = 522 for ctrl cells, pLVTHM-EGFP control vector, n = 516 for JAM-A KD cells, pLVTHM JAM-A shRNA vector, three independent experiments), and as peak adhesion force (right panel, n = 571 for ctrl cells, n = 578 for JAM-A KD cells, three independent experiments). Statistical analysis was performed using Wilcoxon Signed Rank Test. ****, P < 0.0001. Unless stated otherwise, all statistical analyses were performed with unpaired Student’s t test. Data are presented as mean values ± SD. NS, not significant; *, P < 0.05; **, P < 0.01; ****, P < 0.0001.
JAM-A is associated with αvβ5 integrin and limits the activities of the Src-FAK and MEK-ERK1/2 pathways
The VN-dependent regulation of CIL by JAM-A suggested cross talk between JAM-A and a VN-binding integrin. Among the two VN-binding integrins implicated in cancer, i.e., αvβ3 and αvβ5 (Weis and Cheresh, 2011), the MCF7 cells only express αvβ5 integrin (Goodman et al., 2012).
By immunoprecipitation, we found that JAM-A is associated with αvβ5 integrin (Fig. 4 A) and also with CD9 (Fig. 4 B), a Tspan that links JAM-A to αvβ3 integrin in endothelial cells (Peddibhotla et al., 2013). All binary interactions between JAM-A, αvβ5 integrin, and CD9 were detectable by co-immunoprecipitation (CoIP) in the presence of detergents that retain Tspan-based interactions, i.e., Brij97 and/or Brij98 (Charrin et al., 2009; Fig. S1 A). These findings suggested that JAM-A, CD9, and αvβ5 integrin exist in a Tspan-enriched microdomain (TEM), which act as signaling platforms in a variety of contexts (Levy and Shoham, 2005; Yanez-Mo et al., 2009; Hemler, 2014).

JAM-A interacts with CD9, αvβ5 integrin, and c-Src, and suppresses the activities of the Src-FAK and MEK-ERK1/2 pathways. (A) CoIP of αvβ5 integrin with JAM-A. (B) CoIP of CD9 with JAM-A. (C) CoIP of Src with JAM-A. Src association with JAM-A is only detectable in Brij98 lysates. Quantification of Western blot signals is shown in Fig. S2 A. (D) CoIP of Src with CD9. (E) CoIP of αvβ5 integrin with Src. (F) CD9 immunoprecipitates from control MCF7 cells (MCF7-pLVTHM, left panel) or JAM-A-depleted cells (MCF7-pLVTHM-JAM-A shRNA, right panel) were immunoblotted for Tyr530-phosphorylated Src (80% of input, top panels). Note that high Src activity is reflected by low P-Tyr530 immunoreactivity. About 10% of the precipitated material was immunoblotted for total Src and for CD9. Data are representative of three independent experiments. Quantifications of Western blot signals are shown in Fig. S2 B. (G) Lysates of control MCF7 cells or JAM-A KD MCF7 cells were immunoblotted for P-Thr202/P-Tyr204 ERK1/2 or total ERK1/2. Data is representative of three independent experiments. Quantifications of Western blot signals are shown in Fig. S2 C. (H) Abi1 immunoprecipitates were immunoblotted for Ser225-phosphorylated Abi1 (90% of input, top panels) and total Abi1 (10% of input, bottom panels). In the bottom panel, an Abi1 immunoprecipitate obtained from unstimulated control cells (lane 3) was loaded directly adjacent to an Abi1 immunoprecipitate obtained from unstimulated JAM-A-depleted cells (lane 4) for direct comparison of Abi1 P-Ser225 levels. Quantifications are shown in Fig. S2 D. (I) Quantification of CIL types after collisions between scrambled shRNA-expressing MCF7 cells (Ctrl KD) and JAM-A shRNA-expressing MCF7 cells (JAM-A KD) in the presence of either CI-1040 or PP2. Number of collisions analyzed: n = 111 for Ctrl KD–WT collisions, n = 112 for JAM-A KD–WT collisions, n = 81 for JAM-A KD—WT (+CI-1040), n = 61 for JAM-A KD—WT (+PP2; three independent experiments). Statistical analysis was performed with unpaired Student’s t test. Data are presented as mean values ± SD. NS, not significant; *, P < 0.05; **, P < 0.01; ***, P < 0.001. Source data are available for this figure: SourceData F4.
JAM-A interacts with CD9, αvβ5 integrin, and c-Src, and suppresses the activities of the Src-FAK and MEK-ERK1/2 pathways. (A) CoIP of αvβ5 integrin with JAM-A. (B) CoIP of CD9 with JAM-A. (C) CoIP of Src with JAM-A. Src association with JAM-A is only detectable in Brij98 lysates. Quantification of Western blot signals is shown in Fig. S2 A. (D) CoIP of Src with CD9. (E) CoIP of αvβ5 integrin with Src. (F) CD9 immunoprecipitates from control MCF7 cells (MCF7-pLVTHM, left panel) or JAM-A-depleted cells (MCF7-pLVTHM-JAM-A shRNA, right panel) were immunoblotted for Tyr530-phosphorylated Src (80% of input, top panels). Note that high Src activity is reflected by low P-Tyr530 immunoreactivity. About 10% of the precipitated material was immunoblotted for total Src and for CD9. Data are representative of three independent experiments. Quantifications of Western blot signals are shown in Fig. S2 B. (G) Lysates of control MCF7 cells or JAM-A KD MCF7 cells were immunoblotted for P-Thr202/P-Tyr204 ERK1/2 or total ERK1/2. Data is representative of three independent experiments. Quantifications of Western blot signals are shown in Fig. S2 C. (H) Abi1 immunoprecipitates were immunoblotted for Ser225-phosphorylated Abi1 (90% of input, top panels) and total Abi1 (10% of input, bottom panels). In the bottom panel, an Abi1 immunoprecipitate obtained from unstimulated control cells (lane 3) was loaded directly adjacent to an Abi1 immunoprecipitate obtained from unstimulated JAM-A-depleted cells (lane 4) for direct comparison of Abi1 P-Ser225 levels. Quantifications are shown in Fig. S2 D. (I) Quantification of CIL types after collisions between scrambled shRNA-expressing MCF7 cells (Ctrl KD) and JAM-A shRNA-expressing MCF7 cells (JAM-A KD) in the presence of either CI-1040 or PP2. Number of collisions analyzed: n = 111 for Ctrl KD–WT collisions, n = 112 for JAM-A KD–WT collisions, n = 81 for JAM-A KD—WT (+CI-1040), n = 61 for JAM-A KD—WT (+PP2; three independent experiments). Statistical analysis was performed with unpaired Student’s t test. Data are presented as mean values ± SD. NS, not significant; *, P < 0.05; **, P < 0.01; ***, P < 0.001. Source data are available for this figure: SourceData F4.
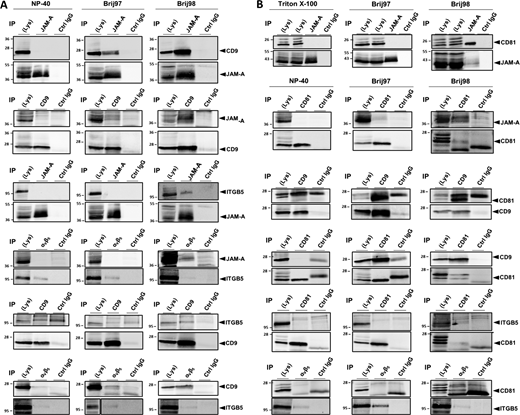
Characterization of the JAM-A- and αvβ5 integrin-containing TEMs. MCF7 cells were lysed using NP40-, Brij97- or Brij98-containing lysis buffers. Immunoprecipitation (IP) was performed with antibodies against the indicated molecules. 90% of the immunoprecipitated material was blotted with antibodies against the putative binding partner (top panels in all figures), 10% of the precipitated material was blotted with antibodies against the precipitated protein to control for immunoprecipitation efficiency. (A) Characterization of the JAM-A-, CD9-, and αvβ5 integrin-containing TEM. (B) Characterization of the JAM-A-, CD81-, and αvβ5 integrin-containing TEM. Note that all specific interactions are only detectable under lysis conditions that preserve tetraspanin-mediated interactions (Brij97 and/or Brij98). Abbreviations: ITGB5, integrin β5. Source data are available for this figure: SourceData FS1.

Characterization of the JAM-A- and αvβ5 integrin-containing TEMs. MCF7 cells were lysed using NP40-, Brij97- or Brij98-containing lysis buffers. Immunoprecipitation (IP) was performed with antibodies against the indicated molecules. 90% of the immunoprecipitated material was blotted with antibodies against the putative binding partner (top panels in all figures), 10% of the precipitated material was blotted with antibodies against the precipitated protein to control for immunoprecipitation efficiency. (A) Characterization of the JAM-A-, CD9-, and αvβ5 integrin-containing TEM. (B) Characterization of the JAM-A-, CD81-, and αvβ5 integrin-containing TEM. Note that all specific interactions are only detectable under lysis conditions that preserve tetraspanin-mediated interactions (Brij97 and/or Brij98). Abbreviations: ITGB5, integrin β5. Source data are available for this figure: SourceData FS1.
The αvβ5 integrin localizes to lamellipodia after ligation to VN and interacts with Src kinase (Zhang et al., 2002; Yan et al., 2008; Lu et al., 2017; Lock et al., 2018). In addition, the αvβ5 integrin cooperates with growth factors such as VEGF or EGF to activate the Src-FAK signaling pathway as well as the MEK-ERK1/2 signaling pathway (Bianchi-Smiraglia et al., 2013; Eliceiri et al., 2002; Hood et al., 2003), which is a downstream target of the Src-FAK pathway (Mendoza et al., 2011; Mendoza et al., 2015; Schlaepfer et al., 1999; Webb et al., 2004). By immunoprecipitation, we found that Src kinase interacts with all three members of this complex (Fig. 4, C–E and Fig. S2 A), strongly suggesting that Src is a part of the JAM-A, CD9-, and αvβ5 integrin-containing TEM. JAM-A depletion by RNAi resulted in constitutive activation of CD9-associated Src (Fig. 4 F and Fig. S2 B) as well as of ERK1/2 (Fig. 4 G and Fig. S2 C). JAM-A depletion also resulted in constitutive phosphorylation of Abi1 at Ser225 (Fig. 4 H and Fig. S2 D). Abi1 is a member of the WAVE regulatory complex (WRC) and is phosphorylated at Ser225 by ERK1/2 at lamellipodial leading edges, which promotes the disassembly of cell–matrix adhesions (CMAs) and the formation of actin-based protrusions during migration (Mendoza et al., 2011). These observations suggested that JAM-A suppresses Src and its downstream effectors ERK1/2 and Abi1, which are key regulators of cell motility. To further support that ERK1/2 and Abi1 are activated through Src downstream of JAM-A, we inhibited Src using the Src inhibitor PP2 in JAM-A-depleted cells. Inhibition of Src blocked ERK1/2 activation (Fig. S2 E) and Abi1 Ser225 phosphorylation (Fig. S2 F). Abi1 Ser225 phosphorylation was also blocked after the inhibition of ERK1/2 using the MEK1/2 inhibitor CI-1040 (Fig. S2 F). We also performed 1D-kinematic assays with JAM-A KD cells in the presence of either PP2 or CI-1040. Inhibition of both Src and ERK1/2 activity in JAM-A-depleted cells restored a CIL response that was similar to the CIL response observed in control cells (Fig. 4 I). These observations strongly suggest that JAM-A regulates CIL in tumor cells by inhibiting Src–MEK/ERK1/2–Abi1 signaling.
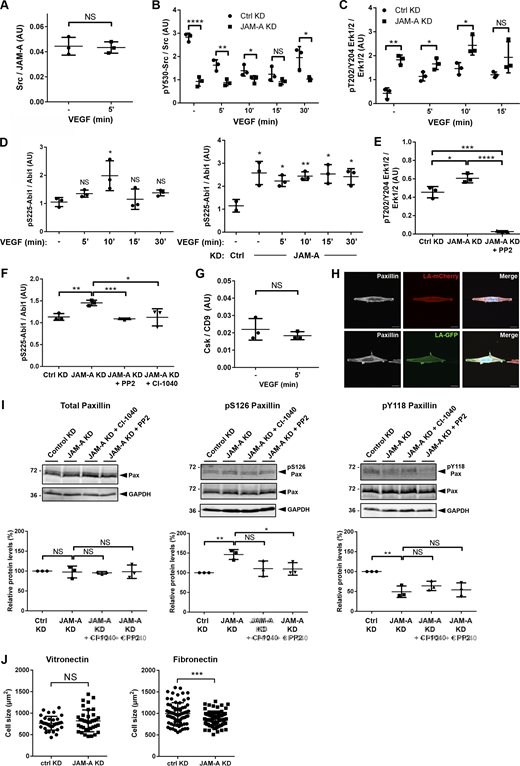
Quantification of Src—JAM-A and Csk—CD9 association as well as of Src, Erk1/2 and Abi1 phosphorylation in JAM-A-depleted cells. (A) Quantification of Src association with JAM-A in the absence and presence of VEGF stimulation (addendum to Fig. 4 C). (B) Quantification of Src phosphorylation (Tyr530) in JAM-A KD MCF7 cells (addendum to Fig. 4 F). Note that Tyr530 of Src is a negative regulatory Tyr residue, and that low pY530/total Src ratios are indicative for high Src activity. (C) Quantification of Erk1/2 phosphorylation (Thr202/Tyr204) in JAM-A KD MCF7 cells (addendum to Fig. 4 G). (D) Quantification of Abi1 phosphorylation (Ser225) in JAM-A KD MCF7 cells (addendum to Fig. 4 H). (E) Quantification of Erk1/2 phosphorylation (Thr202/Tyr204) in JAM-A KD MCF7 cells treated with PP2. (F) Quantification of Abi1 phosphorylation (Ser225) in JAM-A KD MCF7 cells treated with either CI-1040 or with PP2. (G) Quantification of Csk association with CD9 in the absence and presence of VEGF stimulation (addendum to Fig. 5 A). (H) Paxillin localization in MCF7 cells cultured on VN-coated micropatterned substrates (5 µm width). Arrowheads indicate polarized enrichment of paxillin at the periphery of cells migrating on the spatially confined substrate. Scale bars: 10 µm. (I) Paxillin phosphorylation at Tyr118 and Ser126 after inhibition of ERK1/2 (CI-1040) or Src (PP2). Top: Western blot analysis using antibodies against total paxillin (Pax), P-Ser126 paxillin (pS126Pax), or P-Tyr118 paxillin (pY118Pax). Bottom: Quantification of paxillin phosphorylations. Western blot signals were quantified using the Odyssey application software. In A and G, signals obtained with Src and Csk antibodies were normalized to the signals obtained with JAM-A and CD9 antibodies, respectively. In B, C, D, E, F, and I, signals obtained with phospho-specific antibodies were normalized to the signals obtained with antibodies directed against the respective total protein in each experiment. (J) Cell size analysis of MCF7 cells stably transfected with a control vector (pLVTHM-EGFP, Control KD) or with a JAM-A shRNA expression vector (pLVTHM-EGFP-JAM-A-shRNA, JAM-A KD) seeded on VN-coated or FN-coated polyacrylamide gels (for VN: n = 34 for Ctrl cells, n = 35 for JAM-A KD cells, four independent experiments; for FN: n = 74 for Ctrl cells, n = 74 for JAM-A KD cells, four independent experiments). Data is taken from three independent experiments in each panel. Statistical analysis was performed using unpaired Student’s t test. NS, not significant; *, P < 0.05; **, P < 0.01; ****, P < 0.0001. Source data are available for this figure: SourceData FS2.

Quantification of Src—JAM-A and Csk—CD9 association as well as of Src, Erk1/2 and Abi1 phosphorylation in JAM-A-depleted cells. (A) Quantification of Src association with JAM-A in the absence and presence of VEGF stimulation (addendum to Fig. 4 C). (B) Quantification of Src phosphorylation (Tyr530) in JAM-A KD MCF7 cells (addendum to Fig. 4 F). Note that Tyr530 of Src is a negative regulatory Tyr residue, and that low pY530/total Src ratios are indicative for high Src activity. (C) Quantification of Erk1/2 phosphorylation (Thr202/Tyr204) in JAM-A KD MCF7 cells (addendum to Fig. 4 G). (D) Quantification of Abi1 phosphorylation (Ser225) in JAM-A KD MCF7 cells (addendum to Fig. 4 H). (E) Quantification of Erk1/2 phosphorylation (Thr202/Tyr204) in JAM-A KD MCF7 cells treated with PP2. (F) Quantification of Abi1 phosphorylation (Ser225) in JAM-A KD MCF7 cells treated with either CI-1040 or with PP2. (G) Quantification of Csk association with CD9 in the absence and presence of VEGF stimulation (addendum to Fig. 5 A). (H) Paxillin localization in MCF7 cells cultured on VN-coated micropatterned substrates (5 µm width). Arrowheads indicate polarized enrichment of paxillin at the periphery of cells migrating on the spatially confined substrate. Scale bars: 10 µm. (I) Paxillin phosphorylation at Tyr118 and Ser126 after inhibition of ERK1/2 (CI-1040) or Src (PP2). Top: Western blot analysis using antibodies against total paxillin (Pax), P-Ser126 paxillin (pS126Pax), or P-Tyr118 paxillin (pY118Pax). Bottom: Quantification of paxillin phosphorylations. Western blot signals were quantified using the Odyssey application software. In A and G, signals obtained with Src and Csk antibodies were normalized to the signals obtained with JAM-A and CD9 antibodies, respectively. In B, C, D, E, F, and I, signals obtained with phospho-specific antibodies were normalized to the signals obtained with antibodies directed against the respective total protein in each experiment. (J) Cell size analysis of MCF7 cells stably transfected with a control vector (pLVTHM-EGFP, Control KD) or with a JAM-A shRNA expression vector (pLVTHM-EGFP-JAM-A-shRNA, JAM-A KD) seeded on VN-coated or FN-coated polyacrylamide gels (for VN: n = 34 for Ctrl cells, n = 35 for JAM-A KD cells, four independent experiments; for FN: n = 74 for Ctrl cells, n = 74 for JAM-A KD cells, four independent experiments). Data is taken from three independent experiments in each panel. Statistical analysis was performed using unpaired Student’s t test. NS, not significant; *, P < 0.05; **, P < 0.01; ****, P < 0.0001. Source data are available for this figure: SourceData FS2.
JAM-A acts as a scaffold for Csk to negatively regulate Src activity
The activity of Src is frequently regulated by scaffolding proteins that recruit Csk to Src-containing protein complexes (Ha et al., 2008; Jo et al., 2014; Ren et al., 2004; Zhang et al., 2004). In CoIP experiments, we found that Csk co-immunoprecipitates with CD9 (Fig. 5 A and Fig. S2 G). Since Csk binding to its scaffolds requires phosphotyrosine (P-Tyr) residues (Okada, 2012), we first tested the possibility that Src phosphorylates JAM-A at Tyr280 (Tyr281 in murine JAM-A) to generate a binding site for Csk. We found that recombinant Src phosphorylates JAM-A at Tyr280 in vitro (Fig. 5 B), and that JAM-A is Tyr280-phosphorylated in cells expressing a constitutively active mutant of Src (Src/Y530F; Fig. 5 C). Pulldown experiments with peptides and in vitro-translated Csk indicated that Csk interacts with Tyr280-phosphorylated JAM-A through its SH2 domain (Fig. 5 D). Also, Csk co-immunoprecipitated with Tyr280-phosphorylated JAM-A from HEK293T cells (Fig. 5 E). These observations suggested that Tyr280-phosphorylated JAM-A acts as a scaffold for Csk within the JAM-A–CD9–αvβ5 integrin TEM to mediate inhibition of αvβ5 integrin-associated Src. In support of this, Csk-depleted cells fail to establish a proper CIL response upon collisions with normal cells (Fig. 5 F). These data strongly suggest that the inhibition of Src activity by JAM-A is mediated by P-Tyr280 JAM-A-associated Csk, and that inhibition of Src by Csk is required to regulate CIL.

Csk directly interacts with Tyr280-phosphorylated JAM-A and regulates CIL in MCF7 cells. (A) CD9 IPs from VEGF-stimulated MCF7 cells were blotted for Csk (top panel, 90%) or for CD9 (bottom panel, 10%). Quantification of Western blot signals is shown in Fig. S2 G. (B) Left: In vitro phosphorylation of GST-JAM-A fusion proteins by c-Src. Phosphorylation by aPKCζ served as a positive control. Right: In vitro phosphorylation of JAM-A mutants by recombinant c-Src. (C) Flag-tagged JAM-A constructs (JAM-A/WT, JAM-A/Y280F, and JAM-A/Y261F) were immunoprecipitated from HEK293T cells and analyzed by Western blotting with a P-Tyr280 JAM-A antibody (Rockland #600-401-GN5, top, 90% of input) or with a Flag tag antibody (bottom, 10% of input). (D) Biotinylated JAM-A cytoplasmic domain (Cyt) peptides were incubated with in vitro translated recombinant Csk full length (Csk/f.l.) or Csk SH2 domain (Csk/SH2). Abbreviations: Pept-PD, peptide pulldown. (E) JAM-A immunoprecipitates obtained from HEK293T cells transfected with JAM-A, Csk, and constitutively active Src (Src/Y530F) were immunoblotted with antibodies against Csk (80% of input), JAM-A (10% of input), and phosphotyrosine residues (4G10, 10% of input). (F) Quantification of CIL phenotypes in Csk KD MCF7 cells. Collisions of control MCF7 cells (transfected with pTRIPZ-tRFP vector, Ctrl KD) or Csk KD MCF7 cells (transfected with pTRIPZ-tRFP-Csk-shRNA, Csk KD) with MCF7 WT cells (transfected with pLVTHM-EGFP). Number of collisions analyzed: n = 122 cells for Ctrl KD–WT collisions (three independent experiments), n = 153 for Csk KD–WT collisions (four independent experiments). (G) Tyr280 phosphorylation of JAM-A was analyzed by immunoprecipitating P-Tyr280-phosphorylated JAM-A from VEGF-stimulated MCF7 cells using a P-Tyr280-JAM-A (P-JAM-A)-specific antibody (Affi1550), followed by immunoblotting with a JAM-A-specific mouse mAb (BD TL 612120). Postnuclear supernatants (PNS) were immunoblotted with a JAM-A antibody (mouse mAb BD TL 612120). Western blot signals were quantified using the Odyssey imaging system (LI-COR). P-Tyr280 JAM-A signals were normalized to total JAM-A levels. Signals obtained from control samples were set to 100%. Statistical analyses were performed using one-sample t test (five independent experiments) NS, not significant; *, P < 0.05; **, P < 0.01; ***, P < 0.001. (H) Quantitative analysis of CIL types observed in 1D kinematic assays performed with mixed populations of WT MCF7 cells and MCF7 cells with doxycycline-inducible KD of JAM-A (pEmU6proT plasmid; − dox: shRNA expression off, + dox: shRNA expression on) and ectopic expression of shRNA-resistant murine JAM-A constructs (mJAM-A/WT, mJAM-A/Y281F). Number of events analyzed: − dox: 121 (3 ind. exp.), + dox: 117 (three independent experiments), + dox:mJAM-A/WT: 120 (four independent experiments), + dox:mJAM-A/Y281F: 89 (four independent experiments). If not indicated otherwise, statistical analyses were performed using unpaired Student’s t test. Data are presented as arithmetic means ± SD; NS, not significant; *, P < 0.05; **, P < 0.001; ***, P < 0.001; ****, P < 0.0001. Source data are available for this figure: SourceData F5.
Csk directly interacts with Tyr280-phosphorylated JAM-A and regulates CIL in MCF7 cells. (A) CD9 IPs from VEGF-stimulated MCF7 cells were blotted for Csk (top panel, 90%) or for CD9 (bottom panel, 10%). Quantification of Western blot signals is shown in Fig. S2 G. (B) Left: In vitro phosphorylation of GST-JAM-A fusion proteins by c-Src. Phosphorylation by aPKCζ served as a positive control. Right: In vitro phosphorylation of JAM-A mutants by recombinant c-Src. (C) Flag-tagged JAM-A constructs (JAM-A/WT, JAM-A/Y280F, and JAM-A/Y261F) were immunoprecipitated from HEK293T cells and analyzed by Western blotting with a P-Tyr280 JAM-A antibody (Rockland #600-401-GN5, top, 90% of input) or with a Flag tag antibody (bottom, 10% of input). (D) Biotinylated JAM-A cytoplasmic domain (Cyt) peptides were incubated with in vitro translated recombinant Csk full length (Csk/f.l.) or Csk SH2 domain (Csk/SH2). Abbreviations: Pept-PD, peptide pulldown. (E) JAM-A immunoprecipitates obtained from HEK293T cells transfected with JAM-A, Csk, and constitutively active Src (Src/Y530F) were immunoblotted with antibodies against Csk (80% of input), JAM-A (10% of input), and phosphotyrosine residues (4G10, 10% of input). (F) Quantification of CIL phenotypes in Csk KD MCF7 cells. Collisions of control MCF7 cells (transfected with pTRIPZ-tRFP vector, Ctrl KD) or Csk KD MCF7 cells (transfected with pTRIPZ-tRFP-Csk-shRNA, Csk KD) with MCF7 WT cells (transfected with pLVTHM-EGFP). Number of collisions analyzed: n = 122 cells for Ctrl KD–WT collisions (three independent experiments), n = 153 for Csk KD–WT collisions (four independent experiments). (G) Tyr280 phosphorylation of JAM-A was analyzed by immunoprecipitating P-Tyr280-phosphorylated JAM-A from VEGF-stimulated MCF7 cells using a P-Tyr280-JAM-A (P-JAM-A)-specific antibody (Affi1550), followed by immunoblotting with a JAM-A-specific mouse mAb (BD TL 612120). Postnuclear supernatants (PNS) were immunoblotted with a JAM-A antibody (mouse mAb BD TL 612120). Western blot signals were quantified using the Odyssey imaging system (LI-COR). P-Tyr280 JAM-A signals were normalized to total JAM-A levels. Signals obtained from control samples were set to 100%. Statistical analyses were performed using one-sample t test (five independent experiments) NS, not significant; *, P < 0.05; **, P < 0.01; ***, P < 0.001. (H) Quantitative analysis of CIL types observed in 1D kinematic assays performed with mixed populations of WT MCF7 cells and MCF7 cells with doxycycline-inducible KD of JAM-A (pEmU6proT plasmid; − dox: shRNA expression off, + dox: shRNA expression on) and ectopic expression of shRNA-resistant murine JAM-A constructs (mJAM-A/WT, mJAM-A/Y281F). Number of events analyzed: − dox: 121 (3 ind. exp.), + dox: 117 (three independent experiments), + dox:mJAM-A/WT: 120 (four independent experiments), + dox:mJAM-A/Y281F: 89 (four independent experiments). If not indicated otherwise, statistical analyses were performed using unpaired Student’s t test. Data are presented as arithmetic means ± SD; NS, not significant; *, P < 0.05; **, P < 0.001; ***, P < 0.001; ****, P < 0.0001. Source data are available for this figure: SourceData F5.
JAM-A phosphorylation at Tyr280 is required to regulate CIL
To obtain further support for the Tyr280 phosphorylation of JAM-A in the regulation of CIL, we analyzed JAM-A phosphorylation after VEGF stimulation using a P-Tyr280 JAM-A-specific antibody (Fig. 5 G and Fig. S3, A–C). VEGF stimulation resulted in a biphasic JAM-A Tyr280 phosphorylation, an early phosphorylation after 5 min, and a lagged phosphorylation at 15–30 min (Fig. 5 G), indicating that Tyr280 of JAM-A is phosphorylated in cells. Importantly, ectopic expression of shRNA-resistant murine JAM-A/WT (mJAM-A/WT), but not mJAM-A/Y281F, restored the defective CIL in JAM-A KD cells (Fig. 5 H). These observations strongly suggest that Tyr280 phosphorylation of JAM-A serves to recruit Csk to JAM-A, which would generate close spatial proximity between Csk and Src within the JAM-A—CD9—αvβ5 integrin TEM.
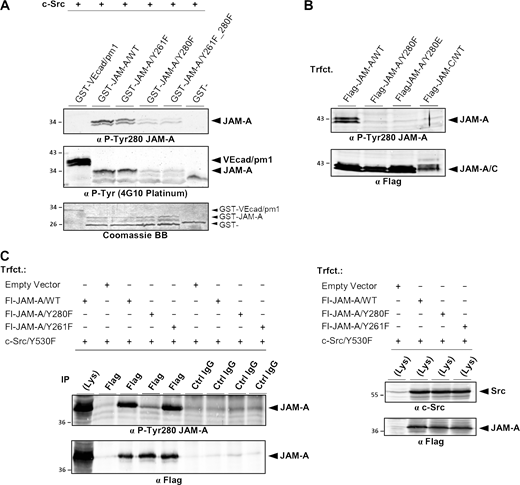
Characterization of a P-Tyr280 JAM-A–specific antibody. (A) GST-fusion proteins containing the cytoplasmic domain of JAM-A, either the WT sequence (GST-hJAM-A/WT) or Tyr-to-Phe substitutions of the two Tyr residues present in the cytoplasmic domain of hJAM-A (-/Y261F, -/Y280F, -/Y261F_Y280F), were incubated with recombinant c-Src in kinase buffer. A fragment of the cytoplasmic domain of VE-cadherin (GST-VEcad/pm1) and GST alone (GST-) served as positive and negative controls, respectively. After kinase reaction, the GST fusion proteins were separated by SDS-PAGE and immunoblotted with an anti P-Tyr280 JAM-A-specific antibody (Affi1550, top panel) or with a pan-P-Tyr-specific antibody (4G10 Platinum, middle panel). 10% of the input of GST fusion proteins were stained with Coomassie BB (bottom panel). Note that the P-Tyr280 JAM-A antibody detects JAM-A only when Tyr280 is unmodified. (B) Lysates of CHO cells ectopically expressing Flag-tagged JAM-A/WT (Flag-JAM-A/WT), Flag-JAM-A/Y280F, Flag-JAM-A/Y280E, or Flag-tagged JAM-C/WT (Flag-JAM-C/WT) were separated by SDS-PAGE and immunoblotted with an anti P-Tyr280 JAM-A-specific antibody (Affi1550, top panel) or with a Flag tag-specific antibody (bottom panel). Note that the P-Tyr280 JAM-A antibody detects only WT JAM-A. (C) HEK293T cells were co-transfected with Flag-JAM-A constructs as indicated and constitutively active c-Src (Src/Y530F). Left panel: Flag immunoprecipitates were separated by SDS-PAGE and immunoblotted with an anti P-Tyr280 JAM-A-specific antibody (Affi1550, top panel, 90% of input) or with a Flag tag-specific antibody (bottom panel, 10% of input). Right panel: Lysates of transfected cells were immunoblotted with an anti c-Src antibody (top) or with an anti-Flag antibody (bottom). Abbreviation: Trfct, Transfection; VEcad, VE-cadherin. Source data are available for this figure: SourceData FS3.

Characterization of a P-Tyr280 JAM-A–specific antibody. (A) GST-fusion proteins containing the cytoplasmic domain of JAM-A, either the WT sequence (GST-hJAM-A/WT) or Tyr-to-Phe substitutions of the two Tyr residues present in the cytoplasmic domain of hJAM-A (-/Y261F, -/Y280F, -/Y261F_Y280F), were incubated with recombinant c-Src in kinase buffer. A fragment of the cytoplasmic domain of VE-cadherin (GST-VEcad/pm1) and GST alone (GST-) served as positive and negative controls, respectively. After kinase reaction, the GST fusion proteins were separated by SDS-PAGE and immunoblotted with an anti P-Tyr280 JAM-A-specific antibody (Affi1550, top panel) or with a pan-P-Tyr-specific antibody (4G10 Platinum, middle panel). 10% of the input of GST fusion proteins were stained with Coomassie BB (bottom panel). Note that the P-Tyr280 JAM-A antibody detects JAM-A only when Tyr280 is unmodified. (B) Lysates of CHO cells ectopically expressing Flag-tagged JAM-A/WT (Flag-JAM-A/WT), Flag-JAM-A/Y280F, Flag-JAM-A/Y280E, or Flag-tagged JAM-C/WT (Flag-JAM-C/WT) were separated by SDS-PAGE and immunoblotted with an anti P-Tyr280 JAM-A-specific antibody (Affi1550, top panel) or with a Flag tag-specific antibody (bottom panel). Note that the P-Tyr280 JAM-A antibody detects only WT JAM-A. (C) HEK293T cells were co-transfected with Flag-JAM-A constructs as indicated and constitutively active c-Src (Src/Y530F). Left panel: Flag immunoprecipitates were separated by SDS-PAGE and immunoblotted with an anti P-Tyr280 JAM-A-specific antibody (Affi1550, top panel, 90% of input) or with a Flag tag-specific antibody (bottom panel, 10% of input). Right panel: Lysates of transfected cells were immunoblotted with an anti c-Src antibody (top) or with an anti-Flag antibody (bottom). Abbreviation: Trfct, Transfection; VEcad, VE-cadherin. Source data are available for this figure: SourceData FS3.
JAM-A regulates paxillin turnover and force generation at CMAs
Both the Src-FAK and the MEK-ERK1/2 signaling pathways act on paxillin, a multi-domain scaffolding protein localized at CMAs (Lopez-Colome et al., 2017). Phosphorylation of paxillin by both pathways promotes the disassembly and turnover of CMAs, which is necessary for efficient locomotion (Cai et al., 2006; Roycroft et al., 2018; Webb et al., 2004; Woodrow et al., 2003). Given the constitutive activation of Src and ERK1/2 after depletion of JAM-A, we analyzed paxillin localization and phosphorylation. Since paxillin was not specifically localized in clusters but highly enriched at both leading and trailing edges when cells were grown under 1D micropatterns (Fig. S2 H), these experiments were performed with collectively migrating cells. We found that the number of paxillin-positive CMAs was significantly lower in JAM-A-depleted cells (Fig. 6 A). Paxillin total protein levels were unchanged after JAM-A depletion, but paxillin phosphorylation at Ser126 was increased, whereas phosphorylation at Tyr118 was slightly decreased (Fig. 6 B). The increased Ser126 phosphorylation, but not the decreased Tyr118 phosphorylation, was partially reversed in the presence of PP2 or CI-1040 (Fig. S2 I), suggesting that the increased Ser126 phosphorylation is mediated by Src and ERK1/2 downstream of JAM-A. Together, these findings suggest that in collectively migrating cells the suppression of Src–ERK1/2 signaling by JAM-A limits Ser126 phosphorylation of paxillin, thereby limiting paxillin internalization and turnover, thus promoting CMA stability.

JAM-A regulates paxillin turnover, paxillin phosphorylation, and force generation at cell–matrix adhesions. (A) Confluent monolayers of MCF7 cells with inducible KD of JAM-A (pEmU6proT plasmid; − dox: shRNA off (Ctrl MCF7), + dox: shRNA on (JAM-A KD MCF7) were scratch-wounded, allowed to migrate, and stained with anti-paxillin antibodies. Paxillin-positive spots were visualized using ImageJ software and are depicted in the black-and-white pictures. Right panel: Quantification of paxillin-positive spots. Four to six randomly chosen fields of view with ∼10 cells per field of view were analyzed (n = 145 cells for control cells, n = 171 cells for JAM-A KD cells, three independent experiments). Immunofluorescence signals with a minimum size of 45 pixels were counted. Statistical analysis was performed with unpaired Student’s t test and is depicted as means ± SD. **, P < 0.01. Scale bars: 10 µm. (B) Lysates from control MCF7 cells (pLVTHM-EGFP) or JAM-A KD MCF7 cells (pLVTHM-EGFP-JAM-A-shRNA) were analyzed by Western blotting using antibodies against total paxillin (Pax), P-Ser126 paxillin (pS126Pax), or P-Tyr118 paxillin (pY118Pax). Right: Western blot signals were quantified using the Odyssey application software. Paxillin signals were corrected for loading differences using GAPDH signals and phospho-paxillin signals were normalized to the corrected paxillin signals. Signals obtained from control samples were set to 100%. Statistical analysis was performed using one-sample t test. NS, not significant; *, P < 0.05. (C) MCF7 cells stably transfected with a control vector (pLVTHM-EGFP, Control KD) or with a JAM-A shRNA expression vector (pLVTHM-EGFP-JAM-A-shRNA, JAM-A KD) were seeded subconfluently on a µ-Dish containing either VN-coated or FN-coated polyacrylamide gels of 3 kPa stiffness. Left: Traction fields of control MCF7 cells and JAM-A KD MCF7 cells on VN and FN. Traction forces are color-coded as indicated by the color bar and are depicted in Pascal (Pa). Right: Quantification of mean traction forces and mean strain energy per cell area on VN-coated PAA gels (n = 34 for Ctrl cells, n = 35 for JAM-A KD cells, four independent experiments), and FN-coated coated PAA gels (n = 74 for Ctrl cells, n = 74 for JAM-A KD cells, four independent experiments). Statistical analysis was performed using unpaired Student’s t test and is depicted as means ± SD. *, P < 0.05; **, P < 0.01. Scale bars: 10 µm. Source data are available for this figure: SourceData F6.
JAM-A regulates paxillin turnover, paxillin phosphorylation, and force generation at cell–matrix adhesions. (A) Confluent monolayers of MCF7 cells with inducible KD of JAM-A (pEmU6proT plasmid; − dox: shRNA off (Ctrl MCF7), + dox: shRNA on (JAM-A KD MCF7) were scratch-wounded, allowed to migrate, and stained with anti-paxillin antibodies. Paxillin-positive spots were visualized using ImageJ software and are depicted in the black-and-white pictures. Right panel: Quantification of paxillin-positive spots. Four to six randomly chosen fields of view with ∼10 cells per field of view were analyzed (n = 145 cells for control cells, n = 171 cells for JAM-A KD cells, three independent experiments). Immunofluorescence signals with a minimum size of 45 pixels were counted. Statistical analysis was performed with unpaired Student’s t test and is depicted as means ± SD. **, P < 0.01. Scale bars: 10 µm. (B) Lysates from control MCF7 cells (pLVTHM-EGFP) or JAM-A KD MCF7 cells (pLVTHM-EGFP-JAM-A-shRNA) were analyzed by Western blotting using antibodies against total paxillin (Pax), P-Ser126 paxillin (pS126Pax), or P-Tyr118 paxillin (pY118Pax). Right: Western blot signals were quantified using the Odyssey application software. Paxillin signals were corrected for loading differences using GAPDH signals and phospho-paxillin signals were normalized to the corrected paxillin signals. Signals obtained from control samples were set to 100%. Statistical analysis was performed using one-sample t test. NS, not significant; *, P < 0.05. (C) MCF7 cells stably transfected with a control vector (pLVTHM-EGFP, Control KD) or with a JAM-A shRNA expression vector (pLVTHM-EGFP-JAM-A-shRNA, JAM-A KD) were seeded subconfluently on a µ-Dish containing either VN-coated or FN-coated polyacrylamide gels of 3 kPa stiffness. Left: Traction fields of control MCF7 cells and JAM-A KD MCF7 cells on VN and FN. Traction forces are color-coded as indicated by the color bar and are depicted in Pascal (Pa). Right: Quantification of mean traction forces and mean strain energy per cell area on VN-coated PAA gels (n = 34 for Ctrl cells, n = 35 for JAM-A KD cells, four independent experiments), and FN-coated coated PAA gels (n = 74 for Ctrl cells, n = 74 for JAM-A KD cells, four independent experiments). Statistical analysis was performed using unpaired Student’s t test and is depicted as means ± SD. *, P < 0.05; **, P < 0.01. Scale bars: 10 µm. Source data are available for this figure: SourceData F6.
Besides a high CMA turnover, low traction forces have been observed near cell–cell contacts in neural crest cells during Type I CIL, which is characterized by repolarization and opposite migration (Roycroft et al., 2018). We, therefore, performed traction force microscopy (TFM). JAM-A-depleted MCF7 cells developed significantly lower traction forces and strain energies per cell area (Fig. 6 C), indicative of higher motility. Reduced traction forces were observed on VN but not on FN (Fig. 6 C), supporting a specific cooperation between JAM-A and αvβ5 integrin in MCF7 cell motility. JAM-A depletion had no effect on cell size in MCF7 cells (Fig. S2 J). Together, these observations supported that JAM-A limits cell motility by stabilizing CMAs.
JAM-A limits the activity of Rac1 during cell–cell contact formation
Rac1 is a central regulator of cell motility (Campellone and Welch, 2010). Since Rac1 activity is downregulated during CIL responses in various contexts (Fritz et al., 2015; Moore et al., 2013; Tanaka et al., 2012), we analyzed Rac1 activity in JAM-A-depleted cells. Rac1 pulldown assays showed that in control cells Rac1 activity increased within 2 min after VEGF stimulation and declined at 5 min. In contrast, in JAM-A KD cells, Rac1 activity remained elevated 5 min after VEGF (Fig. 7 A). Blocking Src activity in JAM-A KD cells with PP2 did not reverse the elevated Rac1 activity levels (Fig. 7 B), indicating that JAM-A regulates Rac1 through a mechanism that is independent of Src. We also tested Rac1 activity in single cells in Förster resonance energy transfer (FRET) experiments. Rac1 activities were significantly higher after the depletion of JAM-A at all time points tested (Fig. 7 C), providing a possible explanation for the increased motilities and stiffnesses of JAM-A-depleted cells (Fig. 3, C–E; Kunschmann et al., 2019). FRET experiments performed on pairs of colliding cells showed that Rac1 activity was downregulated at cell–cell contact sites between Ctrl KD cells and MCF7 WT cells, but remained elevated at cell–cell contact sites between JAM-A KD cells and MCF7 WT cells (Fig. 7 D), suggesting that JAM-A inactivates Rac1 at cell–cell interfaces of colliding cells.

JAM-A limits Rac1 activity in MCF7 cells. (A) Left: GST-pulldown (GST-PD) assays from control MCF7 cells (pLVTHM-EGFP) and JAM-A KD MCF7 cells (pLVTHM-EGFP-JAM-A-shRNA). Control immunoblots indicate the levels of total Rac1 and the GST-PAK1-PBD fusion protein present in each sample. Right: Quantification of Rac1 activity. Levels of active Rac1 (Rac1-GTP) are expressed as ratios of signal intensities of Rac1-GTP to total Rac1. Data is derived from three independent experiments. (B) GST-PD assays from JAM-A KD MCF7 cells after inhibition of Src with 10 μM PP2. Experiment was performed as described in (A). Data is derived from three independent experiments. (C) FRET analysis of Rac1 activity in single cells. Left: Control MCF7 cells (transfected with the Rac1-Raichu biosensor and pInd10-mir-RUP-PheS) (top) or JAM-A-depleted MCF7 cells (transfected with the Rac1-Raichu biosensor and pInd10-mir-RUP-PheS-JAM-A-shRNA (bottom) were seeded as single cells and stimulated with VEGF (100 ng/ml). FRET activity is shown as YFP:CFP ratio as indicated by the color bar. Scale bars: 10 µm. Right: Quantification of FRET ratios. Rac1 activity is depicted as percent of cell area with a FRET ratio >1.3 (n = 70 for each condition, six independent experiments). (D) FRET analysis of Rac1 activity at cell–cell contacts of colliding cells. Left: Control MCF7 cells or JAM-A-depleted MCF7 cells expressing the Raichu-Rac1 biosensor (described in C) were mixed with non-transfected MCF7 cells (WT MCF7). FRET activity is shown as YFP:CFP ratio as indicated by the color bar. Scale bars: 10 µm. Right panel: Quantification of FRET ratios. Rac1 activity at cell–cell contacts relative to cell-free edges is depicted as the ratio of FRET signals (mean grey values) at cell–cell contacts to the FRET signals (mean grey values) at the cell-free edge of the Raichu-Rac1-expressing cell (n = 49 for each condition, three independent experiments). All statistical analyses shown in the figure were performed using unpaired Student’s t test. Data are presented as arithmetic means ± SD; NS, not significant, *, P < 0.05; **, P < 0.01; ***, P < 0.001; ****, P < 0.0001. Source data are available for this figure: SourceData F7.
JAM-A limits Rac1 activity in MCF7 cells. (A) Left: GST-pulldown (GST-PD) assays from control MCF7 cells (pLVTHM-EGFP) and JAM-A KD MCF7 cells (pLVTHM-EGFP-JAM-A-shRNA). Control immunoblots indicate the levels of total Rac1 and the GST-PAK1-PBD fusion protein present in each sample. Right: Quantification of Rac1 activity. Levels of active Rac1 (Rac1-GTP) are expressed as ratios of signal intensities of Rac1-GTP to total Rac1. Data is derived from three independent experiments. (B) GST-PD assays from JAM-A KD MCF7 cells after inhibition of Src with 10 μM PP2. Experiment was performed as described in (A). Data is derived from three independent experiments. (C) FRET analysis of Rac1 activity in single cells. Left: Control MCF7 cells (transfected with the Rac1-Raichu biosensor and pInd10-mir-RUP-PheS) (top) or JAM-A-depleted MCF7 cells (transfected with the Rac1-Raichu biosensor and pInd10-mir-RUP-PheS-JAM-A-shRNA (bottom) were seeded as single cells and stimulated with VEGF (100 ng/ml). FRET activity is shown as YFP:CFP ratio as indicated by the color bar. Scale bars: 10 µm. Right: Quantification of FRET ratios. Rac1 activity is depicted as percent of cell area with a FRET ratio >1.3 (n = 70 for each condition, six independent experiments). (D) FRET analysis of Rac1 activity at cell–cell contacts of colliding cells. Left: Control MCF7 cells or JAM-A-depleted MCF7 cells expressing the Raichu-Rac1 biosensor (described in C) were mixed with non-transfected MCF7 cells (WT MCF7). FRET activity is shown as YFP:CFP ratio as indicated by the color bar. Scale bars: 10 µm. Right panel: Quantification of FRET ratios. Rac1 activity at cell–cell contacts relative to cell-free edges is depicted as the ratio of FRET signals (mean grey values) at cell–cell contacts to the FRET signals (mean grey values) at the cell-free edge of the Raichu-Rac1-expressing cell (n = 49 for each condition, three independent experiments). All statistical analyses shown in the figure were performed using unpaired Student’s t test. Data are presented as arithmetic means ± SD; NS, not significant, *, P < 0.05; **, P < 0.01; ***, P < 0.001; ****, P < 0.0001. Source data are available for this figure: SourceData F7.
CD81 links JAM-A to αvβ5 integrin and limits the activity of Rac1 during cell–cell contact formation
Tspan CD81 has been described to negatively regulate Rac1 and to exist in a complex with αvβ5 integrin (Chang and Finnemann, 2007; Tejera et al., 2013). Since the depletion of CD9 did not abolish the interaction of JAM-A with αvβ5 integrin (Fig. 8 A), we tested the possibility that CD81 is present in the JAM-A–CD9–αvβ5 integrin complex. Based on CoIP, we found that CD81 interacts with JAM-A in MCF7 cells (Fig. 8 B). The interaction with CD81 requires the C-terminal PDZ domain-binding motif (PBM) of JAM-A (Fig. 8 C). CD81 interacts equally well with JAM-A/WT and with a dimerization-deficient JAM-A mutant (Fig. 8 C). Simultaneous depletion of CD9 and CD81 abolished the interaction of JAM-A with αvβ5 integrin (Fig. 8 D), indicating that both CD9 and CD81 link JAM-A to αvβ5 integrin. CoIP experiments further indicated an association of CD81 with all other members of the JAM-A-containing TEM, i.e., αvβ5 integrin, Src, and CD9 (Fig. 8 E and Fig. S1 B). The associations of CD81 with the other members of the complex were detectable under Brij97- or Brij98- but not NP40-based lysis conditions (Fig. S1 B). Simultaneous depletion of CD9 and CD81 resulted in increased migratory activity (Fig. S4, A–D) and impaired CIL response (Fig. 8 F) of MCF7 cells. CD81 depletion resulted in sustained Rac1 activity in response to VEGF stimulation (Fig. 8 G) and elevated Rac1 activity at cell–cell contacts of colliding cells (Fig. 8 H). These findings strongly suggest that JAM-A and CD81 functionally interact to limit Rac1 activity at sites of cell–cell contact formation as part of a proper CIL response. A model depicting a proposed JAM-A-based molecular mechanism in the regulation of CIL is shown in Fig. 9.

Tetraspanin CD81 is part of the JAM-A - CD9 - αvβ5 integrin complex and regulates Rac1 activity. (A) CoIP of αvβ5 integrin with JAM-A from CD9 KD MCF7 cells. Right: Expression of CD9 in control cells (MCF7-pLVTHM) and CD9 knockdown cells (MCF7-pLVTHM-CD9-shRNA). (B) CoIP of CD81 with JAM-A. (C) CoIP of CD81 with JAM-A mutant constructs: ΔD1-JAM-A (lacks D1 Ig domain), JAM-A/Δ3 (lacks PBM). Abbreviations: Fl, Flag. (D) CoIP of αvβ5 integrin with JAM-A from CD81 KD MCF7 cells and CD9/CD81 double KD MCF7 cells. Control KD and CD81 KD were achieved with OnTarget plus non-targeting pool and hCD81 OnTarget plus siRNA pool, respectively. (E) CoIP of αvβ5 integrin (left) and Src (right) with CD81. (F) Quantification of CIL after combined depletion of CD9 and CD81 in MCF7 cells. Number of collisions analyzed: n = 83 for Ctrl KD–WT collisions, n = 67 for CD9/CD81 KD–WT collisions (three independent experiments). (G) Top: GST-PD assay from CD81 KD MCF7 cells (pInducer10-mir-RUP-PheS-hCD81 shRNA) or from control MCF7 cells (pLVTHM). Bottom: Quantification of Rac1 activities in CD81 KD cells compared with control KD cells. Levels of active Rac1 (GTP-Rac1) are expressed as ratios of signal intensities of GTP-Rac1 to total Rac1. Data is derived from three independent experiments. (H) CD81 suppresses Rac1 activity at cell–cell contacts during cell collisions. Quantification of FRET ratios in Ctrl MCF7 (Ctrl KD) and CD81 KD MCF7 cells (CD81 KD) collided with wildtype MCF7 (WT) cells. Rac1 activity at cell–cell contacts relative to cell-free edges is depicted as the ratio of FRET signals (mean grey values) at cell–cell contacts to the FRET signals (mean grey values) at the cell-free edge of the Raichu-Rac1-expressing cell (n = 71 for each condition, three independent experiments. All statistical analyses shown in the figure were performed using unpaired Student’s t test. Data are presented as arithmetic means ± SD; NS, not significant; *, P < 0.05; **, P < 0.01; ***, P < 0.001. Source data are available for this figure: SourceData F8.
Tetraspanin CD81 is part of the JAM-A - CD9 - αvβ5 integrin complex and regulates Rac1 activity. (A) CoIP of αvβ5 integrin with JAM-A from CD9 KD MCF7 cells. Right: Expression of CD9 in control cells (MCF7-pLVTHM) and CD9 knockdown cells (MCF7-pLVTHM-CD9-shRNA). (B) CoIP of CD81 with JAM-A. (C) CoIP of CD81 with JAM-A mutant constructs: ΔD1-JAM-A (lacks D1 Ig domain), JAM-A/Δ3 (lacks PBM). Abbreviations: Fl, Flag. (D) CoIP of αvβ5 integrin with JAM-A from CD81 KD MCF7 cells and CD9/CD81 double KD MCF7 cells. Control KD and CD81 KD were achieved with OnTarget plus non-targeting pool and hCD81 OnTarget plus siRNA pool, respectively. (E) CoIP of αvβ5 integrin (left) and Src (right) with CD81. (F) Quantification of CIL after combined depletion of CD9 and CD81 in MCF7 cells. Number of collisions analyzed: n = 83 for Ctrl KD–WT collisions, n = 67 for CD9/CD81 KD–WT collisions (three independent experiments). (G) Top: GST-PD assay from CD81 KD MCF7 cells (pInducer10-mir-RUP-PheS-hCD81 shRNA) or from control MCF7 cells (pLVTHM). Bottom: Quantification of Rac1 activities in CD81 KD cells compared with control KD cells. Levels of active Rac1 (GTP-Rac1) are expressed as ratios of signal intensities of GTP-Rac1 to total Rac1. Data is derived from three independent experiments. (H) CD81 suppresses Rac1 activity at cell–cell contacts during cell collisions. Quantification of FRET ratios in Ctrl MCF7 (Ctrl KD) and CD81 KD MCF7 cells (CD81 KD) collided with wildtype MCF7 (WT) cells. Rac1 activity at cell–cell contacts relative to cell-free edges is depicted as the ratio of FRET signals (mean grey values) at cell–cell contacts to the FRET signals (mean grey values) at the cell-free edge of the Raichu-Rac1-expressing cell (n = 71 for each condition, three independent experiments. All statistical analyses shown in the figure were performed using unpaired Student’s t test. Data are presented as arithmetic means ± SD; NS, not significant; *, P < 0.05; **, P < 0.01; ***, P < 0.001. Source data are available for this figure: SourceData F8.

Depletion of CD9 and CD81 promotes cell migration on various ECM substrates. MCF7 cells with simultaneous knockdown of CD9 and CD81 (pLVHTM-CD9 shRNA + CD81 siRNA, CD9/CD81 dKD MCF7; control cells transfected with pLVTHM-EGFP and negative control siRNA, Ctrl MCF7) were seeded as single cell suspension on µ-Dishes coated with different ECM substrates. Cell migration was observed using digital holographic microscopy with a 20× objective (A) or using the confocal LSM780 microscope (Zeiss) equipped with a 20× objective (C and D) over 50 h. Tracking of individual cells was performed as described in the Methods section. (A) Representative images of migration tracks of Ctrl MCF7 cells and CD9/CD81 double KD MCF7 cells grown on VN. (B–D) Accumulated Distance and Euclidean Distance of Ctrl MCF7 cells and CD9/CD81 double KD MCF7 cells grown on VN (B; ctrl MCF7: n = 51, CD9/CD81 KD MCF7: n = 50), LN (C; ctrl MCF7: n = 61, CD9/CD81 KD MCF7: n = 62), or FN (D; ctrl MCF7: n = 55, CD9/CD81 KD MCF7: n = 72). Data is derived from three independent experiments and is represented as mean ± SD. Statistical significance was calculated using Mann–Whitney U test. *, P < 0.05; **, P < 0.01; ****, P < 0.0001.

Depletion of CD9 and CD81 promotes cell migration on various ECM substrates. MCF7 cells with simultaneous knockdown of CD9 and CD81 (pLVHTM-CD9 shRNA + CD81 siRNA, CD9/CD81 dKD MCF7; control cells transfected with pLVTHM-EGFP and negative control siRNA, Ctrl MCF7) were seeded as single cell suspension on µ-Dishes coated with different ECM substrates. Cell migration was observed using digital holographic microscopy with a 20× objective (A) or using the confocal LSM780 microscope (Zeiss) equipped with a 20× objective (C and D) over 50 h. Tracking of individual cells was performed as described in the Methods section. (A) Representative images of migration tracks of Ctrl MCF7 cells and CD9/CD81 double KD MCF7 cells grown on VN. (B–D) Accumulated Distance and Euclidean Distance of Ctrl MCF7 cells and CD9/CD81 double KD MCF7 cells grown on VN (B; ctrl MCF7: n = 51, CD9/CD81 KD MCF7: n = 50), LN (C; ctrl MCF7: n = 61, CD9/CD81 KD MCF7: n = 62), or FN (D; ctrl MCF7: n = 55, CD9/CD81 KD MCF7: n = 72). Data is derived from three independent experiments and is represented as mean ± SD. Statistical significance was calculated using Mann–Whitney U test. *, P < 0.05; **, P < 0.01; ****, P < 0.0001.

Model of CIL regulation by JAM-A. Left: In migrating cells, JAM-A is localized at membrane protrusions and is linked to αvβ5 integrin by tetraspanins CD9 and/or CD81. Tyr280-phosphorylated JAM-A recruits Csk which limits but does not completely inhibit the activity of αvβ5 integrin-associated Src. Through an as yet unknown mechanism, JAM-A limits but does not completely inhibit the activity of CD81-associated Rac1. Downstream effectors of the Src–Erk1/2 pathway (paxillin, WRC) and of Rac1 (WRC) remain active and support cell migration by promoting CMA dynamics and protrusive activity. Right: At cell–cell contacts between colliding cells, JAM-A's homophilic activity results in JAM-A clustering, resulting in strong inhibition of Src and Rac1 and their downstream effectors paxillin and the WRC. As a consequence, CMAs are stabilized and protrusive activity is downregulated, preventing migration across collided cells. Components with increased activity after JAM-A depletion are highlighted by red frames. Abbreviations: CMA, cell-matrix adhesions; WRC, Wave regulatory complex.
Model of CIL regulation by JAM-A. Left: In migrating cells, JAM-A is localized at membrane protrusions and is linked to αvβ5 integrin by tetraspanins CD9 and/or CD81. Tyr280-phosphorylated JAM-A recruits Csk which limits but does not completely inhibit the activity of αvβ5 integrin-associated Src. Through an as yet unknown mechanism, JAM-A limits but does not completely inhibit the activity of CD81-associated Rac1. Downstream effectors of the Src–Erk1/2 pathway (paxillin, WRC) and of Rac1 (WRC) remain active and support cell migration by promoting CMA dynamics and protrusive activity. Right: At cell–cell contacts between colliding cells, JAM-A's homophilic activity results in JAM-A clustering, resulting in strong inhibition of Src and Rac1 and their downstream effectors paxillin and the WRC. As a consequence, CMAs are stabilized and protrusive activity is downregulated, preventing migration across collided cells. Components with increased activity after JAM-A depletion are highlighted by red frames. Abbreviations: CMA, cell-matrix adhesions; WRC, Wave regulatory complex.
Discussion
Here, we report the characterization of a JAM-A-based molecular mechanism that regulates CIL in tumor cells. JAM-A is linked to αvβ5 integrin by the two Tspans CD9 and CD81. Its function in regulating CIL requires a phosphorylated Tyr280 residue, which is a docking site for Csk. The spatial proximity to αvβ5 integrin allows a functional interaction of Csk with αvβ5 integrin-associated Src to limit Src activity. JAM-A also limits the activity of Rac1 through a mechanism that most likely depends on its interaction with CD81 and that operates independently of Src. JAM-A thus limits the activity of two signaling molecules that are central to the regulation of CMA adhesion and protrusion formation (Fig. 9), explaining why its absence strongly impairs CIL.
Src tunes actin branching via the Arp2/3 complex by phosphorylating nucleation promoting factors (NPF) or actin-binding proteins, such as WAVE and Cortactin (Chen et al., 2010; He et al., 2015). At the same time, Src increases the turnover of CMAs by phosphorylating paxillin at Tyr31 and Tyr118 (Webb et al., 2004). Most importantly, Src acts upstream of the MEK/ERK1/2 (Fincham et al., 2000) and Abl kinase signaling pathways (Plattner et al., 1999), both of which can activate the Arp2/3 complex and regulate CMA dynamics and turnover. ERK1/2 does so by phosphorylating the WRC components Abi1 and WAVE2 (Mendoza et al., 2011; Mendoza et al., 2015) and by phosphorylating paxillin and FAK, which destabilizes older CMAs (Webb et al., 2004). Abl kinase does so by phosphorylating WAVE (Leng et al., 2005) and cortactin (Boyle et al., 2007), as well as paxillin at the same Tyr residues as Src, i.e., Tyr31 and Tyr118 (Fu et al., 2015; Webb et al., 2004). Src thus triggers an enzymatic machinery that impacts the same regulators of protrusive activity and CMA dynamics like Src itself, representing a strong signal amplification mechanism (Fig. 9).
Besides Src, JAM-A limits the activity of Rac1. In animal cells, Rac1 is the major activator of the WRC, which is the dominant regulator of lamellipodia formation and membrane ruffling (Rottner and Schaks, 2019). Rac1 directly interacts with the WRC component Sra1 through two independent interaction sites (Chen et al., 2017; Schaks et al., 2018). Also, Rac1 can be activated directly at CMAs downstream of ERK1/2-mediated paxillin phosphorylation, which stimulates lamellipodial activity and cell migration (Ishibe et al., 2004; Wang et al., 2012). The loss of inhibition of both Src and Rac1 activities in the absence of JAM-A is expected to result in continued protrusive activities after initial cell–cell contact formation. This would explain the strong increase in the number of events characterized by a failure of a type II CIL response (+1 CIL phenotype, Fig. 2, B and D–F, Fig. 5 H; and Fig. 8 F), which so far has only been observed in a few heterotypic interactions between tumor cells and normal cells (Abercrombie, 1970; Stramer and Mayor, 2016). Of note, during type I CIL, Rac1 at cell–cell contacts of colliding cells is downregulated to shut down protrusive activity in the direction of migration (Stramer and Mayor, 2016), and Src is upregulated to increase the dynamics of CMAs at cell–cell contacts and prevent stable cell–cell contact formation (Roycroft et al., 2018). Our findings thus suggest that basic mechanisms of CIL are conserved during the collision of tumor cells.
Relevance for development and tumorigenesis
One intriguing observation in this study is that the regulation of CIL is strongly dependent on VN, as indicated by the severely impaired CIL response of normal MCF7 cells grown on LN or FN (Fig. 2 E). Our findings thus suggest that a proper CIL response is influenced by the tissue environment, which has implications on cancer invasion. In addition, since CIL is an important developmental process, which in vertebrates regulates the precise localization of vertebrate neural crest cells and Cajal-Retzius cells (Carmona-Fontaine et al., 2008; Villar-Cervino et al., 2013; Yoon et al., 2018), and which in Drosophila regulates the correct distribution of hemocytes (Davis et al., 2015), our observations also have implications on the regulation of CIL during development. The dependence of the CIL response on VN further implicates specific VN-binding integrins in the regulation of CIL. Since αvβ3 integrin, the major VN ligand besides αvβ5 integrin, is not expressed in MCF7 cells (Goodman et al., 2012; Ricono et al., 2009), our findings identify αvβ5 integrin as a critical component in regulating CIL in tumor cells and perhaps during developmental processes. Besides its role in regulating angiogenesis (Weis and Cheresh, 2011), this integrin has been described to have tumorigenic properties by regulating the invasive growth of cancer cells (Bianchi-Smiraglia et al., 2013; Brooks et al., 1997; Ricono et al., 2009). The observations presented in this study suggest that αvβ5 integrin, a component of the JAM-A–CD9–CD81–αvβ5 TEM, also has an anti-invasive function. It will be important to address the role of VN-binding integrins in the regulation of a proper CIL response not only during cancer invasion but also during development.
Materials and methods
Cell culture and transfections
MCF7 cells (Centre d’Immunologie Pierre-Fabre) were grown in RPMI 1640 medium without phenol red (#32404014; Thermo Fisher Scientific) containing 10% FCS, 2 mM glutamine, 100 U ml−1 penicillin, 100 U ml−1 streptomycin, 1 mM Na-pyruvate, and 1:100 non-essential amino acids (Biochrom). HEK293T cells (ATCC) were grown in DMEM (#P04-03500; PAN-Biotech GmbH) containing 10% FCS, 2 mM glutamine, 100 U ml−1 penicillin, and 100 U ml−1 streptomycin. CHO cells (ATCC) were maintained in α-MEM supplemented with 10% FCS, 2 mM glutamine, 100 U ml−1 penicillin, and 100 U ml−1 streptomycin. MDA-MB-231 cells (ATCC HTB-26) were grown in DMEM containing 10% FCS, 2 mM glutamine, 100 U ml−1 penicillin, 100 U ml−1 streptomycin, and 1% (vol/vol) non-essential amino acids. All cell lines used in this study were routinely tested negative for mycoplasma contamination. Transient transfections of siRNAs were performed using Lipofectamine RNAiMAX (Thermo Fisher Scientific) according to the manufacturer’s instructions. Lentiviral particles for the generation of stably transfected cell lines expressing either shRNAs or cDNAs were generated by cotransfection of HEK293T cells with the lentiviral vector and the packaging vectors psPAX2 and pMD2.G (kindly provided by Dr. Didier Trono, Addgene plasmids 12260 and 12259) in a ratio of 3:2:1 into HEK293T cells. Lentiviral transduction of cells was performed as described by Tuncay et al. (2015).
RNA interference, plasmid vectors, and constructs
The following siRNAs and shRNAs were used: hJAM-A siRNA pool (50848—F11R; siTOOLs Biotech), hJAM-A shRNA 5′-GAAGTGAAGGAGAATTCAA-3′ (in pLVTHM [#12247; Addgene]), pInducer10-mir-RUP-PheS [#44011; Addgene], or pEmU6proT (provided by Dr. Karl Matter); hCD9 shRNA 5′-GGACGUACUCGAAACCUUCTT-3′ (in pLVTHM); hCD81 OnTarget plus siRNA pool (L-017257-00; Dharmacon), hCD81 shRNA 5′-GAACTTTCCTGTTACCTTT-3′ (in pInducer10-mir-RUP-PheS); hCSK shRNA 5′-TAATGAGGCGCGTACAGAG-3′ in pTRIPZ (RHS4696-200701764; Dharmacon); and scrambled shRNA 5′-CCTAAGGTTAAGTCGCCCTCG-3′ in pLKO.1 (#1864; Addgene). Negative control siRNA pool (neg. ctrl. siPOOL Neg D1; #N000-015; siTOOLs Biotech); negative control siRNA (1027280; Qiagen), OnTarget plus non-targeting pool (D-001810-10-05; Dharmacon). Knockdown efficiencies of all shRNAs and siRNAs used in this study are depicted in Fig. 8, A and D and Fig. S5, A–E, respectively. The following constructs were used: LifeAct-eGFP in pFUGW (provided by Dr. R. Wedlich-Söldner), LifeAct-mCherry in pLV-PGK-Puro (provided by Dr. H. Farin); Raichu-Rac1 in pCDH-CMV-MCS-EF1-Hygro (SBI); hJAM-A/WT, hJAM-A/Y280F, hJAM-A/Y280E, hJAM-A/Y261F, hJAM-A/Δ3, ΔD1-hJAM-A, hJAM-A/E61R/K63E, and hCSK/WT in pFLAG-CMV-1 (Sigma-Aldrich); Flag-mJAM-A/WT, Flag-mJAM-A/Y281F, and EGFP-mJAM-A/WT in pCDH-CMV-MCS-EF1-Puro (SBI); mJAM-C, c-Src/Y530F, Flag-CSK, and Flag-CSK/SH2 in pcDNA3. GST-VEcad/pm1 (AA621-689 of mVE-cadherin; pGEX-4T-1), GST-hJAM-A/CP (AA256-299 of human JAM-A; pGEX-4T-1), GST-hJAM-A/CP-Y280F (pGEX-4T-1), GST-hJAM-A/CP-Y261F (pGEX-4T-1), and GST-hJAM-A/CP-Y261_280F (pGEX-4T-1). The following synthetic peptides (Thermo Fisher Scientific) were used for in vitro pulldown experiments (all peptides contain the cytoplasmic domain [CP] of murine JAM-A [AA266-300] and were coupled to biotin via their N-termini): Cyt-WT (wildtype CP), Cyt-Y281-P (Tyr281-phosphorylated CP), and Cyt-S285-P (Ser285-phosphorylated CP).
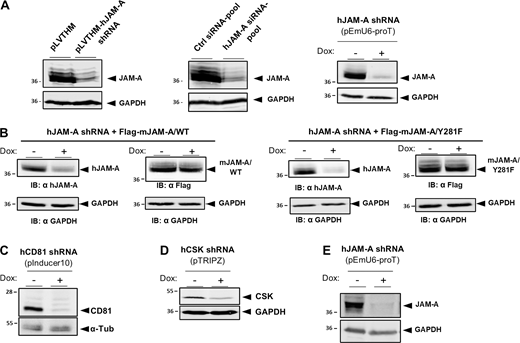
Efficiencies of siRNA- and shRNA-mediated knockdowns and expression levels of rescue constructs. (A) Efficiency of JAM-A KD in MCF7 cells stably transfected with a constitutive shRNA expression vector (left panel), transiently transfected with a hJAM-A-specific siRNA pool (middle panel), or stably transfected with a conditional shRNA expression vector that expresses JAM-A shRNAs under a doxycycline-regulated promoter (pEmU6-proT, TetON). (B) Ectopic expression of murine JAM-A rescue constructs (mJAM-A/WT, mJAM-A/Y281F) in MCF7 cells stably expressing a hJAM-A shRNA under a doxycycline-regulated promoter (pEmU6-proT). Cells were left uninduced (− Dox) or were induced to express JAM-A shRNAs (+ Dox). Lysates of cells were immunoblotted with antibodies depicted below the blots. (C) Efficiency of CD81 KD in MCF7 cells stably transfected with a conditional shRNA expression vector that expresses CD81 shRNAs under a doxycycline-regulated promoter (pInducer10, TetON). (D) Efficiency of CSK KD in MCF7 cells stably transfected with a conditional shRNA expression vector that expresses CSK shRNAs under a doxycycline-regulated promoter (pTRIPZ, TetON). (E) Efficiency of JAM-A KD in MDA-MB-231 cells stably transfected with a conditional shRNA expression vector that expresses JAM-A shRNAs under a doxycycline-regulated promoter (pEmU6-proT, TetON). Source data are available for this figure: SourceData FS5.

Efficiencies of siRNA- and shRNA-mediated knockdowns and expression levels of rescue constructs. (A) Efficiency of JAM-A KD in MCF7 cells stably transfected with a constitutive shRNA expression vector (left panel), transiently transfected with a hJAM-A-specific siRNA pool (middle panel), or stably transfected with a conditional shRNA expression vector that expresses JAM-A shRNAs under a doxycycline-regulated promoter (pEmU6-proT, TetON). (B) Ectopic expression of murine JAM-A rescue constructs (mJAM-A/WT, mJAM-A/Y281F) in MCF7 cells stably expressing a hJAM-A shRNA under a doxycycline-regulated promoter (pEmU6-proT). Cells were left uninduced (− Dox) or were induced to express JAM-A shRNAs (+ Dox). Lysates of cells were immunoblotted with antibodies depicted below the blots. (C) Efficiency of CD81 KD in MCF7 cells stably transfected with a conditional shRNA expression vector that expresses CD81 shRNAs under a doxycycline-regulated promoter (pInducer10, TetON). (D) Efficiency of CSK KD in MCF7 cells stably transfected with a conditional shRNA expression vector that expresses CSK shRNAs under a doxycycline-regulated promoter (pTRIPZ, TetON). (E) Efficiency of JAM-A KD in MDA-MB-231 cells stably transfected with a conditional shRNA expression vector that expresses JAM-A shRNAs under a doxycycline-regulated promoter (pEmU6-proT, TetON). Source data are available for this figure: SourceData FS5.
Antibodies and reagents
The following antibodies were used in this study: mouse mAb anti-Abi1 clone B-12 (SC-271180, Lot #C2417; WB 1:500; Santa Cruz Biotechnology), rabbit pAb anti-pS225-Abi1 (#07-2129, Lot #2872168; WB 1:1,000; Millipore), mouse mAb anti-CD9 clone MM2-57 (CBL162, Lot #2843207, 2691299; WB 1:1,000; Millipore), mouse mAb anti-CD81 (clone JS-81, BD TL 555675, Lot #0058104; WB 1:500; TAPA1), mouse mAb anti-CSK (clone 52/Csk, BD TL 610080, Lot #5037677; WB 1:500), rabbit pAb anti-Erk1 clone C-16 (Lot #H2614; WB 1:1,000; SCBT SC-93), rabbit mAb anti-pT202/Y204-Erk1/2 (clone D13.14.4E, CST #4370, Lot #17; WB 1:1,000), mouse mAb anti FAK (clone 77/FAK, BD TL 610088, Lot #5317546; IF 1:300), mouse mAb anti-Flag M2 (F1804, IF 1:750; WB 1:1,000; SA), rabbit pAb anti-Flag (F7425, IF 1:1,000; WB 1:1,000; SA), rabbit pAb anti-GAPDH clone FL-335 (SCBT SC-25778, Lot #F0316; WB 1:2,000), goat pAb anti-GST (SA 274457701V, Lot #14246046; WB 1:2,000), mouse mAb anti-αvβ5 integrin (clone P5H9, R&D MAB2528, Lot #UVE02; IF 1:300; used to detect native αvβ5 integrin by IF and IP), mouse mAb anti β5 integrin clone 4AK (SCBT SC-130379; IF 1:200; used to detect the β5 integrin chain by Western blotting), mouse mAb anti-JAM-A (BD TL 612120, Lot #8213987; WB 1:500), rabbit pAb anti-JAM-A (Affi1561 [Peddibhotla et al., 2013], IF 1:400), rabbit pAb anti-JAM-A pY280 (Rockland #600-401-GN5, Lot #38084; WB 1:800), mouse mAb anti-Paxillin (BD TL 610052, Lot #7201859, IF 1:500; WB 1:1,000), rabbit pAb anti-pY118-Paxillin (44-722G, Lot #1927026; WB 1:500; Thermo Fisher Scientific), rabbit pAb anti-pS126-Paxillin (44-1022G, Lot #RI238603; WB 1:500; Thermo Fisher Scientific), mouse mAb anti-Rac1 (#1862341, Lot #SJ259743; WB 1:1,000; Thermo Fisher Scientific), rabbit mAb anti-c-Src (CST #2123, Lot #5; WB 1:1,000; Thermo Fisher Scientific), mouse mAb anti-c-Src clone GD11 (#05-184, Lot #DAM1658690, #DAM1647860; WB 1:1,000; Millipore), rabbit pAb anti-pY527-Src (#2105, Lot #9; WB 1:500; CST), mouse mAb anti-α-Tubulin (clone B-5-1-2, T5168, Lot #039M4769V; WB 1:25,000; SA), and mouse mAb anti-pTyr 4G10 Platinum (05-1,050, Lot #3018874; WB 1:1,000; Millipore). The following isotype-specific control antibodies were used: mouse IgG (31903; Thermo Fisher Scientific), mouse IgG1 mAb (MAB002; R&D Systems), mouse IgG2A mAb (MAB003; R&D Systems), mouse IgG2B mAb (MAB0041; R&D Systems), rabbit IgG (02-6102; Thermo Fisher Scientific). A pAb against Tyr280-phosphorylated JAM-A (Affi1550) was generated by immunizing rabbits with a synthetic peptide (GTSSKKVI[pTyr]SQPS) of human JAM-A coupled via N-linked Cys residues to KLH (Biomatik). P-Tyr280-specific antibodies were affinity-purified using the Tyr280-phosphorylated peptide, and the non-phosphorylated peptides were used as affinity probes. The following reagents were used: recombinant human VEGF (Peprotech 100-20), recombinant human vitronectin (VN; 140-09; PeproTech), rat tail type I collagen (#5153; Advanced BioMatrix), laminin (#L4544; SA), fibronectin (#F2006; SA), MEK1/2 inhibitor CI-1040 (Atriva Therapeutics), and Src inhibitor PP2 (#529573; SA). The following biotinylated peptides (Thermo Fisher Scientific) were used: Bio-mJAM-A/Cyt-WT (AA256-300 of murine JAM-A), Bio-mJAM-A/Cyt-Y281-P (AA256-300; phosphorylated at Tyr281), and Bio-mJAM-A/Cyt-S285-P (AA256-300; phosphorylated at Ser285). Reagents used for TFM were obtained from Sigma-Aldrich, unless stated otherwise.
Immunoprecipitation and Western blot analysis
For immunoprecipitations, cells were lysed in lysis buffer (50 mM TrisHCl, pH 7.4, 1% [vol/vol] Nonidet P-40 [NP-40; AppliChem], 150 mM NaCl, protease inhibitors [complete protease inhibitor cocktail; Roche], phosphatase inhibitors [PhosSTOP; Roche], and 2 mM sodium orthovanadate) for 30 min on ice and then centrifuged at 4°C. As alternatives to NP-40, Triton X-100, Brij97, or Brij98 (each at 1% vol/vol) were used as detergents to solubilize the membrane proteins. Postnuclear supernatants were incubated with 3 μg of antibodies coupled to protein A- or protein G-Sepharose beads (GE Healthcare) overnight at 4°C. Beads were washed five times with lysis buffer and the bound proteins were eluted by boiling in SDS–sample buffer/50 mM DTT. For the detection of tetraspanins CD9 and CD81 by Western blot analysis using mAbs that are sensitive to reducing agents, DTT was omitted from the SDS sample buffer, but was selectively added after heat elution of the precipitated material to the samples used for the detection of non-tetraspanin proteins. Eluted proteins were separated by SDS-PAGE and analyzed by Western blotting with near-infrared fluorescence detection (Odyssey Infrared Imaging System Application Software Version 3.0 and IRDye 800CW-conjugated antibodies; LI-COR Biosciences). For quantification of signal intensities, the integrated intensity for each band was calculated using the same software (Odyssey application software Version 3.0). Results of IP, Western blot, peptide pulldown, and phosphorylation experiments, shown in the figures, are representative of at least three independent experiments.
In vitro binding experiments
In vitro binding experiments were performed with either recombinant GST-fusion proteins purified from E. coli and immobilized on glutathione-Sepharose 4B beads (Life Technologies) or with biotinylated peptides immobilized on streptavidin beads (Sigma-Aldrich). Purification of GST fusion proteins was performed as described (Ebnet et al., 2000). For in vitro interactions the putative partner proteins (prey) were translated in vitro using the TNT T7-coupled reticulocyte lysate system (Promega Corp.) in the presence of 35[S]-labeled methionine, as described by the manufacturer. Ten microliters of the translation reactions were incubated with 3 µg of immobilized GST fusion protein or with 0.5 µg of peptide immobilized on streptavidin beads for 2 h at 4°C under constant agitation in buffer B. After five washing steps in buffer B, bound proteins were eluted by boiling for 5 min in SDS sample buffer, subjected to SDS-PAGE, and analyzed by fluorography.
In vitro kinase assays
Phosphorylation studies were performed essentially as described before (Iden et al., 2012). GST fusion proteins were coupled to glutathione-sepharose and subjected to in vitro-kinase reactions with either 3 μl recombinant active c-Src (3 U/μl; Millipore) or 10 ng recombinant active aPKCζ (1.86 U/µg; Millipore), or 3 μl recombinant active Abl1 (0.04 U/μl; Millipore). c-Src and aPKCζ incubations were performed for 25 min at 30°C in the presence of µCi γ-[32P]-labeled ATP in c-Src kinase reaction buffer (Millipore). Abl1 incubations were performed for 30 min at 30°C with 100 nmol cold ATP in Abl1 kinase reaction buffer (Millipore). After kinase inactivation (30 mM EDTA) and washing in buffer B, the recombinant proteins were analyzed by SDS PAGE and autoradiography (c-Src and aPKCζ samples) or by Western blotting with P-Tyr-specific antibodies (Abl1 samples).
Rac1 pulldown assays
Pulldown assays for active Rac1 were performed using the Active Rac1 Pulldown and Detection Kit (Thermo Fisher Scientific), according to the manufacturer’s instructions. Briefly, MCF7 cells were washed with ice-cold TBS and lysed with the lysis buffer provided and supplemented with protease inhibitor cocktail (Roche). Lysates were incubated with GST-human PAK1–PBD coupled to glutathione-sepharose beads for 1 h at 4°C under overhead rotation. After three washes with lysis buffer, proteins were eluted with hot SDS sample buffer and analyzed by SDS-PAGE and subsequent immunoblot with an antibody against Rac1. Total Rac1 levels were determined by immunoblotting equal amounts of total lysates with anti-Rac1 antibodies. Quantification of Western blot signal intensities was performed as described above. The activity levels of Rac1 were calculated by dividing the integrated intensity of active Rac1 signals by the intensity of the total Rac1 signals. Statistical significance was evaluated using unpaired, two-tailed Student’s ttest. P-values below 0.05 were considered as indicating statistical significance.
Immunofluorescence microscopy
For immunofluorescence microscopy, cells were grown on VN-coated (MCF7) or collagen-coated (HEK293T) glass slides. Cells were washed with PBS and fixed with 4% paraformaldehyde (PFA; Sigma-Aldrich) for 7 min. For permeabilization, PFA-fixed cells were incubated with PBS containing 0.5% Triton X-100 for 15 min. Cells were washed with 100 mM glycine in PBS, blocked for 1 h in blocking buffer (PBS, 10% FCS, 0.2% Triton X-100, 0.05% Tween-20, 0.02% BSA), and then incubated with primary antibodies in blocking buffer for 1 h at room temperature (RT) or overnight at 4°C. After incubation, cells were washed three times with PBS and incubated with fluorochrome (AlexaFluor488, AlexaFluor594, and AlexaFluor647)-conjugated, highly cross-adsorbed secondary antibodies (Invitrogen) for 2 h at RT. F-actin was stained using phalloidin-conjugates (FITC; TRITC and AlexaFluor647) and DNA was stained with 2,4,diamidino-2-phenylindole (DAPI; Sigma-Aldrich). Samples were washed with PBS and mounted in fluorescence mounting medium (Mowiol 4-88; Sigma-Aldrich). Immunofluorescence microscopy was performed using the confocal microscopes LSM780 and LSM800 Airyscan (both from Carl Zeiss) equipped with the objectives Plan-Apochromat ×40/1.3 oil differential interference contrast and Plan-Apochromat ×63/1.4 oil differential interference contrast (Carl Zeiss). Image processing and quantification were performed using ImageJ and Imaris (Version 9.1.2; Bitplane) software.
1D micropattern collision assays
For 1D collision assays (Scarpa et al., 2013), chips with micropatterns of linear tracks of different widths of 2.5, 5, 10, and 20 µm (CYTOOchips Motility Ax18; CYTOO INC) were used. Co-cultures of JAM-A KD MCF7 cells and WT MCF7 cells were seeded on VN-, LN-, or FN-coated micropatterned stripes at 5 × 10⁴ cells/ml. Cells were allowed to adhere to the surface for 2 h and then observed by live-cell microscopy over a period of 15 h with image acquisition at 10-min intervals. In inhibitor studies, 100 ng/ml CI-1040 or 10 μM PP2 were added to the respective samples immediately before plating. Cells growing on 1D tracks with widths of 5 µm were used for analyses. Live-cell microscopy was performed using the LSM780 (Carl Zeiss) confocal microscope equipped with a Plan-Neofluar ×20/0.5 objective at 37°C in a normal culture medium. In some cases, cells were fixed after live-cell image acquisition, stained with antibodies, and analyzed by confocal microscopy (0.36 µm sections) using a 63× Plan-Apochromat oil-immersion objective (LSM800 Airyscan). Migration velocity and track displacement of individual cells were analyzed semi-automatically using the TrackMate Plugin for ImageJ. Cell behavior after collision was categorized as follows: Type −2 (opposite migration), type −1 (anergy, i.e., stopping of migration without cell–cell contact formation), type 0 (cell–cell contact formation), and type +1 (continuous migration, i.e., migration across collided cell). Statistical analyses were performed with data from four independent experiments using unpaired, two-tailed Student’s t-tests, and data are expressed as arithmetic means ± SD.
2D collision assays
2D collision assays with JAM-A KD cells were performed by seeding co-cultures of LifeAct-mCherry-expressing WT MCF7 cells with EGFP-expressing JAM-A KD or control KD MCF7 cells at a 1:1 ratio (1.25 × 10⁴ cells cm−1 each) as single-cell suspensions on VN-coated glass slides. Cells were allowed to adhere and migrate, then fixed and analyzed by confocal microscopy. Optical sections (0.36 µm) of heterotypic cell–cell contacts were taken using the confocal microscope LSM800 Airyscan equipped with a Plan-Apochromat ×63/1.4 oil objective. The size of overlapping areas was calculated on the basis of co-localization of EGFP and mCherry fluorescence signals (co-localization-module, Imaris software, Version 9.1.2) along the acquired z-stack images (maximum intensity projections). For 2D collision assays with cells ectopically expressing Flag-tagged JAM-A constructs, JAM-A-transfected cells were mixed with non-transfected cells at a 1:1 ratio and cultured as described above. Cells were fixed and stained with antibodies against the Flag tag. Regions of overlap at heterotypic cell–cell contacts between JAM-A-transfected and non-transfected cells were analyzed by confocal microscopy using the Flag tag-based fluorescence signals. Cell collision events were divided into three categories: minor (<10% overlap), moderate (10–50% overlap), and strong (>50% overlap). Statistical analyses of the data sets obtained from JAM-A/WT- and JAM-A/E61R-K63E-expressing cells were performed using the Chi-Square test.
Mixing assays
Mixing assays were performed in analogy to what has been described for tissue explants (Theveneau et al., 2010). In brief, LifeAct-mCherry-expressing control KD or JAM-A KD MCF7 cells and LifeAct-EGFP-expressing JAM-A KD or control KD MCF7 cells were seeded in different compartments of VN-coated glass cover slides separated by a removable stamp (μ-slide 2-well; Ibidi). After the cells had reached confluency, the silicone stamp was removed to trigger collective cell migration. Twelve hours after the formation of the first contact between the two populations, the areas of overlap between the leader cells were identified by overlaying the EGFP and mCherry fluorescence signals using ImageJ software. Statistical analyses of data sets obtained from collisions were performed using the unpaired, two-tailed Student’s t test.
Single cell tracking and digital holographic microscopy
Monitoring of single cells during migration by digital holographic microscopy was performed utilizing an inverse research microscope (iMIC; Till Photonics) with an attached custom-built DHM module, essentially as described (Kemper et al., 2010). Briefly, MCF7 cells were seeded as a single-cell suspension on VN-coated µ-dishes (Ibidi). Cell migration was observed using DHM with a 20× objective (Zeiss LD Achroplan 20×/0.4 Korr) over 50 h. Tracking of individual cells was performed using a cell tracking algorithm as described (Kemper et al., 2010).
FRET assays
For the analysis of Rac1 activity at the single-cell level, MCF7 cells stably expressing JAM-A shRNAs under a doxycycline-regulated promoter (pInducer10-mir-RUP-PheS) were transduced with the Raichu-Rac1 biosensor as described (Kardash et al., 2010). Transduced cells were either analyzed at the single-cell level after VEGF stimulation (100 ng/ml) or were seeded as co-culture with WT MCF7 cells in collision assays to analyze Rac1 activity at cell–cell contacts. CFP and YFP images were recorded using a 63× Plan-Apochromat oil-immersion objective with differential interference contrast on the confocal microscope LSM800 (Carl Zeiss). FRET ratios were calculated as YFP-/CFP-fluorescence intensities using ImageJ software. FRET ratios >1.3 were considered (Kardash et al., 2010). For the analysis of FRET ratios at cell–cell contacts, grey values of FRET images reflecting specific CFP/YFP ratios were used for the calculation. Cortical areas were defined as the region encompassing 2 µm of the cytoplasm of the Raichu-Rac1-expressing cell.
Traction force microscopy
TFM was performed essentially as described (Betz et al., 2011). Chemicals were purchased from Sigma-Aldrich (Merck) unless stated otherwise. Polyacrylamide (PAA) gels of 3 kPa stiffness (according to rheology measurement protocols and confirmed by micro-indentation) were prepared by mixing 500 μl of 40% acrylamide solution, 250 μl of 2% N,N′-methylenebisacrylamide solution, and 4 μl of acrylic acid. A total of 75 μl of this solution was mixed with 415 μl of 0.6 × PBS and 10 μl of fluorescent bead solution (100 nm diameter, NH2 coated micromer-redF; Micromod). Polymerization was induced by the addition of 5 μl of 10% ammonium persulfate solution (APS) and 1.5 μl of N,N,N′,N′-tetramethylethylenediamine (Temed) to 500 µl of bead-containing acrylamide solution. Polymerized hydrogels were coated with VN by first activating the acrylic-acid in 0.2 M N-(3-dimethylaminopropyl)-N′-ethylcarbodiimide hydrochloride (EDC), 0.1 M N-hydroxysuccinimide (NHS), 0.1 M 2-(N-Morpholino) ethanesulfonic acid (MES), and 0.5 M NaCl for 15 min at room temperature, followed by washing with PBS and incubation with VN (10 µg/ml) at 37°C for 1 h. After cell addition to VN-coated hydrogels followed by incubation for 24 h, cells and beads were observed by live-cell imaging for 30 min with images being taken at 3-min or 4-min intervals. Images were acquired with a scientific CMOS camera (Prime BSI Photometrics) on an inverted microscope (Nikon Eclipse Ti-E) with a spinning disk head (CSU-W1 Yokogawa) using a CFI Plan Apo IR 60XC WI Nikon water-immersion objective with a numerical aperture of 1.27 and an excitation laser of 488 nm or 561 nm wavelengths. After recording, cells were removed by the addition of 0.5 ml 10% SDS in H2O. During all measurements, samples were kept at 37°C in a stage top microscope incubator (UNO Top Stage Incubator, H301-Mini; OKOLAB). For the analysis of traction forces, the deformation of the gel was calculated by comparing the localization of the beads with reference to the bead localization after cell detachment by applying the free form deformation method using the Elastix software (Klein et al., 2010). From the resulting displacement fields, the traction forces were determined by solving the Tikhonov regularized elasticity problem for finite thickness substrates in the Fourier domain (Del Alamo et al., 2007; Jorge-Penas et al., 2015) using a custom-made MATLAB (MathWorks) software. As recently proposed (Huang et al., 2019), Tikhonov regularization was applied using Bayesian theory together with an estimation of background variance of the displacement field to provide a less subjective and a more stable semi-automated choice of the regularization parameter. Evaluation of average traction forces and strain energies was restricted to a region defined by a mask (dilated by 20 pixels to ensure full coverage) created from the fluorescence signal of each cell.
Atomic force microscopy
A total of 5 × 10⁴ MCF7 cells were seeded onto VN-coated glass-bottom tissue culture dishes (WillCo Wells B.V.) and allowed to attach overnight. Before mechanical probing, the cultivation medium was replaced with HEPES-buffered RPMI-1640 medium (Merck), and the cells were allowed to equilibrate for 20 min in CO2-free atmosphere. Mechanical probing was performed with the NanoWizard 3 AFM driven by “JPK NanoWizard Control” v5.0.134 software. Silicon no-reflex cantilevers with a nominal spring constant of 0.03 N/m functionalized with a 10 µm polystyrene sphere (Novascan Technologies, Inc.) were used for probing. The lack of reflex coating ensures a stable, noise-free tip-sample contact during confocal imaging. Deflection sensitivity was calibrated before each experiment and was found to be consistently uniform throughout the entire experimental series. Lateral positioning of the AFM probe with respect to the cells was assisted by optical imaging with Leica SP8 confocal laser scanning microscope equipped with a hybrid detection system for photon counting and an HC PL Apo CS2 63× NA 1.4 oil immersion objective (Leica). The position of the cantilever was determined by imaging in reflection mode. Mechanical probing was performed at the maximal loading force of 1 nN and a loading rate of 2 µm/s. Ten consecutive probing cycles were performed for each cell at each experimental condition. The resulting force–distance curves were analyzed with the JPK Data Processing v. spm-5.0.134 software. Cell deformation values were used for calculating the elastic moduli using the Hertz model for a spherical indenter. Mean values of elastic moduli of control cells obtained during each respective experiment were used to normalize the data. For statistical analysis, dependent 2-group Wilcoxon signed rank test was applied to the normalized probing data of control vs. JAM-A KD cells.
Statistics
Results are expressed either as arithmetic means ± SD as indicated. To test the normality of data sample distributions, the D’Agostino-Pearson normality test was used. Data were statistically compared using unpaired, two-tailed Student’s t test, or probed for being statistically different from a fixed value using the one sample t test. If not-normally distributed, non-parametric, Mann–Whitney U test was used. Frequency distributions were compared using Chi-Square tests. AFM data were analyzed using Wilcoxon signed-rank test. Statistical analyses were performed using GraphPad Prism version 6 (GraphPad Software). P-values are indicated as follows: *, P < 0.05; **, P < 0.01; ***, P < 0.001; and ****, P < 0.0001.
Online supplemental material
Fig. S1 provides additional evidence supporting the presence of JAM-A, tetraspanins CD9 and CD81, and αvβ5 intergin in a tetraspanin-based multimolecular complex. Fig. S2 displays quantifications of Western blot data shown in Fig. 4, C, F, G, and H, immunofluorescence analysis of paxillin localization in MCF7 cells grown on linear micropatterns, paxillin Western blot data and their quantification in the presence of inhibitors for Src activity (PP2) and Erk1/2 activity (CI-1040), and cell size changes after the depletion of JAM-A. Fig. S3 displays the characterization of a P-Tyr280 JAM-A-specific antibody. Fig. S4 provides further evidence for tetraspanins CD9 and CD81 as negative regulators of MCF7 single-cell migration. Fig. S5 shows knockdown efficiencies of siRNAs and shRNAs used in the study. Videos 1 and 2 show the dynamic localization of JAM-A at membrane protrusions in MCF7 and HEK293T cells. Videos 3, 4, 5, and 6 show the different types of CIL behavior observed in MCF7 cells grown on micropatterned substrates.
Acknowledgments
We acknowledge the following researchers: Drs. Francisco Cruzalegui and Michael Burbridge (Institut de Recherches Servier, Croissy sur Seine, France) for plasmids encoding Src/WT, Src/K298M and Src/Y530F; Dr. Karl Matter (University College London, UK) for pEmU6proT plasmids for inducible shRNA expression; Dr. Hans Schnittler (Institute of Anatomy and Vascular Biology, University of Münster, Germany) for pFUGW-LifeAct-eGFP; Dr. Henner Farin (Georg-Speyer-Haus, Institute for Tumor Biology and Experimental Therapy, Frankfurt am Main, Germany) for pLV-PGK-LifeAct-mCherry-Puro; Dr. Martin Götte (Department of Gynecology and Obstetrics, Münster University Hospital, Münster, Germany) for providing us with MDA-MB-231 cells; and Dr. André Schreiber, Institute of Molecular Virology, ZMBE, University of Münster) for providing Erk1/2 inhibitors. We thank Steffi Ketelhut (Biomedical Technology Center of the Medical Faculty, University of Münster) for expert technical assistance in DHM imaging; Dr. Celeste Brennecka, Science Writing Support, University of Münster, for help with manuscript editing.
This work was supported by grants from the Deutsche Forschungsgemeinschaft (EB 160/7-1, EXC1003-CiM FF-2016-1, SFB1348/A04) and from the Medical Faculty of the University of Münster (IZKF Eb2/020/14, MedK 17-0075).
The authors declare no competing financial interests.
Author contributions: D. Kummer, T. Steinbacher and K. Ebnet conceived the study. D. Kummer, T. Steinbacher, S. Thölmann, M.F. Schwietzer, C. Hartmann, S. Horenkamp, S. Demuth, S.S.D. Peddibhotla, F. Brinkmann, B. Kemper, M. Brandt, I. Liashkovich and L. Greune performed experiments. D. Kummer, T. Steinbacher, S. Thölmann, M.F. Schwietzer, C. Hartmann, S. Horenkamp, B. Kemper, J. Schnekenburger, M. Brandt, T. Betz, I. Liashkovich, I.U. Kouzel, V. Shahin, V. Gerke, and K. Ebnet analyzed the data. L. Greune, M.A. Schmidt, N. Corvaia, K. Rottner, K. Tarbashevich and E. Raz provided reagents and analyzed the data. D. Kummer, T. Steinbacher, S. Thölmann and K. Ebnet wrote the manuscript.

