Skip to article sections

Chromosome segregation is mediated by microtubule-based machinery, the spindle. Microtubule-independent structures, often called the spindle matrix or the spindle envelope, have been reported to embed or surround the spindle, respectively. The concepts have been around for several decades, but they still remain enigmatic. Here, we show the spindle matrix and the spindle envelope form one functional unit crucial for spindle structure and function in oocytes. We found that in Drosophila oocytes, Slender lobes (Sle) protein is an integral component of the spindle matrix, which has a composition different from that in mitotic cells. We further found that Greatwall (Gwl) kinase localizes to the spindle envelope tightly surrounding the Sle spindle matrix in oocytes. Gwl promotes assembly of the Sle spindle matrix, which in turn determines the location of the Gwl spindle envelope. sle silencing in oocytes resulted in spindle abnormalities. Cosilencing experiments revealed that Sle buffers the impacts of compromised kinetochore–microtubule interaction on centromere bi-orientation in meiotic metaphase I.

In oocytes, the spindle is formed without centrosomes, the main microtubule-organizing centers in mitosis, and also within a large cytoplasmic volume (Dumont and Desai, 2012; Ohkura, 2015; Kyogoku and Kitajima, 2023). This lack of spatial constraints makes spindle formation challenging in oocytes. The spindle consists of microtubules and their associated proteins. However, some evidence suggests that the spindle is embedded in a microtubule-independent structure or substance, often called the spindle matrix (Pickett-Heaps et al., 1997; Tsai et al., 2006; Johansen and Johansen, 2009; Ma et al., 2009). The spindle matrix potentially provides a local environment that promotes the spindle assembly and stability, but its existence, composition, regulation, and function are still elusive.

The idea of a spindle matrix was first proposed more than half a century ago as a hypothetical microtubule-independent structure that can exert a force on the spindle (Forer, 1965; Goldman and Rebhun, 1969; Pickett-Heaps et al., 1997). Definitions and terminologies of the spindle matrix vary or are loosely used based on the observations in different systems by different research groups (Walker et al., 2000; Tsai et al., 2006; Lince-Faria et al., 2009; Johansen et al., 2011). Spindle matrices observed by different researchers may not necessarily be identical or equivalent structures. Furthermore, a similar term, the spindle envelope, is sometimes used interchangeably for the spindle matrix, or sometimes for a similar but different structure that surrounds the spindle (Civelekoglu-Scholey et al., 2010; Zheng, 2010; Schweizer et al., 2015). As they have not been studied in the same cell, their relationship is unclear. In this report, we use the terms, the spindle matrix and the spindle envelope, purely by their microtubule-independent localization without functional implications. The spindle matrix is a structure or substance that localizes to the spindle and broader areas of the spindle, while the spindle envelope is one that surrounds the spindle without concentration on the spindle itself.

Multiple hypotheses have been proposed for roles of the spindle matrix or envelope (Lee and Wadsworth, 2009; Johansen and Johansen, 2009; Zheng, 2010; Johansen et al., 2011; Schweizer et al., 2014; Woodruff, 2018; Huang et al., 2018).

For example, it may act as a barrier or substance that accumulates or excludes some molecules or organelles to promote the spindle assembly/stability (Schweizer et al., 2015). Alternatively, it may act as an elastic envelope or substance to mechanically contribute to the force balance within the spindle (Civelekoglu-Scholey et al., 2010). So far, there is no definitive proof to support or exclude a certain hypothesis, and it may well have multiple functions, or have different functions in different systems.

Some molecular studies of the spindle matrix have been carried out in Xenopus egg extract and in Drosophila mitotic cells. In Xenopus egg extract, the lamin B matrix was found to be associated with spindles formed around Aurora A beads. Its association depends on Ran-GTP but not microtubules. It contains other proteins important for spindle assembly, such as NuMA, kinesin-5 Eg5, XMAP215, and their association with the matrix depends on lamin B but not microtubules (Tsai et al., 2006). The conserved protein BuGZ was also found to be associated with the lamin B matrix independently of microtubules and important for the association of the other spindle-associated proteins with the lamin B matrix (Tsai et al., 2006). BuGZ itself can phase-separate and bind to microtubules (Jiang et al., 2015). However, BuGZ does not show spindle localization in mouse oocytes (So et al., 2019).

In Drosophila mitotic cells, four proteins have so far been identified as spindle matrix components, namely, Skeletor (Skel), Chromator (Chro), Megator (Mgtor), and Enhanced adult sensory threshold (East) (Walker et al., 2000; Rath et al., 2004; Qi et al., 2004; Qi et al., 2005). All of them localize to the nucleus during interphase, although they are not all in the same nuclear compartment (Johansen and Johansen, 2007). Skel and Mgtor were shown to maintain a spindle-like structure after microtubule depolymerization (Walker et al., 2000; Qi et al., 2004). Chro was shown to directly interact with microtubules (Yao et al., 2014). Some of the proteins (Skel-Chro, Mgtor-East) were shown to physically interact with each other (Rath et al., 2004; Qi et al., 2005), although localization dependencies among these proteins were not reported. Loss of these proteins caused different abnormalities in microtubule assembly, chromosome dynamics, and the spindle assembly checkpoint (Johansen and Johansen, 2009). Separately, in Drosophila oocytes, Aberrant X segregation (Axs) with a transmembrane domain surrounds the meiotic spindle. An Axs dominant mutation results in high frequencies of shorter spindles, chromosome misalignment, and achiasmatic chromosome nondisjunction (Kramer and Hawley, 2003).

So far, only limited studies have been carried out on the spindle matrix or the spindle envelope, which remain enigmatic. Here, we report identification of Slender lobes (Sle) as an integral component of the spindle matrix and the conserved kinase Greatwall (Gwl) as a spindle envelope protein in Drosophila oocytes. We found that Gwl is important for assembly of Sle into the spindle matrix, which in turn determines the location of the Gwl spindle envelope. We further show that Sle is important for the structure and function of the meiotic spindle in oocytes.

Sle is a component of the spindle matrix in meiotic oocytes

Previously, we have identified microtubule-associated proteins regulated by the phospho-docking protein 14-3-3 from Drosophila ovary extract (Repton et al., 2022). By GFP tagging, we found that one of them, the Sle protein, showed spindle-like localization in mature oocytes, which undergo programmed arrest at meiotic metaphase I. sle was originally identified as a mutant defective in brain development in Drosophila, and shown to encode a nucleolar protein lacking recognizable functional domains (Orihara-Ono et al., 2005). This study also reported its localization to the mitotic spindle without further analysis.

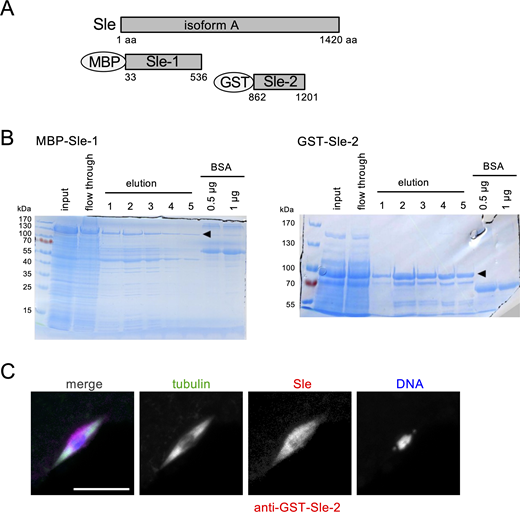
To determine the localization of the endogenous Sle protein relative to the spindle microtubules, we generated antibodies against two nonoverlapping regions of Sle (Fig. S1) and used them to immunostain mature oocytes together with an α-tubulin antibody. Both of the Sle antibodies showed that Sle localization largely overlaps with the spindle microtubules, and strikingly that the localization was often broader (by a median of 0.53 μm) than the spindle defined by tubulin signals (Fig. 1, A and B; and Fig. 7 I; and Fig. S1).

To test whether the Sle localization depends on microtubules, we depolymerized microtubules by cold treatment and then immunostained oocytes for α-tubulin, Sle, and kinesin-14 Ncd. Kinesin-14 Ncd was used as a control representing a conventional microtubule-associated protein. After cold treatment, spindle microtubules were depolymerized and kinesin-14 Ncd was diffused, while Sle still occupied an area around the chromosomes (Fig. 1 C). The total signal intensity of Sle was not significantly reduced, while α-tubulin and kinesin-14/Ncd signal intensities dropped to the background levels (Fig. 1 D). The area occupied by Sle was still elongated, although the long axis was shortened (Fig. 1 E).

Therefore, Sle forms or associates with a structure/substance that can be maintained independently of microtubules, which we refer to here as the Sle spindle matrix.

Sle localizes to the nucleus in meiotic prophase, but is reassembled to the spindle after nuclear envelope breakdown in oocytes

Several components of the spindle matrix have been identified in Drosophila mitosis (Walker et al., 2000; Rath et al., 2004; Qi et al., 2004; Qi et al., 2005). All of them localize to the nucleus during interphase, and in mitosis, the spindle matrix forms in the region where the nucleus was previously located. Therefore, the spindle matrix may be just a remnant of the nuclear materials not diffused after nuclear envelope breakdown (NEBD). In meiotic prophase I in oocytes, Sle also localizes to the nucleoplasm (Fig. 2 A and Fig. 3 C). However, the oocyte nucleus is much larger than the meiotic spindle (30–40 μm vs 10–15 μm), suggesting active assembly or stabilization of Sle into the spindle matrix in oocytes. To determine the assembly dynamics, we live-imaged oocytes expressing GFP-Sle and a chromosomal marker (Rcc1-mCherry) (Fig. 2 A).

Before NEBD, GFP-Sle accumulated in the large prophase I nucleus, while Rcc1-mCherry distributed weakly and uniformly in the nucleoplasm with a high concentration on the compactly clustered chromosomes. Once the nucleus started to break down, Rcc1-mCherry in the nucleoplasm diffused quickly within 10 min. In contrast, GFP-Sle appeared to remain more concentrated in the collapsing nucleus for much longer (∼40 min after NEBD) before it fully diffused (Fig. 2 B; Fig. S2). Sle began accumulating around the chromosomes and grew into a spindle-like shape 11.0 ± 1.2 min (mean ± SD, n = 4) after the start of the NEBD (Fig. 2 A). This timing roughly corresponds to the assembly of spindle microtubules in oocytes (Colombié et al., 2008; Głuszek et al., 2015; Costa and Ohkura, 2019).

This dynamic suggests that the Sle protein in the prophase nucleus is in a form that is only slowly diffusible. Furthermore, Sle is actively recruited or selectively stabilized on the spindle region after NEBD, rather than simply a remnant of the nuclear Sle.

Sle in the spindle matrix is dynamic

To test molecular dynamics of Sle, we carried out fluorescence recovery after photobleaching (FRAP) in metaphase I oocytes expressing GFP-Sle (Fig. 2 C). GFP-Sle within a half of the spindle matrix was photobleached, and recovery of the fluorescence was monitored over time (Fig. 2 D). The kymograph showed that fluorescence recovery in the bleached half started and spread from the region closest to the unbleached half. This recovery of fluorescence in the bleached half was compensated mainly by a reduction in the unbleached half. This shows that Sle is dynamically exchanged within the spindle matrix.

To estimate the exchange of Sle between the spindle matrix and the ooplasm, the total fluorescence of the whole spindle matrix including both bleached and unbleached halves was measured over time after photobleaching a half of the spindle matrix. The total fluorescence in the whole spindle matrix slowly recovered, indicating that Sle exchanges predominantly within the spindle matrix but also with the ooplasm (Fig. 2 D). This slow exchange of Sle between the spindle matrix and the ooplasm was further confirmed by FRAP of the whole spindle matrix (Fig. 2 E). These FRAP studies revealed the dynamic nature of Sle in the spindle matrix.

The composition of the spindle matrix in oocytes differs from mitotic cells

Several components of the spindle matrix have been identified in Drosophila mitosis (Walker et al., 2000; Rath et al., 2004; Qi et al., 2004; Qi et al., 2005). To determine whether the composition of the spindle matrix differs between mitotic cells and meiotic oocytes, Sle was first co-immunostained with two known spindle matrix proteins in mitosis, Chro and Mgtor, in the Schneider’s 2 (S2) cell line (Fig. 3, A and B). Sle colocalized with these two proteins in metaphase, showing Sle is a spindle matrix protein also in mitosis (Fig. 3, A and B; and Fig. S2 E). In meiotic prophase I, the same antibodies against Chro and Mgtor gave clear signals in the nucleoplasm and on the nuclear rim, respectively (Fig. 3, C and D), as expected from their localization in mitotic cycles (Fig. 3, A and B; Qi et al., 2004; Rath et al., 2004). In contrast, in metaphase I oocytes, neither gave clear signal concentration on or around the spindle (Fig. 3, C and D; and Fig. S2 E). To exclude a possibility of technical issues during immunostaining, we live-imaged oocytes expressing GFP-Chro or GFP-Mgtor together with the chromosomal marker Rcc1-mCherry. We did not observe detectable spindle-like signals in either case (Fig. 3, E and F). These results showed that the spindle matrix in oocytes has a different composition from that in mitotic cells, but Sle is a component of the spindle matrix in both cell types.

Sle is important for the spindle architecture in oocytes

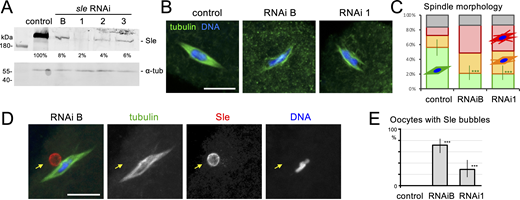
To find out the function of Sle in oocytes, we have generated three transgenic lines expressing shRNA against different regions of the sle gene, in addition to a line available publicly. We used a maternal α-tubulin driver (V37), which allows expression of shRNA after completion of mitosis and recombination in female germlines. A western blot showed that all 4 RNAi lines successfully depleted over 90% of the Sle protein in ovaries (Fig. 4 A).

sle null mutant females were reported to have underdeveloped ovaries (Orihara-Ono et al., 2005). We found that females from all of the sle RNAi lines produced mature oocytes, allowing us to study the role of Sle beyond early oogenesis. The females are nearly infertile and lay eggs that show defects in syncytial mitotic divisions (Fig. S2, B–D).

To define the role of Sle in meiotic spindle formation, we immunostained mature oocytes from the most depleted line (RNAi 1) and modestly depleted line (RNAi B), together with a control without RNAi (Fig. 4, B and C). In the control, most meiotic spindles had a bipolar spindle with focused poles. In both RNAi lines, most spindles had bipolar shapes with split poles or microtubule bundles branching out from the sides of the spindle. Therefore, Sle is important for the proper architecture of the metaphase I spindle in oocytes.

When Sle was depleted, Sle signal was lost from the spindle, but interestingly showed “bubble-like” structures near the meiotic spindle (Fig. 4 D). The Sle signal intensity inside of the bubbles was much lower than at the rim. Sle bubbles were mostly spherical, but some were elongated. The frequency of oocytes with Sle bubbles was high (72%) in the modestly depleted line, and low (28%) in the most depleted line (Fig. 4 E). In control oocytes without RNAi, such structures were not observed even when signal brightness was enhanced. Therefore, Sle behaves in a dose-dependent manner: at high levels, it forms or localizes to the spindle matrix; at low levels, it instead forms or localizes to a bubble-like structure.

Sle buffers the effects of compromised kinetochore–microtubule interaction

The above results showed that Sle is important for spindle architecture. To determine the role of Sle in spindle function, we visualized positions of centromere 3 in metaphase I by fluorescence in situ hybridization (FISH). In control metaphase I, each pair of sister centromeres stayed attached, but homologous centromeres were pulled apart toward opposite poles (bi-oriented; Fig. 5 A). sle silencing did not increase the frequency of homologous centromeres that located closely or on one side of the chromosome mass (mono-oriented; Fig. 5A). Therefore, Sle appears dispensable for separation of homologous centromeres in metaphase I. Sle is important for normal spindle structure, but may play no role in spindle function to bi-orient or separate centromeres. Alternatively, a Sle function may be hidden by another protein/pathway.

To reveal a function potentially hidden by another protein/pathway, sle was cosilenced together with other genes (Fig. 5 B). We selected genes that have known or possible functions in spindle structure or chromosome segregation. FISH of the centromere 3 was used to compare mature oocytes expressing shRNA against one of the genes with oocytes co-expressing shRNAs against sle and this gene (Fig. 5 C). In most cases, cosilencing of sle did not significantly increase the frequency of mono-oriented centromeres compared with single silencing. In contrast, cosilencing of sle dramatically increased the frequency of mono-oriented centromeres caused by silencing of Cenp-meta (cmet) from 16% to 59%, and also significantly increased the frequency caused by silencing of Ndc80 from 16% to 34% (Fig. 5, C and D). Both encode kinetochore proteins, but Cmet (the Drosophila Cenp-E ortholog) mediates lateral interaction with microtubules, while Ndc80 mediates end-on attachment (Radford et al., 2015). This suggests that the role of Sle may not be specific to a particular kinetochore protein, but may be more general to ensure proper spindle–chromosome interaction. Spc105R is also a kinetochore protein, but mono-orientation in single spc105R RNAi may be already too frequent to see an enhancement. In summary, although Sle is dispensable for bi-orienting homologous centromeres, it becomes crucial when kinetochore–microtubule interaction is compromised. This suggests that the Sle spindle matrix may act as a safety net rather than as an indispensable structure. Further studies are required to clarify the precise role of the Sle spindle matrix.

The Sle spindle matrix is tightly surrounded by the spindle envelope containing Gwl kinase

Next, we asked how Sle is regulated. A hint came from our separate cytological screen for kinases or phosphatases that localize to the spindle area. In this screen, we live-imaged GFP-tagged proteins expressed from transgenes in metaphase I oocytes. Among them, GFP-Gwl showed a hollow spindle-like localization (Fig. 6 A). Gwl is a conserved serine/threonine kinase, which suppresses PP2A-B55, a major phosphatase counteracting Cdk1, in mitosis/meiosis (Castro and Lorca, 2018). Immunostaining with a newly generated Gwl antibody (Fig. S3, A and B) confirmed that the endogenous Gwl also surrounds the spindle (Fig. 7 A). Due to this and microtubule-independent localization described below, we refer to the structure or substance highlighted by Gwl as the Gwl spindle envelope in Drosophila oocytes. Previously, Axs was reported to surround the meiotic spindle in oocytes (Kramer and Hawley, 2003). Live imaging of Axs-GFP and mCherry-Gwl co-expressed in oocytes showed that they colocalize in metaphase I (Fig. 6, D and E).

No previous studies have simultaneously visualized both the spindle matrix and spindle envelope. To determine the relative localization, we immunostained oocytes expressing GFP-Gwl with antibodies against GFP, Sle, and tubulin, as well as wild-type oocytes with antibodies against Gwl, Sle, and tubulin. We found that Gwl tightly surrounded Sle, although Gwl and spindle microtubules had gaps between them in half of the oocytes (Fig. 6, A–C, Fig. 7 A, and Fig. 8 B).

To further test a relationship between the Sle spindle matrix and the Gwl spindle envelope, we depolymerized microtubules by cold treatment. The Sle spindle matrix remained as a mass around the chromosomes, as described previously (Fig. 1 C; Fig. 7 B). Gwl still tightly surrounded the Sle spindle matrix (Fig. 7 B). This suggests a close relationship between the locations of the Sle spindle matrix and the Gwl spindle envelope.

Gwl promotes the assembly of the Sle spindle matrix in oocytes

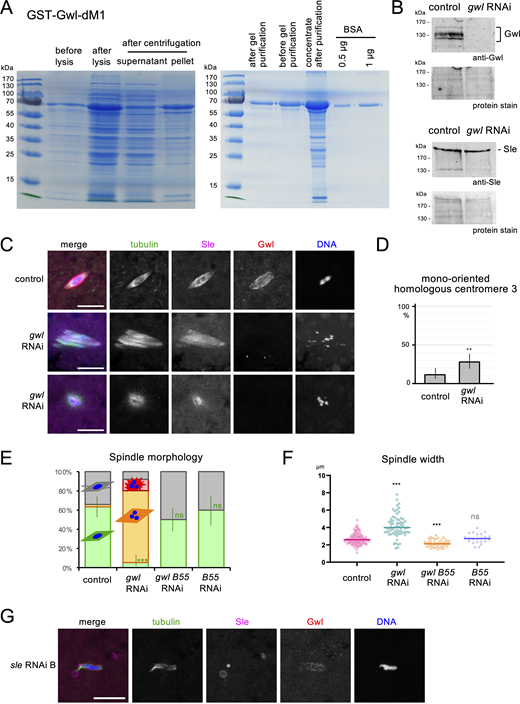
These complementary localizations suggest a close relationship, but did not distinguish whether the Gwl spindle envelope defines the location of the Sle spindle matrix or vice versa. First, to determine the role of Gwl in the Sle spindle matrix, gwl was silenced by RNAi in oocytes (Fig. 7 and Fig. S3). The spindle often became wider or disorganized, and homologous centromeres were frequently mono-oriented (Fig. 7 C and Fig. S3, C–F). The broader defects in gwl silencing than sle silencing are likely because Gwl regulates multiple pathways in mitosis/meiosis (Castro and Lorca, 2018). Interestingly, Sle localization appeared to mirror more closely to the spindle microtubules (Fig. 7 C), rather than the wider localization often seen without gwl silencing (Fig. 7 A). This was confirmed by a quantitative comparison between the widths of Sle and the spindle (Fig. 7 I). After microtubule depolymerization by cold treatment, Sle collapsed onto the chromosomes and only occupied a small region around the chromosomes (Fig. 7 D). Quantitative analysis confirmed that gwl silencing dramatically reduced the area occupied by Sle and the total Sle signal intensity around the chromosomes compared with the control (Fig. 7, J and K). A western blot showed that gwl silencing did not alter the amount of Sle in ovaries (Fig. S3 B). In conclusion, Gwl kinase is not required for Sle localization to spindle microtubules, but is important for the full formation of the Sle spindle matrix.

The major downstream pathway of Gwl is to suppress the protein phosphatase PP2A-B55 (Tws) via phosphorylation of Endos in various animals including Drosophila (Rangone et al., 2011; Wang et al., 2013; García-Blanco et al., 2019). If Sle is regulated by this pathway, the defects seen in gwl silencing are caused by hyperactivation of PP2A-B55, and therefore can be rescued by downregulation of PP2A-B55. To test this possibility, PP2A-B55 was cosilenced with gwl by expressing two shRNAs in oocytes. We found that cosilencing of PP2A-B55 restored normal Sle localization in gwl-silenced oocytes both with and without cold treatment (Fig. 7, E, F, and I–K). This demonstrates that Gwl kinase promotes the assembly/stability of the Sle spindle matrix through suppression of PP2A-B55 in oocytes.

Sle is an integral component of the spindle matrix, which determines the localization of the Gwl spindle envelope in oocytes

Next, to determine the role of Sle in the Gwl spindle envelope, sle was silenced in oocytes by RNAi (Fig. 8, A–D). Gwl still surrounded the spindle microtubules, but appeared to localize more tightly to the spindle in contrast to the no-RNAi control where gaps were often observed (Fig. 8 A). Gwl did not surround Sle bubbles (Fig. S3 G). Quantitative analysis confirmed that sle silencing significantly reduced the width of the Gwl-surrounded area compared with the spindle width (Fig. 8 B). When microtubules were depolymerized by cold treatment, Gwl collapsed onto the chromosomes and often appeared less organized in sle-silenced oocytes (Fig. 8 C) in contrast to the control where Gwl surrounded a larger area highlighted by Sle. Quantitative analysis confirmed that Gwl localized much closer to the chromosomes (Fig. 8 D).

This demonstrates that the Sle spindle matrix, spindle microtubules, and the chromosomes determine the location of the Gwl spindle envelope, whichever is the furthest out. Crucially, in the absence of microtubules, Sle depletion dramatically decreased the area surrounded by Gwl (which is normally occupied by the Sle spindle matrix). This suggests that Sle is important for the integrity of the spindle matrix, rather than simply associating with it without a structural role.

Historically, the study of the spindle structure and function centers around microtubules. Microtubule-independent structures, such as the spindle matrix and the spindle envelope, have been often overlooked (Kline-Smith and Walczak, 2004; Ferreira and Maiato, 2021; Valdez et al., 2023). In this study, we identify Sle as an integral component of the spindle matrix, and the Gwl kinase as a spindle envelope protein in metaphase I oocytes of Drosophila. We further showed that the Sle spindle matrix determines the location of the Gwl spindle envelope, and in turn, Gwl promotes assembly of the Sle spindle matrix. Sle is important for the spindle architecture but dispensable for bi-orientation of homologous centromeres in metaphase I oocytes. However, Sle becomes crucial for bi-orienting homologous centromeres when kinetochore–microtubule interaction is suboptimal.

Sle localizes not only to the spindle, but also to a wider area surrounding it. Furthermore, even after microtubules are depolymerized by cold treatment, Sle still occupies a sizable area around the chromosomes in oocytes. The Sle spindle matrix can be maintained independently of microtubules. At the same time, it interacts with spindle microtubules, as it shrinks on microtubule depolymerization. Live imaging in oocytes revealed that Sle is selectively stabilized or actively recruited to the spindle matrix, rather than simply failing to diffuse from the nucleus after NEBD. FRAP analysis also uncovered the dynamic nature of Sle in the spindle matrix in metaphase I. Exchanges of Sle take place mainly within the spindle matrix but also between the spindle matrix and the ooplasm. The composition of the spindle matrix in oocytes differs from mitosis. Sle is a common component for both, while Chro and Mgtor appear specific to the mitotic spindle matrix. Functional studies of mitotic spindle matrix proteins in oocytes are required to clarify involvement of these proteins in oocytes.

We also found that Gwl kinase localizes like the spindle envelope in oocyte meiosis. It colocalizes with Axs, a transmembrane protein previously reported to localize to a structure surrounding the spindle in oocytes (Kramer and Hawley, 2003). The spindle envelope and the spindle matrix have not been studied simultaneously in the same cell before. Our study shows that the Sle spindle matrix and the Gwl spindle envelope are interdependent (Fig. 8, E and F). Gwl kinase promotes assembly of Sle into the spindle matrix through suppressing PP2A-B55. Conversely, the location of the Gwl spindle envelope is determined by the Sle spindle matrix. The Gwl spindle envelope is located on the surface of the Sle spindle matrix. When Sle was depleted, the Gwl spindle envelope collapsed onto the spindle, and further onto the chromosomes upon microtubule depolymerization. Therefore, localization of the Gwl spindle envelope is determined first by the Sle spindle matrix; if it is missing, by the spindle microtubules; if both are missing, by the chromosomes.

Another important implication can be drawn from the observation that Sle depletion reduced the area surrounded by the Gwl spindle envelope (normally occupied by the Sle spindle matrix). This indicates that Sle is important for integrity of the spindle matrix in oocytes, rather than simply associating with the spindle matrix formed by other proteins. In other words, Sle is an integral component of the spindle matrix. Sle is a large protein mostly made of intrinsically disordered regions, and does not appear to be conserved beyond insects at the primary sequence level. FRAP analysis revealed that Sle exchanges predominantly within the spindle matrix but also slowly with the ooplasm. This might suggest that Sle assembles into the spindle matrix by forming viscous liquid-like condensates. Identification of Sle as an integral component is a crucial step for the study of the spindle matrix. Our study paves a way for functional evaluation, biophysical study, and in vitro reconstitution of the spindle matrix.

Gwl kinase is dispensable for Sle localization to spindle microtubules, but crucial for formation of the Sle spindle matrix. The surface of the Sle spindle matrix has a high concentration of Gwl kinase that promotes the assembly of the spindle matrix. As the surface is the place where assembly and disassembly of the spindle matrix likely take place, this Gwl localization on the surface may help the spindle matrix to assemble efficiently and resist disassembly or prevent diffusion (Fig. 8 F). A first step to test this hypothesis would be to clarify whether Gwl localization is important for these functions. We showed that Gwl kinase promotes assembly of the spindle matrix by suppressing the activity of protein phosphatase PP2A-B55. Therefore, the Sle spindle matrix assembly/disassembly is regulated by a balance between activities of an as yet unidentified kinase and this phosphatase. Cdk1 may be a prime candidate for this kinase, as PP2A-B55 is generally considered to be a major phosphatase to counteract Cdk1 (Castro and Lorca, 2018). Identifying the critical substrate, phospho-sites, and the kinase would be a crucial step to advance our limited understanding of the spindle matrix assembly.

Our study showed that Sle is important for the normal architecture of the metaphase I spindle in oocytes. After depleting Sle, despite structural defects, the spindle can still bi-orient homologous centromeres in meiotic metaphase I. Strikingly, when kinetochore–microtubule interaction is compromised, Sle becomes crucial for centromere bi-orientation. Due to the lack of centrosomes and the large volume of oocytes, dynamics of the spindle and the chromosomes depend on each other. This mutual dependency potentially makes them vulnerable to an internal or external disturbance. The microtubule-independent spindle matrix may act as a buffer to prevent them from spiraling out of control. Considering it as a safeguard, rather than as an essential structure, may be a more fruitful way to understand the spindle matrix. Further studies are required to clarify the precise role of the spindle matrix.

The spindle matrix and the spindle envelope have been known for decades, but a comprehensive understanding has eluded researchers. This study presents a new integrated framework to understand these two microtubule-independent structures as one functional unit in oocytes. Oocytes have an exceptionally large volume and lack a spatial landmark, the centrosome. The spindle matrix and the spindle envelope could help to generate a local environment favorable for spindle stability and function. Our study revealed their roles and functional relationship in Drosophila oocytes, and provides a conceptual and molecular basis for future studies.

Drosophila techniques and genetics

Standard fly techniques were used throughout (Ashburner et al., 2011). All fly lines were maintained at 18°C on maize-based food and transferred to new vials every 4 wk. Working stocks were maintained at 25°C and transferred to new vials or bottles every 2 wk. All crosses were carried at 25°C, with the number of females doubling the number of males. For dissection, progeny were collected on the 10th day after crossing, and females were matured for 3 days (dissected on the 13th day after crossing) with half the number of males and additional dried yeast.

To depolymerize microtubules in oocytes, cold treatment was carried out as described previously (Romé and Ohkura, 2018). Matured flies were left in tubes at 4°C in a fridge or in a metal block on ice for 4 h before ovaries were dissected in cold methanol.

To drive RNAi, y w; P{matα4-GAL4-VP16}V37 females were crossed with y w; UASp-shRNA males or w1118 males as a control. sle RNAi 1 was used to silence sle unless otherwise stated. To express GFP-tagged protein with Rcc1-mCherry for live imaging, y w; P{matα4-GAL4-VP16}V37 {matα4-Rcc1-mCherry}::VK27 females (Costa and Ohkura, 2019) were crossed with y w; GFP-XX males, except FRAP analysis where P{nos-GAL4-VP16}MVD1 females were crossed with matα4-GFP-Sle {matα4-Rcc1-mCherry}::VK27 males.

The following fly stocks were obtained from Bloomington Drosophila Stock Center: y w; P{matα4-GAL4-VP16}V37 (RRID:BDSC_7063), w1118; P{w[+mC]=GAL4::VP16-nanos.UTR}CG6325[MVD1]/TM3, Sb (RRID:BDSC_4937), y sc v sev; P{y+v+=TRiP.HMS01578}attP2 (tws/PP2A-B55 RNAi; RRID:BDSC_36689), and y sc v sev; P{y+v+=TRiP.HMS00766}attP2 (sle RNAi B; RRID:BDSC_32969).

Molecular methods

Standard molecular techniques (Sambrook, 1989) were used. The following recombinant DNA techniques were used for plasmid construction according to the manufacturers’ instructions: Gibson assembly (HiFi DNA Assembly; New England Biolabs), Gateway technology using LR Clonase II (Invitrogen), BP Clonase II (Invitrogen), Sanger sequencing (carried out by Genewiz), PCR using PrimeSTAR (Takara Bio) or Taq polymerase (Roche), and ligation using restriction enzymes (New England Biolabs) and T4 DNA ligase (New England Biolabs). Oligonucleotides were synthesized by IDT.

Proteins were analyzed by SDS-PAGE with a molecular weight marker (PageRuler 10–180 kDa; Thermo Fisher) and stained with InstantBlue Coomassie Protein Stain (Abcam). For western blotting, ovaries from 3-day-old mature females were dissected in methanol and rehydrated in PBS, homogenized, and incubated at 95°C for 3 min in the SDS sample buffer with 5% β-mercaptoethanol. A sample equivalent to one ovary was loaded to each lane for SDS-PAGE. Proteins were blotted onto nitrocellulose membranes (Protran; Whatman) and stained with Pierce Reversible Protein Stain Kit (Thermo Fisher). The membrane was blocked in PBS containing 0.05% Tween-20 and 3% skimmed milk (Marvel), and incubated with a primary antibody overnight, and a secondary antibody for >1 h. The membrane was washed multiple times in PBS+0.05% Tween-20 for a total of 30–60 min after each antibody incubation. A rat antibody against MBP-Sle-1 (this study; 1/250), a guinea pig antibody against GST-Gwl-dM1 (this study; 1/250), or a mouse antibody against α-tubulin (DM1A; T9026; Sigma-Aldrich; 1/250) was used as a primary antibody. Secondary antibodies conjugated with a fluorescent dye (IRDye800CW, IRDye680LT; LI-COR) were used at 1/20,000. After being rinsed in PBS, the signals were detected by Odyssey CLx (LI-COR) at a resolution of 168 μm. The total signal intensity of a band above the background was measured by the method described in image analysis.

Generation of GFP- or mCherry-tagged lines

To generate plasmids expressing GFP- or mCherry-tagged proteins in flies, the coding sequence amplified from a template by PCR using PrimeSTAR (Takara Bio) was cloned between NotI and AscI sites of pENTR-D-Topo (Invitrogen) using the Gibson assembly. The templates used in this study were LD35132 (gwl), SD06626 (Chro), and genomic DNA of w1118 (sle). For sle, the start codon of RB was used. For Mgtor, an entry plasmid containing the full-length coding sequence was reconstructed by the Gibson assembly of three PCR-amplified fragments from SD15969 encoding an N-terminal part, a middle part from genomic DNA of w1118, and SD01380 encoding a C-terminal part. For Axs, the sequence from the start codon to the last coding codon was PCR-amplified from genomic DNA of w1118 using primers containing attB1 and attB2 and recombined into pDONR221 (Invitrogen) using BP Clonase (Invitrogen). After the full-coding sequence was reconstructed, this Gateway entry plasmid was recombined with a destination vector using LR Clonase II (Invitrogen). The destination vectors used in this study are pPWG and φPGW (Costa and Ohkura, 2019) containing UASp, and φMaChW and φMaGW (Costa and Ohkura, 2019) containing maternal α4-tubulin at 67A (matα4) promoter. φMaChW was generated by inserting PCR-amplified maternal α4-tubulin at 67A (matα4) promoter and mCherry into φMaGW digested with StuI and AgeI. The resulting plasmids were microinjected into the fly line (RRID:BDSC_9750; PBac{y+-attP-3B}VK33) or (RRID:BDSC_9744; PBac{y+-attP-3B}VK27 for matα4-mCherry-Gwl) for φC31 integrase-mediated transgenesis or into w1118 for P-element transposase-mediated transgenesis, carried out by BestGene Inc. Resulting transgenic flies carrying matα4-GFP-Sle, UASp-GFP-Gwl, UASp-GFP-Chro, UASp-Axs-GFP, matα4-mCherry-Gwl, and matα4-GFP-Mgtor were used in this study.

Generation of RNAi lines and double-RNAi screening

Transgenic RNAi fly lines were generated based on the RNAi vector pGP11 as previously described (Wan et al., 2025). Plasmids expressing a single shRNA under UASp were generated by inserting a pair of complementary oligonucleotides (Table S1) with cohesive ends between the EcoRI and NheI sites of pGP11 using T4 DNA ligase (NEB). To generate plasmids expressing two shRNAs against sle and a second gene, the region between EcoRI and NheI was amplified by PCR from a plasmid expressing shRNA against the second gene using PrimeSTAR (Takara) with flanking overlapping sequences for the Gibson assembly. The PCR product was then inserted into the SpeI site of a plasmid expressing a single shRNA against sle (RNAi 1) by the Gibson assembly. After the sequence was confirmed, the resulting plasmid was microinjected into the fly line (RRID:BDSC_8622; P{CaryP}attP2) using φC31 integrase-mediated transgenesis, carried out by BestGene Inc. The same procedure was used to construct the plasmid expressing two shRNAs against gwl and tws.

In the first round of double-RNAi screening, a small number of oocytes were subjected to FISH followed by immunostaining (immunoFISH) using dodecasatellite as a probe. When the frequency of mono-orientation was not significantly different (P > 0.05) by Fisher’s exact test between single RNAi of a gene and double RNAi with sle, it was not followed up further. For genes that showed a significant difference in the first round, more oocytes were examined in subsequent rounds by immunoFISH. Results were pooled together for Fisher’s exact test.

Generation of antibodies

Two antibodies against Sle were generated as below. Expression plasmids encoding MBP-Sle-1 and GST-Sle-2 were introduced to Escherichia coli BL21(DE3)/pLysS. Sle-1 and Sle-2 encode 33–536 aa and 862–1,201 aa of Sle A isoform, respectively (Fig. S1 A). The bacteria were cultured overnight in LB with antibiotics at 37°C. It was diluted 100 times in the final volume of 200 ml LB with the antibiotics. Bacteria were collected by centrifugation and were resuspended in 3 ml lysis buffer (50 mM Tris-Cl, pH 8, 1 mM EDTA, 100 mM NaCl). It was then frozen and thawed until it became viscous. After the final concentration of 250 μg/ml lysozyme (Sigma-Aldrich) was added, it was incubated on ice for 10 min and at 37°C for another 10 min. Final 2 mM MgCl2 and 10 μg/ml DNase I (Sigma-Aldrich) were added, and the lysate was incubated at 37°C until viscosity disappeared. After 5 ml PBS was added, it was then centrifuged at 4°C for 10 min. The supernatant was run through a column containing 500 μl of glutathione Sepharose 4B resin (Cytiva) or 500 μl of amylose resin (New England Biolabs). Proteins were eluted five times with 10-min incubation of 500 μl of PBS containing 10 mM glutathione or 10 mM maltose. The eluted protein was analyzed by SDS-PAGE, and the concentration was estimated in comparison with BSA at known concentration. Two rats were immunized by Eurogentec using the classical 87-day program (50–100 μg of the antigen each injection), and antisera were used. The antiserum against MBP-Sle(33–536) from the final bleed of Rat 1 was used unless stated otherwise.

An antibody against Gwl was generated as described below. GST-Gwl lacking 224–640 residues (dM1) was expressed, and bacteria were lysed as described above for Sle proteins. After centrifugation following DNase I treatment and the addition of PBS, the pellet which contains most of the Gwl protein was then run on SDS-PAGE. The position of GST-Gwl-dM1 was identified on the gel by a difference in refraction of light. A slice containing the band was cut out and grinded. The protein was eluted by diffusion in 12 ml of 0.2 M NaHCO3+0.02% SDS at 37°C overnight. The elute was dialyzed in PBS, concentrated using Amicon Ultra-4 (Merck Millipore), and analyzed by SDS-PAGE with BSA for quantification. Two guinea pigs were immunized by Eurogentec using the classical 87-day program (50–100 μg of the antigen each injection). The antiserum against GST-Gwl-dM1 from the final bleed of guinea pig 6 was used.

An antibody against Ncd was prepared as described below. MBP-Ncd was expressed and purified as described above for GST-Gwl-dM1. This was used as the antigen to immunize rats as described above for the Sle antibodies. The final bleed from Rat0 was affinity-purified using the GST-tagged N-terminal nonmotor region of Ncd (1–349 aa) as previously described (Clohisey et al., 2014; Smith and Fisher, 1984). GST-Ncd(1–349) was expressed in BL21(DE3)/pLysS, and a crude extract containing ∼50 μg of GST-Ncd(1–349) was run on an SDS gel and transferred onto a nitrocellulose membrane. The membrane was stained with 1% Ponceau S in 1% acetic acid, and a slice of the membrane corresponding to GST-Ncd(1–349) was excised. After the membrane was washed and blocked in PBS containing 0.05% Tween-20 and 3% skimmed milk (Marvel), it was incubated with 100 μl of the final antiserum in 1 ml of blocking solution overnight at 4°C. After extensive washes in PBS+0.05% Tween-20, the antibody was eluted three times by 30-s incubation each with 400 μl elution buffer (50 mM glycine-HCl, pH 2.3, 0.5 M NaCl, 0.5% Tween-20, 100 μg/ml BSA, 0.1% NaN3). All of the eluates were combined and immediately neutralized by adding Na2HPO4 to a final concentration of 50 mM.

Antibodies

The primary antibodies and concentrations used for immunostaining and western blot are rat anti-MBP-Sle1 (this study; 1/250), rat anti-GST-Sle-2 (this study; 1/250), guinea pig anti-MBP-Sle1 (this study; 1/250), rat anti-MBP-Ncd (this study; affinity-purified 1/10), guinea pig anti-GST-Gwl-dM1 (this study; 1/250), mouse anti-α-tubulin (DM1A; T9026; Sigma-Aldrich; RRID:AB_477593; 1/250), rabbit anti-GFP (A11122; Thermo Fisher Scientific; RRID:AB_221569; 1/125), mouse anti-Chro (Developmental Studies Hybridoma Bank [DSHB] 12H9; RRID:AB_2721936; 1/5), and mouse anti-Mgtor (DSHB 12H10; RRID:AB_2721935; 1/5), rabbit anti-CP190 (Rb188; 1/500; Whitfield et al., 1995).

The secondary antibodies used for immunostaining of oocytes and S2 cells were all from Jackson ImmunoResearch: anti-mouse IgG conjugated with Alexa Fluor 488 (715-546-151; RRID:AB_2340850; 1/100), anti-rabbit IgG conjugated with Alexa Fluor 488 (A-11034; 1/100), anti-rat IgG conjugated with Cy3 (712-166-153; RRID:AB_2340669; 1/500), anti-rabbit IgG conjugated with Cy3 (711-166-152; RRID:AB_2313568; 1/500), anti-guinea pig IgG conjugated with Cy3 (706-166-148; RRID:AB_2340461; 1/500), anti-rabbit IgG conjugated with Alexa Fluor 647 (711-606-152; RRID:2340625; 1/250), and anti-rat IgG conjugated with Alexa Fluor 647 (712-606-153; RRID:AB_2340696; 1/250). To detect GFP, a secondary antibody conjugated with Alexa Fluor 488 was always used. For western blot, secondary antibodies conjugated with a fluorescent dye (IRDye800CW) were used at 1/20,000 (RRID AB_268782, RRID AB_1850025, RRID AB_2814905, RRID AB_1850024; LI-COR).

Cytological analysis of oocytes

After 3 days of maturation, ∼25 mature flies were quickly dissected and fixed in 100% methanol. The dissected ovaries were sonicated with 25–32% amplitude and three 1-s pulses using a VCX 750 SONICS sonicator to remove their chorion and vitelline membrane. Dechorionated oocytes were incubated in a mixture of half-volume methanol and half-volume PBS for 10 min, followed by incubation in 400 μl PBS for an additional 10 min. They were then blocked for 30 min in PBST-FBS blocking solution (PBS containing 0.1% Triton X-100 and 10% FBS). Oocytes were incubated in PBST (PBS containing 0.1% Triton X-100) with primary antibodies for 4 h overnight, washed in PBST three times for 10 min each, and then incubated in PBST with fluorophore-conjugated secondary antibodies and 0.5 μg/ml of 4′,6-diamidino-2-phenylindole (DAPI) in the dark for 2 h. They were then washed in PBST four times for 10 min each before being mounted in a mounting medium (85% glycerol, 2.5% propyl gallate). Prepared slides were imaged using a Plan-Apochromat objective lens (63×, 1.4NA) on AxioObserver 7 (Zeiss) attached to an LSM 900 (Zeiss) laser scanning confocal microscope controlled by ZEN (Zeiss) under Immersol 518F oil (Zeiss). Around 10–20 Z slices spanning the entire spindle were imaged with 0.5-μm interval at Zoom 2.0 (pixel size 0.10 μm), pinhole 53 μm, averaging 4× (repeat per line), master gain 500 V, digital offset 0, and digital gain 1.0. Typically, about 30 spindles were imaged from each batch and at least three batches were examined.

ImmunoFISH using centromere 3 probes was carried out as described previously (Repton et al., 2022). Ovaries were dissected in methanol, and oocytes were dechorionated as described for immunostaining. Oocytes were postfixed for 2 min with 8% PFA (15714; Electron Microscopy Sciences) in PBS. An oligonucleotide (5′-CCC​GTA​CTC​GGT-3′)4 was used as a probe for dodecasatellite near centromere 3. 100 pmol of the oligonucleotide was then end-labeled with 2 nmol Alexa 546–conjugated dUTP (Invitrogen) and 16 nmol of dTTP (Promega) using 30 units of terminal deoxynucleotidyl transferase (Promega) in 20 μl of transferase buffer at 37°C for one h. After incubating at 70°C for 10 min, free nucleotides were removed using a G25 Mini Quick spin column (Roche). The labeled probe was denatured at 91°C and incubated with ovaries in hybridization buffer (0.1 g/ml dextran sulfate, 50% formamide, 3x SSC) at 30°C overnight. After two washes in washing buffer (50% formamide, 3x SSC, 0.1% Triton X-100) at 30°C, oocytes were immunostained as described previously. Typically, about 30 spindles were imaged from each batch and at least three batches were examined except the first round of the double-RNAi screen. When two signals of homologous centromere 3 were fused together or located in the same half of the chromosome mass, it was classified as mono-orientation. When two signals were located in different halves of the chromosome mass, it was classified as bi-orientation.

For live-imaging oocytes, mature flies were dissected individually in oil (Halocarbon oil, 700) on day 2 or 3 of maturation. Stage 13 and 14 oocytes were attached onto a coverslip with their dorsal side facing down. The stage of oocytes was estimated based on dorsal appendages (Costa and Ohkura, 2019). Oocytes were live-imaged using a Plan-Apochromat objective lens (63×/1.4 NA) with 518F Immersol oil (Zeiss) on an AxioObserver Z.1 (Zeiss) microscope attached to a spinning disk confocal head (CSU-X1; Yokogawa) controlled by Volocity (Quorum). Around 10–20 Z slides were imaged with 0.8-μm interval (pixel size 0.1 μm), low light, Gain 0, Offset 0, and 0.25-s exposure. For live imaging of Axs-GFP and mCherry-Gwl, newly eclosed female flies were matured at 18°C for 6 days and at 25°C for 1–2 days, and 5- to 10-s exposure was used for imaging, to circumvent poor ovary development and weak signal.

All images are presented after maximum intensity projection, unless otherwise stated. For contrast changes, pixel intensities were changed only proportionally, except live images and western blot images where the pixel intensities were linearly changed between the maximum and minimal intensity values. All images were analyzed using ImageJ and edited using ImageJ or Omero. All scale bars are 10 μm, unless otherwise stated.

FRAP analysis

For FRAP, oocytes were prepared as live imaging but imaged using a Plan-Apochromat objective lens (63×, 1.4NA) on Axio Observer 7 (Zeiss) attached to an LSM 900 (Zeiss) laser scanning confocal microscope controlled by ZEN (Zeiss) under Immersol 518F oil (Zeiss). Around 8–12 Z slices spanning the entire spindle were imaged every 5 s (for half spindle matrix bleach) or every 10 s (for whole spindle matrix bleach) with the following settings: 0.75-μm Z-interval, 256 × 256 pixels, pixel size 0.10 μm, pinhole 50 μm, no averaging, master gain 500 V, digital offset 0, and digital gain 1.0. For photobleaching, a rectangular box was drawn to cover half of the spindle matrix containing one pole (half matrix bleaching), or to cover the whole spindle matrix (whole matrix bleaching). This selected region on the middle Z-plane was bleached 3–10 times at 100% of the 488-nm laser power.

FRAP data were analyzed as follows. Before quantification, images were maximum intensity–projected onto XY planes, and a drift of the spindle over time was corrected using StackReg if required. For half spindle matrix bleach, two equal-sized rectangular boxes were drawn to include the bleached and the unbleached areas of the Sle spindle matrix. Two other rectangular boxes were drawn to include the whole spindle matrix and the background area. For whole spindle matrix bleach, two boxes including the whole matrix and background were drawn. The mean intensities within these boxes were measured. Firstly, for each oocyte, each intensity was divided by the background intensity at same time point to compensate for photobleaching by image acquisition. These compensated intensities were then divided by the prebleach values in each box, and then normalized using pre- and postbleach values of the bleached area. The average and standard errors of these normalized intensities were calculated from all oocytes and used to draw the graphs. For the lower left graph in Fig. 2 D, the average normalized intensity of the bleached area was subtracted by the average normalized intensity of the unbleached area at each time point, and further normalized using prebleach and postbleach values. For the lower right graph of Fig. 2 D, the average normalized intensities were further normalized using the average prebleach and postbleach normalized intensities in the whole spindle area.

To make a kymograph, the image at each time point was maximum intensity–projected first onto XY planes and then onto the spindle long axis. This one-dimensional image (on the x axis) was aligned with time (on the y axis). The “fire” lookup table was used to show intensity values after linear brightness adjustment.

Fertility test and cytological analysis of syncytial embryos

To test female fertility, five adult females aged 1–4 days were placed with five sibling males in each vial containing fly food. After 6 days at 25°C, larval activity was checked, and after 12 days, the number of adult progeny from each vial was counted.

For immunostaining of early embryos, eggs were collected for 60 min on 3% agar plates containing 4% sucrose and food coloring, and further aged for 90 min at 25°C. They were dechorionated in 2.5% sodium hypochlorite, and fixed in bilayers of heptane and methanol containing 5 mM EGTA. Eggs without vitelline membranes were collected from the bottom of the methanol layer, and kept in fresh methanol overnight at −20°C. After gradually rehydrated in 80%, 60%, 40%, 20%, and 0% methanol in PBS, eggs were immunostained and observed as described for oocytes. Only one batch of egg collection was stained.

Culture, transfection, and immunostaining of S2 cells

S2 cells were cultured in Schneider’s Drosophila medium (Gibco) with 10% FBS and 1% antibiotics (A5955; Sigma-Aldrich) at 27°C. Cells were split when they covered the bottom of T25 flasks containing a total volume of 10 ml (1/10 weekly).

To express GFP-tagged Sle, Chro, and Mgtor in S2 cells under the metallothionein promoter, expression plasmids were generated by recombining the entry plasmids described above with the destination vector pMT-GW (Goshima et al., 2007) using LR Clonase (Invitrogen). Each transfection mixture consisted of 300 μl of serum-free Schneider’s media, 600 ng of DNA (pMT-GFP-protein), and 1.8 μl of X-tremeGENE HP (Sigma-Aldrich) incubated at room temperature (∼21°C) for 25 min. The transfection mixture was then added to 106 cells in each well of a 6-well plate. 500 μM of CuSO4 was added for induction, followed by adding 1 ml of Schneider’s media with FBS. Cells were fixed and immunostained after 24 h as described below.

1 ml of mixed cells (∼6 × 10⁵ cells) was added to the center of a concanavalin A–treated coverslip in a well, and 1 ml of warm media was added on the edges. After 2 h, cells were fixed with 3 ml cold methanol/PFA [90% methanol, 9% of 32% PFA (15714; Electron Microscopy Sciences), 1% of 0.5 M sodium bicarbonate (NaHCO3)] on dry ice. After 15 min, plates were placed at room temperature (∼21°C) for 15 min, then rinsed twice with PBS, and kept in PBS. For immunostaining, cells were permeabilized with PBST and blocked with a PBST-FBS blocking solution for 30 min. Cells were then incubated in the blocking solution with primary antibodies for 1 h, washed with PBST for 15 min, and incubated in a blocking solution with secondary antibodies, including 0.4 μg/ml DAPI. Typically, 10 or more mitotic cells were examined for each culture and two or more cultures were examined.

Image analysis

In experiments with cold treatment, oocytes with residual spindle microtubules were excluded from analysis.

In Fig. 1 B and Fig. 6 C, signal intensities along the lines were measured using ImageJ plot profile, after the maximum intensity projection of the 3D image was generated. The intensities were normalized against the maximum intensity value of each channel and plotted against the positions on the line.

In Fig. 1 D, Fig. 7 K, and Fig. S2 E, to quantify the total signal intensity of an object above the background, two regions were drawn on an image after the maximum intensity projection as follows: a smaller region (S) closely surrounding the largest object from all the channels and a larger region (L) surrounding the smaller region. The same regions were used to measure the signals in all channels. The mean intensities and the sizes of the two regions were measured by ImageJ. The mean intensity of the background (B) was estimated by [(mean intensity L)x(area L)-(mean intensity S)x(area S)]/[(area L)-(area S)]. The total intensity of the object above the background was estimated by [(mean intensity S)-(mean intensity B)] × (area S). This value was divided by the mean intensity of the background for normalization. For S2 cells, the whole cell was used as L, except that if the cytoplasm has aggregates, they were excluded from L.

In Fig. 1 E, the lengths of the long and short axes of the spindle were measured after the maximum intensity projection by drawing two lines that pass in the middle of the DNA mass and span the longest and shortest lengths of the spindle, respectively. Spindles perpendicular to the focal planes were excluded from the analysis.

In Fig. 2 B and Fig. S2 A, intensities of GFP-Sle and Rcc1-mCherry over time were measured as follows. After the maximum intensity projection of the 3D images was generated, the average signal intensities within four squares of 9 × 9 pixels (0.9 × 0.9 μm) were measured using ImageJ and plotted over time. In Fig. S2, imaging was briefly interrupted to readjust the focus and/or stage during an interval of capturing. The intensities before the interruption were adjusted proportionally so that the intensities of the cytoplasmic background (box 1) were the same before and after the brief interruption.

Image analysis in Fig. 2, C and D, is separately described in the FRAP analysis section. In Fig. 4 A, the intensity of the Sle bands on the western blot above the background was measured by drawing a box of the same size around each band, and a smaller box in the background. The mean intensity within the box containing each band was subtracted by the mean intensity of the smaller box. The band intensities were indicated as values relative to the control.

In Fig. 4 C, the spindle morphology in sle RNAi oocytes was classified into the four following categories: smooth bipolar spindles with focused poles, bipolar spindles with thin microtubule bundles branching out from the sides, bipolar spindles with either split poles and/or many thin microtubule bundles branching out, and spindles with other abnormalities including nonbipolar spindles and multiple separate spindles. In Fig. S2 E, the spindle morphology in gwl RNAi oocytes was classified into the following categories: normal thin bipolar spindles, broader bipolar spindles, apolar spindles, and spindles with other abnormalities (including spindles with split poles or branched microtubule bundles, tripolar spindles, and multiple separate spindles).

In Fig. 5, A and C, orientation of homologous centromeres was operationally categorized as follows. When two signals of homologous centromere 3 were located closely together or in the same half of the chromosome mass along the long spindle axis, it was classified as mono-orientation. When two signals were located in different halves of the chromosome mass, it was classified as bi-orientation.

In Fig. 7 I, the width (the short axis) of the region occupied by Sle and the spindle microtubules was measured by drawing a line that passes the middle of the chromosome mass and spans the shortest length of the spindle after the maximum intensity projection. The same line was used to measure the widths in both channels. The spindle perpendicular to the focal planes was excluded from the analysis.

In Fig. 7 J, the length (the long axis) of the Sle region and the DNA mass was measured by drawing a line that passes in the middle of the DNA mass and spans the longest length of the Sle region after the maximum intensity projection. The same line was used to measure the lengths in both channels. Oocytes with an unclear Sle border were excluded from the analysis. In case multiple DNA masses were surrounded by separate Sle regions, the largest Sle region and the associated DNA mass were measured.

In Fig. 8 B, the width of the spindle and the region surrounded by the Gwl spindle envelope was measured after maximum intensity projection as follows. A line was drawn to pass the middle of the DNA mass and span the shortest width of the spindle. The inner width of the Gwl envelope and the outer width of the spindle were measured. The same line was used to measure the widths in different channels.

In Fig. 8 D, the length and width of the DNA mass and the region surrounded by the Gwl spindle envelope were measured after maximum intensity projection as follows. Two lines were drawn to pass the middle of the DNA mass and span the longest and shortest lengths of the Gwl-surrounded region, respectively. The same lines were used for measurement in different channels. The inner length/width of the Gwl envelope and the outer length/width of the DNA mass were measured. Oocytes with disorganized Gwl that does not surround the chromosomes were excluded from the measurement.

To statistically test differences between a pair of datasets, a two-tailed Mann–Whitney U test (https://www.statskingdom.com) was used for nonparametric data in Fig. 1 D; Fig. 7, I–K; Fig. 8, B and D; and Fig. S3 F, and Fisher’s exact test (https://www.medcalc.org/) was used for categorical data in Fig. 4, C and E; Fig. 5, A and C; Fig. S2 D; and Fig. S3, D and E. The frequencies of categorical data are shown with 95% confidence intervals (Wilson score intervals; https://www.statskingdom.com) in Fig. 4, C and E; Fig. 5, A and C; and Fig. S3, D and E.

Online supplemental material

Fig. S1 shows Sle antibodies. Fig. S2 shows Sle localization and function in mitotic cells and oocytes. Fig. S3 shows Gwl antibody, function, and localization. Table S1 shows oligonucleotide sequences used for generating RNAi constructs.

Data supporting the findings of this study are available in the main text or the supplementary materials. Additional raw data are available from the corresponding author upon request.

We thank all members of the Ohkura laboratory for their support and discussion. Special thanks are given to A. Ciszek, I. Dasuzhau, and A. Gluszek for generating reagents. We also thank Prof D. Glover for kindly providing a CP190 antibody.

Fly stocks and cDNAs were provided by the Bloomington Drosophila Stock Center (National Institutes of Health [NIH]: P40OD018537), the Transgenic RNAi Project at Harvard Medical School (NIH: R24 OD030002), and the Drosophila Genomics Resource Center (NIH: 2P40OD010949). Monoclonal antibodies were provided by the Developmental Studies Hybridoma Bank, created by the National Institute of Child Health and Human Development of the NIH and maintained at the University of Iowa, Department of Biology. This work was supported by the Wellcome Trust [206315, 227907]. R. Kaade and J. Niziol received Darwin Trust Scholarships, and C. Repton received a PhD studentship from BBSRC EastBio Doctoral Training Partnership. Open Access funding provided by University of Edinburgh.

Author contributions: Rayane Kaade: conceptualization, data curation, formal analysis, funding acquisition, investigation, methodology, resources, validation, visualization, and writing—original draft, review, and editing. Emma Peat: investigation. Charlotte Repton: investigation, resources, and writing—review and editing. Julia Niziol: conceptualization, funding acquisition, investigation, resources, visualization, and writing—review and editing. Carmela Silva Mason: investigation. Li Ern Yap: data curation, investigation, methodology, and writing—review and editing. Gera Pavlova: methodology, resources, and writing—original draft. Hiroyuki Ohkura: conceptualization, data curation, formal analysis, funding acquisition, investigation, methodology, project administration, supervision, validation, visualization, and writing—original draft, review, and editing.

Ashburner
,
M.
,
K.
Golic
, and
R.S.
Hawley
.
2011
.
Drosophila: A Laboratory Handbook
.
Cold Spring Harbor Laboratory Press
,
New York
.
Castro
,
A.
, and
T.
Lorca
.
2018
.
Greatwall kinase at a glance
.
J. Cell Sci.
131
:
jcs222364
.
Civelekoglu-Scholey
,
G.
,
L.
Tao
,
I.
Brust-Mascher
,
R.
Wollman
, and
J.M.
Scholey
.
2010
.
Prometaphase spindle maintenance by an antagonistic motor-dependent force balance made robust by a disassembling lamin-B envelope
.
J. Cell Biol.
188
:
49
–
68
.
Clohisey
,
S.M.R.
,
N.S.
Dzhindzhev
, and
H.
Ohkura
.
2014
.
Kank is an EB1 interacting protein that localises to muscle-Tendon attachment sites in Drosophila
.
PLoS One
.
9
:e114770.
Colombié
,
N.
,
C.F.
Cullen
,
A.L.
Brittle
,
J.K.
Jang
,
W.C.
Earnshaw
,
M.
Carmena
,
K.
McKim
, and
H.
Ohkura
.
2008
.
Dual roles of incenp crucial to the assembly of the acentrosomal metaphase spindle in female meiosis
.
Development
.
135
:
3239
–
3246
.
Costa
,
M.F.A.
, and
H.
Ohkura
.
2019
.
The molecular architecture of the meiotic spindle is remodeled during metaphase arrest in oocytes
.
J. Cell Biol.
218
:
2854
–
2864
.
Dumont
,
J.
, and
A.
Desai
.
2012
.
Acentrosomal spindle assembly and chromosome segregation during oocyte meiosis
.
Trends Cell Biol.
22
:
241
–
249
.
Ferreira
,
L.T.
, and
H.
Maiato
.
2021
.
Prometaphase
.
Semin. Cell Dev. Biol.
117
:
52
–
61
.
Forer
,
A.
1965
.
Local reduction of spindle fiber birefringence in living Nephrotoma suturalis (Loew) spermatocytes induced by ultraviolet microbeam irradiation
.
J. Cell Biol.
25
:
95
–
117
.
García-Blanco
,
N.
,
A.
Vázquez-Bolado
, and
S.
Moreno
.
2019
.
Greatwall-endosulfine: A molecular switch that regulates PP2A/B55 protein phosphatase activity in dividing and quiescent cells
.
Int. J. Mol. Sci.
20
:
6228
.
Głuszek
,
A.A.
,
C.F.
Cullen
,
W.
Li
,
R.A.
Battaglia
,
S.J.
Radford
,
M.F.
Costa
,
K.S.
McKim
,
G.
Goshima
, and
H.
Ohkura
.
2015
.
The microtubule catastrophe promoter Sentin delays stable kinetochore-microtubule attachment in oocytes
.
J. Cell Biol.
211
:
1113
–
1120
.
Goldman
,
R.D.
, and
L.I.
Rebhun
.
1969
.
The structure and some properties of the isolated mitotic apparatus
.
J. Cell Sci.
4
:
179
–
209
.
Goshima
,
G.
,
R.
Wollman
,
S.S.
Goodwin
,
N.
Zhang
,
J.M.
Scholey
,
R.D.
Vale
, and
N.
Stuurman
.
2007
.
Genes required for mitotic spindle assembly in Drosophila S2 cells
.
Science
.
316
:
417
–
421
.
Huang
,
Y.
,
T.
Li
,
S.C.
Ems-McClung
,
C.E.
Walczak
,
C.
Prigent
,
X.
Zhu
,
X.
Zhang
, and
Y.
Zheng
.
2018
.
Aurora A activation in mitosis promoted by BuGZ
.
J. Cell Biol.
217
:
107
–
116
.
Jiang
,
H.
,
S.
Wang
,
Y.
Huang
,
X.
He
,
H.
Cui
,
X.
Zhu
, and
Y.
Zheng
.
2015
.
Phase transition of spindle-associated protein regulate spindle Apparatus assembly
.
Cell
.
163
:
108
–
122
.
Johansen
,
J.
, and
K.M.
Johansen
.
2009
.
The spindle matrix through the cell cycle in Drosophila
.
Fly (Austin)
.
3
:
213
–
220
.
Johansen
,
K.M.
,
A.
Forer
,
C.
Yao
,
J.
Girton
, and
J.
Johansen
.
2011
.
Do nuclear envelope and intranuclear proteins reorganize during mitosis to form an elastic, hydrogel-like spindle matrix?
Chromosome Res.
19
:
345
–
365
.
Johansen
,
K.M.
, and
J.
Johansen
.
2007
.
Cell and molecular biology of the spindle matrix
.
Int. Rev. Cytol.
263
:
155
–
206
.
Kline-Smith
,
S.L.
, and
C.E.
Walczak
.
2004
.
Mitotic spindle assembly and chromosome segregation: Refocusing on microtubule dynamics
.
Mol. Cell
.
15
:
317
–
327
.
Kramer
,
J.
, and
R.S.
Hawley
.
2003
.
The spindle-associated transmembrane protein Axs identifies a membranous structure ensheathing the meiotic spindle
.
Nat. Cell Biol.
5
:
261
–
263
.
Kyogoku
,
H.
, and
T.S.
Kitajima
.
2023
.
The large cytoplasmic volume of oocyte
.
J. Reprod. Dev.
69
:
1
–
9
.
Lee
,
W.L.
, and
P.
Wadsworth
.
2009
.
New spindle morphogenesis model by Dynein, Nudel, and the spindle matrix
.
Cell Res.
19
:
529
–
531
.
Lince-Faria
,
M.
,
S.
Maffini
,
B.
Orr
,
Y.
Ding
,
C.
Florindo
,
C.E.
Sunkel
,
Á.
Tavares
,
J.
Johansen
,
K.M.
Johansen
, and
H.
Maiato
.
2009
.
Spatiotemporal control of mitosis by the conserved spindle matrix protein megator
.
J. Cell Biol.
184
:
647
–
657
.
Ma
,
L.
,
M.-Y.
Tsai
,
S.
Wang
,
B.
Lu
,
R.
Chen
,
J.R.
Yates
,
X.
Zhu
, and
Y.
Zheng
.
2009
.
Requirement for Nudel and dynein for assembly of the lamin B spindle matrix
.
Nat. Cell Biol.
11
:
247
–
256
.
Ohkura
,
H.
2015
.
Meiosis: An overview of key differences from mitosis
.
Cold Spring Harb. Perspect. Biol.
7
:
a015859
.
Orihara-Ono
,
M.
,
E.
Suzuki
,
M.
Saito
,
Y.
Yoda
,
T.
Aigaki
, and
C.
Hama
.
2005
.
The slender lobes gene, identified by retarded mushroom body development, is required for proper nucleolar organization in Drosophila
.
Dev. Biol.
281
:
121
–
133
.
Pickett-Heaps
,
J.D.
,
A.
Forer
, and
T.
Spurck
.
1997
.
Traction fibre: Toward a “tensegral” model of the spindle
.
Cell Motil. Cytoskeleton
.
37
:
1
–
6
.
Qi
,
H.
,
U.
Rath
,
Y.
Ding
,
Y.
Ji
,
M.J.
Blacketer
,
J.
Girton
,
J.
Johansen
, and
K.M.
Johansen
.
2005
.
EAST interacts with megator and localizes to the putative spindle matrix during mitosis in Drosophila
.
J. Cell Biochem.
95
:
1284
–
1291
.
Qi
,
H.
,
U.
Rath
,
D.
Wang
,
Y.-Z.
Xu
,
Y.
Ding
,
W.
Zhang
,
M.J.
Blacketer
,
M.R.
Paddy
,
J.
Girton
,
J.
Johansen
, and
K.M.
Johansen
.
2004
.
Megator, an essential coiled-coil protein that localizes to the putative spindle matrix during mitosis in Drosophila
.
Mol. Biol. Cell
.
15
:
4854
–
4865
.
Radford
,
S.J.
,
T.L.
Hoang
,
A.A.
Głuszek
,
H.
Ohkura
, and
K.S.
McKim
.
2015
.
Lateral and end-on kinetochore attachments are coordinated to achieve bi-orientation in Drosophila oocytes
.
PLoS Genet.
11
:e1005605.
Rangone
,
H.
,
E.
Wegel
,
M.K.
Gatt
,
E.
Yeung
,
A.
Flowers
,
J.
Debski
,
M.
Dadlez
,
V.
Janssens
,
A.T.C.
Carpenter
, and
D.M.
Glover
.
2011
.
Suppression of scant identifies endos as a substrate of greatwall kinase and a negative regulator of protein phosphatase 2a in mitosis
.
PLoS Genet.
7
:e100225.
Rath
,
U.
,
D.
Wang
,
Y.
Ding
,
Y.-Z.
Xu
,
H.
Qi
,
M.J.
Blacketer
,
J.
Girton
,
J.
Johansen
, and
K.M.
Johansen
.
2004
.
Chromator, a novel and essential chromodomain protein interacts directly with the putative spindle matrix protein skeletor
.
J. Cell Biochem.
93
:
1033
–
1047
.
Repton
,
C.
,
C.
Fiona Cullen
,
M.F.A.
Costa
,
C.
Spanos
,
J.
Rappsilber
, and
H.
Ohkura
.
2022
.
The phospho-docking protein 14-3-3 regulates microtubule-associated proteins in oocytes including the chromosomal passenger Borealin
.
PLoS Genet.
18
:e1009995.
Romé
,
P.
, and
H.
Ohkura
.
2018
.
Combining microscopy and biochemistry to study meiotic spindle assembly in Drosophila oocytes
.
Methods Cell Biol.
145
:
237
–
248
.
Sambrook
,
J.
1989
.
Molecular Cloning
.
Cold Spring Harbor Laboratory Press
,
New York
.
Schweizer
,
N.
,
N.
Pawar
,
M.
Weiss
, and
H.
Maiato
.
2015
.
An organelle-exclusion envelope assists mitosis and underlies distinct molecular crowding in the spindle region
.
J. Cell Biol.
210
:
695
–
704
.
Schweizer
,
N.
,
M.
Weiss
, and
H.
Maiato
.
2014
.
The dynamic spindle matrix
.
Curr. Opin. Cell Biol.
28
:
1
–
7
.
Smith
,
D.E.
, and
P.A.
Fisher
.
1984
.
Identification, developmental regulation, and response to heat shock of two antigenically related forms of a major nuclear envelope protein in Drosophila embryos: Application of an improved method for affinity purification of antibodies using polypeptides immobilized on nitrocellulose blots
.
J. Cell Biol.
99
,
20
-
28
.
So
,
C.
,
K.B.
Seres
,
A.M.
Steyer
,
E.
Mönnich
,
D.
Clift
,
A.
Pejkovska
,
W.
Möbius
, and
M.
Schuh
.
2019
.
A liquid-like spindle domain promotes acentrosomal spindle assembly in mammalian oocytes
.
Science
.
364
:eaat9557.
Tsai
,
M.-Y.
,
S.
Wang
,
J.M.
Heidinger
,
D.K.
Shumaker
,
S.A.
Adam
,
R.D.
Goldman
, and
Y.
Zheng
.
2006
.
A mitotic lamin b matrix induced by RanGTP required for spindle assembly
.
Science
.
311
:
1887
–
1893
.
Valdez
,
V.A.
,
L.
Neahring
,
S.
Petry
, and
S.
Dumont
.
2023
.
Mechanisms underlying spindle assembly and robustness
.
Nat. Rev. Mol. Cell Biol.
24
:
523
–
542
.
Walker
,
D.L.
,
D.
Wang
,
Y.
Jin
,
U.
Rath
,
Y.
Wang
,
J.
Johansen
, and
K.M.
Johansen
.
2000
.
Skeletor, a novel chromosomal protein that redistributes during mitosis provides evidence for the formation of a spindle matrix
.
J. Cell Biol.
151
:
1401
–
1412
.
Wan
,
X.
,
G.
Pavlova
,
C.F.
Cullen
,
I.
Dasuzhau
,
A.
Ciszek
, and
H.
Ohkura
.
2025
.
Identification of locally activated spindle-associated proteins in oocytes uncovers a phosphatase-driven mechanism
.
J. Cell Sci.
138
:
jcs264161
.
Wang
,
P.
,
J.A.
Galan
,
K.
Normandin
,
É.
Bonneil
,
G.R.
Hickson
,
P.P.
Roux
,
P.
Thibault
, and
V.
Archambault
.
2013
.
Cell cycle regulation of Greatwall kinase nuclear localization facilitates mitotic progression
.
J. Cell Biol.
202
:
277
–
293
.
Whitfield
,
W.G.
,
M.A.
Chaplin
,
K.
Oegema
,
H.
Parry
, and
D.M.
Glover
.
1995
.
The 190 kDa centrosome-associated protein of Drosophila melanogaster contains four zinc finger motifs and binds to specific sites on polytene chromosomes
.
J. Cell Sci.
108
:
3377
–
3387
.
Woodruff
,
J.B.
2018
.
Assembly of mitotic structures through phase separation
.
J. Mol. Biol.
430
:
4762
–
4772
.
Yao
,
C.
,
C.
Wang
,
Y.
Li
,
Y.
Ding
,
U.
Rath
,
S.
Sengupta
,
J.
Girton
,
K.M.
Johansen
, and
J.
Johansen
.
2014
.
The spindle matrix protein, chromator, is a novel tubulin binding protein that can interact with both microtubules and free tubulin
.
PLoS One
.
9
:e103855.
Zheng
,
Y.
2010
.
A membranous spindle matrix orchestrates cell division
.
Nat. Rev. Mol. Cell Biol.
11
:
529
–
535
.

Author notes

Disclosures: The authors declare no competing interests exist.

L.E. Yap’s current affiliation is School of Life and Environmental Sciences, University of Sydney, Camperdown, New South Wales, Australia.

This article is available under a Creative Commons License (Attribution 4.0 International, as described at https://creativecommons.org/licenses/by/4.0/).

Data & Figures

+ Expand view− Collapse view
Figure S1.
Figure S1. Refer to the image caption for details.Panel A shows diagram of Sle isoform A showing regions Sle-1 and Sle-2 used as antigens. Sle-1 is fused with MBP and Sle-2 with GST. Panel B shows protein gel images showing purification of MBP-Sle-1 and GST-Sle-2 from bacteria. Input, flow through, and eluted fractions are displayed with BSA for quantification. Arrowheads indicate MBP-Sle-1 and GST-Sle-2. Panel C shows immunostaining images of a metaphase I oocyte using antibodies against GST-Sle-2 and tubulin. The images show merged and individual channels for tubulin, Sle, and DNA.

Sle antibodies. (A) Regions of Sle used as antigens to generate anti-Sle antibodies. (B) Production and purification of Sle fragments from bacteria. Soluble fraction (Input) containing MBP-Sle-1 or GST-Sle-2 was run through a column with amylose resin. The flow-through and five eluted fractions were run on a protein gel together with BSA at known amounts for quantification. The arrowheads indicate MBP-Sle-1 or GST-Sle-2. (C) Immunostaining of a metaphase I oocyte using antibodies against GST-Sle-2 and α-tubulin. Bar = 10 μm. Source data are available for this figure: SourceData FS1.

Figure S1.
A diagram of Sle protein regions and purification process.Panel A shows diagram of Sle isoform A showing regions Sle-1 and Sle-2 used as antigens. Sle-1 is fused with MBP and Sle-2 with GST. Panel B shows protein gel images showing purification of MBP-Sle-1 and GST-Sle-2 from bacteria. Input, flow through, and eluted fractions are displayed with BSA for quantification. Arrowheads indicate MBP-Sle-1 and GST-Sle-2. Panel C shows immunostaining images of a metaphase I oocyte using antibodies against GST-Sle-2 and tubulin. The images show merged and individual channels for tubulin, Sle, and DNA.

Sle antibodies. (A) Regions of Sle used as antigens to generate anti-Sle antibodies. (B) Production and purification of Sle fragments from bacteria. Soluble fraction (Input) containing MBP-Sle-1 or GST-Sle-2 was run through a column with amylose resin. The flow-through and five eluted fractions were run on a protein gel together with BSA at known amounts for quantification. The arrowheads indicate MBP-Sle-1 or GST-Sle-2. (C) Immunostaining of a metaphase I oocyte using antibodies against GST-Sle-2 and α-tubulin. Bar = 10 μm. Source data are available for this figure: SourceData FS1.

Close Figure S1.
Figure 1.
A multi-panel image showing the localization of Sle protein relative to spindle microtubules in mature oocytes. Panel A shows four microscopy images showing the localization of Sle protein and tubulin in mature oocytes. The images are labeled tubulin, Sle, and DNA, with a scale bar of 10 micrometers. Panel B shows a line graph showing the signal intensity along the short axis of the spindle. The x-axis is labeled in micrometers, and the y-axis is labeled normalized intensity. The graph includes lines for DNA, tubulin, and Sle. Panel C shows eight microscopy images showing the localization of tubulin, Sle, and Kinesin-14 Ncd in metaphase 1 oocytes with and without cold treatment. The images are labeled accordingly, with a scale bar of 10 micrometers. Panel D shows three scatter plots showing the total signal intensities in the spindle area above the ooplasm in oocytes with or without cold treatment. The x-axis is labeled control and cold, and the y-axis is labeled total signal intensity above background. The plots include data for tubulin, Sle, and Kinesin-14 Ncd. Panel E shows a scatter plot showing the shape of the area occupied by Sle. The x-axis is labeled long axis in micrometers, and the y-axis is labeled short axis in micrometers. The plot includes data points for Sle with and without cold treatment.

Sle is a component of the spindle matrix in oocyte meiosis. (A) Sle localization in oocyte meiosis. Mature oocytes, which arrest in metaphase I, were immunostained with antibodies against Sle and α-tubulin. Sle localized wider than the spindle. Scale bar = 10 μm. (B) Signal intensity along the line drawn in A on the short axis of the spindle. They are normalized against the maximum intensity in each channel. (C) Metaphase I oocytes with or without cold treatment were immunostained with antibodies against Sle, kinesin-14 Ncd, and α-tubulin. After microtubules were depolymerized by cold treatment, α-tubulin and kinesin-14 Ncd were diffused, while Sle occupied at an elongated area surrounds the chromosomes. Scale bar = 10 μm. (D) Total signal intensities in the spindle area above the ooplasm in oocytes with or without cold treatment following normalization using the mean background. The intensities of α-tubulin and kinesin-14 Ncd were greatly reduced nearly to the ooplasm levels by cold treatment (P = 0.00000052, 0.000070; U test), while the intensity of Sle did not significantly change (P = 1.0). ***P < 0.001. ns, P > 0.05. n = 11, 15 (control, cold). (E) Shape of the area occupied by Sle. The long and short axes of Sle with or without cold treatment were measured and plotted. The long axis of the Sle area was shortened after microtubule depolymerization by cold treatment, but the area was still elongated.

Close Figure 1.
Figure 2.
A multi-panel image depicts the recruitment and stabilization of Sle on the spindle matrix in oocytes. Panel A shows time-lapse live images of oocytes expressing GFP-Sle and Rcc1-mCherry. The images are taken at different time points, showing the accumulation of GFP-Sle near the chromosomes, marked by arrowheads. Panel B presents changes in signal intensities in various regions of the oocytes, with line graphs showing the diffusion rates of GFP-Sle and Rcc1-mCherry. Panel C illustrates the FRAP analysis of GFP-Sle in metaphase 1 oocytes, with diagrams showing half and whole matrix photobleaching and recovery. Panel D includes a kymograph and line graphs depicting fluorescence recovery after photobleaching of a half spindle matrix, showing the spread of GFP-Sle and normalized fluorescence intensities. Panel E shows a kymograph and line graph depicting fluorescence recovery after photobleaching of the whole spindle matrix, with normalized fluorescence intensities over time.

Sle is actively recruited to or selectively stabilized on the spindle matrix. (A) Time-lapse live images from NEBD in oocytes expressing GFP-Sle and Rcc1-mCherry. Rcc1-mCherry is a marker of the meiotic chromosomes, which form a compact cluster before NEBD. The arrowheads indicate accumulation of GFP-Sle near the chromosomes. This accumulation started 10 min after NEBD, which roughly coincides with initiation of the spindle formation. Scale bars = 10 μm. (B) Changes of the signal intensities in various regions (1–4) of the oocytes. Rcc1-mCherry in the nucleoplasm diffused quickly, but GFP-Sle diffused more slowly. Scale bar = 10 μm. (C–E) FRAP analysis of GFP-Sle in metaphase I oocytes. GFP-Sle in a half of the spindle matrix (D) or in the whole spindle matrix (E) was photobleached and followed over time. The analysis revealed predominant exchange within the spindle matrix and slow exchange with the ooplasm, which are shown by the recovery curves of differences between unbleached and bleached halves and the whole matrix fluorescence, respectively. (D) FRAP of a half spindle matrix. The bleached area is marked by a blue box on a prebleach image. In the kymograph below, fluorescence intensities are shown against time using the color scheme on the left after maximum intensity projection onto the long spindle axis. It shows gradual spread of GFP-Sle from the unbleached half of the spindle matrix. In the top right graph, mean fluorescence intensities of various areas are normalized against the pre- and postbleach values in the bleached half. The lower left graph shows the negative differences of the normalized intensities between the unbleached half and the bleached half. The lower right graph shows intensities of the whole spindle matrix. Each of them is normalized against the pre- and postbleach values. The error bars indicate the standard errors of the mean. n = 10. (E) FRAP of the whole spindle matrix. The bleached area is marked by a blue box on a prebleach image. In the kymograph below, fluorescence intensities are shown against time using the color scheme on the left after maximum intensity projection onto the long spindle axis. The graph shows normalized fluorescence intensities in a whole spindle area over time. Error bars indicate the standard errors of the mean. n = 7.

Close Figure 2.
Figure 3.
A multi-panel image displays various cellular components and their localization in Drosophila mitosis and meiosis. Panel A shows microscopy images of S2 cells in interphase and metaphase, with Sle and Chro proteins localized to the nucleus and spindle matrix, respectively. Panel B shows microscopy images of S2 cells with Sle and Mgtor proteins localized to the nuclear rim and spindle matrix. Panel C displays microscopy images of oocytes in prophase I and metaphase 1, with Sle and Chro proteins localized to the nucleoplasm and spindle matrix. Panel D shows microscopy images of oocytes with Mgtor and tubulin proteins localized to the nuclear rim and diffused in the cytoplasm. Panel E presents live imaging of a metaphase 1 oocyte expressing GFP-Chro and Rcc1-mCherry, highlighting chromosomes. Panel F shows live imaging of a metaphase 1 oocyte expressing GFP-Mgtor and Rcc1-mCherry, with GFP-Mgtor showing diffused localization with concentrated clusters.

Composition of the spindle matrix is different in oocytes from mitotic cells. Higher signal intensity is displayed in darker gray except merged images. Intensity quantification is shown in Fig. S2 E. Scale bars = 10 μm. (A) Sle localization with the known spindle matrix protein Chro in S2 cells. S2 cells were immunostained with antibodies against Sle and Chro. In interphase, Sle and Chro localized to the nucleolus and the nucleus, respectively, as previously reported (Orihara-Ono et al., 2005; Rath et al., 2004). In mitotic metaphase, Sle and Chro colocalized to the spindle matrix. n = 28. (B) Sle localization with the known spindle matrix protein Mgtor in S2 cells. S2 cells were immunostained with antibodies against Sle and Mgtor. In interphase, Mgtor localized to the nuclear rim and nucleoplasm as previously reported (Qi et al., 2004). In mitotic metaphase, Sle and Mgtor colocalized to the spindle matrix. n = 18. (C) Chro localization in oocytes. Oocytes were immunostained with antibodies against Sle and Chro. In prophase I, Sle and Chro localized to the nucleoplasm. In metaphase I, Sle localized to the spindle matrix, while Chro showed diffused localization. n = 20. (D) Mgtor localization in oocytes. Oocytes were immunostained with antibodies against Mgtor and α-tubulin. In prophase I, Mgtor localized to the nuclear rim. In metaphase I, Mgtor showed diffused localization. n = 29. (E) Live imaging of a metaphase I oocyte expressing GFP-Chro and Rcc1-mCherry. Rcc1-mCherry highlights chromosomes. GFP-Chro showed diffused localization. Scale bar = 10 μm. n = 12. (F) Live imaging of a metaphase I oocyte expressing GFP-Mgtor and Rcc1-mCherry. GFP-Mgtor showed diffused localization with some concentrated clusters all over the ooplasm. n = 10.

Close Figure 3.
+ Expand view − Collapse view
Figure S2.
Figure S2. Refer to the image caption for details. Panel A shows two sets of microscopy images and corresponding line graphs. The images display GFP-Sle and Rcc1-mCherry intensities in oocytes. The line graphs plot GFP-Sle intensity and Rcc1-mCherry intensity over time, with the x-axis representing time in minutes and the y-axis representing intensity in arbitrary units. The graphs show different regions with varying intensities. Panel B is a scatter plot showing the number of progeny from females expressing sle shRNA and control females, with the x-axis representing individual females and the y-axis representing the number of progeny. Panel C contains microscopy images of syncytial mitosis in embryos from sle RNAi mothers and control mothers, stained with antibodies against tubulin and CP190. Panel D is a bar graph quantifying early embryonic divisions, with the x-axis representing control and sle RNAi groups and the y-axis representing the percentage of divisions. Panel E consists of scatter plots showing signal intensities of Sle, Chro, and Mgtor in metaphase I oocytes and mitotic S2 cells, with the x-axis representing different cell types and the y-axis representing signal intensity.

Sle localization and function in mitotic cells and oocytes. (A) Changes of the signal intensities in various regions (1–4) from NEBD in oocytes expressing GFP-Sle and Rcc1-mCherry in addition to the oocyte in Fig. 2 A. Rcc1-mCherry in the nucleoplasm diffused quickly, but GFP-Sle diffused more slowly. Scale bar = 10 μm. (B) Fertility test of females expressing sle shRNA (RNAi 1) in ovaries. The number of progeny from five RNAi females in each vial was counted. (C) Syncytial mitosis in early embryos from sle RNAi mothers and control (no RNAi) mothers. Eggs from sle RNAi females (RNAi 1) were collected for 60 min and further aged for 90 min at 25°C and immunostained with antibodies against α-tubulin and the centrosomal protein CP190. Typical abnormalities in syncytial embryos from sle RNAi mothers include asynchronous divisions, free centrosomes, acentrosomal spindles, abnormally shaped spindles, chromosome mis-segregation, and unequal density of nuclei. (D) Quantification of early embryonic divisions. “Normal divisions” includes synchronous mitosis with bipolar spindles and centrosomes at the poles, interphase nuclei with a uniform density, and stages beyond cellularization. “Abnormal divisions” includes the abnormalities described in C. “Undeveloped” includes eggs with a few DNA masses. Normal divisions are significantly less frequent in sle RNAi embryos than control (P = 0.0001; n = 53, 71; Fisher’s exact test). ***P < 0.001. The error bars represent 95% confidence intervals of the frequencies of normal divisions. (E) Signal intensities of Sle, Chro, and Mgtor in metaphase I oocytes and mitotic S2 cells. S2 cells and mature oocytes were immunostained (shown in Fig. 3). The graphs show the total signal intensities in the spindle matrix area above the cytoplasm in mitotic S2 cells and metaphase I oocytes following normalization using the background. The horizontal lines represent the medians. n = 43, 46, 20, 28, 28, 18, 29, 18.

Figure S2.
A multi-panel image depicts changes in signal intensities and fertility tests in oocytes and embryos. Panel A shows two sets of microscopy images and corresponding line graphs. The images display GFP-Sle and Rcc1-mCherry intensities in oocytes. The line graphs plot GFP-Sle intensity and Rcc1-mCherry intensity over time, with the x-axis representing time in minutes and the y-axis representing intensity in arbitrary units. The graphs show different regions with varying intensities. Panel B is a scatter plot showing the number of progeny from females expressing sle shRNA and control females, with the x-axis representing individual females and the y-axis representing the number of progeny. Panel C contains microscopy images of syncytial mitosis in embryos from sle RNAi mothers and control mothers, stained with antibodies against tubulin and CP190. Panel D is a bar graph quantifying early embryonic divisions, with the x-axis representing control and sle RNAi groups and the y-axis representing the percentage of divisions. Panel E consists of scatter plots showing signal intensities of Sle, Chro, and Mgtor in metaphase I oocytes and mitotic S2 cells, with the x-axis representing different cell types and the y-axis representing signal intensity.

Sle localization and function in mitotic cells and oocytes. (A) Changes of the signal intensities in various regions (1–4) from NEBD in oocytes expressing GFP-Sle and Rcc1-mCherry in addition to the oocyte in Fig. 2 A. Rcc1-mCherry in the nucleoplasm diffused quickly, but GFP-Sle diffused more slowly. Scale bar = 10 μm. (B) Fertility test of females expressing sle shRNA (RNAi 1) in ovaries. The number of progeny from five RNAi females in each vial was counted. (C) Syncytial mitosis in early embryos from sle RNAi mothers and control (no RNAi) mothers. Eggs from sle RNAi females (RNAi 1) were collected for 60 min and further aged for 90 min at 25°C and immunostained with antibodies against α-tubulin and the centrosomal protein CP190. Typical abnormalities in syncytial embryos from sle RNAi mothers include asynchronous divisions, free centrosomes, acentrosomal spindles, abnormally shaped spindles, chromosome mis-segregation, and unequal density of nuclei. (D) Quantification of early embryonic divisions. “Normal divisions” includes synchronous mitosis with bipolar spindles and centrosomes at the poles, interphase nuclei with a uniform density, and stages beyond cellularization. “Abnormal divisions” includes the abnormalities described in C. “Undeveloped” includes eggs with a few DNA masses. Normal divisions are significantly less frequent in sle RNAi embryos than control (P = 0.0001; n = 53, 71; Fisher’s exact test). ***P < 0.001. The error bars represent 95% confidence intervals of the frequencies of normal divisions. (E) Signal intensities of Sle, Chro, and Mgtor in metaphase I oocytes and mitotic S2 cells. S2 cells and mature oocytes were immunostained (shown in Fig. 3). The graphs show the total signal intensities in the spindle matrix area above the cytoplasm in mitotic S2 cells and metaphase I oocytes following normalization using the background. The horizontal lines represent the medians. n = 43, 46, 20, 28, 28, 18, 29, 18.

Close Figure S2.
Figure 4.
A multi-panel image showing experimental results related to the function of Sle in oocytes.Panel A shows a Western blot image showing protein levels in various Sle RNA interference lines, probed with Sle and alpha-tubulin antibodies, with band intensities expressed as percentages relative to the control. Panel B shows fluorescence microscopy images of metaphase 1 spindles in control and Sle-silenced oocytes, immunostained for tubulin and DNA. Panel C shows a bar graph comparing metaphase 1 spindle morphologies in control and Sle-silenced oocytes, with categories, frequencies, and error bars. Panel D shows fluorescence microscopy images of Sle RNA interference oocytes at metaphase 1, immunostained for tubulin and Sle, highlighting Sle localization near the spindle. Panel E shows a bar graph comparing the frequencies of oocytes with Sle bubbles in control and Sle-silenced oocytes, including error bars and statistical significance indicators.

Sle is important for spindle organization in oocytes. (A) Western blot of ovaries from various sle RNAi lines probed with Sle and α-tubulin antibodies. The line B was obtained from Bloomington Drosophila Stock Center, while 1, 2, and 3 were generated for this study. shRNA against sle was expressed in ovaries after completion of recombination. Band intensities above the background are shown in percentages relative to the control. (B) Metaphase I spindles in control and sle-silenced oocytes. Oocytes were immunostained with Sle and α-tubulin antibodies. Spindles were generally bipolar but most have microtubule bundles branching out and/or split poles in sle-silenced oocytes. Scale bar = 10 μm. (C) Morphologies of the metaphase I spindle in control and sle-silenced oocytes. From the bottom to the top: (green) smooth bipolar spindles with focused poles, (orange) bipolar spindles with thin microtubule bundles branching out from the sides, (red) bipolar spindles with either split poles, or strong or many thin microtubule bundles branching out, and (gray) spindles with other morphologies including a nonbipolar spindles and multiple spindles. Note that meiotic spindles dynamically change their morphologies even during metaphase I arrest in wild type. The error bars represent 95% confidence intervals. P = 0.000012, 0.0000062 (frequencies of smooth bipolar spindles with focused poles compared with the control; Fisher’s exact test). ***P < 0.001. n = 80, 72, 74. (D) Sle bubbles in sle RNAi oocytes. sle-silenced oocytes (RNAi B) at metaphase I were immunostained with Sle and α-tubulin antibody. Sle was lost from the spindle, but showed bubble-like localization near the spindle. The arrows indicate the position of a Sle bubble. The brightness of Sle is enhanced. Scale bar = 10 μm. (E) Frequencies of oocytes with Sle bubbles from the no-RNAi control, modestly depleted RNAi B, and the most depleted RNAi 1. The error bars represent 95% confidence intervals. P = 0.000000, 0.00033 (compared with the control; Fisher’s exact test). ***P < 0.001. n = 40, 47, 32. Source data are available for this figure: SourceData F4.

Close Figure 4.
Figure 5.
A multi-panel image shows experimental results on chromosome orientation in oocytes. Panel A shows fluorescence microscopy images of control and Sle RNA interference 1 cells stained for Cen3, tubulin, and DNA, alongside a schematic and bar plot quantifying mono-oriented homologous centromere 3. Panel B shows a schematic of the gene-targeting strategy using guide sequences sh1 and sh2 to suppress Sle and a second messenger RNA. Panel C shows a bar graph comparing mono-oriented homologous centromere 3 frequencies across control and RNA interference conditions, with error bars and statistical significance indicators. Panel D shows fluorescence microscopy images of cells subjected to Cenp-E, Ndc80, Sle Cenp-E, and Sle Ndc80 RNA interference, stained for Cen3, tubulin, and DNA, with arrows indicating centromere locations.

Cosilencing of sle enhanced mono-orientation defects of Cenp-E/cmet or Ndc80 silencing. (A) Control and sle RNAi 1 metaphase I oocytes subjected to in situ hybridization probed with pericentromeric dodecasatellite specific to chromosome 3 and immunostaining with α-tubulin. In metaphase I, sister centromeres are attached and form one dot. Mono-oriented homologous centromere 3 (two dots were located closely or in the same half of the chromosome mass along the long axis of the spindle) was infrequent both in control and in sle RNAi. P = 0.063 (Fisher’s exact test). ns, P > 0.05. n = 65, 81. Scale bar = 10 μm. (B) Diagram of double RNAi. GAL4 drives transcription of RNA containing two short hairpins, which silence expression of sle and another gene. (C) Frequencies of mono-oriented homologous centromere 3 in metaphase I oocytes with silencing of a single gene alone or cosilencing of the gene and sle together (+sle; RNAi 1). Common names of the orthologs are used to indicate silenced Drosophila genes. Hurp = Mars, MKlp2 = Sub, NuMA = Mud, kinesin-5 = Klp61F, kinesin-13 = Klp10A, NEDD1 = Grip71, Prc1 = Feo, Augmin6 = Dgt6, Spc105 = Spc105R, Cenp-E = Cenp-meta (Cmet). Frequencies of mono-oriented homologous centromere 3 were not significantly different between single silencing and cosilencing with sle, except Cenp-E and Ndc80. The error bars represent 95% confidence intervals. P = 0.063, 0.42, 0.051, 0.76, 0.36, 1.0, 0.080. 0.081, 0.19, 0.14, 1, 0.12, 0.28, 0.78, 0.000001, 0.019 (between single and double RNAi; Fisher’s exact test). ***P < 0.001. *P < 0.05. ns, P > 0.05. n = 65, 81, 78, 16, 27, 17, 36, 14, 79, 79, 75, 70, 50, 48, 85, 76, 27, 27, 27, 48, 25, 27, 66, 46, 72, 26, 27, 24, 80, 81, 81, 65. (D) Metaphase I oocytes subjected to in situ hybridization probed with pericentromeric dodecasatellite specific to chromosome 3 and immunostaining with α-tubulin. The arrowheads indicate centromere 3 signals. Scale bar = 10 μm.

Close Figure 5.
Figure 6.
A multi-panel image shows various stages of cell division with different protein localizations. Panel A shows four sets of fluorescence microscopy images showing GFP-Gwl, tubulin, Sle, and merged signals with DNA staining during prophase 1 and metaphase 1, in lateral and end-on views. Panel B shows two magnified merged fluorescence microscopy images of GFP-Gwl, tubulin, and Sle in lateral and end-on views, with arrowheads indicating gaps between GFP-Gwl and spindle microtubules. Panel C shows a line graph of DNA, tubulin, Sle, and Gwl signal intensities along the spindle’s short axis, with distance in micrometers on the x-axis and signal intensity in arbitrary units on the y-axis. Panel D shows fluorescence microscopy images of Axs-GFP and mCherry-Gwl localization in metaphase 1 oocytes, including individual and merged signals. Panel E shows a line graph comparing Axs-GFP and mCherry-Gwl signal intensities along the spindle’s short axis, with distance in micrometers on the x-axis and signal intensity in arbitrary units on the y-axis.

Gwl kinase localizes to the spindle envelope. (A) Localization of Gwl in oocytes. Oocytes expressing GFP-Gwl were immunostained with antibodies against GFP and α-tubulin. GFP-Gwl surrounds the metaphase I spindle. Scale bars = 10 μm. (B) Magnified merged images of GFP-Gwl and α-tubulin or Sle. GFP-Gwl tightly surrounds Sle, while there are gaps between GFP-Gwl and the spindle microtubules. Scale bars = 10 μm. (C) Signal intensities along the line drawn in B on the short axis of the spindle. They are normalized against the maximum intensity of each channel. (D) Colocalization of Axs-GFP and mCherry-Gwl expressed in metaphase I oocytes. Oocytes co-expressing Axs-GFP and mCherry-Gwl were live-imaged. A single Z-plane is shown. n = 6. Scale bars = 10 μm. (E) Signal intensities along the line drawn in D on the short axis of the spindle. They are normalized against the maximum intensity of each channel.

Close Figure 6.
+ Expand view− Collapse view
Figure S3.
Figure S3. Refer to the image caption for details.Panel A shows gel electrophoresis images of protein samples before lysis, after lysis, after centrifugation, before and after gel purification, after purification and concentration, and bovine serum albumin samples containing 0.5 and 1 microgram. Panel B shows Western blot images of control and Gwl RNA interference samples probed with anti-Gwl and anti-Sle antibodies, alongside protein staining. Panel C shows immunofluorescence microscopy images of metaphase 1 oocytes under control and Gwl RNA interference conditions, stained for tubulin, Sle, Gwl, and DNA, with merged images showing spindle morphology. Panel D shows a bar graph comparing the percentage of mono-oriented homologous centromere 3 in control and Gwl RNA interference oocytes, with error bars representing 95 percent confidence intervals and three asterisks indicating statistical significance. Panel E shows a bar graph comparing spindle morphologies in control, Gwl RNA interference, Gwl and PP2A-B55 combined RNA interference, and PP2A-B55 RNA interference oocytes, categorized as normal thin bipolar spindles, broader bipolar spindles, apolar spindles, and other abnormalities, with error bars representing 95 percent confidence intervals. Panel F shows a dot plot comparing spindle widths in micrometers across control, Gwl RNA interference, Gwl and PP2A-B55 combined RNA interference, and PP2A-B55 RNA interference oocytes, with error bars and statistical significance indicators. Panel G shows immunofluorescence microscopy images of a metaphase 1 oocyte with Sle modestly silenced, stained for tubulin, Sle, Gwl, and DNA, including individual and merged images.

Gwl antibody, function and localization. (A) Production and purification of a Gwl fragment from bacteria for antibody production. Most GST-Gwl lacking 224–640 residues (dM1) was found in the insoluble fraction (pellet). Samples from various steps of purification were run together with BSA at known amounts for quantification. (B) Western blots of ovaries expressing shRNA against gwl (gwl RNAi) and control (no RNAi) using the anti-Gwl or anti-Sle antibody, and protein staining of the same membranes as a loading and blotting control. (C) Spindle morphologies in control and gwl RNAi oocytes in metaphase I. Oocytes were immunostained with antibodies against α-tubulin, Sle, and Gwl. Scale bars = 10 μm. (D) Control and gwl RNAi metaphase I oocytes subjected to in situ hybridization probed with pericentromeric dodecasatellite specific to chromosome 3 and immunostaining with α-tubulin. Oocytes with mono-oriented homologous centromere 3 were more frequent in gwl RNAi than in control. The error bars represent 95% confidence intervals. P = 0.0075 (Fisher’s exact test). **P < 0.01. n = 92, 81. (E) Spindle morphologies in control, gwl RNAi, gwl PP2A-B55 RNAi, and PP2A-B55 RNAi oocytes in metaphase I. From the bottom to the top in the graph: normal thin bipolar spindles (green), broader bipolar spindles (orange), apolar spindles (red), and spindles with other abnormalities (including spindles with split poles or with branched microtubule bundles, tripolar spindles, multiple separate spindles; gray). The error bars represent 95% confidence intervals. ***P < 0.001. ns, P > 0.05. P = 0.00000000, 0.12, 0.83 (comparing the frequencies of smooth bipolar spindles with focused poles; Fisher’s exact test). n = 76, 76, 64, 35. Scale bar = 10 μm. (F) Spindle widths in control, gwl RNAi, gwl PP2A-B55 RNAi, and PP2A-B55 RNAi oocytes in metaphase I. p = 2.22 × 10⁻¹⁶, 0.0000040, 0.44 (compared with the control; U test). ***P < 0.001. ns, P > 0.05. n = 133, 109, 45, 22. (G) Immunostaining of a metaphase I oocyte with sle modestly silenced (RNAi B) using antibodies against α-tubulin, Sle, and Gwl. Gwl did not localize to a Sle bubble. Scale bar = 10 μm. Source data are available for this figure: SourceData FS3.

Figure S3.
A multi-panel image showing protein analysis and cell imaging.Panel A shows gel electrophoresis images of protein samples before lysis, after lysis, after centrifugation, before and after gel purification, after purification and concentration, and bovine serum albumin samples containing 0.5 and 1 microgram. Panel B shows Western blot images of control and Gwl RNA interference samples probed with anti-Gwl and anti-Sle antibodies, alongside protein staining. Panel C shows immunofluorescence microscopy images of metaphase 1 oocytes under control and Gwl RNA interference conditions, stained for tubulin, Sle, Gwl, and DNA, with merged images showing spindle morphology. Panel D shows a bar graph comparing the percentage of mono-oriented homologous centromere 3 in control and Gwl RNA interference oocytes, with error bars representing 95 percent confidence intervals and three asterisks indicating statistical significance. Panel E shows a bar graph comparing spindle morphologies in control, Gwl RNA interference, Gwl and PP2A-B55 combined RNA interference, and PP2A-B55 RNA interference oocytes, categorized as normal thin bipolar spindles, broader bipolar spindles, apolar spindles, and other abnormalities, with error bars representing 95 percent confidence intervals. Panel F shows a dot plot comparing spindle widths in micrometers across control, Gwl RNA interference, Gwl and PP2A-B55 combined RNA interference, and PP2A-B55 RNA interference oocytes, with error bars and statistical significance indicators. Panel G shows immunofluorescence microscopy images of a metaphase 1 oocyte with Sle modestly silenced, stained for tubulin, Sle, Gwl, and DNA, including individual and merged images.

Gwl antibody, function and localization. (A) Production and purification of a Gwl fragment from bacteria for antibody production. Most GST-Gwl lacking 224–640 residues (dM1) was found in the insoluble fraction (pellet). Samples from various steps of purification were run together with BSA at known amounts for quantification. (B) Western blots of ovaries expressing shRNA against gwl (gwl RNAi) and control (no RNAi) using the anti-Gwl or anti-Sle antibody, and protein staining of the same membranes as a loading and blotting control. (C) Spindle morphologies in control and gwl RNAi oocytes in metaphase I. Oocytes were immunostained with antibodies against α-tubulin, Sle, and Gwl. Scale bars = 10 μm. (D) Control and gwl RNAi metaphase I oocytes subjected to in situ hybridization probed with pericentromeric dodecasatellite specific to chromosome 3 and immunostaining with α-tubulin. Oocytes with mono-oriented homologous centromere 3 were more frequent in gwl RNAi than in control. The error bars represent 95% confidence intervals. P = 0.0075 (Fisher’s exact test). **P < 0.01. n = 92, 81. (E) Spindle morphologies in control, gwl RNAi, gwl PP2A-B55 RNAi, and PP2A-B55 RNAi oocytes in metaphase I. From the bottom to the top in the graph: normal thin bipolar spindles (green), broader bipolar spindles (orange), apolar spindles (red), and spindles with other abnormalities (including spindles with split poles or with branched microtubule bundles, tripolar spindles, multiple separate spindles; gray). The error bars represent 95% confidence intervals. ***P < 0.001. ns, P > 0.05. P = 0.00000000, 0.12, 0.83 (comparing the frequencies of smooth bipolar spindles with focused poles; Fisher’s exact test). n = 76, 76, 64, 35. Scale bar = 10 μm. (F) Spindle widths in control, gwl RNAi, gwl PP2A-B55 RNAi, and PP2A-B55 RNAi oocytes in metaphase I. p = 2.22 × 10⁻¹⁶, 0.0000040, 0.44 (compared with the control; U test). ***P < 0.001. ns, P > 0.05. n = 133, 109, 45, 22. (G) Immunostaining of a metaphase I oocyte with sle modestly silenced (RNAi B) using antibodies against α-tubulin, Sle, and Gwl. Gwl did not localize to a Sle bubble. Scale bar = 10 μm. Source data are available for this figure: SourceData FS3.

Close Figure S3.
Figure 7.
A multi-panel image showing the effects of various RNAi treatments on spindle envelope kinase Gwl and spindle matrix protein Sle in oocytes. Panel A shows fluorescence microscopy images of control cells stained for DNA, tubulin, Sle, and Gwl, including merged tubulin and Sle signals. Panel B shows control cells after cold treatment, with DNA, tubulin, Sle, Gwl, and merged DNA and Sle signals. Panel C shows fluorescence microscopy images of Gwl RNA interference cells stained for DNA, tubulin, Sle, and Gwl, including merged signals. Panel D shows Gwl RNA interference cells after cold treatment, with DNA, tubulin, Sle, Gwl, and merged DNA and Sle signals. Panel E shows Gwl B55 RNA interference cells stained for DNA, tubulin, Sle, and Gwl, including merged tubulin and Sle signals. Panel F shows Gwl B55 RNA interference cells after cold treatment, with DNA, tubulin, Sle, Gwl, and merged DNA and Sle signals. Panel G shows B55 RNA interference cells stained for DNA, tubulin, Sle, and Gwl, including merged tubulin and Sle signals. Panel H shows B55 RNA interference cells after cold treatment, with DNA, tubulin, Sle, Gwl, and merged DNA and Sle signals. Panel I shows a dot plot comparing Sle minus tubulin width across control, Gwl RNA interference, Gwl B55 RNA interference, and B55 RNA interference conditions, with significance annotations. Panel J shows a dot plot comparing Sle minus DNA length across the same conditions, with cold treatment indicated and significance annotations. Panel K shows dot plots of total Sle intensity above background across control, Gwl RNA interference, Gwl B55 RNA interference, and B55 RNA interference conditions, comparing untreated and cold-treated cells with significance annotations.

Spindle envelope kinase Gwl promotes assembly of the Sle spindle matrix through suppression of PP2A-B55. (A–H) Oocytes from various genotypes and conditions (±cold) were immunostained with antibodies against α-tubulin, Sle, and Gwl. The rightmost panels are merged images with a higher magnification than the others. Underlines indicate channels expected to have weak or diffused signals due to RNAi or depolymerization. Scale bars = 10 μm. (A) Control metaphase I oocyte without RNAi. Gwl tightly surrounds Sle, which localizes broader than the spindle. (B) Control metaphase I oocyte without RNAi after microtubule depolymerization by cold treatment. Gwl tightly surrounds Sle, which still occupies a large area around the chromosomes. (C) Metaphase I oocyte in which gwl was silenced. Sle localization mirrored the spindle microtubules on gwl silencing, rather than broader localization in the control. (D) Metaphase I oocyte in which gwl was silenced and microtubules were depolymerized by cold treatment. Sle localized to only a small region around the chromosomes after microtubule depolymerization, rather than to a large area around the chromosomes in the control plus cold (B). (E) Metaphase I oocyte in which PP2A-B55 was cosilenced with gwl. Cosilencing of PP2A-B55 restored a broader Sle localization compared with a gwl-silenced oocyte (C). (F) Metaphase I oocyte in which PP2A-B55 was cosilenced with gwl and microtubules were depolymerized. Cosilencing of PP2A-B55 restored Sle localization to a large area around the chromosomes compared with a gwl-silenced oocyte (D). (G) Metaphase I oocyte in which PP2A-B55 was silenced. (H) Metaphase I oocyte in which PP2A-B55 was silenced and microtubules were depolymerized by cold treatment. (I) Width of the Sle area minus the width of the spindle without cold treatment. The Sle area is wider than the spindle without gwl silencing, while gwl silencing dramatically reduced the difference. The median is marked with a horizontal line. Cosilencing of PP2A-B55 restored wider Sle localization. P = 0.63 × 10⁻¹³, 0.072, 0.77 (compared with the control; U test). ***P < 0.001. ns, P > 0.05. n = 114, 67, 45, 22. (J) Long axis of the Sle area minus the length of the chromosome mass after microtubule depolymerization by cold treatment. Even after microtubules are depolymerized, the Sle area remains larger than the chromosome mass without RNAi. gwl silencing dramatically decreased the length of the Sle area, while cosilencing of PP2A-B55 rescued this effect of gwl silencing. P = 0.00000011, 0.081, 0.22 (compared with the control; U test). ***P < 0.001. ns, P > 0.05. n = 40, 17, 25, 25. (K) Total intensity of the Sle signal around the chromosomes above the cytoplasmic background after normalization using the mean background. The Sle total intensity did not decrease on gwl silencing without microtubule depolymerization by cold, while it dramatically reduced after microtubule depolymerization. P = 0.22, 0.000057, 0.78, 0.81 (compared between with and without cold treatment; U test). ***P < 0.001. ns, P > 0.05. n = 83, 42, 45, 24, 51, 29, 23, 24.

Close Figure 7.
Figure 8.
A multi-panel image showing the localization of proteins in oocytes, graphs plotting measurements, and a summary diagram. Panel A shows microscopy images of control and Sle RNA interference oocytes stained for DNA, tubulin, Sle, and Gwl proteins, with merged images at higher magnification. Panel B shows a dot plot comparing the width of the Gwl-surrounded area minus spindle width in control and Sle RNA interference oocytes, measured in micrometers. Panel C shows microscopy images of control and Sle RNA interference oocytes after cold treatment, stained for DNA, tubulin, Sle, and Gwl proteins, with merged images at higher magnification. Panel D shows a scatter plot comparing the long and short axes of the Gwl-surrounded area minus the chromosome masses in control and Sle RNA interference oocytes, with both axes measured in micrometers. Panel E shows a summary diagram illustrating the effects of Sle or Gwl depletion on the Sle spindle matrix and Gwl spindle envelope. Panel F shows a diagram illustrating how Gwl promotes Sle assembly into the spindle matrix by suppressing PP2A-B55.

Sle is an integral component of the spindle matrix, which determines the location of the Gwl spindle envelope. (A) Localization of the endogenous Gwl in control and sle-silenced metaphase I oocytes. Oocytes were immunostained with antibodies against α-tubulin, Sle, and Gwl. Single focal planes are shown. The rightmost panels are merged images with a higher magnification than the others. Underlines indicate channels expected to have weak or diffused signals due to RNAi or depolymerization. Gwl collapsed onto spindle microtubules after sle silencing. Scale bars = 10 μm. (B) Width of the Gwl-surrounded area subtracted by the width of the spindle is plotted in control and sle-silenced (RNAi 1) oocytes. Underlines indicate channels expected to have weak or diffused signals due to RNAi or depolymerization. The red horizontal lines represent the median. sle silencing reduces the width of the Gwl-surrounded area compared with the spindle. P = 0.0016 (U test). **P < 0.01. n = 30, 31. (C) Localization of Gwl in control and sle-silenced (RNAi 1) metaphase I oocytes after microtubule depolymerization by cold treatment. Oocytes were immunostained with antibodies against α-tubulin, Sle, and Gwl. Single focal planes are shown. The rightmost panels are merged images with a higher magnification than the others. Underlines indicate channels expected to have weak or diffused signals due to RNAi or depolymerization. Gwl collapsed onto the chromosomes after sle silencing and microtubule depolymerization. Scale bars = 10 μm. (D) Long and short axes of the Gwl-surrounded area are subtracted by the long and short axes of the chromosome masses, respectively, in control and sle-silenced oocytes. Horizontal and vertical lines represent the medians. P = 0.0016, 0.0011 (long and short axes; U test). **P < 0.01. n = 18, 12 (control, sle RNAi). (E) Summary diagram of the effects of Sle or Gwl depletion on the Sle spindle matrix and the Gwl spindle envelope. (F) Gwl promotes the assembly of Sle into the spindle matrix by suppressing PP2A-B55.

Close Figure 8.

References

Ashburner
,
M.
,
K.
Golic
, and
R.S.
Hawley
.
2011
.
Drosophila: A Laboratory Handbook
.
Cold Spring Harbor Laboratory Press
,
New York
.
Castro
,
A.
, and
T.
Lorca
.
2018
.
Greatwall kinase at a glance
.
J. Cell Sci.
131
:
jcs222364
.
Civelekoglu-Scholey
,
G.
,
L.
Tao
,
I.
Brust-Mascher
,
R.
Wollman
, and
J.M.
Scholey
.
2010
.
Prometaphase spindle maintenance by an antagonistic motor-dependent force balance made robust by a disassembling lamin-B envelope
.
J. Cell Biol.
188
:
49
–
68
.
Clohisey
,
S.M.R.
,
N.S.
Dzhindzhev
, and
H.
Ohkura
.
2014
.
Kank is an EB1 interacting protein that localises to muscle-Tendon attachment sites in Drosophila
.
PLoS One
.
9
:e114770.
Colombié
,
N.
,
C.F.
Cullen
,
A.L.
Brittle
,
J.K.
Jang
,
W.C.
Earnshaw
,
M.
Carmena
,
K.
McKim
, and
H.
Ohkura
.
2008
.
Dual roles of incenp crucial to the assembly of the acentrosomal metaphase spindle in female meiosis
.
Development
.
135
:
3239
–
3246
.
Costa
,
M.F.A.
, and
H.
Ohkura
.
2019
.
The molecular architecture of the meiotic spindle is remodeled during metaphase arrest in oocytes
.
J. Cell Biol.
218
:
2854
–
2864
.
Dumont
,
J.
, and
A.
Desai
.
2012
.
Acentrosomal spindle assembly and chromosome segregation during oocyte meiosis
.
Trends Cell Biol.
22
:
241
–
249
.
Ferreira
,
L.T.
, and
H.
Maiato
.
2021
.
Prometaphase
.
Semin. Cell Dev. Biol.
117
:
52
–
61
.
Forer
,
A.
1965
.
Local reduction of spindle fiber birefringence in living Nephrotoma suturalis (Loew) spermatocytes induced by ultraviolet microbeam irradiation
.
J. Cell Biol.
25
:
95
–
117
.
García-Blanco
,
N.
,
A.
Vázquez-Bolado
, and
S.
Moreno
.
2019
.
Greatwall-endosulfine: A molecular switch that regulates PP2A/B55 protein phosphatase activity in dividing and quiescent cells
.
Int. J. Mol. Sci.
20
:
6228
.
Głuszek
,
A.A.
,
C.F.
Cullen
,
W.
Li
,
R.A.
Battaglia
,
S.J.
Radford
,
M.F.
Costa
,
K.S.
McKim
,
G.
Goshima
, and
H.
Ohkura
.
2015
.
The microtubule catastrophe promoter Sentin delays stable kinetochore-microtubule attachment in oocytes
.
J. Cell Biol.
211
:
1113
–
1120
.
Goldman
,
R.D.
, and
L.I.
Rebhun
.
1969
.
The structure and some properties of the isolated mitotic apparatus
.
J. Cell Sci.
4
:
179
–
209
.
Goshima
,
G.
,
R.
Wollman
,
S.S.
Goodwin
,
N.
Zhang
,
J.M.
Scholey
,
R.D.
Vale
, and
N.
Stuurman
.
2007
.
Genes required for mitotic spindle assembly in Drosophila S2 cells
.
Science
.
316
:
417
–
421
.
Huang
,
Y.
,
T.
Li
,
S.C.
Ems-McClung
,
C.E.
Walczak
,
C.
Prigent
,
X.
Zhu
,
X.
Zhang
, and
Y.
Zheng
.
2018
.
Aurora A activation in mitosis promoted by BuGZ
.
J. Cell Biol.
217
:
107
–
116
.
Jiang
,
H.
,
S.
Wang
,
Y.
Huang
,
X.
He
,
H.
Cui
,
X.
Zhu
, and
Y.
Zheng
.
2015
.
Phase transition of spindle-associated protein regulate spindle Apparatus assembly
.
Cell
.
163
:
108
–
122
.
Johansen
,
J.
, and
K.M.
Johansen
.
2009
.
The spindle matrix through the cell cycle in Drosophila
.
Fly (Austin)
.
3
:
213
–
220
.
Johansen
,
K.M.
,
A.
Forer
,
C.
Yao
,
J.
Girton
, and
J.
Johansen
.
2011
.
Do nuclear envelope and intranuclear proteins reorganize during mitosis to form an elastic, hydrogel-like spindle matrix?
Chromosome Res.
19
:
345
–
365
.
Johansen
,
K.M.
, and
J.
Johansen
.
2007
.
Cell and molecular biology of the spindle matrix
.
Int. Rev. Cytol.
263
:
155
–
206
.
Kline-Smith
,
S.L.
, and
C.E.
Walczak
.
2004
.
Mitotic spindle assembly and chromosome segregation: Refocusing on microtubule dynamics
.
Mol. Cell
.
15
:
317
–
327
.
Kramer
,
J.
, and
R.S.
Hawley
.
2003
.
The spindle-associated transmembrane protein Axs identifies a membranous structure ensheathing the meiotic spindle
.
Nat. Cell Biol.
5
:
261
–
263
.
Kyogoku
,
H.
, and
T.S.
Kitajima
.
2023
.
The large cytoplasmic volume of oocyte
.
J. Reprod. Dev.
69
:
1
–
9
.
Lee
,
W.L.
, and
P.
Wadsworth
.
2009
.
New spindle morphogenesis model by Dynein, Nudel, and the spindle matrix
.
Cell Res.
19
:
529
–
531
.
Lince-Faria
,
M.
,
S.
Maffini
,
B.
Orr
,
Y.
Ding
,
C.
Florindo
,
C.E.
Sunkel
,
Á.
Tavares
,
J.
Johansen
,
K.M.
Johansen
, and
H.
Maiato
.
2009
.
Spatiotemporal control of mitosis by the conserved spindle matrix protein megator
.
J. Cell Biol.
184
:
647
–
657
.
Ma
,
L.
,
M.-Y.
Tsai
,
S.
Wang
,
B.
Lu
,
R.
Chen
,
J.R.
Yates
,
X.
Zhu
, and
Y.
Zheng
.
2009
.
Requirement for Nudel and dynein for assembly of the lamin B spindle matrix
.
Nat. Cell Biol.
11
:
247
–
256
.
Ohkura
,
H.
2015
.
Meiosis: An overview of key differences from mitosis
.
Cold Spring Harb. Perspect. Biol.
7
:
a015859
.
Orihara-Ono
,
M.
,
E.
Suzuki
,
M.
Saito
,
Y.
Yoda
,
T.
Aigaki
, and
C.
Hama
.
2005
.
The slender lobes gene, identified by retarded mushroom body development, is required for proper nucleolar organization in Drosophila
.
Dev. Biol.
281
:
121
–
133
.
Pickett-Heaps
,
J.D.
,
A.
Forer
, and
T.
Spurck
.
1997
.
Traction fibre: Toward a “tensegral” model of the spindle
.
Cell Motil. Cytoskeleton
.
37
:
1
–
6
.
Qi
,
H.
,
U.
Rath
,
Y.
Ding
,
Y.
Ji
,
M.J.
Blacketer
,
J.
Girton
,
J.
Johansen
, and
K.M.
Johansen
.
2005
.
EAST interacts with megator and localizes to the putative spindle matrix during mitosis in Drosophila
.
J. Cell Biochem.
95
:
1284
–
1291
.
Qi
,
H.
,
U.
Rath
,
D.
Wang
,
Y.-Z.
Xu
,
Y.
Ding
,
W.
Zhang
,
M.J.
Blacketer
,
M.R.
Paddy
,
J.
Girton
,
J.
Johansen
, and
K.M.
Johansen
.
2004
.
Megator, an essential coiled-coil protein that localizes to the putative spindle matrix during mitosis in Drosophila
.
Mol. Biol. Cell
.
15
:
4854
–
4865
.
Radford
,
S.J.
,
T.L.
Hoang
,
A.A.
Głuszek
,
H.
Ohkura
, and
K.S.
McKim
.
2015
.
Lateral and end-on kinetochore attachments are coordinated to achieve bi-orientation in Drosophila oocytes
.
PLoS Genet.
11
:e1005605.
Rangone
,
H.
,
E.
Wegel
,
M.K.
Gatt
,
E.
Yeung
,
A.
Flowers
,
J.
Debski
,
M.
Dadlez
,
V.
Janssens
,
A.T.C.
Carpenter
, and
D.M.
Glover
.
2011
.
Suppression of scant identifies endos as a substrate of greatwall kinase and a negative regulator of protein phosphatase 2a in mitosis
.
PLoS Genet.
7
:e100225.
Rath
,
U.
,
D.
Wang
,
Y.
Ding
,
Y.-Z.
Xu
,
H.
Qi
,
M.J.
Blacketer
,
J.
Girton
,
J.
Johansen
, and
K.M.
Johansen
.
2004
.
Chromator, a novel and essential chromodomain protein interacts directly with the putative spindle matrix protein skeletor
.
J. Cell Biochem.
93
:
1033
–
1047
.
Repton
,
C.
,
C.
Fiona Cullen
,
M.F.A.
Costa
,
C.
Spanos
,
J.
Rappsilber
, and
H.
Ohkura
.
2022
.
The phospho-docking protein 14-3-3 regulates microtubule-associated proteins in oocytes including the chromosomal passenger Borealin
.
PLoS Genet.
18
:e1009995.
Romé
,
P.
, and
H.
Ohkura
.
2018
.
Combining microscopy and biochemistry to study meiotic spindle assembly in Drosophila oocytes
.
Methods Cell Biol.
145
:
237
–
248
.
Sambrook
,
J.
1989
.
Molecular Cloning
.
Cold Spring Harbor Laboratory Press
,
New York
.
Schweizer
,
N.
,
N.
Pawar
,
M.
Weiss
, and
H.
Maiato
.
2015
.
An organelle-exclusion envelope assists mitosis and underlies distinct molecular crowding in the spindle region
.
J. Cell Biol.
210
:
695
–
704
.
Schweizer
,
N.
,
M.
Weiss
, and
H.
Maiato
.
2014
.
The dynamic spindle matrix
.
Curr. Opin. Cell Biol.
28
:
1
–
7
.
Smith
,
D.E.
, and
P.A.
Fisher
.
1984
.
Identification, developmental regulation, and response to heat shock of two antigenically related forms of a major nuclear envelope protein in Drosophila embryos: Application of an improved method for affinity purification of antibodies using polypeptides immobilized on nitrocellulose blots
.
J. Cell Biol.
99
,
20
-
28
.
So
,
C.
,
K.B.
Seres
,
A.M.
Steyer
,
E.
Mönnich
,
D.
Clift
,
A.
Pejkovska
,
W.
Möbius
, and
M.
Schuh
.
2019
.
A liquid-like spindle domain promotes acentrosomal spindle assembly in mammalian oocytes
.
Science
.
364
:eaat9557.
Tsai
,
M.-Y.
,
S.
Wang
,
J.M.
Heidinger
,
D.K.
Shumaker
,
S.A.
Adam
,
R.D.
Goldman
, and
Y.
Zheng
.
2006
.
A mitotic lamin b matrix induced by RanGTP required for spindle assembly
.
Science
.
311
:
1887
–
1893
.
Valdez
,
V.A.
,
L.
Neahring
,
S.
Petry
, and
S.
Dumont
.
2023
.
Mechanisms underlying spindle assembly and robustness
.
Nat. Rev. Mol. Cell Biol.
24
:
523
–
542
.
Walker
,
D.L.
,
D.
Wang
,
Y.
Jin
,
U.
Rath
,
Y.
Wang
,
J.
Johansen
, and
K.M.
Johansen
.
2000
.
Skeletor, a novel chromosomal protein that redistributes during mitosis provides evidence for the formation of a spindle matrix
.
J. Cell Biol.
151
:
1401
–
1412
.
Wan
,
X.
,
G.
Pavlova
,
C.F.
Cullen
,
I.
Dasuzhau
,
A.
Ciszek
, and
H.
Ohkura
.
2025
.
Identification of locally activated spindle-associated proteins in oocytes uncovers a phosphatase-driven mechanism
.
J. Cell Sci.
138
:
jcs264161
.
Wang
,
P.
,
J.A.
Galan
,
K.
Normandin
,
É.
Bonneil
,
G.R.
Hickson
,
P.P.
Roux
,
P.
Thibault
, and
V.
Archambault
.
2013
.
Cell cycle regulation of Greatwall kinase nuclear localization facilitates mitotic progression
.
J. Cell Biol.
202
:
277
–
293
.
Whitfield
,
W.G.
,
M.A.
Chaplin
,
K.
Oegema
,
H.
Parry
, and
D.M.
Glover
.
1995
.
The 190 kDa centrosome-associated protein of Drosophila melanogaster contains four zinc finger motifs and binds to specific sites on polytene chromosomes
.
J. Cell Sci.
108
:
3377
–
3387
.
Woodruff
,
J.B.
2018
.
Assembly of mitotic structures through phase separation
.
J. Mol. Biol.
430
:
4762
–
4772
.
Yao
,
C.
,
C.
Wang
,
Y.
Li
,
Y.
Ding
,
U.
Rath
,
S.
Sengupta
,
J.
Girton
,
K.M.
Johansen
, and
J.
Johansen
.
2014
.
The spindle matrix protein, chromator, is a novel tubulin binding protein that can interact with both microtubules and free tubulin
.
PLoS One
.
9
:e103855.
Zheng
,
Y.
2010
.
A membranous spindle matrix orchestrates cell division
.
Nat. Rev. Mol. Cell Biol.
11
:
529
–
535
.

or Create an Account

Close subscription notice
Close access options