The malaria-causing parasite, P. falciparum, replicates through schizogony, a tightly orchestrated process where numerous daughter parasites are formed simultaneously. Proper division and segregation of one-per-cell organelles, like the mitochondrion and apicoplast, are essential, yet remain poorly understood. We developed a new reporter parasite line that allows visualization of the mitochondrion in blood and mosquito stages. Using high-resolution 3D imaging, we found that the mitochondrion orients in a cartwheel structure, prior to stepwise, non-geometric division during last-stage schizogony. Analysis of focused ion beam scanning electron microscopy data confirmed these mitochondrial division stages. Furthermore, these data allowed us to elucidate apicoplast division steps, highlighted its close association with the mitochondrion, and showed putative roles of the centriolar plaques in apicoplast segregation. These observations form the foundation for a new detailed mechanistic model of mitochondrial and apicoplast division and segregation during P. falciparum schizogony and pave the way for future studies into the proteins and protein complexes involved in organelle division and segregation.
Introduction
Malaria is a devastating parasitic disease causing an estimated 249 million cases resulting in ∼608,000 deaths in 2022, especially in children under 5 years old (WHO, 2023). Plasmodium falciparum is the most virulent parasite species causing malaria. The continued emergence of resistant parasites to antimalarial drugs is a major problem for global malaria control and necessitates the continued development of novel antimalarials.
The malaria parasite harbors a unique mitochondrion that differs greatly from the human mitochondrion at a molecular and functional level (Vaidya and Mather, 2009). While the most prominent role of the mitochondrion in humans is respiration and consequent energy conversion, in the disease-causing asexual blood stages of P. falciparum, the respiratory chain appears to be exclusively essential to support pyrimidine biosynthesis (Painter et al., 2007). It is only during preparation for transition to the mosquito vector, where sexual reproduction takes place, that canonical mitochondrial functions such as the tricarboxylic acid cycle and the oxidative phosphorylation pathway become more abundant and critical (Ke et al., 2015; Evers et al., 2021). Because of these differences, it is not surprising that this organelle is the drug target of several antimalarial compounds, such as atovaquone, DSM265, proguanil, and ELQ300 (Lamb et al., 2023; Goodman et al., 2017).
Host and stage transitions are commonplace in the complicated life cycle of Plasmodium parasites. During erythrocytic asexual replication, one parasite is segmented into ∼32 merozoites through a tightly orchestrated process called schizogony. Cell division happens on a much larger scale in mosquito and liver stages, where one parasite is divided into thousands or even tens of thousands of daughter parasites. During P. falciparum cell division, the single parasite mitochondrion needs to be properly divided and distributed among the daughter cells (Verhoef et al., 2021). During parasite development in asexual blood stages, the tubular mitochondrion elongates and forms a large, branched network that stretches throughout the parasite (van Dooren et al., 2005). Only during the final stages of schizogony, once nuclear division is completed, does the mitochondrion undergo rapid fission (Rudlaff et al., 2020). The apicoplast, another essential single-copy organelle of secondary endosymbiotic origin, forms a comparable branched network but divides prior to mitochondrial fission during blood- and liver-stage replication (van Dooren et al., 2005; Stanway et al., 2011). To produce viable offspring, the parasite has to ensure that each daughter parasite has a complete set of these organelles. However, so far a detailed view of these processes and the mechanisms involved is lacking.
We aimed to capture the process of mitochondrial division in these multinucleated cells in detail using different imaging methods. However, this comes with several challenges. First, imaging the small-sized parasites (1–7 μm diameter), and the even smaller organelles within the parasites, requires the use of super-resolution imaging techniques. Second, visualization of the mitochondrion requires a specific fluorescent marker or dye. Mitochondrial dyes, such as Rhodamine 123 and MitoTracker, have been widely used in the field (Linzke et al., 2020). These dyes rely on membrane potential to enter the mitochondrion and are therefore also used as a viability marker (Painter et al., 2010). However, eight of these dyes were tested in a drug screen all showing IC50 values below 1 μM with three, namely, Mito Red, DiOC6, and Rhodamine B, being highly active against P. falciparum with IC50 values below 30 nM (Joanny et al., 2012; Gebru et al., 2014). Additionally, in our hands, the MitoTracker signal can be diffuse and therefore limit the resolution that is needed for the visualization of mitochondrial fission. Hence, we aimed to develop a reporter parasite line that harbors a fluorescent mitochondrial marker that allows imaging of this organelle in live and fixed conditions in all life-cycle stages of P. falciparum. To do this, we deployed a similar strategy that has been used successfully in the rodent model Plasmodium berghei (Matz et al., 2018; van Esveld et al., 2021). The targeting signal of the known mitochondrial protein HSP70-3 was fused with a fluorescent protein and integrated into a silent intergenic locus (SIL) (Kooij et al., 2012). Expression of this mitochondrial-localized fluorescent protein allowed visualization of the organelle during imaging of asexual, sexual, and mosquito stages. Using high-resolution confocal microscopy, we were able to make a detailed 3D map of different mitochondrial fission stages during schizogony in asexual blood stages. Focused ion beam scanning electron microscopy (FIB-SEM) image stacks from Evers et al. were used to confirm these mitochondrial fission stages with high detail (Evers et al., 2024). This also allowed us to study apicoplast division and highlighted the potential role of the centriolar plaques (CPs) in apicoplast segregation. These different microscopic approaches empowered us to put forward a detailed model for mitochondrial and apicoplast division and distribution during the final stages of schizogony.
Results
To acquire a detailed understanding of mitochondrial fission and distribution, we set out to capture this process throughout the Plasmodium life cycle by combining different microscopy approaches. We stained mature blood-stage wild-type P. falciparum NF54 strain parasites with two different MitoTracker dyes and used these to visualize the mitochondrion in fixed confocal imaging. Surprisingly, both MitoTracker dyes showed a discontinuous, punctate staining pattern (Fig. 1 A). FIB-SEM studies have confirmed the prevailing notion that the mitochondrion is a single, branched network during these schizont stages (Evers et al., 2024). While this observation may arise from crosslinking of the MitoTracker dyes to specific proteins and aggregations thereof resulting from the fixation process, we concluded that the punctate staining pattern is likely an artifact and consequently limits our ability to dissect and visualize the process of mitochondrial fission. To address this, we developed a new fluorescent mitochondrial marker that can be used for imaging live and fixed samples (Fig. S1).
Design and generation of a new mitochondrial marker parasite line
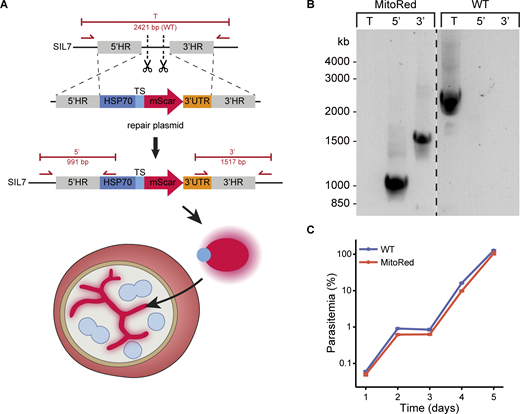
We designed a mitochondrial marker that consists of the promotor and mitochondrial targeting sequence of the gene encoding the mitochondrial heat shock protein 70 (HSP70-3, PF3D7_1134000), fused to an mScarlet red fluorescent protein (Fig. S1 A). HSP70-3 was selected based on its high and consistent expression profile throughout the whole life cycle and has been successfully used for the same purpose in P. berghei (Matz et al., 2018; van Esveld et al., 2021). We aimed to stably integrate this fluorescent marker in the P. falciparum genome without affecting any normal biological processes and parasite growth throughout the parasite life cycle. Consideration for the selection of the new integration site, SIL7, is described extensively in the discussion. The integration plasmid was transfected into NF54 parasites together with two different Cas9 guide plasmids directed at the SIL7 site. Successful integration of the mitochondrial marker and absence of WT parasite contaminations were confirmed by integration PCR (Fig. S1 B). A growth assay showed no difference in the growth of the mitochondrial reporter line, MitoRed, compared with WT parasites in asexual blood stages (Fig. S1 C).
Characterization of the MitoRed parasite line
To visualize the mitochondrial marker, asexual blood-stage MitoRed parasites were fixed and used for fluorescent imaging. The fluorescent signal was well preserved after fixation and no antibody staining was required for mitochondrial visualization in all asexual blood stages (Fig. 1 B). To assess whether the punctate mitochondrial morphology observed after MitoTracker staining was an imaging artifact or a morphological aberration caused by the dye, we stained MitoRed parasites with three different MitoTracker dyes. Discontinuous, punctate mitochondria were observed in all MitoRed parasites stained with MitoTracker, while this was not observed in unstained MitoRed parasites (Fig. 1 C). The effect was less pronounced during live imaging of MitoTracker-stained parasites (Fig. S2). While there is an obvious imaging artifact following the fixation of MitoTracker-stained blood-stage P. falciparum parasites, the altered MitoRed signal in the presence of the dye might even suggest possible changes in mitochondrial morphology.
Mitochondrial dynamics during gametocyte development and activation
To study mitochondrial dynamics throughout the malaria parasite life cycle, MitoRed parasites were induced to form gametocytes, which were fixed for microscopy on days 5, 7, 10, and 13 after induction. Parasites were stained for α tubulin to distinguish male and female gametocytes in stages IV and V. For each stage, between 11 and 19 parasites were imaged over two independent experiments, and described observations were consistent over all analyzed parasites. In stages II and III gametocytes, the mitochondrion appears as a small knot that increases slightly in size when gametocytes become more mature (Fig. 2 A). This is consistent with our FIB-SEM data (Evers et al., 2024). Evers et al. also showed that gametocytes have multiple mitochondria already from early gametocyte development onward. Although light microscopy does not provide the resolution or ability to show membrane boundaries to distinguish the multiple mitochondria in stage II and III gametocytes, in stage IV gametocytes, we could clearly observe separate mitochondria in both male and female gametocytes (Fig. 2 A and Fig. S3 A). There is no clear difference in stage IV gametocytes between male and female mitochondria. However, in stage V gametocytes, the mitochondria in males appear slightly more dispersed while the female mitochondria remain compact (Fig. 2 A and Fig. S3 B). Data from Evers et al. support this and showed consistently smaller volumes and more loosely packed mitochondria in males compared with females (Evers et al., 2024). When gametocytes are taken up by the mosquito via a blood meal, they are activated and transform into extracellular male and female gametes. While the female gametocyte develops into a single macrogamete, male gametocytes form up to eight flagellated microgametes. This transformation is triggered by a temperature drop, an increase in pH, and xanthurenic acid present in the mosquito midgut (Billker et al., 1998). Upon in vitro activation, the difference between male and female mitochondria becomes more evident. Mitochondria in females remain in a compact knot while the parasite rounds up (Fig. 2 B). Interestingly, in males, the mitochondria become smaller and more dispersed and sometimes round up to small bean-like structures (Fig. 2, B, and D). This process already starts 2 min after activation. While this particular activation experiment was performed on a gametocyte culture that did not exflagellate for unclear reasons, it was repeated twice, and very similar results were found in exflagellating males (n = 19) (Fig. 2 C). There was no significant difference between the number of exflagellation events in MitoRed parasites compared with NF54 parasites (Fig. S4 A). An association of mitochondria with flagella is not uncommon and can also be observed in kinetoplastids, such as Trypanosoma and Leishmania spp, where the mitochondrion resides at the base of the flagellum, and in human sperm cells, where the mitochondrion wraps around the base of the flagellum to provide energy for flagellar movement (Moraes and Meyers, 2018). We found close apposition of the dispersed mitochondria to the axonemal tubulin in all 19 exflagellating males that were analyzed (Fig. S4, B and C).
Mitochondrial dynamics in mosquito stages
In the mosquito midgut, the male microgamete seeks out a female gamete for fertilization. After fertilization, the zygote takes 1 day to transform into a motile ookinete, which can traverse the midgut epithelium and differentiate into an oocyst. This oocyst expands and motile sporozoites are formed within the oocyst. When fully matured, the oocyst will burst and sporozoites will egress, spread through the hemolymph system, and invade the mosquito salivary glands. During oocyst development, the parasite mitochondrion has to expand enormously and then be divided over thousands of daughter sporozoites. However, very little is known about mitochondrial dynamics, and only a few studies have visualized the mitochondrion during these stages (Matz et al., 2018; Vega-Rodríguez et al., 2009; Sturm et al., 2015).
To explore if MitoRed parasites develop normally in the mosquito and to visualize mitochondrial morphology, mature MitoRed gametocytes were fed to Anopheles stephensi mosquitoes. One day after the feed, the mosquito blood bolus was extracted and stained with anti-Pfs25 conjugated antibodies to visualize ookinetes by live microscopy. We distinguished different stages of ookinete maturation as described by Siciliano et al. (2020). Due to the resolution limit of light microscopy, it was difficult to tell if there were one or multiple mitochondria as observed in gametocyte stages. Since we did not find evidence for the presence of multiple mitochondria in these ookinete development stages, we will refer to it as “the mitochondrion” in the coming paragraph, although we cannot rule out the presence of multiple mitochondria. During earlier stages of ookinete development (II), when ookinetes have a short protuberance attached to the round body, the mitochondrion resides in the round body (Fig. 3, A and B). When the protuberance starts to elongate further, one elongated mitochondrial branch stretches out and reaches into the protuberance. In stage III ookinetes, the mitochondrion stretches out further into the growing protuberance, spiraling out from the round body. We could not find clear stage IV ookinetes where the protuberance is at its full length, which could be explained by the swift development from stage IV to V ookinetes as was observed by Siciliano et al. (2020). However, in the mature stage V ookinetes, the mitochondrion appears as a tight knot in the main parasite body.
On days 7, 10, and 13 after infection, mosquitoes from a feed with an infection rate of 100% and an average of five oocysts/mosquito were dissected and the midguts were used for live confocal microscopy. On day 7, small oocysts (∼10 μm diameter) were observed with a branched mitochondrial network stretched out throughout the cell (Fig. S5 A). Segmentation of the fluorescent signal based on manual thresholding indicated that the mitochondrion consisted of one continuous structure. Day 10 oocysts were much larger (∼35 μm diameter) and the mitochondrial mesh-like network appeared more organized, also localizing to areas directly below the oocyst wall (Fig. S5 B). On day 13, oocysts of various sizes were observed. Some large oocysts (∼70 μm diameter) showed a highly organized mitochondrial network, where mitochondrial branches were organized in a radial fashion around a central organizational point (Fig. S5 C). We named these points mitochondrial organization centers (MOCs). At least tens of these MOCs could be observed per cell. Some smaller oocysts (∼35 μm diameter) on day 13 showed structures that looked like beginning MOCs (Fig. S5 D). However, several small oocysts showed a dispersed, globular mitochondrial signal, which we interpreted as an unhealthy or dying parasite (Fig. S5 E). While several free sporozoites were observed in dissected midguts and salivary glands on day 16 (data not shown), we never observed an oocyst containing fully mature sporozoites with a divided mitochondrion or an infected salivary gland on days 16 and 21 after infection. This indicates that sporozoites are produced and released into the hemocoel; however, they have a health defect that prevents them from infecting the salivary glands. Possibly the mitochondrial marker or the integration in the SIL7 locus causes issues for sporozoite development. We conclude that the MitoRed line is a great tool for mitochondrial visualization in asexual blood stages, gametocyte stages, and mosquito stages up until late oocysts, but for studies later in the life cycle, other tools need to be developed and tested.
Mitochondrial division during schizogony in asexual blood stages
Next, we aimed to use MitoRed for live visualization of mitochondrial division during schizogony in asexual blood stages. The biggest advantage of live imaging is that one parasite can be followed over time to capture mitochondrial fission events chronologically. Unfortunately, this proved to be challenging. All parasites imaged in several experiments for a duration exceeding 60 min exhibited significant morphological alterations, including mitochondrial swelling, fragmentation, and formation of vesicle-like structures, which indicate an unhealthy or dying parasite (Fig. S6 A). Additionally, we frequently observed parasites egressing from their red blood cells (RBCs) after ∼45 min of imaging, indicating that imaged parasites are unhealthy (Fig. S6 B). Optimizing imaging conditions by reducing laser power, increasing time interval, better temperature control, and gassing of the imaging chamber with low oxygen mixed gas (3% O2, 4% CO2) did not improve parasite health during imaging. Therefore, we decided to go for a fixed imaging approach to capture mitochondrial division in asexual blood stages.
To capture mitochondrial fission, MitoRed parasites were tightly synchronized and fixed between 32–36 and 36–40 h after invasion. In our culture system, MitoRed parasites have a replication cycle of ∼40 h, so we captured the last 8 h of schizont maturation before merozoite egress from the RBC. To distinguish the precise stage of schizont maturation, we included an anti-GAP45 antibody staining. Glideosome-associated protein 45 (GAP45) is an inner membrane complex (IMC) protein and is important for RBC invasion (Ridzuan et al., 2012; Jones et al., 2009). IMC formation starts at the apical end of a developing merozoite during schizogony and continues to develop until it fully encapsulates the daughter merozoite with its own IMC membrane (Rudlaff et al., 2019; Kono et al., 2013). We used the stage of IMC formation and therefore merozoite segmentation as a marker for the maturity and age of the schizonts. Based on IMC and DNA staining, we differentiated four stages of schizont maturation: pre-segmentation (n = 6), early-segmentation (n = 9), mid-segmentation (n = 15), and late-segmentation (n = 10, Fig. 4).
We generated and classified Z-stack images of 40 schizonts, which allowed us to reconstruct a timeline of mitochondrial fission. During pre- and early-segmentation stages, the branched mitochondrial network stretches throughout the parasite. Only at the end of early-segmentation stages, when the IMC is approximately halfway formed, the mitochondrion is oriented around the food vacuole in the center of the parasite with its branches pointing outward in a radial fashion, creating a “cartwheel”-like structure (Fig. 4). As the IMC progresses further and schizonts enter the mid-segmentation stage, this mitochondrial cartwheel structure is divided into smaller fragments, which maintain their radial branch orientation into the segmenting merozoites. Only when IMC formation appears complete, did we observe mitochondria that are entirely divided and distributed over the daughter merozoites. This highlights the extremely late timing of this process. These mitochondrial division stages were confirmed in a second, independent 3D imaging experiment (Fig. S7).
To further quantify the numbers and sizes of mitochondria and to create 3D renderings of the mitochondrial network throughout segmentation, we utilized threshold-based masking of the fluorescent signal (Fig. 5). During pre- and early-segmentation stages, the mitochondrial network consists of one large fragment (between 7 and 14 μm3), often with one to three smaller fragments (<1.5 μm3) (Fig. 5, AI and AII). As evident from our FIB-SEM data (Fig. S10 A), the mitochondrion features constricted regions, characterized by notably reduced diameters. Hence, the smaller fragments observed during these stages are likely not autonomous but caused by the reduced fluorescent marker intensity in the constricted regions. At the end of early-segmentation stages when the IMC is almost halfway formed, the mitochondrial network starts to orient itself in a radial fashion around the center of the parasite (Fig. 5 AII), consistent with the 2D image analysis (Fig. 4). During mid-segmentation stages, the radial mitochondrial branches elongate further into the developing merozoites, and the large mitochondrial fragment is divided in smaller fragments at the center of the cartwheel structure (Fig. 5 AIII). There is a slight increase in number of mitochondrial fragments per parasite, specifically the “intermediate”-sized mitochondrial fragments of 1–4 μm3. Only in the last stage of merozoite segmentation, there is a big increase in the number of mitochondrial fragments (Fig. 5 C). Of note, there appears to be no correlation between this number and the number of nuclei in the parasites (Fig. 5, B and C). A likely technical explanation is the limited Z-resolution of light microscopy and the different nuclear and mitochondrial segmentation methods. When mitochondrial fragments are located closely above each other, the limited Z-resolution in combination with threshold-based masking can cause the adjacent fragments to appear as one continuous structure. Therefore, the number of mitochondrial fragments per schizonts will be underestimated in these late schizont stages. The nuclei, on the other hand, were segmented through an automated (spherical) object detection algorithm which does not have this problem. Even when the IMC formation appears to be completed based on the GAP45 staining, only 20% of cells appear to have concluded mitochondrial fission as indicated by exclusively containing homogeneously small-sized mitochondrial fragments (<1.0 μm3) (Fig. 5 AIV). During the late segmentation stage, some parasites still have a large mitochondrial fragment of >5 μm3 while others only have small- and intermediate-sized mitochondrial fragments (Fig. 5 D). This suggests that the division of the mitochondrial cartwheel structure into small fragments is a fast, stepwise process that does not happen in a 2n progression and happens only in the final moments of merozoite segmentation.
Visualization of mitochondrial and apicoplast division using volume electron microscopy
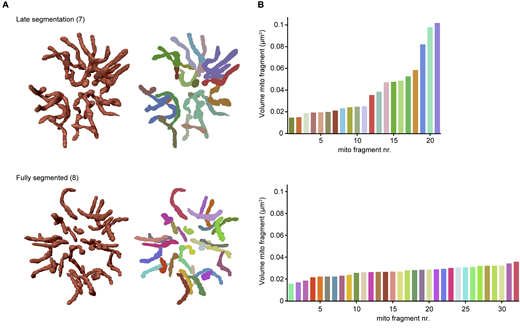
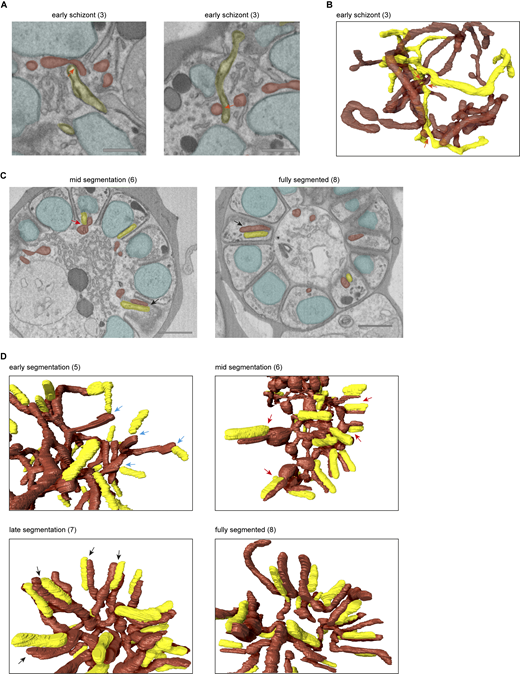
Although the use of light microscopy allowed us to reconstruct mitochondrial fission in good temporal resolution, its limited spatial resolution and reliance on indirect staining leave some questions unanswered. Our recent volume electron microscopy study detailed parasite organelle structures at a nanometer resolution bringing many new insights to the light (Evers et al., 2024). Here, we reused the underlying FIB-SEM data, which besides gametocytes also contain asexual blood-stage parasites from different stages, to examine mitochondrial fission with high resolution. Asexual parasites in different stages of schizogony were selected and organelles including nuclei, mitochondrion, and apicoplast were segmented for 3D rendering (detailed description per parasite in Tables S2 and S3). The mitochondrion and apicoplast can be recognized by their tubular shape in addition to the double membrane of the mitochondrion and the thicker appearance of the four membranes of the apicoplast. In line with the results from our light microscopy experiments, the mitochondrion is a large, branched network stretched throughout the cell in early schizont stages before segmentation has started (Fig. 6 and Video 1). The apicoplast is also a branched network; however, it is much smaller than the mitochondrion (Table S2). The apicoplast network is divided into smaller fragments of different sizes when nuclear division is still ongoing and IMC formation has started (Fig. 7, Table S3, and Video 2). When nuclear division is completed and the IMC envelops part of the nucleus, apicoplast division is completed (Fig. 6 and Video 3). The mitochondrion starts to orient its branches in a radial fashion toward the developing merozoites. When the nuclear division has completely finished and the IMC envelops most of the nucleus, the mitochondrion forms a clear cartwheel structure with its branches pointing to the developing merozoites (Video 4). During late segmentation stages, where only a small opening connects the merozoite to the residual body, the mitochondrion is divided into smaller fragments of various sizes (Video 5). While some mitochondrial fragments have a volume comparable with the mitochondria in a fully segmented parasite (0.016–0.036 μm3), other fragments are still two to four times that volume (Fig. S8). These larger mitochondrial fragments have several branches that point to developing merozoites but are still connected to each other outside the merozoites. Also of note, the volumes measured in the FIB-SEM data differ greatly from the volumes measured in the 3D fluorescent microscopy data. This can be explained by the limited spatial resolution of fluorescent microscopy because of the diffraction of light. The diffraction limit of the confocal Airyscan microscope that was used is ∼120 nm in a lateral direction and ∼350 nm in axial direction. The diameter of the mitochondrion in asexual blood-stage parasites is ∼140 nm, which is at the edge of the resolution limit. Therefore, the volume measurements of thresholding-based segmentation of the fluorescent signal are not very accurate and quickly overestimate the volume. These volume estimations should merely be used to compare relative volumes of mitochondrial fragments. The FIB-SEM data has a resolution of 5 nm in the lateral direction and 15 nm in the axial direction, which allows much more precise visualization of organelles and volume measurements. In an almost fully segmented schizont, where most merozoites are fully developed and only a few merozoites are still connected to the residual body through a small opening, the mitochondrial division is completed and the number of mitochondrial fragments is the same as the number of merozoites (Video 6). These findings corroborate our light microscopy data and confirm the mitochondrial division stages, the position of relevant structures not stained in light microscopy, and the timing of mitochondrial and apicoplast division during schizogony.
Interaction between mitochondrion and apicoplast in late-stage schizonts
During schizogony, the mitochondrion and apicoplast show different moments of close association. Prior to apicoplast division, the mitochondrion and apicoplast had several apposition sites, which have also been described by Evers et al. (2024) (Fig. S9, A and B). It remains unclear if these close associations represent true membrane contact sites that facilitate the exchange of metabolites or lipids between the organelles, or if these are merely random due to the limited space in the parasite. When the apicoplast division is complete, the endings of the mitochondrial branches reach toward the basal endings of the apicoplasts (Fig. S9 D). Subsequently, the branches of the mitochondrial cartwheel structure align with the apicoplast over its entire length (Fig. S9, C and D). This close alignment remains when mitochondrial division is complete.
Bulbous mitochondrial structures with double membrane invaginations
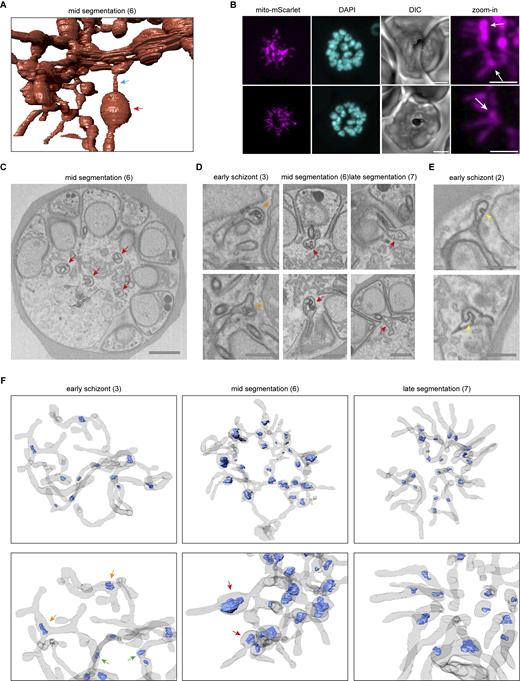
The parasite mitochondrion does not have a consistent diameter during schizogony. While some parts have a very small diameter, other areas of the mitochondrion are more bulbous (Fig. S10 A). These bulbous parts often contain double membrane invaginations of various size and shape (Fig. S10, C, D, and F). These bulbous invagination structures (bulins) are found in all schizont stages and vary greatly in shape, size, and location in the mitochondrial network. In early-stage schizonts, bulins can be found at branching points and in the middle of a continuous branch of the mitochondrial network (Fig. S10, D and F). However, during mid-segmentation stages, when the mitochondrion is oriented in its typical cartwheel structure, bulins are consistently observed at the base of a mitochondrial branch near the merozoite entrance (Fig. 6; and Fig. S10, D and F). These merozoite-entrance bulins were found in all eight mid-segmentation stage schizonts from two independent experiments (example shown in Video 7). Bulbous areas at the base of mitochondrial branches are also observed with fluorescent microscopy (Fig. S10 B). This and the specific location of bulins make them unlikely an artifact of fixation or sample preparation for the FIB-SEM, although this cannot be ruled out completely. Bulins that reside at the entrance of a forming merozoite during the cartwheel phase are typically characterized by contact with the basal end of the divided apicoplast and a small constriction right above the bulin where the mitochondrial branch enters the merozoite (Video 8). Bulbous areas at the base of the mitochondrial branches are also observed with fluorescent microscopy (Fig. S10 B). In late-segmentation schizonts, we observed small bulins at the base of a divided mitochondrial fragment or at the entrance of a merozoite when the mitochondrial branch was not yet divided (Fig. S10, D and F). Sporadically, we also found bulins in the apicoplast (Fig. S10 E). The significance and function of these bulins remain to be explored, but it is tempting to speculate about a possible role in organelle division.
Centriolar plaques associate with apicoplast but not mitochondrion during organelle segregation
In mammalian cells, the segregation of organelles is coordinated by microtubules that arise from the centrosomes, or so-called microtubule organizational centers. Plasmodium parasites lack canonical centrosomes but organize their mitotic spindle from a structure called the CP, which is embedded in the nuclear envelope (Voß et al., 2023; Gerald et al., 2011). Expansion microscopy studies from Liffner et al. have suggested an association of the CPs with both the mitochondrion and the apicoplast during schizogony, suggesting their involvement in organelle segregation (Liffner et al., 2023). In our FIB-SEM images, we distinguished the CP by electron-dense coffee filter-shaped regions in the nucleus (Fig. 7 A). In an early schizont that still lacks IMC or rhoptries, nuclei contain one or two CPs, which are oriented to the periphery of the parasite. 3D renderings show no direct association between the CPs and the mitochondrion or apicoplast (Fig. 7 B and Video 1). Although the distances between the mitochondrion and CPs (average 616 nm, SD 235 nm) in this early schizont are significantly smaller than the apicoplast–CPs distances (average 1,350 nm, SD 260 nm), there is no direct interaction between the mitochondrion and CPs since the smallest CP–mitochondrion distance measured is 332 nm. The significant difference can be explained by the fact that the apicoplast is located in the center of the parasite, while the mitochondrion is larger and stretched throughout the whole cell leading to coincidental closer proximity to the peripheral CPs. In slightly later stage schizonts where IMC and rhoptry formation started, all nuclei contain either two CPs or one CP that is dividing. A portion of the CPs was associated with the apicoplast, specifically with the endings of apicoplast branches (Video 9). When the IMC developed slightly further, all CPs associated with the apicoplast over the total length of the peripherally localized apicoplast network (Video 10). While two CPs from the same nucleus usually associate with one apicoplast branch (Fig. S11 A), sometimes they associate with completely different branches of the apicoplast network (Fig. S11 B). Furthermore, the distances between the CPs and apicoplast are significantly smaller (42 nm average, SD 46 nm) compared with those measured in earlier stages as well as to the unchanged CP–mitochondrion distances (663 nm average, SD 274 nm) (Fig. 7 B). The association between CPs and apicoplast continues during and after apicoplast division (Videos 2, 3, 4, and 5). After apicoplast division, each apicoplast fragment is associated with one CP at its peripheral end (53 nm average distance, SD 37 nm) (Video 3). During mid-segmentation stages, the endings of the mitochondrial branches are close to the CPs (202 nm average distance, SD 65 nm) (Video 4). However, this seems to be a result of the close association of the mitochondrion with the apicoplast rather than a direct interaction between the mitochondrion and the CPs. In a fully segmented schizont, the CPs were much smaller and did not show a clear extranuclear compartment (Video 6). This close and very consistent association between the apicoplast and the CP suggests an important role in apicoplast segregation, while the mitochondrion likely deploys different mechanisms to accomplish its proper distribution over the forming merozoites.
Discussion
In contrast to most eukaryotes, the fast-replicating P. falciparum asexual blood-stage parasites harbor only a single mitochondrion. Consequently, proper division and distribution of this organelle during schizogony is crucial to ensure all daughter cells receive a mitochondrion. Here, we visualized the poorly understood mitochondrial dynamics in blood and mosquito stages using a new parasite line with a fluorescent mitochondrial marker and super-resolution 3D imaging methods. During blood-stage schizogony, a cartwheel structure is formed and divided into smaller, unequally sized mitochondrial fragments in a stepwise process. The final division into single mitochondria happens during the last stage of merozoite segmentation. These division steps were cross-validated by analyzing available FIB-SEM data with nanometer resolution. This also allowed us to reconstruct the apicoplast division and its interactions with the mitochondrion. Finally, we showed that the apicoplast but not the mitochondrion associates with the CPs during merozoite formation.
To date, the visualization of Plasmodium mitochondria has largely relied on MitoTracker dyes. However, these dyes are toxic at nanomolar concentrations (Joanny et al., 2012; Gebru et al., 2014), and our data suggest that they may alter mitochondrial morphology (Fig. 1). We developed a reporter parasite line harboring a fluorescent mitochondrial marker that shows a more continuous and less punctate staining pattern compared with MitoTracker dyes and is compatible with live and fixed imaging without necessitating antibody labeling. Unfortunately, MitoRed is not well suited for long-term time-lapse imaging (>1 h) since parasites showed various signs of poor health, probably due to phototoxicity. While expansion microscopy is currently not feasible with MitoRed, the addition of a linear epitope tag would make this marker compatible with the required denaturation step.
For the selection of new sites for the integration of the MitoRed marker, we extended the concept of a previous study describing the successful integration of a reporter gene in P. berghei (Kooij et al., 2012). We identified potentially suitable chromosomal breakpoints in P. falciparum conserved between Plasmodium vivax and the rodent malaria parasite lineages (Carlton et al., 2008). By using these SIL sites, we prevent the need for gene replacements commonly used to introduce transgenes. For instance, NF54HT-GFP-luc parasites had the GFP-luc cassette introduced in the presumed silent Pfs47 locus (Vaughan et al., 2012). Meanwhile, it has been demonstrated that this gene can play an important role in mosquito infections (Molina-Cruz et al., 2017, 2020). Another commonly used integration site is the PfRH3 pseudogene, for instance, for the integration of a dimerizable Cre gene (Wilde et al., 2019; Carrasquilla et al., 2022). Although PfRH3 is transcribed and not translated in blood stages, the RH3 protein has been detected in sporozoites (Taylor et al., 2001; Florens et al., 2002). The genes flanking the SIL sites have been rearranged during the evolution of P. falciparum, and we reasoned that there would be no genetic constraints to keep these genes physically linked. We analyzed available data on gene expression and potential transcription start sites to target a locus that lacks any detectable (regulation of) gene expression in the Plasmodium life-cycle stages (Alvarez-Jarreta et al., 2024). In addition, UTRs of the flanking genes need to remain intact.
Applying the combined criteria, we identified three loci on P. falciparum chromosomes 7, 12, and 14. The site on chromosome 12 (genomic location between PF3D7_121220 and PF3D7_1212100) proved very difficult to clone, with frequent plasmid rearrangements and very low plasmid yields. A total of three transfections targeting the site on chromosome 14 (genomic location between PF3D7_1438100 and PF3D7_143800) did not result in any transgenic parasite lines, suggesting either technical challenges or some important function of this locus in ABS parasite viability. The third SIL, termed SIL7 as it is on chromosome 7, is located between PF3D7_0715900 and PF3D7_0716000 and was used for integration of the mitochondrial marker. We generated an integration plasmid containing 5′ and 3′ homology regions (HRs) and the mitochondrial marker (Fig. S1 A).
There are some considerations to be made for the use of SIL7 for stable transgene integration. Integration of the fluorescent mitochondrial marker in SIL7 did not affect parasite growth or development in blood and mosquito stages up until oocyst formation. Although we did observe several free sporozoites in our dissected mosquito samples, we never observed sporozoites in the salivary glands. This suggests that sporozoites might have a developmental defect that prevents them from populating the salivary glands. One possible explanation could be the presence of the fluorescent mitochondrial marker, which might be toxic for this stage specifically. Even though we used an organelle-specific promoter, the high, HSP70-3 (PF3D7_1134000) promoter-driven mito-mScarlet expression combined with limited resources and possible lack of feedback loops to control protein levels could be overwhelming the small-sized mitochondrion. Alternatively, integration into SIL7 might be disruptive for sporozoite development, possibly due to interference with genetic or epigenetic processes in this stage. Therefore, we conclude that SIL7 is an excellent integration site when studying blood or mosquito stages up until oocyst development, but it might not be well suited for studying sporozoite or liver stages.
In line with our earlier observations, we demonstrated multiple mitochondria in gametocyte stages (Evers et al., 2024). As discussed by Evers et al., there are several possible reasons for the emergence of multiple mitochondria in gametocytes, such as adaptation to a metabolically varied environment, distribution mechanism of mtDNA, or management of reactive oxygen species. We expand upon these observations by also imaging gametocytes during activation. In males, mitochondria become more dispersed while female mitochondria remain in a tight knot. One possible explanation for this is that mitochondria in males are distributed to specific locations in the cell to provide energy locally for certain processes. In sperm cells, the mitochondrion resides at the base of the flagellum to provide energy for flagellar movement (Moraes and Meyers, 2018). While we observed close apposition of the mitochondria with axonemal tubulin in some activated males using light microscopy (Fig. S4), this was not consistently observed in all males, and we lack the resolution to prove the real association. Another explanation could be that the parasite undergoes a form of mitophagy as a source of proteins, lipids, and nucleotides required for rapid nuclear division and microgamete formation. Even though mitophagy has not been studied in Plasmodium, some homologs of the general autophagy pathway have been identified (Hain and Bosch, 2013). Autophagy as a survival mechanism was described for P. falciparum and T. gondii under starvation conditions (Ghosh et al., 2012; Joy et al., 2018). In T. gondii, the fragmentation of the mitochondrion was reversed by using the established autophagy inhibitor 3-methyl adenine (Ghosh et al., 2012). Alternatively, the distribution of the mitochondria could merely be a consequence of the nuclear expansion in the cell.
Mitochondrial dynamics during mosquito stages is poorly understood, and to our knowledge, studies have thus far been restricted to P. berghei (Sturm et al., 2015; Vega-Rodríguez et al., 2009; Matz et al., 2018; Saeed et al., 2020). Here, we visualized the mitochondrion in P. falciparum during mosquito stages for the first time. In early oocyst stages, the mitochondrion resembles the extensively branched network from asexual blood-stage schizonts. During oocyst development, the mitochondrial network organizes into multiple MOCs that resemble the cartwheel structure observed in asexual blood stages. Although these mitochondrial observations should be interpreted with care since oocysts did not form salivary gland populating sporozoites and might therefore not be representing healthy oocysts, in P. berghei, liver-stage schizonts, a very similar mitochondrial organization was observed in subcompartments created by large membrane invaginations (Stanway et al., 2011; Burda et al., 2017). Similar subcompartments are present during oocyst development (Burda et al., 2017). Based on apicoplast visualizations in P. berghei and our observations of the formation of MOCs during oocyst stages, mitochondrial and apicoplast dynamics in these subcompartments in both oocyst and liver stages resemble the dynamics of these organelles in blood-stage schizogony (Stanway et al., 2009, 2011; Roques et al., 2023).
Although the use of new imaging techniques, such as expansion microscopy and 3D volume EM, has revealed new insights in mitochondrial dynamics, many questions about the timing and organization of mitochondrial division remained unanswered (Liffner et al., 2023; Rudlaff et al., 2020). In an earlier literature review, we proposed three possible mitochondrial division models: synchronous fission, outside-in fission, or branching point fission (Verhoef et al., 2021). Here, we used a new mitochondrial marker and advanced imaging techniques, such as Airyscan confocal microscopy, to reconstruct mitochondrial fission during schizogony. The use of volume EM provided the resolution required to verify our fluorescence-based mitochondrial fission model while simultaneously shedding light on the division of the second endosymbiotic organelle, the apicoplast. This allows us to propose a new, detailed model of the organellar division and segregation (Fig. 8).
In this model, we describe the cartwheel orientation of the mitochondrion, its non-geometric 2n division, the late timing of division, and its association with the apicoplast. The apicoplast divides when nuclear division is still ongoing and merozoite segmentation has just started. Similar to the mitochondrion, its division does not happen in a geometric 2n progression, but different-sized apicoplast fragments are observed in a mid-division stage. The timing and orientation of the apicoplast-mitochondrion appositions suggest a potential role of the apicoplast in mitochondrial segregation. However, doxycycline-treated parasites that have lost their apicoplast and are chemically rescued by isopentenyl pyrophosphate supplementation can still produce viable merozoites, suggesting that association with the apicoplast is not essential for mitochondrial segregation (Yeh and DeRisi, 2011). The specific types of membrane contact between both endosymbiotic organelles, whether these consist of direct physical contacts, membrane fusions, or tethering proteins, may vary and remain to be explored. However, EM tomography data from Sun et al. (2024) show there are hints of connecting structures between the mitochondrion and apicoplast in areas where the distance between the organelles is very small and similar to the distance between the inner and outer membranes of the organelles themselves in merozoites, suggesting a physical link between the organelles.
In other eukaryotic models, mitochondrial fission is facilitated by adaptor proteins on the cytoplasmic side of the outer mitochondrial membrane that recruit dynamin GTPases, which in turn oligomerize to form a constrictive ring around the organelle (Verhoef et al., 2021). The only conserved adaptor protein in P. falciparum, Fission 1 (Fis1), is dispensable in asexual blood stages precluding an essential role in mitochondrial fission during schizogony (Maruthi et al., 2020). Malaria parasites also harbor three dynamin-related proteins (Verhoef et al., 2021). As the timing of the apicoplast division precedes that of the mitochondrion, it is conceivable that (parts of) the same dynamin-based machinery may be reused for mitochondrial fission. Indeed, in a recent pre-print P. falciparum, dynamin 2 (PfDYN2) was shown to mediate both apicoplast and mitochondrial fission (Morano et al., 2024, Preprint). Which other proteins comprise the mitochondrial division machinery in P. falciparum remains to be explored.
Their morphological features, the timing of appearance, and the specific location at the entrance of the developing merozoite during mid-segmentation stages suggest that the bulins could play a role in mitochondrial fission. A role in the distribution of certain components – e.g., mitochondrial DNA, proteins, or protein complexes – to the branches of the mitochondrial cartwheel structure that enter the merozoite is also conceivable. However, in earlier stages, bulins are also found at branching points or in continuous parts of the mitochondrion and apicoplast, perhaps suggesting possible roles in more general membrane remodeling of the organellar network.
We also observed CPs, the P. falciparum analogue of the centrosome, which function as microtubule organizing centers and are important for mitosis and cell cycle regulation (Arnot et al., 2011; Simon et al., 2021). In T. gondii, the centrosome associates with the apicoplast and ensures correct segregation of the organelle during daughter cell formation (Striepen et al., 2000; van Dooren et al., 2009). Recent expansion microscopy data suggested interaction of the CP with both the apicoplast and the mitochondrion in P. falciparum (Liffner et al., 2023). From the onset of IMC and rhoptry formation, we observed close apposition of the CPs and apicoplast, but not the mitochondrion (Fig. 8). This CP-apicoplast association continues during and after apicoplast division, indicating a role of the CPs in apicoplast segregation. In other apicomplexan parasites, such as Toxoplasma gondii and Sarcocystis neurona, centrosomes have also been indicated to be involved in apicoplast organization and distribution during cell division (Vaishnava et al., 2005; Striepen et al., 2000). The initial absence of CP-apicoplast association and the later association of two CPs from one nucleus with separate apicoplast branches suggests an active recruitment strategy. Motor proteins facilitate intracellular transport of organelles along the cytoskeleton in multicellular eukaryotes. While dynein and kinesin facilitate organelle transport along microtubules, myosin motor proteins transport organelles along actin filaments to specific locations in the cell (Frederick and Shaw, 2007). Previous studies have shown a critical role of F-actin and myosin F in the inheritance of the apicoplast in P. falciparum and T. gondii (Das et al., 2017; Periz et al., 2017; Stortz et al., 2019; Jacot et al., 2013). In T. gondii parasites that lack myosin F, the apicoplast fails to associate with centrosomes (Devarakonda et al., 2023). Therefore, we hypothesize that myosin facilitates recruitment of the apicoplast branches over the actin filaments to the CPs. Although the mitochondrion is close to the CPs in late segmentation stages, the distance is always significantly bigger than the apicoplast-CP distance. Additionally, mitochondrial branches reach much further into the merozoites when fully segmented, compared to the apicoplast. Furthermore, conditional knockout of PfACT1 (actin-1) did not alter mitochondrial morphology in asexual blood-stage schizogony (Das et al., 2017). Therefore, it remains questionable if the mitochondrial branches are recruited to the CP via a similar mechanism as the apicoplast.
Volume EM is a powerful tool to study biological questions as it allows the visualization of complex, connecting structures and gives spatial and cellular context. Here, we reused available FIB-SEM data, which contains sexual and asexual blood-stage malaria parasites from many different stages of intra-erythrocytic development. Future reinterrogation of the data could facilitate in answering other biological questions that are beyond the scope of this paper, such as rhoptry biogenesis and development of the apical complex.
In this study, we have developed a reporter parasite line harboring a fluorescent mitochondrial marker – integrated in a new genomic locus – that can be used for mitochondrial visualization in blood and early mosquito stages. This allowed us to visualize mitochondrial division in unprecedented detail and describe the relative timing and of mitochondrial fission and segregation using high-resolution confocal microscopy and FIB-SEM image analysis. Combined with new insights into apicoplast division, mitochondrial and apicoplast interactions, and association of the apicoplast with the CP during schizogony allowed us to propose a new, detailed model of apicoplast and mitochondrial division during schizogony. These findings paved the way to home in on the molecular mechanisms underpinning mitochondrial and apicoplast division and segregation.
Materials and methods
P. falciparum culture and transfections
P. falciparum NF54 and MitoRed parasites were cultured in RPMI1640 medium supplemented with 25 mM HEPES, 10% human type A serum, and 25 mM NaHCO3 (complete medium). Parasites were cultured in 5% human RBCs type O (Sanquin) at 37°C with 3% O2 and 4% CO2. For transfection, 60 μg of homology-directed repair plasmid was linearized by overnight digestion, precipitated, and transfected with 60 μg Cas9 plasmid using ring transfection (Wu et al., 1995; Crabb and Cowman, 1996). Briefly, a ring-stage sorbitol synchronized parasite culture was transfected with the plasmids by electroporation (310 V, 950 μF). 5 h after transfection, parasites were treated with 2.5 nM WR99210 for 5 days. Success of transfection was assessed by integration PCR (Fig. S1 and Table S1).
Plasmid constructs
To generate the base SIL7 reporter plasmid (pRF0057), the 5′ and 3′ homology regions for SIL7 were amplified from genomic NF54 DNA (Table S1) and cloned into the pBAT backbone (Kooij et al., 2012) with NgoMIV and AleI (5′), and BmgBI and AatII (3′). For the final MitoRed repair plasmid, first, the mScarlet sequence was amplified from p1.2RhopH3-HA-mScarlet (a kind gift from Prof. Alan Cowman) (Pasternak et al., 2022) (Table S1). The mScarlet sequence was cloned into pRF0077 (empty tagging plasmid with PBANKA_142660 bidirectional 3′UTR) with AflII and EcoRI restriction sites, generating pRF0078 intermediate plasmid. The HSP70-3 promotor (prom) and targeting sequence (t.s.) were cloned into pRF0078 with EcoRI and NheI restriction sites, generating the pRF0079 intermediate plasmid. The whole mitochondrial marker (HSP70-3 prom + t.s. + mScarlet) was cloned from pRF0079 into pRF0057 with EcoRI and AflII restriction sites, generating pRF0191, the final repair plasmid. CRISPR-Cas9 guide plasmids targeting two different sites in the SIL7 region were generated. Guide oligonucleotides were annealed and cloned into pMLB626 plasmid (a kind gift from Marcus Lee) (Lim et al., 2016) using the BbsI restriction enzyme, generating the two final guide plasmids (Table S1).
Growth assay
NF54 WT and MitoRed parasites were synchronized using 63% Percoll centrifugation. Late-stage parasites were isolated from the Percoll gradient and added to fresh RBCs. 4 h later, a 5% sorbitol synchronization was performed, which allowed only young rings that just invaded a new RBC to survive. Ring-stage parasites were counted and three independent cultures of 0.05% parasitemia were set up for each parasite line. Every 24 h, 10 μl culture was taken and fixed in 100 μl 0.25% glutaraldehyde in PBS up until day 5. To prevent overgrowth, parasite cultures were cut back 1/50 after samples were taken on day 3. Before readout, fixative was taken off and parasite DNA was stained with 1:10,000 SYBR Green in PBS. Parasitemia was determined by measuring SYBR Green positive cells with a Cytoflex flow cytometer (Beckman Coulter Cytoflex) using the 488 nm laser. Final parasitemia on days 4 and 5 was adjusted for the 1/50 dilution factor, explaining why final parasitemia can reach >100%.
Immunofluorescence assays and fixed fluorescence imaging
Immunofluorescence assays were performed on asexual and sexual blood-stage parasites using the same fixation and staining protocols. Asexual blood-stage parasites were usually synchronized with 5% sorbitol to get them in the preferred stage for imaging. For tight synchronization, late-stage parasites were isolated with 63% Percoll centrifugation and added to fresh RBCs. 4 h later, a 5% sorbitol was performed to select young rings. Parasites were settled on a poly-L-lysine coated coverslip for 20 min at 37°C. Parasites were fixed (4% EM-grade paraformaldehyde, 0.0075% EM-grade glutaraldehyde in PBS) (Tonkin et al., 2004) for 20 min and permeabilized with 0.1% Triton X-100 for 10 min. Samples were blocked with 3% bovine serum albumin (BSA) (Sigma-Aldrich) in PBS for 1 h. Primary and secondary antibody incubations were performed for 1 h in 3% BSA. The nucleus was visualized by staining with 1 μM DAPI in PBS for 1 h. PBS washes were performed between different steps. Parasites were mounted with Vectashield (Vector Laboratories). Images were taken with a Zeiss LSM880 or LSM900 Airyscan microscope with 63×/1.4 oil objective with 405, 488, 561, and 633 nm excitations using Zen Blue acquisition software. Images were Airyscan processed before analysis with FIJI software. Brightness and contrast were adjusted for optimal visualization. MitoTracker staining (including MitoTracker Orange CMTMRos [M7510], Red CMXRos [M7512], and Deep Red FM [M22426], all from Thermo Fisher Scientific) were done before settling and fixation by incubation of the parasites with 100 nM MitoTracker for 30 min at 37°C, followed by a wash with complete media. The IMC protein GAP45 was labeled using the anti-GAP45 rabbit antibody (1:5,000) (a kind gift from Julian Rayner) (Jones et al., 2009) and goat anti-rabbit AlexaFluor 488 antibody (1:500, A-11008; Invitrogen). α-Tubulin was labeled with an anti-α tubulin mouse antibody (1:500, MA1-19162; Thermo Fisher Scientific) and chicken anti-mouse AlexaFluor 488 antibody (1:400, A-21200; Invitrogen). 3D visualization and quantifications were done in Arivis 4D Vision software. For mitochondrial measurements, threshold-based segmentation was used. For nuclei, the blob-finder function was used for segmentation. The number of segmented objects and volume of objects were determined automatically in Arivis software.
Gametocyte generation and mosquito feeds
Gametocyte cultures were maintained in a semiautomatic culturing system with media changes twice a day (Ponnudurai et al., 1986). MitoRed gametocytes used for imaging were induced by Albumax supplementation. A mixed asexual blood-stage culture of 1% was set up and maintained in a medium supplemented with 2.5% Albumax II (Thermo Fisher Scientific) without human serum for 4 days (Graumans et al., 2024). After 4 days, parasites were cultured in a complete medium again for further gametocyte development. For mosquito feeding, MitoRed gametocytes were stress-induced through asexual overgrowing. A mixed asexual blood-stage culture of 1% was set up and maintained for 2 wk. At day 15 after gametocyte induction, gametocytes were fed to Anopheles stephensi mosquitoes (Sind-Kasur Nijmegen strain) (Feldmann and Ponnudurai, 1989). 24 h after feeding, several mosquitoes were dissected, and blood bolus was obtained for live imaging of ookinetes.
Live imaging of asexual blood-stage parasites
Sorbitol-synchronized MitoRed and NF54 schizonts were stained with 0.5 μg/ml Hoechst 33342 (H3570; Invitrogen) for 30 min at 37°C for nuclear staining. MitoTracker stainings (including MitoTracker Orange CMTMRos, Red CMXRos, Deep Red FM, and Rhodamine 123 [R302], all from Thermo Fisher Scientific) were done by incubation of the parasites with 100 nM MitoTracker or 1 μg/ml Rhodamine 123 for 30 min at 37°C, followed by a wash with complete medium. Stained parasites were diluted 1:40 in a complete medium and settled for 20 min at 37°C in a poly-L-lysine coated μ-slide 8-well imaging chamber (Ibidi). Unbound cells were washed away with phenol red-free complete medium in which cells were also kept during imaging. Parasites were imaged on a Zeiss LSM880 Airyscan microscope with a 37°C heated stage table and 63×/1.4 oil objective using Zen Blue acquisition software. Images were Airyscan-processed before analysis with FIJI software.
Live imaging of mosquito-stage parasites
Ookinetes were obtained from the blood bolus of infected mosquitoes 24 h after feeding. Ookinetes were stained by mouse monoclonal anti-Pfs25 Alexa Fluor 488-conjugated antibody obtained in-house from the 4B7 hybridoma cell line (final concentration 15 µg/ml; Clone 4B7 was obtained through BEI Resources, NIAID, NIH: MRA-28, contributed by Louis H. Miller and Allan Saul). The stained sample was applied on a glass slide and covered with a glass coverslip. The sample was immediately imaged on a Zeiss LSM880 Airyscan microscope with a 63× oil objective. Mosquito midguts were dissected on days 7, 10, and 13 after infection and put on a glass slide in PBS covered with a glass coverslip. Samples were imaged immediately on a Zeiss LSM880 or LSM900 microscope with 63× oil objective. Oocysts were identified based on their fluorescent mitochondrion and round shape in the brightfield channel. All images were Airyscan processed before analysis with FIJI software. 3D segmentations and visualizations were done by manual thresholding of the fluorescent signal in Arivis 4D vision software. Salivary glands were dissected on days 13, 16, and 21 after infection and stained with mouse monoclonal anti-CSP Alexa Fluor 488-conjugated antibody obtained in-house from the 2A10 hybridoma cell line (final concentration 1 µg/ml; Clone 2A10 was obtained through BEI Resources, NIAID, NIH: MRA-183A, contributed by Elizabeth Nardin). Stained glands were applied on a glass slide and covered with a glass coverslip. Samples were imaged on a Zeiss Axioscope A1 microscope with AxioCam ICc1 and 20×/0.8 objective using Zen Blue acquisition software.
FIB-SEM image analysis
FIB-SEM image stacks were reused from Evers et al. (2024) (EMPIAR-12160). For these stacks, gametocyte-induced iGP2 parasite cultures were MACS-purified. During this process, many late-stage asexual parasites in these cultures were copurified and fixed in the agarose blocks used for FIB-SEM imaging. Detailed sample preparation and FIB-SEM imaging methods are described in Evers et al. (2024). All image processing, visualizations, and analysis were done using ORS Dragonfly software (2022.2). Segmentations were done by either manual segmentation or deep learning-based segmentation. Deep learning–based segmentations were manually reviewed and corrected when necessary. 3D renderings of segmented regions were converted to triangle meshes for visualization.
Statistical analysis
All statistical analyses were performed using Microsoft Excel (version 16.85). A P value of <0.05 was considered statistically significant. Differences between two independent groups were analyzed using a two-sided t test.
Online supplemental material
Fig. S1 shows the generation and verification of the MitoRed parasite line. Fig. S2 shows the comparison of MitoTracker and the mitochondrial marker for live fluorescence imaging. Fig. S3 shows the visualization of mitochondrial morphology in stage IV and V male and female gametocytes. Fig. S4 shows the visualization of mitochondrial association with axonemes in activated male gametocytes. Fig. S5 shows the visualization of mitochondrial dynamics in oocyst development. Fig. S6 shows time-lapse imaging of MitoRed. Fig. S7 shows the visualization of mitochondrial division stages in ABS schizogony. Fig. S8 shows the description of the shape and volume of mitochondrial fragments during the final stages of schizogony. Fig. S9 shows the visualization of the interaction between mitochondrion and apicoplast in different stages of schizogony. Fig. S10 shows the visualization of Bulbous membrane invagination structures (bulins) in the mitochondrion. Fig. S11 shows the visualization of different interactions between apicoplast and CPs in an early schizont. Table S1 shows the primers and guide RNA sequences used for the generation of repair and guide plasmids. Table S2 shows the features of the schizonts in the FIB-SEM dataset that was analyzed. Table S3 shows the detailed textual description of schizonts in the FIB-SEM dataset that was analyzed. Video 1 shows schizont 1. Video 2 shows schizont 4. Video 3 shows schizont 5. Video 4 shows schizont 6. Video 5 shows schizont 7. Video 6 shows schizont 8. Video 7 shows the bulins during mid-segmentation. Video 8 shows detailed bulins. Video 9 shows schizont 2. Video 10 shows schizont 3.
Data availability
The fluorescent microscopy data underlying Figs. 1, 2, 3, 4, and 5; and Figs. S1, S2, S3, S4, S5, S6, and S7 are openly available in Radboud Data Repository at https://doi.org/10.34973/kknj-an72. The FIB-SEM data underlying Figs. 6 and 7; and Figs. S8, S9. S10, and S11 are openly available in the EMPIAR database at https://www.ebi.ac.uk/empiar/EMPIAR-12160.
Acknowledgments
We thank members of the Molecular Malaria Research group for discussions. We also thank Aniek Garritsen for her contributions to the generation of the SIL plasmids. We do greatly appreciate the help from Chiara Andolina and Nicholas Proellochs with mosquito experiments. We would like to thank Astrid Pouwelsen, Jolanda Klaassen, Laura Pelser-Posthumus, Saskia Mulder, and Jacqueline Kuhnen for the breeding of mosquitoes and handling of infected mosquitoes. We thank the Radboud Technology Center Microscopy, Radboud Technology Center Flowcytometry, and Radboudumc Electron Microscopy Center for the use of their facilities. We are grateful to Alan Cowman for sharing the p1.2RhopH3-HA-mScarlet plasmid and Julian Rayner for sharing the anti-GAP45 antibody.
J.M.J. Verhoef is supported by an individual Radboudumc Master-PhD grant. A.B. Vaidya is supported by a National Institutes of Health grant (R01 AI028398).
Author contributions: J.M.J. Verhoef: Conceptualization, Data curation, Formal analysis, Funding acquisition, Investigation, Methodology, Project administration, Validation, Visualization, Writing - original draft, Writing - review & editing, C. Boshoven: Conceptualization, Data curation, Formal analysis, Investigation, Methodology, Project administration, Visualization, Writing - review & editing, F. Evers: Conceptualization, Data curation, Investigation, Visualization, Writing - review & editing, L.J. Akkerman: Investigation, Writing - review & editing, B.C.A. Gijsbrechts: Investigation, M. van de Vegte-Bolmer: Investigation, G.-J. van Gemert: Investigation, A.B. Vaidya: Conceptualization, Writing - review & editing, T.W.A. Kooij: Conceptualization, Data curation, Funding acquisition, Project administration, Resources, Supervision, Validation, Writing - review & editing.
References
Author notes
Disclosures: The authors declare no competing interests exist.