1-20 of 219430
Follow your search
Access your saved searches in your account

Would you like to receive an alert when new items match your search?
Close Modal
Sort by
Journal
Journal of Cell Biology Cover Image
Journal of Cell Biology (JCB) publishes advances in any area of basic cell biology as well as applied cellular advances in fields such as immunology, neurobiology, metabolism, microbiology, developmental biology, and plant biology. Est. 1955
Journal
Journal of Experimental Medicine Cover Image
Journal of Experimental Medicine (JEM) publishes papers providing novel conceptual insight into immunology, neuroscience, cancer biology, vascular biology, microbial pathogenesis, and stem cell biology. Est. 1896
Journal
Journal of General Physiology Cover Image
Journal of General Physiology (JGP) publishes mechanistic and quantitative cellular and molecular physiology of the highest quality. Est. 1918
Journal
Journal
Journals Gateway
Journal
Journal of Human Immunity Cover Image
Journal of Human Immunity (JHI) publishes papers that provide novel insights into the physiology and pathology of human immunity through the study of genetic defects and their phenocopies, including the study of leukocytes and other cells.
Journal Articles
Journal Articles
Journal Articles
Images
ER-localized Gox/Osi23 controls ER-phagy. (A–C) TEM of the olf hair cell at 44 h APF. (A) An enlarged view of the curved cuticular envelop and the underlying plasma membrane. The lowest point of the curved envelope is often associated with PMI. (B) Localization of APEX2-Gox protein in tubular ER. Left: low-magnification view (composite of two images). Right: enlarged view of the perinuclear (orange) and the shaft region (blue). Dotted lines outline plasma membrane of the olf hair cell. (C) Three types of Gox-containing organelles. I, ER. II, electron-dense vesicle (arrowhead in B). IIIa, IIIb, electron-lucent structures. IIIa is a multi-membrane structure. (D) Proximity of Gox+ structures to the high (orange) or low (blue) point of the envelope. (E) Distance from the membrane of the three types of Gox vesicles. Median distance is shown above each plot. (F) Presumed order of Gox-vesicle conversion. (G) Localization of Gox and ER marker Cnx. (H and I) Distribution of ER (magenta) in control (y w) and gox mutant. Segmented view of FIB-SEM stacks. (J and K) ER distribution in control and ATG8a RNAi. (L) Reduction of subcortical Gox localization in ATG8a RNAi. Graphs below show averaged line scan intensities of ER or Gox along the cross section of each hair (control: gray; mutant: magenta, 5–7 hairs for each genotype). (M) Adult olf bristle of neur > ATG8a RNAi lacking nanopores (top) and control (UAS-ATG8a RNAi only, bottom). For panel E, a total of 196 Gox-positive vesicles (type I = 72, type II = 94, and type III = 30) were classified by morphology and distance from the plasma membrane. The high- and low-PM curvature points were manually identified. No formal statistical test was applied because the data represent categorical frequency counts. For panels J–L, line intensity profiles of ER and HA–Gox signals were obtained from 5–7 individual hairs per genotype, normalized, and averaged using custom Python scripts. No formal statistical test was applied; error shading represents mean ± SD. Bar: 100 nm (A), 2 µm (B), 500 nm (enlarged in B), 200 nm (C), and 1 µm (G–M).
Published: 29 December 2025
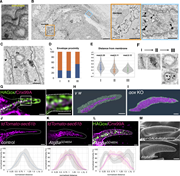
Figure 1. ER-localized Gox/Osi23 controls ER-phagy. (A–C) TEM of the olf hair cell at 44 h APF. (A) An enlarged view of the curved cuticular envelop and the underlying plasma membrane. The lowest point of the curved envelope is often More about this image found in ER-localized Gox/Osi23 controls ER-phagy. (A–C) TEM of the olf hair cell a...
Images
Plasma membrane landscape of the olf hair cell. (A) Plasma membrane structures of the olf and spinule obtained by FIB-SEM. Outer view (left) and inner view (right). (B) Longitudinal TEM views of the plasma membrane and envelope at 44, 50, and 52 h APF. (C) Envelope lengths were measured between adjacent low points in TEM images. Data points represent individual envelope fragments from n = 1–3 biological replicates per time point. A total of 95–183 fragments (5–9 TEM sections per condition) were analyzed. Data are shown as mean ± SD, and statistical significance between y w and gox KO was determined by the Mann–Whitney U test (two-sided). *: P < 0.05. n.s., not significant. (D) Quantification of envelope curvature (µm-1). Median point curvature per fragment was plotted in violin plots (n = 1–3 biological replicates). Statistical comparison used the Mann–Whitney U test (two-sided). (E) ER and Gox distributions in atl RNAi. (F) FIB-SEM plasma membrane views of atl RNAi hair cell #1. Bar: 1 μm (A, E, and F), 200 nm (B and E enlarged), and 200 nm (A and F inner side, approx.).
Published: 29 December 2025
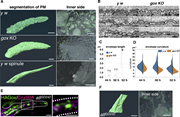
Figure 2. Plasma membrane landscape of the olf hair cell. (A) Plasma membrane structures of the olf and spinule obtained by FIB-SEM. Outer view (left) and inner view (right). (B) Longitudinal TEM views of the plasma membrane and envelope at More about this image found in Plasma membrane landscape of the olf hair cell. (A) Plasma membrane struct...
Images
Gox/Osi23-interacting proteins involved in nanopore formation. (A) Mass spectrometric identification of Gox-associated proteins in S2 cells expressing Gox–Flag. An asterisk (*) indicates proteins identified from cells co-expressing Gox–Flag and Myc-Ref(2)P. The complete list of identified proteins is found in Supplementary Table S2. (B) ER localization of Gox-interacting proteins Spg, TER-94, and CG13887. Image of TER-94 was processed by image deconvolution. (C) RNAi phenotypes of Gox-interacting proteins/genes. Left: SEM image of olf bristles showing strong loss of nanopore phenotype. Right: percentage of olf bristles classified as normal (Light gray), partial (gray), and strong (black) class of nanopore loss phenotype. n indicates the number of scored bristles. No formal statistical test was applied because the data represent categorical frequency counts. Scale bars: 10 µm (B) and 1 µm (C).
Published: 29 December 2025
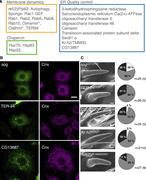
Figure 3. Gox/Osi23-interacting proteins involved in nanopore formation. (A) Mass spectrometric identification of Gox-associated proteins in S2 cells expressing Gox–Flag. An asterisk (*) indicates proteins identified from cells co-expressing More about this image found in Gox/Osi23-interacting proteins involved in nanopore formation. (A) Mass sp...
Images
The role of Ref(2)P in Gox localization and ubiquitination. (A) Ref(2)P is specifically enriched in the shaft region of olf hair cells, which is labeled by HA–Gox. Maxillary palp 42 h APF. (B) Subcortical localization of Ref(2) in control and gox mutant olf hair cells, and their quantification. Line intensity profiles were obtained from 5–7 individual hairs per genotype using the PlotProfile function in Fiji and averaged after normalization with custom Python scripts. Gray line: Ref(2)P distribution in control; magenta line: Ref(2)P in gox KO. Error shading represents mean ± SD. (C) Subcortical Gox localization was lost in Ref(2)P RNAi. Right graph: quantification. Right panel: quantification of fluorescence intensity profiles. Gray line: HA–Gox in control; magenta line: HA–Gox in Ref(2)P knockdown cells. No formal statistical test was applied because the plots represent averaged fluorescence intensity distributions (D) Interaction of Gox2 with Ref(2)P and ubiquitination in S2 cells. Gox–Flag and Ref(2)P-Myc were co-expressed and immunoprecipitated with the tag antibodies. Immunoprecipitate of Ref(2)P containing a low molecular weight form of Gox (*, lane 4). The increased amount of high molecular weight forms of Gox was induced by Ref(2)P (compare lane 7 and 8). Note that cross-reactivity of HRP-conjugated antibodies to the IgG (marked with **) used for immunoprecipitation. (E) Properties of Gox8KR. Gox8KR (*) and Ref(2)P (**) were co-immunoprecipitated with each other (lane 8 and 12). *** indicates the band of Ref(2). Although Ref(2) caused a slight increase in Gox amount and molecular mass (lane 16), no specific increase in ubiquitination level was observed (lane 20). (F) WT gox and gox8KR were expressed by neur-Gal4. (G) Line intensity profiles showing the distribution of Flag (pink) and ER marker tdTomato–Sec61b (gray) in olf hair cells expressing UAS–Gox–Flag (top) or UAS–Gox8KR–Flag (bottom). Profiles were obtained and averaged as in B and C. No formal statistical test was applied; error shading represents mean ± SD. (H) AlphaFold 2 model of Gox/Osi23 (pLFFT score 68.12), and the location of the two mapped ubiquitinated lysine (K101 and K131) identified by the LC-MS/MS. Alpha helices are labeled (H1–H6). Molecular weight markers (kDa) are indicated for all blots, and uncropped images are provided in SourceData FS4.pdf.
Published: 29 December 2025
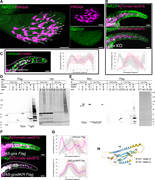
Figure 4. The role of Ref(2)P in Gox localization and ubiquitination. (A) Ref(2)P is specifically enriched in the shaft region of olf hair cells, which is labeled by HA–Gox. Maxillary palp 42 h APF. (B) Subcortical localization of Ref(2) in More about this image found in The role of Ref(2)P in Gox localization and ubiquitination. (A) Ref(2)P is...
Images
Dynamin–Gox interaction. (A) Temperature-shift protocol for inactivating dynamin in shits2 mutants. (B) PMI in control and shits2 mutants olf hair cells reconstructed by FIB-SEM. (C) PMI neck width measured from three independently reconstructed olf hair cells per genotype. Data were plotted as violin plots showing the distribution and median values. (shits2/y w: 118 points from three individual olfs; shits2/Y: 131 points from three individual olfs). Statistical significance was determined using the Mann–Whitney U test (two-sided), **: P < 0.001. (D) Number of PMIs quantified from FIB-SEM reconstructions of three olf hair cells per genotype. Counts were made from three independently reconstructed olf hair cells for each genotype (y w and shits2/Y). No formal statistical test was applied because the data represent simple counts. (E) TEM views of shits2/y w (control) and shits2/Y (mutant). (F) Quantification of envelope curvature. Point curvatures were calculated using the Kappa plugin in Fiji, and the median curvature of each envelope fragment was used as a representative value. Data were compared using the Mann–Whitney U test (two-sided). **: P < 0.01. (G) Maxillary palp of shits2/y w (control) and shits2/Y (mutant) stained for expression of HA–Gox and Ref(2)P. Asterisk indicates completely internalized olf hair cells. (H) Enlarged views of shits2/Y olf hair cells, showing normal (top and lower-left) and partially invaginated (lower right) phenotypes. (I) FIB-SEM view of plasma membrane and ER of shits2/Y olf #1. (J) Relationship of ER and plasma membrane in shits2/Y and y w (control). (K) ER–plasma membrane contacts in shits2/Y. (L) Distribution of ER–plasma membrane contact site (yellow dot) in shits2/Y olf #1. (M) Model of plasma membrane and ER interaction underlying nanopore formation. PMI formation is sustained by the stimulation by Gox and the clearance by dynamin. This dynamic interaction is coupled to ER-phagy, which supplies excessive lipids to the plasma membrane that buckles under the confinement by apical ECM. Envelope formation follows plasma membrane curvature. Bar: 100 nm (approx.), 1 µm (E, left), 200 nm (E, right), 10 µm (G), 1 µm (H, I), 200 nm (J, approx.), 100 nm (K, approx.), and 1 µm (L, approx.).
Published: 29 December 2025
Figure 5. Dynamin–Gox interaction. (A) Temperature-shift protocol for inactivating dynamin in shits2 mutants. (B) PMI in control and shits2 mutants olf hair cells reconstructed by FIB-SEM. (C) PMI neck width measured from three independently More about this image found in Dynamin–Gox interaction. (A) Temperature-shift protocol for inactivating d...
Images
A Tandem Red-Green reporter linked to a targeting signal for the peroxisomal lumen (PO-TRG) has been expressed in mice. Material that has been delivered to lysosomes via selective autophagy shows as red punctae and provides an index of pexophagy. This opens the way for physiological studies of pexophagy in a mammalian system for the first time.
Published: 29 December 2025
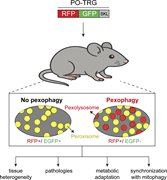
Figure 1. A Tandem Red-Green reporter linked to a targeting signal for the peroxisomal lumen (PO-TRG) has been expressed in mice. Material that has been delivered to lysosomes via selective autophagy shows as red punctae and provides an index of More about this image found in A Tandem Red-Green reporter linked to a targeting signal for the peroxisoma...
Images
DegronGFPdegrades GFP-tagged proteins located in different cell compartments. (A) Diagram of the DegronGFP system. To the left, alleles required for the system: rtTA under a tissue-specific promoter, TRE-VHL-aGFP, and a gene of interest fused to GFP (for loss-of-function studies, two alleles of GFP knock-in are required). To the left: Degron’s mechanism of action; briefly: VHL-aGFP (degron), a component of the E3 ligase complex, is translated only upon Dox exposure and binds to the GFP-tagged protein of interest (POI), bringing it into proximity to E2 to facilitate the transfer of ubiquitin. Polyubiquitinated POI-GFP is then sent for proteasomal degradation. (B) Immunofluorescence staining of GFP (green) and degron (red) in P0 back skin epidermis of K10-Degron;ZO1-GFP neonates and control ZO1-GFP littermates. Insets show only GFP in control (1) or in K10-Degron;ZO1-GFP (2). Dotted lines represent the basement membrane. *: Indicates autofluorescent cornified layer. All scales: 20 μm. (C) GFP fluorescence intensity across cell–cell junctions in the epidermal suprabasal layers of ZO1-GFP (green) and suprabasal DegronPos areas of K10-Degron;ZO1-GFP neonates (pink). Line scan graph shows measurements across 12 cell–cell boundaries from three different mice per genotype. Data are represented as mean ± SD. (D) Quantification of fluorescence intensity at suprabasal–suprabasal cell boundaries in ZO1-GFP and DegronPos areas in K10-Degron;ZO1-GFP neonates. Each dot represents the maximum intensity at cell–cell junctions; large circles represent the average for each mouse (n = 3 mice per genotype, at least 20 line scans per animal). Lines show the mean ± SEM. P = 0.0294, paired two-tailed t test. (E) Immunofluorescence staining of GFP and degron in P0 back skin epidermis of K10-Degron;mGFP neonates and control mGFP littermates. Insets show only GFP in control (1) or in K10-Degron;mGFP (2). (F) Quantification of average mGFP fluorescence intensity per mouse from all suprabasal areas in controls (n = 3 mice) or degron + suprabasal areas in experimental neonates (n = 3 mice). Data are represented as mean ± SEM. P = 0.0298, two-tailed paired t test. (G) Immunofluorescence staining of degron (red) in epidermis of K10-Degron;H2B-GFP neonates and control H2B-GFP littermates. Insets show only GFP in control (1) or in K10-Degron;H2B-GFP (2). (H) Quantification of average H2B-GFP fluorescence intensity per nucleus in controls vs. degron + cells in experimental neonates (n = 49 cells for control and n = 63 degron + cells for K10-Degron;H2B-GFP from 2 animals per genotype). ****P < 0.0001, two-tailed unpaired t test. (I) Immunofluorescence staining of GFP and degron in the tail epidermis of a K14-Degron;ZO1-GFP adult mouse. Insets show areas across cell–cell junctions between: (1) two adjacent cells not expressing degron (DegronNeg), (2) DegronNeg and a cell expressing degron (DegronPos), or (3) two adjacent DegronPos cells. (J) GFP fluorescence intensity in the adult tail epidermis across 10 cell–cell junctions for each category in I. Line scans were performed as represented with white lines in insets 1, 2, and 3. (K) Quantification of fluorescence intensity at suprabasal–suprabasal cell boundaries in the adult tail epidermis. Each dot in the violin plots represents the maximum intensity across cell–cell junctions in each category shown in I (n = 30 measurements across 10 cell–cell junctions per category). P < 0.0001, ordinary one-way ANOVA, Tukey’s multiple comparisons test. For all experiments in Fig. 1, animals were fed with doxycycline chow (BIO-Serv S3888, 200 mg/kg dox) from E13.5 until P0.
Published: 29 December 2025
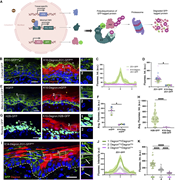
Figure 1. Degron GFP degrades GFP-tagged proteins located in different cell compartments. (A) Diagram of the DegronGFP system. To the left, alleles required for the system: rtTA under a tissue-specific promoter, TRE-VHL-aGFP, and a gene of More about this image found in Degron GFP degrades GFP-tagged proteins located in different c...
Images
DegronGFPdegrades GFP-tagged proteins in different cell populations. (A) Immunofluorescence staining of GFP (green) and degron (red) in E18.5 back skin epidermis of K14-Degron;GR-GFP and control GR-GFP littermate. Insets show only GFP in control (1) or in K10-Degron;ZO1-GFP (2). White arrowhead indicates unspecific antibody signal. Dotted lines represent the basement membrane. *: Indicates autofluorescent cornified layer. Scale bar: 20 μm. (B and C) Quantification of nuclei average fluorescence intensity in the basal layers in GR-GFP (n = 3 mice, 98 nuclei total), or DegronPos basal cells in K14-Degron;GR-GFP (n = 3 mice, 110 nuclei total) embryos (B), or in suprabasal cells (C). Dots represent each nucleus measured; large circles represent the average for each mouse. Lines show the mean ± SEM. P = 0.0268, paired two-tailed t test for B. (D) Immunofluorescence staining of GFP and degron in adult intestinal epithelia of Villin-Deg; ZO1-GFP and control ZO1-GFP littermate. Scale bar: 20 μm. Insets show higher magnification images. (E) Quantification of fluorescence intensity across apical cell–cell junctions in villi epithelial of ZO1-GFP and DegronPos areas in Villin-Degron;ZO1-GFP neonates. Each dot represents the maximum intensity at cell–cell junctions; large circles represent the average for each mouse (n = 3 mice per genotype, 15 line scans per animal). Lines show the mean ± SEM. P = 0.0294, paired two-tailed t test. (F) GFP fluorescence intensity across cell–cell villi epithelial cells of ZO1-GFP (green) and DegronPos areas of Villin-Degron;ZO1-GFP mice (pink). Line scan graph shows measurements across 12 cell–cell boundaries from 3 different mice per genotype. Data are represented as mean ± SD. For epidermal experiments, animals were fed dox chow from E16.5 to E18.5, and for adult experiments, they were on dox chow for 1 wk.
Published: 29 December 2025
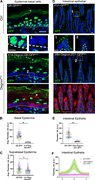
Figure 2. Degron GFP degrades GFP-tagged proteins in different cell populations. (A) Immunofluorescence staining of GFP (green) and degron (red) in E18.5 back skin epidermis of K14-Degron;GR-GFP and control GR-GFP littermate. Insets show only More about this image found in Degron GFP degrades GFP-tagged proteins in different cell popu...
Images
Kinetics of GFP degradation using DegronGFP. (A and B) Immunofluorescence staining of GFP (green) and degron (red) in E18.5 back skin epidermis of K10-Degron;ZO1-GFP and control ZO1-GFP embryos 24 h (A) or 6 h (B) after dox exposure. Dotted lines represent the basement membrane. All scales bars: 20 μm. Pregnant dams were IP injected with doxycycline (100 mg/kg) and then given dox chow until sacrifice. (C and D) GFP fluorescence intensity across cell–cell junctions in the epidermal suprabasal layers of ZO1-GFP (green), suprabasal DegronPos areas of K10-Degron;ZO1-GFP (pink) neonates 24 h (C) or 6 h (D) after dox exposure, and negative control WT (blue). Line scan graph shows measurements across nine cell–cell boundaries from three different mice per genotype. Data are represented as mean ± SD. (E) Immunofluorescence staining of GFP (green) and degron (red) in adult intestinal epithelia after 2 days of doxycycline in control ZO1-GFP (left panel, inset 1) and Villin-Deg;ZO1-GFP (middle panel, inset 2). Right panel, inset 3, shows Villin-Deg;ZO1-GFP that was taken off of doxycycline for 3 days. Insets show only GFP. Scale bar: 20 μm. Mice were fed dox chow for 2 days and then changed to regular chow. Note that there is a duplicate of this panel in Fig. S2 D.
Published: 29 December 2025
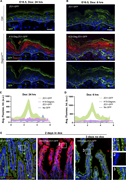
Figure 3. Kinetics of GFP degradation using Degron GFP . (A and B) Immunofluorescence staining of GFP (green) and degron (red) in E18.5 back skin epidermis of K10-Degron;ZO1-GFP and control ZO1-GFP embryos 24 h (A) or 6 h (B) after dox More about this image found in Kinetics of GFP degradation using Degron GFP . (A and B) Immu...
Images
DegronGFPefficiently depletes GR-GFP and reproduces knockout phenotypes. (A–C) Immunofluorescence staining of GFP (green) and EdU (magenta) in E18.5 back skin epidermis of GR-GFP (A), K14-Degron;GR-GFP (B), and K10-Degron;GR-GFP (C) embryos. *: Indicates nonspecific signal in cornified layer. Scale bar: 20 μm. (D) Percentage of Edu-positive cells in K14-Degron;GR-GFPHom vs. GR-GFP control littermates. Each circle represents measurements of a mouse: solid color circles represent mice dox-exposed since E13.5, and circles with a dot represent dox-exposed mice since E16.5 (n = 5 mice per genotype). Lines show the mean ± SEM. *: P = 0.0172, paired two-tailed t tests. (E) Percentage of Edu-positive cells in K10-Degron;GR-GFPHom vs. GR-GFP control littermates. Each circle represents measurements of a dox-exposed mouse since E13.5 (n = 4 mice per genotype). Lines show the mean ± SEM. *: P = 0.0235, paired two-tailed t test. (F–H) Immunofluorescence staining of GFP (green) and loricrin (red) in E18.5 back skin epidermis of GR-GFP (F), K14-Degron;GR-GFP (G), and K10-Degron;GR-GFP (H) embryos. White and pink lines show granular and cornified layer thickness, respectively. Dotted white lines represent the basement membrane. Scale bar: 20 μm. (I) Quantification of loricrin and cornified layer thickness in GR-GFP controls vs. K14-Degron;GR-GFPHom littermates. Each circle represents the average layer thickness of a mouse: solid color circles represent mice dox-exposed since E13.5, and circles with a dot represent dox-exposed mice since E16.5. Lines show the mean ± SEM. Loricrin and cornified thickness measurements were taken perpendicular to the basement membrane (n = 3 mice per genotype, at least 22 measurements per mouse) P = 0.0528 and 0.1206, respectively. ns, nonsignificant; paired two-tailed t tests. (J) Quantification of loricrin and cornified thickness in GR-GFP controls vs. K10-Degron;GR-GFPHom littermates. Each circle represents the average loricrin or cornified thickness of a mouse dox-exposed since E13.5. Lines show the mean ± SEM (n = 3 mice per genotype, at least 30 measurements per mouse) *: P = 0.033 and 0.1206. ns, non-significant; paired two-tailed t tests. Pregnant dams were fed with dox chow from E13.5 to 16.5.
Published: 29 December 2025
Figure 4. Degron GFP efficiently depletes GR-GFP and reproduces knockout phenotypes. (A–C) Immunofluorescence staining of GFP (green) and EdU (magenta) in E18.5 back skin epidermis of GR-GFP (A), K14-Degron;GR-GFP (B), and K10-Degron;GR-GFP More about this image found in Degron GFP efficiently depletes GR-GFP and reproduces knockout...