


Intravenous immunoglobulin (IVIg) products are widely used to treat immune deficiency and autoimmune disorders; however, infusion-related reactions remain a significant clinical concern. Differences in tolerability among commercial Ig products may be associated with variability in the number and types of human contaminant proteins (HCPs). HCPs may directly activate immune pathways or indirectly contribute to immune activation. We hypothesized that product-specific differences in HCP content may underlie patient-to-patient variability in infusion reactions and overall immunogenicity risk.
To assess this, we applied the ISPRI-HCP in silico immunogenicity platform, which integrates validated EpiVax tools (EpiMatrix, JanusMatrix, and ClustiMer) to evaluate T cell epitope density and human proteome cross-conservation in four commercial IVIg products. HCP were identified by liquid chromatography and mass spectrometry and assigned immunogenicity scores. Plotting the scores by epitope density (EpiMatrix) and humanness (JanusMatrix) enabled direct comparison of immunogenicity profiles across products.
Substantial differences in HCP burden were observed: Products A, B, C, and D contained 7, 19, 14, and 31 HCPs, respectively (Figure 1). Some HCPs were shared among products, while others were unique, reflecting product-specific manufacturing or purification differences. Product A contained the fewest HCPs overall. Quadrant analyses showed that product A also had a greater proportion of HCP immunogenic regions (clusters) that were highly cross-conserved with other human T cell epitopes (quadrant 2) (Figure 2). In contrast, products B–D displayed higher frequencies (>66%) of HCP clusters in quadrant 1, indicating higher predicted immunogenic potential. Across products, certain shared HCPs—such as complement factor C3—that had high epitope density and limited cross-conservation, were also prevalent.
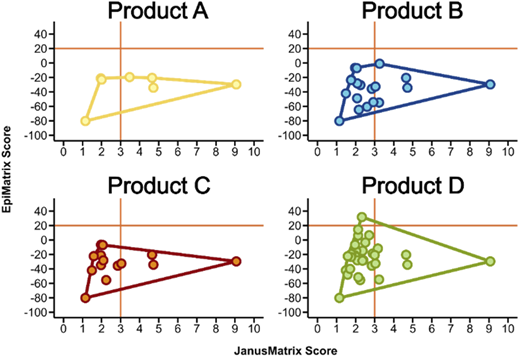
IVIg products classified by immunogenic potential of HCP content. Characterization of host cell proteins (HCPs) by immunogenicity metrics. Each subplot represents one of the four products. Within each subplot, the individual HCPs are plotted based on their JanusMatrix Score (x-axis) and EpiMatrix Score (y-axis). The outline of each product’s HCP population is shown to facilitate visual comparison across subplots. EpiMatrix scores quantify epitope density normalized by protein length, enabling comparison across proteins of different sizes. JanusMatrix scores quantify the degree of cross-conservation between putative T cell epitopes and the human proteome. To obtain these scores, HCP proteins were parsed into overlapping 9-mer peptides, and each 9-mer was evaluated using the EpiMatrix algorithm for MHC class II-binding potential and using the JanusMatrix algorithm for sequence identity of TCR-facing residues to the human proteome.
IVIg products classified by immunogenic potential of HCP content. Characterization of host cell proteins (HCPs) by immunogenicity metrics. Each subplot represents one of the four products. Within each subplot, the individual HCPs are plotted based on their JanusMatrix Score (x-axis) and EpiMatrix Score (y-axis). The outline of each product’s HCP population is shown to facilitate visual comparison across subplots. EpiMatrix scores quantify epitope density normalized by protein length, enabling comparison across proteins of different sizes. JanusMatrix scores quantify the degree of cross-conservation between putative T cell epitopes and the human proteome. To obtain these scores, HCP proteins were parsed into overlapping 9-mer peptides, and each 9-mer was evaluated using the EpiMatrix algorithm for MHC class II-binding potential and using the JanusMatrix algorithm for sequence identity of TCR-facing residues to the human proteome.
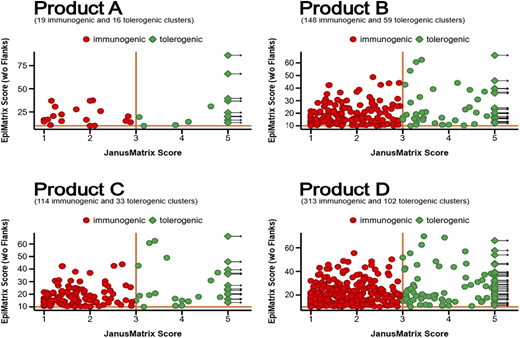
IVIg Products classified by potential immunogenicity of class II “clusters” HCP sequences. Characterization of host cell proteins (HCPs) by immunogenicity metrics. Each subplot represents one of the four products. Within each subplot, individual epitope clusters are plotted using the JanusMatrix Score on the x-axis and the EpiMatrix Score on the y-axis. Clusters are epitope-dense regions within a protein. Each point represents a single cluster identified from any HCP sequence found in the product. Proteins containing multiple clusters contribute multiple points. To obtain cluster scores, proteins were first parsed into overlapping 9-mer peptides, and each 9-mer was evaluated using the EpiMatrix algorithm for MHC class II-binding potential. Epitope-dense regions (clusters) were then identified using ClustiMer. These were then characterized using the JanusMatrix algorithm to determine similarity to the human proteome. Red clusters have higher immunogenic potential than green clusters, which are highly conserved within the human proteome.
IVIg Products classified by potential immunogenicity of class II “clusters” HCP sequences. Characterization of host cell proteins (HCPs) by immunogenicity metrics. Each subplot represents one of the four products. Within each subplot, individual epitope clusters are plotted using the JanusMatrix Score on the x-axis and the EpiMatrix Score on the y-axis. Clusters are epitope-dense regions within a protein. Each point represents a single cluster identified from any HCP sequence found in the product. Proteins containing multiple clusters contribute multiple points. To obtain cluster scores, proteins were first parsed into overlapping 9-mer peptides, and each 9-mer was evaluated using the EpiMatrix algorithm for MHC class II-binding potential. Epitope-dense regions (clusters) were then identified using ClustiMer. These were then characterized using the JanusMatrix algorithm to determine similarity to the human proteome. Red clusters have higher immunogenic potential than green clusters, which are highly conserved within the human proteome.
Product A demonstrated the lowest predicted in silico immunogenicity risk based on its reduced HCP burden, higher humanness of its HCPs, and fewer high-risk epitope clusters. This analysis highlights the value of in silico HCP screening for identifying product-specific immunogenicity drivers and informing future IVIg product optimization.


