


Inborn errors of immunity (IEI) are increasing in number, and prompt recognition and diagnosis remain a challenge for clinicians. Use of machine learning (ML) for clinical pattern recognition is promising but has been limited to date. Unsupervised ML presents a methodology for systematic disease pattern recognition with voluminous and complex medical data. We hypothesize that clustering national laboratory data for IEIs will uncover disease subphenotypes guiding further treatment courses.
We extracted laboratory and demographic data for 26,760 IEI patients from Cerner Real World Data, a de-identified US national dataset. Five clustering algorithms (Density-Based Spatial Clustering of Applications with Noise [DBSCAN], Hierarchical DBSCAN [HDBSCAN], Hierarchical, K-means, and K-modes) were implemented for 7 IEI disease groups using lymphocyte measurements and analyzed across 6 age groups. We exemplify our approach here by focusing on DiGeorge syndrome (DGS) within the first year of life. Clusters were scored, ranked, and clinically validated using health record data and domain expertise.
A total of 3,144 experiments were implemented across IEI disease states. We used standard ML evaluation metrics and a custom composite score to identify phenotype clusters for clinical validation. Preliminary results demonstrated rapid discovery of IEI subphenotypes (e.g., DGS; Figure 1). Cluster clinical validation for DGS delineated the following subphenotypes based on frequent diagnostic codes within a cluster: gastrointestinal, cardiac/lung, and gastrointestinal/cardiac pathology. Feature importance analysis revealed significant differences among helper T cell distributions, lifetime leukocyte counts, and mean platelet volumes for patient data (Figure 2). The cluster with greater lung disease diagnostic codes demonstrated the lowest T lymphocyte distributions, while the cluster with a combined gastrointestinal (GI)/cardiac signature was the only one with patients having qualitative platelet defect codes, while the mean platelet volume (MPV) laboratory distribution was among the highest for the clusters evaluated. These cluster validations may indicate complete versus partial DGS subphenotypes.
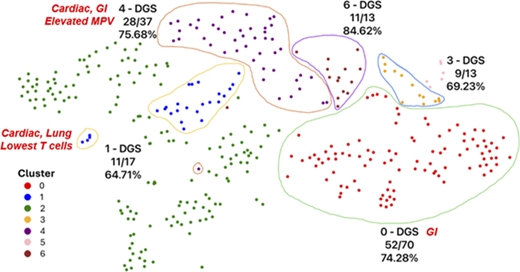
High-performing clusters for 0–1-year-old agglomerative hierarchical clustering experiment. Each patient data point is a 5-dimensional vector reduced through principal component analysis (PCA), followed by further reduction via the t-Distributed Stochastic Neighbor Embedding (t-SNE) algorithm to project on a 2D space. The illustrations show the dominant disease group (DGS) in the enclosed cluster and its fractional proportions. The cluster phenotypes based on diagnostic codes and laboratory data are labeled in red italics for clusters 0, 1, and 4. Clusters 3 and 6 had no immune phenotype of relevance.
High-performing clusters for 0–1-year-old agglomerative hierarchical clustering experiment. Each patient data point is a 5-dimensional vector reduced through principal component analysis (PCA), followed by further reduction via the t-Distributed Stochastic Neighbor Embedding (t-SNE) algorithm to project on a 2D space. The illustrations show the dominant disease group (DGS) in the enclosed cluster and its fractional proportions. The cluster phenotypes based on diagnostic codes and laboratory data are labeled in red italics for clusters 0, 1, and 4. Clusters 3 and 6 had no immune phenotype of relevance.
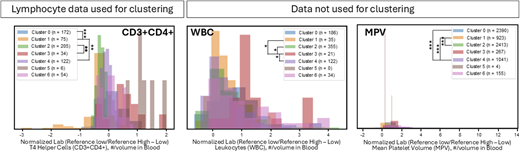
Clinical validation of DGS clusters using laboratory studies. Examples of laboratory studies with highly significant differences between DGS patients clustered separately. Distributions for lifetime laboratory data were evaluated for DGS patients across laboratory studies used in clustering algorithms and additional serum studies. Kolmogorov-Smirnov pairwise analyses based on Bonferroni adjustment. *p < 1e-5, **p < 1e-10, and ***p < 1e-15.
Clinical validation of DGS clusters using laboratory studies. Examples of laboratory studies with highly significant differences between DGS patients clustered separately. Distributions for lifetime laboratory data were evaluated for DGS patients across laboratory studies used in clustering algorithms and additional serum studies. Kolmogorov-Smirnov pairwise analyses based on Bonferroni adjustment. *p < 1e-5, **p < 1e-10, and ***p < 1e-15.
We present an unbiased ML approach for IEI subphenotype discovery. Agglomerative clustering using national lymphocyte data of 0–1-year-olds revealed separate DGS phenotype clusters and significant differences in laboratory data. For DGS, our findings may indicate differences in lifetime infection burden and immune health. Downstream evaluation of IEI patient subphenotypes could serve as a basis for multi-omic evaluation, risk screening, and targeted therapies.


