
Skip Nav Destination
Close Modal


1-20 of 133
Follow your search
Access your saved searches in your account
Would you like to receive an alert when new items match your search?
1
Journal Articles
In Special Collection:
Cardiovascular Physiology 2018
Journal:
Journal of General Physiology
J Gen Physiol (2017) 150 (1): 145–168.
Published: 01 December 2017
Includes: Supplementary data
in Integrative model of coronary flow in anatomically based vasculature under myogenic, shear, and metabolic regulation
> Journal of General Physiology
Published: 01 December 2017
Figure 1. Flow models in a single vessel and vessel bifurcation. (A) Scheme of a single uniform cylindrical coronary vessel and its pressure boundary conditions: Pin, the inlet pressure; Pout, the outlet pressure; PT, the surrounding tissue More about this image found in Flow models in a single vessel and vessel bifurcation. (A) Scheme of a sin...
in Integrative model of coronary flow in anatomically based vasculature under myogenic, shear, and metabolic regulation
> Journal of General Physiology
Published: 01 December 2017
Figure 2. The effects of different regulation mechanisms and of the terminal target flow qtarget on the distribution across all terminal vessels of their time-averaged terminal flow q ¯ t e r m . The vessels’ properties and More about this image found in The effects of different regulation mechanisms and of the terminal target f...
in Integrative model of coronary flow in anatomically based vasculature under myogenic, shear, and metabolic regulation
> Journal of General Physiology
Published: 01 December 2017
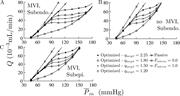
Figure 3. Effects of MVI, regulation mechanisms, and transmural network location on the network flow. (A–D) Subendocardial network flow, Q as a function of mean inlet pressure, P ¯ i n , with MVI (A) and without MVI (B); and More about this image found in Effects of MVI, regulation mechanisms, and transmural network location on t...
in Integrative model of coronary flow in anatomically based vasculature under myogenic, shear, and metabolic regulation
> Journal of General Physiology
Published: 01 December 2017
Figure 4. Flow autoregulation. (A–C) Total network flow under three levels of metabolic demand (qtarget) in the subendocardial network with MVI (A) and without MVI (B) and subepicardial network with MVI (C). The vessels’ properties and boundary More about this image found in Flow autoregulation. (A–C) Total network flow under three levels of metabo...
in Integrative model of coronary flow in anatomically based vasculature under myogenic, shear, and metabolic regulation
> Journal of General Physiology
Published: 01 December 2017
Figure 5. Effect of the time-average inlet perfusion pressure P ¯ i n and MVI on the distribution of metabolic activation across the terminal vessels, Fmterm, for a terminal target flow, qtarget, of 1.5 × 10⁻³ mm3/s. (A–L) More about this image found in Effect of the time-average inlet perfusion pressure P ¯ i n ...
in Integrative model of coronary flow in anatomically based vasculature under myogenic, shear, and metabolic regulation
> Journal of General Physiology
Published: 01 December 2017
Figure A1. The assigned pressure boundary conditions. Pin, the input pressure to the order 6 trunk vessel; P o u t s u b e n d o , the output pressure at the terminal order 1 vessels in a normalized myocardial depth of More about this image found in The assigned pressure boundary conditions. Pin...
in Integrative model of coronary flow in anatomically based vasculature under myogenic, shear, and metabolic regulation
> Journal of General Physiology
Published: 01 December 2017
Figure A2. Distribution of the vessels’ passive parameters Ap, φp, and Cp ( Eq. 1 ) over their cast radii, R80 ( Kassab et al., 1993 ). The minimum vessel radius, Bp, was set to be zero for all vessels. The data sources are listed in More about this image found in Distribution of the vessels’ passive parameters Ap...
in Integrative model of coronary flow in anatomically based vasculature under myogenic, shear, and metabolic regulation
> Journal of General Physiology
Published: 01 December 2017
Figure A3. Distribution of the vessels’ myogenic parameters ρm, φm, and Cm ( Eq. 2 ) over their cast radii, R80 ( Kassab et al., 1993 ). The data sources are listed in Table A3 . Figure A3. Distribution of the vessels’ myogenic More about this image found in Distribution of the vessels’ myogenic parameters ρm...
in Integrative model of coronary flow in anatomically based vasculature under myogenic, shear, and metabolic regulation
> Journal of General Physiology
Published: 01 December 2017
Figure A4. Distribution of the vessels’ shear parameters Fτmax and Kτ ( Eq. 5 ) over their cast radii, R80 ( Kassab et al., 1993 ). The data sources are listed in Table A4 . Figure A4. Distribution of the vessels’ shear parameters Fτmax More about this image found in Distribution of the vessels’ shear parameters Fτ...
in Integrative model of coronary flow in anatomically based vasculature under myogenic, shear, and metabolic regulation
> Journal of General Physiology
Published: 01 December 2017
Figure A5. Pressure-diameter relationship under passive and active vessel conditions. (A–D) The model predicted vessel diameter, D, normalized by the vessel diameter under zero pressure, D0, in the passive state (solid line) and under full More about this image found in Pressure-diameter relationship under passive and active vessel conditions. ...
Journal Articles
In Special Collection:
Cardiovascular Physiology 2018
, Ion Channel Structure & Function 2018
, JGP Reviews: Ion Channel Structure and Function
Journal:
Journal of General Physiology
J Gen Physiol (2017) 149 (12): 1065–1089.
Published: 09 November 2017
Published: 09 November 2017
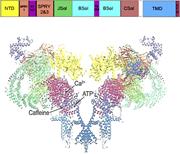
Figure 1. Open RyR1 channel structure. The structure (PDB code 5TAL ) reveals the major domains and the location of Ca2+-, ATP-, and caffeine-binding sites. Figure 1. Open RyR1 channel structure. The structure (PDB code 5TAL) reveals the More about this image found in Open RyR1 channel structure. The structure (PDB code 5TAL ) reveals the m...
Published: 09 November 2017
Figure 2. Ca2+ dependence of RyR1. Data obtained using the planar lipid bilayer and [3H]ryanodine binding methods. With modifications from Heiny and Meissner (2012) . Figure 2. Ca2+ dependence of RyR1. Data obtained using the planar lipid More about this image found in Ca2+ dependence of RyR1. Data obtained using the planar lipid b...
Published: 09 November 2017
Figure 3. Ca2+ dependence of single purified RyR1, RyR2, and RyR3. Shown are channel Po values as a function of cytosolic free Ca2+ in 250 mM K+, pH 7.4 medium. Redrawn from Xu et al. (1998) ; (RyR1 and RyR2) and Chen et al. (1997) ; (RyR3). More about this image found in Ca2+ dependence of single purified RyR1, RyR2, and RyR3. Shown ...
Published: 09 November 2017
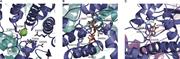
Figure 4. Structure of regulatory sites in RyR1. Ca2+ (A)-, ATP (B)-, and caffeine (C)-binding sites of open RyR1 (PDB code 5TAL ). Figure 4. Structure of regulatory sites in RyR1. Ca2+ (A)-, ATP (B)-, and caffeine (C)-binding sites of open More about this image found in Structure of regulatory sites in RyR1. Ca2+ (A)-, ATP (B)-, and...
Published: 09 November 2017
Figure 5. Effect of ryanodine on single purified RyR1. Single-channel recordings of K+ current of purified RyR1 incorporated in a planar lipid bilayer. The top trace shows the appearance of an subconductance state with Po ∼1, several minutes More about this image found in Effect of ryanodine on single purified RyR1. Single-channel recordings of ...
Journal Articles
In Special Collection:
Cardiovascular Physiology 2018
Journal:
Journal of General Physiology
J Gen Physiol (2017) 149 (10): 935–949.
Published: 08 September 2017
Includes: Supplementary data
in Age-related pacemaker deterioration is due to impaired intracellular and membrane mechanisms: Insights from numerical modeling
> Journal of General Physiology
Published: 08 September 2017
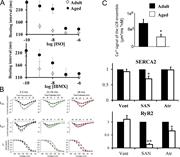
Figure 1. Age-associated deficient pacemaker function. (A) Age-associated reduction in basal beating interval and sensitivity to PDE inhibition by IBMX and β-AR stimulation by ISO. Note that the maximal beating rate is restored in response to More about this image found in Age-associated deficient pacemaker function. (A) Age-associated reduction ...
in Age-related pacemaker deterioration is due to impaired intracellular and membrane mechanisms: Insights from numerical modeling
> Journal of General Physiology
Published: 08 September 2017
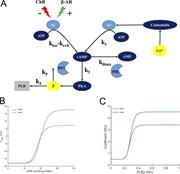
Figure 2. Model parameters adjustment. (A) Schematic illustration of the AC-AC-cAMP-PKA signaling cascade. AC is activated by adrenergic receptors (β-AR) and calmodulin and deactivated by cholinergic receptor (ChR) stimulation. Activated AC More about this image found in Model parameters adjustment. (A) Schematic illustration of the AC-AC-cAMP-...
1

