
Skip Nav Destination
Close Modal
1-20 of 859
Search Results for confluence
Follow your search
Access your saved searches in your account
Would you like to receive an alert when new items match your search?
1
in Targeting IRF3 as a YAP agonist therapy against gastric cancer
> Journal of Experimental Medicine
Published: 16 January 2018
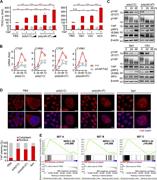
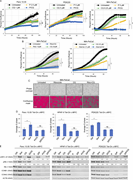
, and renilla luciferase reporter for 24 h. Then, cells at 80% confluence was transfected with 0.5 or 1 µg/ml poly(I:C)/poly(dA:dT) or infected with SeV (MOI 1), VSV (MOI 0.1), or HCV (MOI 0.1) for 0 to ∼48 h, and subsequently the luciferase assay was performed. (B) Transcriptional levels of CTGF More about this image found in Viral infection induces YAP activation. (A) Luciferase activity of TEAD pr...
in Itraconazole targets cell cycle heterogeneity in colorectal cancer
> Journal of Experimental Medicine
Published: 31 May 2018
Figure 6. Itraconazole treatment of CRC cell lines demonstrates treatment is effective in CCS1 cell lines and eliminates dormant cells. (A) Live cell confluence graphs of six CRC cell lines grown in 2D showing a dose-dependent effect in response to itraconazole More about this image found in Itraconazole treatment of CRC cell lines demonstrates treatment is effectiv...
in VE-PTP maintains the endothelial barrier via plakoglobin and becomes dissociated from VE-cadherin by leukocytes and by VEGF
> Journal of Experimental Medicine
Published: 17 November 2008
Figure 1. VE-PTP redistributes from an endosomal recycling compartment to endothelial cell contacts with increasing cell confluence. (A) Indirect immunofluorescence staining of mouse bEnd.3 endothelioma of increasing cell confluence (days after seeding are indicated) with an mAb against VE-PTP More about this image found in VE-PTP redistributes from an endosomal recycling compartment to endothelial...
in Macrophage Inflammatory Protein 3α Is Expressed at Inflamed Epithelial Surfaces and Is the Most Potent Chemokine Known in Attracting Langerhans Cell Precursors
> Journal of Experimental Medicine
Published: 05 September 2000
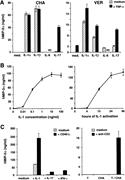
Figure 8 Regulation of MIP-3α production by epithelial cells in response to inflammatory cytokines or T cell signals. (A) Two renal carcinoma cell lines, CHA and VER, were seeded at 1–2 × 10⁴ cells/ml, and after 1–3 d of culture (80% confluence), cells were either activated by IL-1α More about this image found in Regulation of MIP-3α production by epithelial cells in response to inflamma...
in The Nuclear Factor of Activated T Cells (Nfat) Transcription Factor Nfatp (Nfatc2) Is a Repressor of Chondrogenesis
> Journal of Experimental Medicine
Published: 03 January 2000
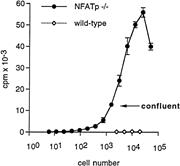
Figure 7 NFATp−/− cartilage cells show loss of contact-induced growth inhibition. Varying numbers of wt or NFATp−/− cartilage cells were plated, and cell division was monitored. Cell division continued even in cells that had reached confluency. Figure 7. NFATp−/− cartilage More about this image found in NFATp−/− cartilage cells show loss of contact-induced growth inh...
in VE-PTP maintains the endothelial barrier via plakoglobin and becomes dissociated from VE-cadherin by leukocytes and by VEGF
> Journal of Experimental Medicine
Published: 17 November 2008
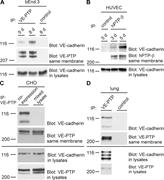
Figure 2. VE-PTP association with VE-cadherin increases with endothelial cell confluence and association occurs in vivo. bEnd.3 cells (A) and HUVECs (B) of increasing cell confluence (days after seeding are indicated above) were subjected to immunoprecipitations for VE-PTP (or human homologue More about this image found in VE-PTP association with VE-cadherin increases with endothelial cell conflue...
in Interfering with VE-PTP stabilizes endothelial junctions in vivo via Tie-2 in the absence of VE-cadherin
> Journal of Experimental Medicine
Published: 07 December 2015
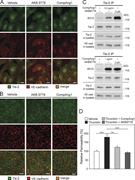
Figure 6. COMP-Ang1 and AKB-9778 both stimulate tyrosine phosphorylation of Tie-2, but only Comp-Ang1 redistributes Tie-2 to EC contacts. HUVECs were grown at low confluence (1.5 × 10⁴ cells/cm2; A) and at high confluence (7 × 10⁴ cells/cm2; B More about this image found in COMP-Ang1 and AKB-9778 both stimulate tyrosine phosphorylation of Tie-2, bu...
in Itraconazole targets cell cycle heterogeneity in colorectal cancer
> Journal of Experimental Medicine
Published: 31 May 2018
. (2013) dataset. ***, P < 0.001 by one-way ANOVA; ns, not significant. (H) Live cell confluence graph of the response of SW948 cells to Gant-61 treatment. (I) Live cell confluence measurements of the response of SW948 cells to itraconazole in the presence of siSuFu. Figure 7. Itraconazole More about this image found in Itraconazole treatment inhibits Wnt signaling. (A) GO pathway analysis of ...
in Activation of the integrated stress response confers vulnerability to mitoribosome-targeting antibiotics in melanoma
> Journal of Experimental Medicine
Published: 21 July 2021
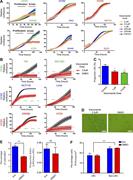
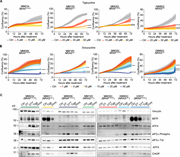
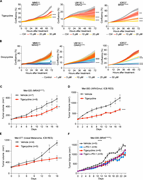
Figure 2. Tetracyclines exacerbate the activation of the ISR and affect the viability of multiple drug–tolerant states. (A) Cell growth (measured as percentage of cell confluency) of MM034 (BRAF mutant, proliferative), MM165 (NRAS mutant, invasive), MM383 (BRAF mutant More about this image found in Tetracyclines exacerbate the activation of the ISR and affect the viability...
in Hypoxia-Inducible Factor 1–Dependent Induction of Intestinal Trefoil Factor Protects Barrier Function during Hypoxia
> Journal of Experimental Medicine
Published: 30 April 2001
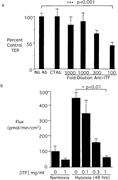
Figure 4 Functional role of ITF peptide on barrier function. In a, Caco-2 cells were grown to electrical confluence on polycarbonate supports. Anti-ITF immune serum at indicated concentrations or control anti-CREB (1:100) was added to the apical well of the support. Cells were exposed More about this image found in Functional role of ITF peptide on barrier function. In a, Caco-2 cells were...
in MYC-mediated resistance to trametinib and HCQ in PDAC is overcome by CDK4/6 and lysosomal inhibition
> Journal of Experimental Medicine
Published: 31 January 2023
Figure 5. Elevated c-MYC expression does not prevent P/CQ-mediated cell cycle arrest. (A) Panc 10.05, PDX220, and MIA-PaCa2 cells were imaged to assess confluence over time using the IncuCyte Live-Cell Analysis System after treatment with palbociclib (P), CQ, or the combination of both agents More about this image found in Elevated c-MYC expression does not prevent P/CQ-mediated cell cycle arrest....
in Isolation and Characterization of Dermal Lymphatic and Blood Endothelial Cells Reveal Stable and Functionally Specialized Cell Lineages
> Journal of Experimental Medicine
Published: 17 September 2001
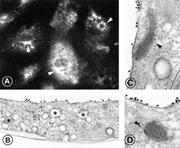
Figure 4 In vitro–cultured LECs contain caveolin and caveolae, and WP bodies. ECs were grown to confluence, fixed, labeled by indirect immunofluorescence for caveolin (A), or by a preembedding immunogold protocol for podoplanin (B). ECs express uniformly caveolin in a granular pattern More about this image found in In vitro–cultured LECs contain caveolin and caveolae, and WP bodies. ECs we...
in Conserved meningeal lymphatic drainage circuits in mice and humans
> Journal of Experimental Medicine
Published: 01 July 2022
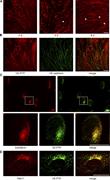
(alf). abv, anterior basal vein; iophv, internal ophthalmic vein; IOS, inferior olfactory sinus; olfev, olfactory emissary vein; ON, optic nerve (yellow); ophev, ophthalmic emissary vein; RCS, rostral confluence of sinuses; rrhv, rostro-rhinal vein; SOS, superior olfactory sinus. (B) vWF More about this image found in MLV drainage from the rostral CAV. (A) Schematic of veins of the ventral f...
in Activation of the integrated stress response confers vulnerability to mitoribosome-targeting antibiotics in melanoma
> Journal of Experimental Medicine
Published: 21 July 2021
Figure 5. Tetracyclines restrain the growth of therapy-resistant melanomas. (A) Cell growth (measured as a percentage of cell confluency) of MM011 (NRAS mutant), UM 92.1 (GNAQ mutant, UM), and IGR37 (resistant to immunotherapy) cell lines upon exposure to increasing More about this image found in Tetracyclines restrain the growth of therapy-resistant melanomas. (A) Cell...
in Glucocorticoids Regulate the Expression of the Human Osteoblastic Endothelin A Receptor Gene
> Journal of Experimental Medicine
Published: 02 November 1998
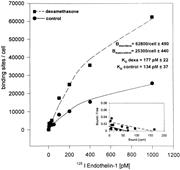
Figure 6 Saturation binding and Scatchard plot of 125I-ET1 in control and dexamethasone-treated HOC cultures. HOC were grown to 90% confluence and treated for 24 h with 100 nM dexamethasone. Control and treated cultures were incubated at 4°C for 2 h in serum-free medium containing 1.25 More about this image found in Saturation binding and Scatchard plot of 125I-ET1 in control and...
in Isolation and Characterization of Dermal Lymphatic and Blood Endothelial Cells Reveal Stable and Functionally Specialized Cell Lineages
> Journal of Experimental Medicine
Published: 17 September 2001
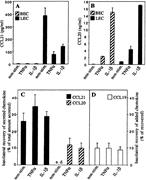
Figure 8 Chemokine secretion of isolated LECs and BECs. (A and B) LECs, but not BECs, secrete SLC/CCL21, but both EC types produce MIP-3α/CCL20 upon activation. EC subsets grown to confluence were exposed to EGF- and hydrocortisone-deficient medium (non-stim.) or to the same medium supplemented More about this image found in Chemokine secretion of isolated LECs and BECs. (A and B) LECs, but not BECs...
in Several Carcinoembryonic Antigens (CD66) Serve as Receptors for Gonococcal Opacity Proteins
> Journal of Experimental Medicine
Published: 05 May 1997
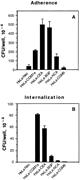
Figure 1 Adherence and internalization of pEXI by HeLa cells transfected with various CD66 antigens. All the cell lines were grown to confluence in 24well culture plates containing RPMI medium 1640 and were incubated with pEXI for 4.5 h. The adherent and intracellular E. coli were More about this image found in Adherence and internalization of pEXI by HeLa cells transfected with variou...
in FoxM1 regulates re-annealing of endothelial adherens junctions through transcriptional control of β-catenin expression
> Journal of Experimental Medicine
Published: 26 July 2010
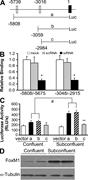
HMVEC-L. Cell lysates of HMVEC-L at 100% confluency and 50–70% confluency were used for Western blotting of FoxM1 expression. The experiment was performed three times with similar results. Figure 8. FoxM1 regulation of β-catenin transcription. (A) Schematic drawing of the 6-kb promoter region More about this image found in FoxM1 regulation of β-catenin transcription. (A) Schematic drawing of the ...
in The assembly of cancer-specific ribosomes by the lncRNA LISRR suppresses melanoma anti-tumor immunity
> Journal of Experimental Medicine
Published: 07 November 2025
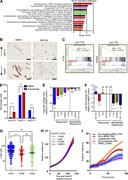
confluency (%) transfected with LISRR ASO, ASO control (Ctrl ASO), or not transfected (Mock) and cocultured with PBMCs stimulated with IL-2 only (n = 3). *P ≤ 0.05 and ** indicating P ≤ 0.01 were calculated by two-way ANOVA mixed effect. (D) Analysis of caspase-3 counts in MM099 More about this image found in Inhibition of LISRR enhances anti-melanoma immune response...
in HMCN1 variants aggravate epidermolysis bullosa simplex phenotype
> Journal of Experimental Medicine
Published: 20 February 2025
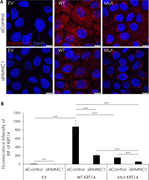
Figure 5. Hemicentin-1 deficiency effect on KIF organization. (A) HaCaT cells grown to 60% confluence on glass coverslips in 12 wells plates were downregulated for HMCN1 with a specific siRNA (siHMCN1) or with a control siRNA (siControl) and co-transfected with an empty vector (EV More about this image found in Hemicentin-1 deficiency effect on KIF organization. (A) HaCaT cells grown ...
1

