
Skip Nav Destination
Close Modal

1-20 of 81812
Follow your search
Access your saved searches in your account
Would you like to receive an alert when new items match your search?
1
Journal Articles
Journal:
Journal of Experimental Medicine
J Exp Med (2026) 223 (5): e20260323.
Published: 09 April 2026
Published: 09 April 2026
Matthew R. Hepworth and Richard K. Grencis. Matthew R Hepworth and Richard K Grencis pose for the camera. More about this image found in Matthew R. Hepworth and Richard K. Grencis. Matthew R Hepworth and Richa...
Published: 09 April 2026
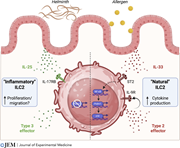
Blimp1 controls the phenotype and effector functions of ILC2 in response to alarmins. Alarmins such as IL-25 and IL-33 act to fine-tune ILC2 phenotype and function. IL-33 was found to induce the transcription factors Prdm1 (Blimp1) and Irf4 that in More about this image found in Blimp1 controls the phenotype and effector functions of ILC2 in response to...
Journal Articles
Journal:
Journal of Experimental Medicine
J Exp Med (2026) 223 (5): e20251793.
Published: 06 April 2026
Includes: Supplementary data
in Nasal CD4+ tissue-resident memory T cells provide cross-protective immunity to influenza
> Journal of Experimental Medicine
Published: 06 April 2026
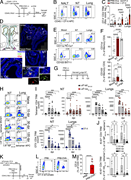
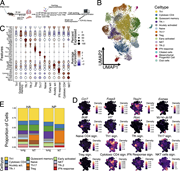
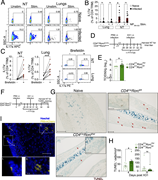
Figure 1. IAV-specific CD4 TRM are formed at the URT and are dependent on presence of cognate antigen. (A) Schematic diagram showing the procedure of transfer of OVA-specific (OT-II) CD4 T cells, infection of mice with PR8-OVA, and subsequent More about this image found in IAV-specific CD4 TRM are formed at the URT and are dependent on presence of...
in Nasal CD4+ tissue-resident memory T cells provide cross-protective immunity to influenza
> Journal of Experimental Medicine
Published: 06 April 2026
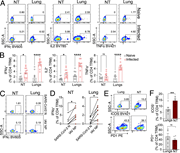
Figure 2. NT CD4 TRM express cytokines upon antigen stimulation. (A and B) Expression of intracellular cytokines in CD4 TRM of NT and lungs upon restimulation with IAV NP peptide pool. The organs are isolated on day 30 following PR8 IAV More about this image found in NT CD4 TRM express cytokines upon antigen stimulation. (A and B) Expressio...
in Nasal CD4+ tissue-resident memory T cells provide cross-protective immunity to influenza
> Journal of Experimental Medicine
Published: 06 April 2026
Figure 3. NT CD4 TRM provide protection against heterosubtypic challenge. (A–C) I-Ab NP306–322 tetramer and I-Ab HA91–107 tetramer-specific CD4 TRM in the NT and lungs of mice that were infected with X31 i.n. or left uninfected on day 30 More about this image found in NT CD4 TRM provide protection against heterosubtypic challenge. (A–C) I-A...
in Nasal CD4+ tissue-resident memory T cells provide cross-protective immunity to influenza
> Journal of Experimental Medicine
Published: 06 April 2026
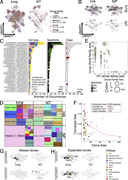
Figure 4. scRNA-seq of CD4 TRM reveals differential cluster distribution between organs. (A) Schematic diagram showing the preparation of sorted antigen-specific cells from mice infected with a sublethal dose (25 μl) of PR8 IAV i.n. for More about this image found in scRNA-seq of CD4 TRM reveals differential cluster distribution between org...
in Nasal CD4+ tissue-resident memory T cells provide cross-protective immunity to influenza
> Journal of Experimental Medicine
Published: 06 April 2026
Figure 5. scTCR-seq of CD4 TRM reveals clonal sharing between organs. (A) UMAP plot split by tissue (lung or NT) and colored according to clone size for CD4 TRM in IAV-infected mice. Clones were binned into single clones (1 member; light blue), More about this image found in scTCR-seq of CD4 TRM reveals clonal sharing between organs. (A) UMAP plot ...
in Nasal CD4+ tissue-resident memory T cells provide cross-protective immunity to influenza
> Journal of Experimental Medicine
Published: 06 April 2026
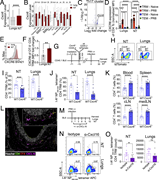
Figure 6. CXCR6–CXCL16 axis promotes NT CD4 TRM establishment. (A) Box plot showing the expression of Cxcr6 mRNA among CD4 TRM of the NT and lungs. Data are presented as median and interquartile range. NS, not significant; ****P < 0.0001; More about this image found in CXCR6–CXCL16 axis promotes NT CD4 TRM establishment. (A) Box plot showing ...
in Nasal CD4+ tissue-resident memory T cells provide cross-protective immunity to influenza
> Journal of Experimental Medicine
Published: 06 April 2026
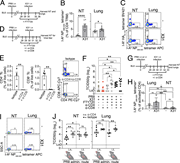
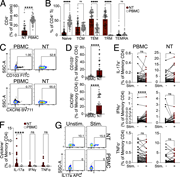
Figure 7. Functional IAV-specific CD4 TRM exist in the nasopharynx of healthy human subjects. (A) Bar plot with individual data points showing the frequency of CD4 Tc in the NT and PBMC. The experiment was performed seven times, and the results More about this image found in Functional IAV-specific CD4 TRM exist in the nasopharynx of healthy human s...
in Nasal CD4+ tissue-resident memory T cells provide cross-protective immunity to influenza
> Journal of Experimental Medicine
Published: 06 April 2026
Figure 8. NT harbors Th17 CD4 TRM that reduce local pathology. (A and B) Frequency of IL-17a+ cells among CD4 TRM of NT and lungs upon restimulation with IAV immunodominant NP306–322 peptide in comparison with unstimulated cells. The organs are More about this image found in NT harbors Th17 CD4 TRM that reduce local pathology. (A and B) Frequency o...
Journal Articles
Journal:
Journal of Experimental Medicine
J Exp Med (2026) 223 (5): e20251009.
Published: 02 April 2026
Includes: Supplementary data
in Targeting conserved domains of hypoxia-inducible factors for cancer therapy
> Journal of Experimental Medicine
Published: 02 April 2026
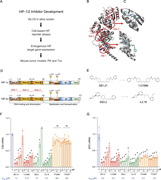
Figure 1. Discovery and optimization of dual HIFi . (A) Overview of the workflow is presented. (B) Crystal structure of HIF-2α–HIF-1β was analyzed using SILCS, which identified three potential ligand binding sites. (C) Models of site 1 and More about this image found in Discovery and optimization of dual HIFi . (A) Overview of the workflow i...
in Targeting conserved domains of hypoxia-inducible factors for cancer therapy
> Journal of Experimental Medicine
Published: 02 April 2026
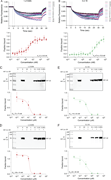
Figure 2. Biophysical and molecular target engagement of dual HIFi . (A and B) MST of fluorophore-tagged recombinant human HIF-1α following the addition of 1.21S9N (A) or 3.2.16 (B) was performed. Data are presented as relative fluorescence at More about this image found in Biophysical and molecular target engagement of dual HIFi . (A and B) MST...
in Targeting conserved domains of hypoxia-inducible factors for cancer therapy
> Journal of Experimental Medicine
Published: 02 April 2026
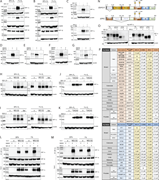
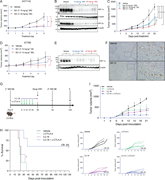
Figure 3. SS1.21 and SS3.2 trigger degradation of HIF-1α and HIF-2α to inhibit HIF target gene expression. (A and B) Hep3B cells were treated with 10-μM SS1.21 (A) or SS3.2 (B) at 20% or 1% O2 for 24 h, and immunoblot assays were performed. (C) More about this image found in SS1.21 and SS3.2 trigger degradation of HIF-1α and HIF-2α to inhibit HIF ta...
in Targeting conserved domains of hypoxia-inducible factors for cancer therapy
> Journal of Experimental Medicine
Published: 02 April 2026
Figure 4. SS1.21 and 3.2.16 inhibit colorectal cancer growth. (A) Nude mice bearing 150-mm3 HCT116 xenografts were treated with vehicle or SS1.21, and tumor growth was monitored (mean + SD, n = 5); *P < 0.05 by two-way ANOVA. (B) Tumors More about this image found in SS1.21 and 3.2.16 inhibit colorectal cancer growth. (A) Nude mice bearing ...
in Targeting conserved domains of hypoxia-inducible factors for cancer therapy
> Journal of Experimental Medicine
Published: 02 April 2026
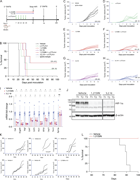
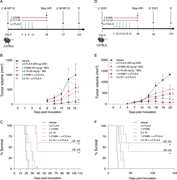
Figure 5. Effect of HIFi therapy in BrCa models. (A) EMT6 cells were injected into the MFP of Balb/c mice, which were treated by IP injection of: vehicle or IgG2a isotype control antibody (200 μg Q3D); α-CTLA-4 (200 μg Q3D); 1.21S9N or 3.2.16 More about this image found in Effect of HIFi therapy in BrCa models. (A) EMT6 cells were injected into t...
in Targeting conserved domains of hypoxia-inducible factors for cancer therapy
> Journal of Experimental Medicine
Published: 02 April 2026
Figure 6. Effect of HIFi therapy in melanoma and prostate cancer models. (A) C57BL/6 mice were injected subcutaneously with B16F10 melanoma cells and treated with vehicle, HIFi (1.21S9N or 3.2.16), α-CTLA-4, or HIFi + α-CTLA-4. (B) Mean tumor More about this image found in Effect of HIFi therapy in melanoma and prostate cancer models. (A) C57BL/6...
in Targeting conserved domains of hypoxia-inducible factors for cancer therapy
> Journal of Experimental Medicine
Published: 02 April 2026
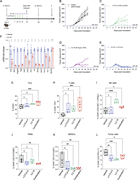
Figure 7. Effect of treatment with 3.2.16 in the E0771 BrCa model. (A) C57BL/6 mice received an injection of E0771 cells into the MFP and were treated with vehicle or IgG2a, α-CTLA-4, 3.2.16, or α-CTLA-4 + 3.2.16. (B–E) For each treatment More about this image found in Effect of treatment with 3.2.16 in the E0771 BrCa model. (A) C57BL/6 mice ...
1

