
Skip Nav Destination
Close Modal

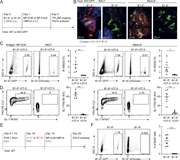


![LXR agonism enhances immune activation in tumor DLNs. (a–c) Phenotype of DLN-resident CD4+ and CD8+ T cells in E0771-cOC (a) or CT26-DR (c) tumor-bearing mice treated with RGX-104 (n = 8 and 7 per group, respectively, two-tailed t tests; representative of two independent experiments). Flow cytometry plots in b show representative samples gated for CD8+ T cells from a. (d–f) Proportion of all T cell subsets (d) and only cytotoxic T cells (e) out of all T cells in E0771-DR tumor DLNs as assessed by scRNAseq. (f) Comparison of the expression of select canonical effector genes in cytotoxic T cells in control versus RGX-104–treated mice (P values according to Mann–Whitney tests). (g–i) Activation status of APCs in the LNs draining E0771-cOC (g) and CT26 (h) tumors (n = 15 [g] and 7 [h] per group; two-tailed t tests, each representative of two independent experiments). (i) Representative plots from h showing expression of MHCII, CD40, and CD86 in CD103+ DCs. MHCII, MHC class II. *P < 0.05, **P < 0.01, ***P < 0.001, and ****P < 0.0001.](https://cdn.rupress.org/rup/content_public/journal/jem/223/4/10.1084_jem.20252290/1/s_jem_20252290_fig3.png?Expires=2147483647&Signature=nbVt~IztCKSDDsIwmPoJoMpNoNLTgdA6chmwfAvYFyhgf32hQurd3q8I0ndnfCT9eq-WTe0xIp0RkGIJXt7Yc7w1qeEVqDeVDgwCnAdlpYuLqVflGBljJTmbld0yi8XvpHn9U2yRVRU6sOqYQkjN3NVX80~85HyQdQmztMSZaKKG6MqjsHQiEePyG3KV3dUme5MMG10cQgKZnD0IJpmWj3TkkaArDeyh4YXj7xACJLAEbJGwNncpJ4ThEVzmk~qIe6FDJu0QG9fI3ssKTSAXHwjNNakWlHfv2~QWoLT2slnR7ps0lVFhpVXGK49Tq~lr5qp8ktHhjegCHVZiQJgtQA__&Key-Pair-Id=APKAIE5G5CRDK6RD3PGA)


1-20 of 81607
Follow your search
Access your saved searches in your account
Would you like to receive an alert when new items match your search?
1
Journal Articles
Journal:
Journal of Experimental Medicine
J Exp Med (2026) 223 (3): e20252289.
Published: 11 February 2026
in Follow the “DOTs”: Vδ1+ γδ T cells as effectors of cancer immunotherapy
> Journal of Experimental Medicine
Published: 11 February 2026
Figure 1. Phenotype and regulatory mechanisms of DOT cells. DOT cells are in vitro–expanded γδ T cells that mostly (>70%) express a Vδ1+ TCR, which controls their activation, proliferation, and differentiation during the 2–3-wk protocol ( More about this image found in Phenotype and regulatory mechanisms of DOT cells. DOT cells are in vitro–e...
Journal Articles
Journal:
Journal of Experimental Medicine
J Exp Med (2026) 223 (4): e20251901.
Published: 10 February 2026
Journal Articles
Journal:
Journal of Experimental Medicine
J Exp Med (2026) 223 (4): e20252290.
Published: 10 February 2026
Includes: Supplementary data
in Nasal germinal centers and IgA class-switch recombination depend on CCR6 and B cell receptor affinity
> Journal of Experimental Medicine
Published: 10 February 2026
Figure 1. B cells carrying low-affinity BCR are unable to seed GC in the NALT. (A) Schematic representation of the experimental setup shown in B–D. (B) AID-GFP mice were injected with Rosa26tdTomato/+ B1-8hi or B1-8lo B cells mixed with More about this image found in B cells carrying low-affinity BCR are unable to seed GC in the NALT. (A) S...
in Nasal germinal centers and IgA class-switch recombination depend on CCR6 and B cell receptor affinity
> Journal of Experimental Medicine
Published: 10 February 2026
Figure 2. Low-affinity B cell clones are unable to seed GCs in the NALT independent of competition. (A) MD4 mice were adoptively transferred with GFP+ B1-8hi or Rosa26tdTomato/+ B1-8lo B cells. NALT and MedLN were removed and imaged by TPLSM on More about this image found in Low-affinity B cell clones are unable to seed GCs in the NALT independent o...
in Nasal germinal centers and IgA class-switch recombination depend on CCR6 and B cell receptor affinity
> Journal of Experimental Medicine
Published: 10 February 2026
Figure 3. Formation of Tfh cells in the NALT depends on BCR affinity. (A–F) WT mice were injected with GFP+ B1-8hi or Rosa26tdTomato/+ B1-8lo B cells mixed with CD45.1+ OT-II T cells. Flow cytometry analysis of OT-II T cells was performed at day More about this image found in Formation of Tfh cells in the NALT depends on BCR affinity. (A–F) WT mice ...
in Nasal germinal centers and IgA class-switch recombination depend on CCR6 and B cell receptor affinity
> Journal of Experimental Medicine
Published: 10 February 2026
Figure 4. GC formation by high-affinity B cell clones depends on CCR6 expression. (A) WT mice were adoptively transferred with GFP+ B1-8hi B cells and CD45.1+ OT-II T cells. CCR6 expression on B1-8hi B cells was assessed by flow cytometry at the More about this image found in GC formation by high-affinity B cell clones depends on CCR6 expression. (A)...
in Nasal germinal centers and IgA class-switch recombination depend on CCR6 and B cell receptor affinity
> Journal of Experimental Medicine
Published: 10 February 2026
Figure 5. IgA class switching in the NALT depends on CCR6-mediated B cell positioning in the SED. (A) CX3CR1-GFP mice were adoptively transferred with Rosa26tdTomato/+ B1-8hi B cells and CD45.1+ OT-II T cells. NALTs were imaged on day 5 after More about this image found in IgA class switching in the NALT depends on CCR6-mediated B cell positioning...
in Nasal germinal centers and IgA class-switch recombination depend on CCR6 and B cell receptor affinity
> Journal of Experimental Medicine
Published: 10 February 2026
Figure 6. CCR6 is required for bacteria-driven IgA GC B cell formation in the NALT. (A) Quantification by flow cytometry of B cell isotypes in NALTs from SPF or GF mice under homeostasis. IgA+, IgG2b+, and IgG1+ populations were gated from Fas+ More about this image found in CCR6 is required for bacteria-driven IgA GC B cell formation in the NALT. (...
in Liver-X-receptor agonism enhances T cell priming and activation to promote anti-tumor immunity
> Journal of Experimental Medicine
Published: 10 February 2026
Figure 1. LXR agonism exhibits treatment efficacy in breast and colon cancer models with low G-MDSC infiltration. (a) Abundance of Ly6G+ G-MDSCs across different syngeneic tumor models (n = 7, 7, 6, 8, and 6 for LLC, B16F10, E0771, E0771-DR, and More about this image found in LXR agonism exhibits treatment efficacy in breast and colon cancer models w...
in Liver-X-receptor agonism enhances T cell priming and activation to promote anti-tumor immunity
> Journal of Experimental Medicine
Published: 10 February 2026
Figure 2. LXR agonism promotes adaptive anti-tumor immunity in breast and colon cancer models. (a and b) Tumor growth and survival of naive mice or mice that had cleared E0771-DR tumors under LXR-agonism upon contralateral primary tumor (a) or More about this image found in LXR agonism promotes adaptive anti-tumor immunity in breast and colon cance...
in Liver-X-receptor agonism enhances T cell priming and activation to promote anti-tumor immunity
> Journal of Experimental Medicine
Published: 10 February 2026
Figure 3. LXR agonism enhances immune activation in tumor DLNs. (a–c) Phenotype of DLN-resident CD4+ and CD8+ T cells in E0771-cOC (a) or CT26-DR (c) tumor-bearing mice treated with RGX-104 (n = 8 and 7 per group, respectively, two-tailed t More about this image found in LXR agonism enhances immune activation in tumor DLNs. (a–c) Phenotype of D...
in Liver-X-receptor agonism enhances T cell priming and activation to promote anti-tumor immunity
> Journal of Experimental Medicine
Published: 10 February 2026
Figure 4. LXR agonistic therapy critically depends on CD11c + DCs and host Lxr but not Apoe expression. (a) Schematic of strategy for in vivo depletion of APC subsets. (b) Growth of orthotopic E0771-DR tumors in the presence or absence of More about this image found in LXR agonistic therapy critically depends on CD11c + DCs and ho...
in Liver-X-receptor agonism enhances T cell priming and activation to promote anti-tumor immunity
> Journal of Experimental Medicine
Published: 10 February 2026
Figure 5. LXR agonism promotes T cell activation. (a) Schematic of experimental approach to assess the impact of pharmacologic LXR activation on T cell priming and activation in vitro. (b) Gene ontology pathway enrichment analysis in genes More about this image found in LXR agonism promotes T cell activation. (a) Schematic of experimental appr...
in Liver-X-receptor agonism enhances T cell priming and activation to promote anti-tumor immunity
> Journal of Experimental Medicine
Published: 10 February 2026
Figure 6. LXR agonism renders CD8 + T cells more receptive to adopting effector functions through LXR activation in CD8 + T cells. (a) Expression of IFN-γ and granzyme B in OT-I CD8+ T cells after co-culture with antigen-pulsed BMDCs as More about this image found in LXR agonism renders CD8 + T cells more receptive to adopting e...
in Liver-X-receptor agonism enhances T cell priming and activation to promote anti-tumor immunity
> Journal of Experimental Medicine
Published: 10 February 2026
Figure 7. Transcriptional and chromatin accessibility profiling of naive CD8 + T cells upon LXR activation. (a) Volcano plot showing differentially expressed genes in naive CD8+ T cells treated with the LXR agonist RGX-104 for 24 h as assessed More about this image found in Transcriptional and chromatin accessibility profiling of naive CD8 + ...
in Liver-X-receptor agonism enhances T cell priming and activation to promote anti-tumor immunity
> Journal of Experimental Medicine
Published: 10 February 2026
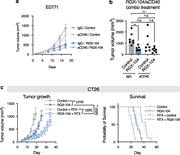
Figure 8. LXR agonism and radiotherapy act additively. (a) Tumor growth of mice injected with E0771 tumor cells and treated with RGX-104 and either IgG control or anti-CD40 antibody (n = 7 per group). (b) Tumor volumes of mice from a on day 17 More about this image found in LXR agonism and radiotherapy act additively. (a) Tumor growth of mice inje...
in Liver-X-receptor agonism enhances T cell priming and activation to promote anti-tumor immunity
> Journal of Experimental Medicine
Published: 10 February 2026
Figure 9. RGX-104 treatment is associated with clonal T cell expansion and enhanced TCR diversity in relapsed/refractory cancer patients. (a) Fraction of patients receiving given therapies. (b) Number of expanded TCR clones in the peripheral More about this image found in RGX-104 treatment is associated with clonal T cell expansion and enhanced T...
Journal Articles
Journal:
Journal of Experimental Medicine
J Exp Med (2026) 223 (4): e20250005.
Published: 06 February 2026
Includes: Supplementary data
1

