
Skip Nav Destination
Close Modal


1-20 of 72
Follow your search
Access your saved searches in your account
Would you like to receive an alert when new items match your search?
1
Journal Articles
In Special Collection:
Translational Immunology 2018
Journal:
Journal of Experimental Medicine
J Exp Med (2018) 215 (5): 1365–1382.
Published: 06 April 2018
Includes: Supplementary data
in Macrophage/microglial Ezh2 facilitates autoimmune inflammation through inhibition of Socs3
> Journal of Experimental Medicine
Published: 06 April 2018
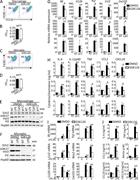
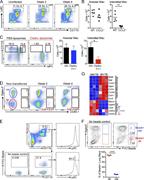
Figure 1. GSK126 suppresses MyD88-dependent proinflammatory responses in macrophages/microglia . (A–D) Flow cytometry of the surface CD11b and F4/80 expression and MTT analysis of primary cultured bone marrow–derived macrophages (A and B) or More about this image found in GSK126 suppresses MyD88-dependent proinflammatory responses in macrophages/...
in Macrophage/microglial Ezh2 facilitates autoimmune inflammation through inhibition of Socs3
> Journal of Experimental Medicine
Published: 06 April 2018
Figure 2. Ezh2 deficiency neither affects the development and maturation of myeloid cells nor influences the activation of peripheral lymphoid cells. (A) Genotyping PCR analysis of tail DNA from Ezh2f/f, Ezh2+/+, Ezh2f/+, and LysM-cre mice. (B) More about this image found in Ezh2 deficiency neither affects the development and matura...
in Macrophage/microglial Ezh2 facilitates autoimmune inflammation through inhibition of Socs3
> Journal of Experimental Medicine
Published: 06 April 2018
Figure 3. Ezh2 deficiency in myeloid cells suppresses DSS-induced colitis . (A) qRT-PCR analysis of Ezh2 mRNA in FACS-sorted CD11b+F4/80+macrophages from the colon and spleen of naive WT and Ezh2M−/− mice. (B) The body-weight loss of WT and More about this image found in Ezh2 deficiency in myeloid cells suppresses DSS-induced co...
in Macrophage/microglial Ezh2 facilitates autoimmune inflammation through inhibition of Socs3
> Journal of Experimental Medicine
Published: 06 April 2018
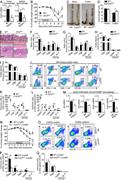
Figure 4. Microglia Ezh2 facilitates CNS autoimmune inflammation. (A) Mean clinical scores of age- and sex-matched WT and myeloid cell Ezh2-deficient (Ezh2M−/−) mice after the induction of EAE with MOG35–55 (n = 5 mice per group). (B) H&E More about this image found in Microglia Ezh2 facilitates CNS autoimmune inflammation. (A) Mean clinical ...
in Macrophage/microglial Ezh2 facilitates autoimmune inflammation through inhibition of Socs3
> Journal of Experimental Medicine
Published: 06 April 2018
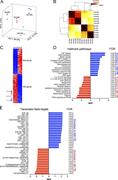
Figure 5. Ezh2 mediates MyD88-dependent inflammatory responses in macrophages/microglia. (A) GO term analysis of Ezh2 function in macrophages treated with LPS through DAVID informatics shows that the most significantly enriched biological More about this image found in Ezh2 mediates MyD88-dependent inflammatory responses in macrophages/microgl...
in Macrophage/microglial Ezh2 facilitates autoimmune inflammation through inhibition of Socs3
> Journal of Experimental Medicine
Published: 06 April 2018
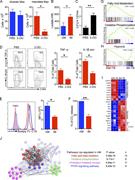
Figure 6. Ezh2 epigenetically controls Socs3 expression in macrophages/microglia. (A) qRT-PCR analysis of the indicated genes in WT and Ezh2-deficient macrophages that were pretreated with DMSO or cycloheximide (CHX) for 1 h and then left More about this image found in Ezh2 epigenetically controls Socs3 expression in macrophages/microglia. (A)...
in Macrophage/microglial Ezh2 facilitates autoimmune inflammation through inhibition of Socs3
> Journal of Experimental Medicine
Published: 06 April 2018
Figure 7. Ezh2 regulates TRAF6 degradation and its downstream signaling. (A and B) Analysis of TRAF6 Lys48-linked ubiquitination in WT and Ezh2-deficient macrophages (A) or in Ezh2-KO BV2 cell that infected with EV or lentiviral vector encoding More about this image found in Ezh2 regulates TRAF6 degradation and its downstream signaling. (A and B) A...
in Macrophage/microglial Ezh2 facilitates autoimmune inflammation through inhibition of Socs3
> Journal of Experimental Medicine
Published: 06 April 2018
Figure 8. Inhibition of Socs3 restores autoimmune inflammation in Ezh2-deficient mice. (A) qRT-PCR determining the relative expression of the indicated genes in WT and Ezh2-deficient macrophages that infected with retrovirus carrying control More about this image found in Inhibition of Socs3 restores autoimmune inflammation in Ezh2...
in Macrophage/microglial Ezh2 facilitates autoimmune inflammation through inhibition of Socs3
> Journal of Experimental Medicine
Published: 06 April 2018
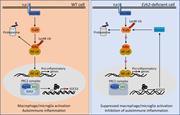
Figure 9. Model of Ezh2 in the regulation of macrophages/microglia activation and autoimmune inflammation. In WT macrophages/microglia, Ezh2, together with EED and Suz12 form PRC2 complex, which directly target Socs3 to promote the H3K27me3 and More about this image found in Model of Ezh2 in the regulation of macrophages/microglia activation and aut...
Journal Articles
Growth of Mycobacterium tuberculosis in vivo segregates with host macrophage metabolism and ontogeny
Journal:
Journal of Experimental Medicine
J Exp Med (2018) 215 (4): 1135–1152.
Published: 02 March 2018
Includes: Supplementary data
in Growth of Mycobacterium tuberculosis in vivo segregates with host macrophage metabolism and ontogeny
> Journal of Experimental Medicine
Published: 02 March 2018
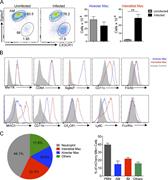
Figure 1. Mtb infection induces accumulation of interstitial macrophages. To characterize lung macrophage populations and determine the relative distribution of Mtb within the phagocyte subsets of the murine lung, tissue was harvested from WT More about this image found in Mtb infection induces accumulation of interstitial macrophages. To charact...
in Growth of Mycobacterium tuberculosis in vivo segregates with host macrophage metabolism and ontogeny
> Journal of Experimental Medicine
Published: 02 March 2018
Figure 2. Recruited monocytes give rise to lung interstitial macrophages in Mtb infection. Accumulation of IMs in infected lung tissue is impaired in CCL2−/− mice and in mice that have been treated with clodronate liposomes to deplete their More about this image found in Recruited monocytes give rise to lung interstitial macrophages in Mtb infec...
in Growth of Mycobacterium tuberculosis in vivo segregates with host macrophage metabolism and ontogeny
> Journal of Experimental Medicine
Published: 02 March 2018
Figure 3. Mtb induces local proliferation of lung macrophages. Lung cells isolated at indicated time points were probed with an antibody against the nuclear replication marker Ki67. Both uninfected bystander AMs and IMs exhibited an increased More about this image found in Mtb induces local proliferation of lung macrophages. Lung cells isolated a...
in Growth of Mycobacterium tuberculosis in vivo segregates with host macrophage metabolism and ontogeny
> Journal of Experimental Medicine
Published: 02 March 2018
Figure 4. Reporter Mtb strains reveal distinct fitness states of Mtb in lung phagocytes. The fitness and replication status of Mtb in the different host phagocyte subsets was determined using fluorescent Mtb reporter strains and Mtb carrying a More about this image found in Reporter Mtb strains reveal distinct fitness states of Mtb in lung phagocyt...
in Growth of Mycobacterium tuberculosis in vivo segregates with host macrophage metabolism and ontogeny
> Journal of Experimental Medicine
Published: 02 March 2018
Figure 5. Selective depletion of AMs and IMs results in a decrease or an increase in bacterial burden, respectively. Treatment of mice by clodronate liposomes delivered either i.n. or i.v. to deplete the AMs or circulating monocytes, More about this image found in Selective depletion of AMs and IMs results in a decrease or an increase in ...
in Growth of Mycobacterium tuberculosis in vivo segregates with host macrophage metabolism and ontogeny
> Journal of Experimental Medicine
Published: 02 March 2018
Figure 6. Transcriptional profiles of AMs and IMs during Mtb infection. RNA-sequencing analysis revealed distinct transcriptional profiles of AMs and IMs sorted from mice infected with mCherry-Mtb for 2 wk. AM+TB and IM+TB, cells with Mtb. AM-TB More about this image found in Transcriptional profiles of AMs and IMs during Mtb infection. RNA-sequenci...
in Growth of Mycobacterium tuberculosis in vivo segregates with host macrophage metabolism and ontogeny
> Journal of Experimental Medicine
Published: 02 March 2018
Figure 7. Metabolic states of lung macrophage subsets in Mtb infection. IMs are in a glycolytically active state, whereas AMs exhibit increased fatty acid uptake and β-oxidation of long chain fatty acids. Depletion of IMs through treatment with More about this image found in Metabolic states of lung macrophage subsets in Mtb infection. IMs are in a...
in Growth of Mycobacterium tuberculosis in vivo segregates with host macrophage metabolism and ontogeny
> Journal of Experimental Medicine
Published: 02 March 2018
Figure 8. Different metabolic pathways in macrophages regulate Mtb growth differentially in vitro. Inhibition of glycolysis by 2-DG promotes Mtb growth in BMDMs, whereas inhibition of fatty acid oxidation by ETO suppresses Mtb growth. (A) CFU More about this image found in Different metabolic pathways in macrophages regulate Mtb growth differentia...
in Growth of Mycobacterium tuberculosis in vivo segregates with host macrophage metabolism and ontogeny
> Journal of Experimental Medicine
Published: 02 March 2018
Figure 9. Models of macrophage reprogramming and preprogramming. (A and B) Schematic representation illustrating how macrophage function in the reprogramming model (A) is determined by immune signaling within the tissue niche. In the proposed More about this image found in Models of macrophage reprogramming and preprogramming. (A and B) Schematic...
1

