
Skip Nav Destination
Close Modal


1-20 of 87
Follow your search
Access your saved searches in your account
Would you like to receive an alert when new items match your search?
1
Journal Articles
In Special Collection:
B Cells: Mechanisms in Immunity and Autoimmunity
Journal:
Journal of Experimental Medicine
J Exp Med (2018) 215 (6): 1571–1588.
Published: 08 May 2018
Includes: Supplementary data
in Nucleoside-modified mRNA vaccines induce potent T follicular helper and germinal center B cell responses
> Journal of Experimental Medicine
Published: 08 May 2018
Figure 1. m1Ψ-mRNA-LNPs are translated at higher levels than naked m1Ψ-mRNAs or U-mRNA-LNPs in mice. (A) Representative IVIS image (4 h after injection) of BALB/c mice i.d. injected with 5.0 µg of naked (uncomplexed) or LNP-complexed Luc More about this image found in m1Ψ-mRNA-LNPs are translated at higher levels than naked m1Ψ-mRNAs or U-mRN...
in Nucleoside-modified mRNA vaccines induce potent T follicular helper and germinal center B cell responses
> Journal of Experimental Medicine
Published: 08 May 2018
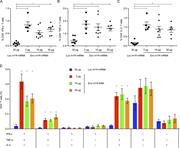
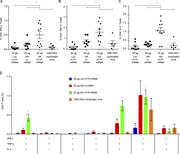
Figure 2. Two immunizations with HIV-1 Env m1Ψ-mRNA-LNPs elicit potent antigen-specific CD4+ T cell responses. Mice received i.d. immunizations of Luc or HIV Env m1Ψ-mRNA-LNPs at weeks 0 and 4. Splenocytes were stimulated with Env peptides 2 wk More about this image found in Two immunizations with HIV-1 Env m1Ψ-mRNA-LNPs elicit potent antigen-specif...
in Nucleoside-modified mRNA vaccines induce potent T follicular helper and germinal center B cell responses
> Journal of Experimental Medicine
Published: 08 May 2018
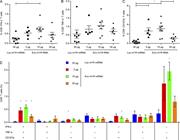
Figure 3. A single immunization with PR8 HA m1Ψ-mRNA-LNPs elicits strong antigen-specific CD4+ T cell responses. Mice received a single i.d. injection of 30 µg of m1Ψ-mRNA-LNPs or an i.m. immunization with 1,000 hemagglutinating units (HAU) of More about this image found in A single immunization with PR8 HA m1Ψ-mRNA-LNPs elicits strong antigen-spec...
in Nucleoside-modified mRNA vaccines induce potent T follicular helper and germinal center B cell responses
> Journal of Experimental Medicine
Published: 08 May 2018
Figure 4. Nucleoside-modified Env mRNA-LNPs elicit antigen-specific CD8+ T cell responses. Mice received two i.d. injections of Luc or Env m1Ψ-mRNA-LNPs. (A–C) Percentages of CD8+ T cells producing IFN-γ (A), TNF-α (B), and CD107a (C) were More about this image found in Nucleoside-modified Env mRNA-LNPs elicit antigen-specific CD8+ T...
in Nucleoside-modified mRNA vaccines induce potent T follicular helper and germinal center B cell responses
> Journal of Experimental Medicine
Published: 08 May 2018
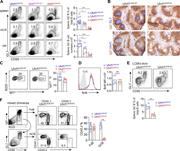
Figure 5. HA m1Ψ-mRNA-LNP immunization elicits strong antigen-specific B cell responses. Mice were immunized once with 30 µg of m1Ψ-mRNA-LNPs i.d. or 100 HAU of inactivated PR8 influenza virus i.m or infected with a sublethal dose (25 TCID50) of More about this image found in HA m1Ψ-mRNA-LNP immunization elicits strong antigen-specific B cell respons...
in Nucleoside-modified mRNA vaccines induce potent T follicular helper and germinal center B cell responses
> Journal of Experimental Medicine
Published: 08 May 2018
Figure 6. Potent Tfh cell responses are elicited by a single immunization with m1Ψ-mRNA-LNPs in mice. Mice were immunized once i.d. with 30 µg of Luc or HA m1Ψ-mRNA-LNPs, a single i.m. injection with 1,000 HAU of inactivated PR8 virus, More about this image found in Potent Tfh cell responses are elicited by a single immunization with m1Ψ-mR...
in Nucleoside-modified mRNA vaccines induce potent T follicular helper and germinal center B cell responses
> Journal of Experimental Medicine
Published: 08 May 2018
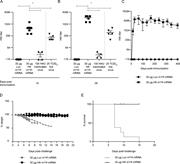
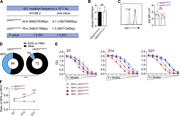
Figure 7. Potent Tfh cell and sustained neutralizing antibody responses are elicited by a single immunization with m1Ψ-mRNA-LNPs in nonhuman primates. (A and B) Rhesus macaques were immunized with 50 µg of CH505 Env m1Ψ-mRNA-LNPs or 100 µg of More about this image found in Potent Tfh cell and sustained neutralizing antibody responses are elicited ...
in Nucleoside-modified mRNA vaccines induce potent T follicular helper and germinal center B cell responses
> Journal of Experimental Medicine
Published: 08 May 2018
Figure 8. Nucleoside modification induces superior CD4+ T cell responses compared with unmodified mRNA. Mice received a single i.d. injection of 30 µg of Luc m1Ψ-mRNA-LNPs, HA U-mRNA-LNPs, HA m1Ψ-mRNA-LNPs or an i.m. immunization with 1,000 HAU More about this image found in Nucleoside modification induces superior CD4+ T cell responses c...
in Nucleoside-modified mRNA vaccines induce potent T follicular helper and germinal center B cell responses
> Journal of Experimental Medicine
Published: 08 May 2018
Figure 9. A single immunization with m1Ψ HA mRNA-LNPs induces more potent Tfh cell responses, higher splenic GC B and plasma cell numbers, and higher HAI titers compared with unmodified mRNA-LNPs. Mice were immunized with a single i.d. injection More about this image found in A single immunization with m1Ψ HA mRNA-LNPs induces more potent Tfh cell re...
in Nucleoside-modified mRNA vaccines induce potent T follicular helper and germinal center B cell responses
> Journal of Experimental Medicine
Published: 08 May 2018
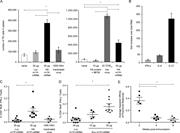
Figure 10. mRNA-LNPs provide potent adjuvant activity in a protein subunit vaccine. Mice were immunized with a single i.m. injection of 10 µg of recombinant PR8 HA protein alone or in combination with 30 µg of Luc U- or m1Ψ-mRNA-LNPs. (A and B) More about this image found in mRNA-LNPs provide potent adjuvant activity in a protein subunit vaccine. M...
Journal Articles
In Special Collection:
B Cells: Mechanisms in Immunity and Autoimmunity
Journal:
Journal of Experimental Medicine
J Exp Med (2018) 215 (5): 1437–1448.
Published: 04 April 2018
Includes: Supplementary data
in Uhrf1 regulates germinal center B cell expansion and affinity maturation to control viral infection
> Journal of Experimental Medicine
Published: 04 April 2018
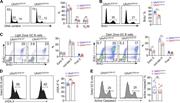
Figure 1. Uhrf1 is specifically expressed in GC B cells. (A) RT-qPCR analysis of Uhrf1 transcripts from FoBs and GC B cells. n = 3. Error bars show means ± SEM. ***, P < 0.001. (B) Western blot of Uhrf1 proteins in FoB and GC B cells. More about this image found in Uhrf1 is specifically expressed in GC B cells. (A) RT-qPCR analysis of Uhr...
in Uhrf1 regulates germinal center B cell expansion and affinity maturation to control viral infection
> Journal of Experimental Medicine
Published: 04 April 2018
Figure 2. c-Myc–AP4 directly up-regulates Uhrf1 expression in GC B cells. (A) Primary B cells were stimulated on the CD40L-expressing feeders. Dynamic induction of c-Myc, AP4, and Uhrf1 were assessed with Western blotting. (B) Uhrf1 expression More about this image found in c-Myc–AP4 directly up-regulates Uhrf1 expression in GC B cells. (A) Primar...
in Uhrf1 regulates germinal center B cell expansion and affinity maturation to control viral infection
> Journal of Experimental Medicine
Published: 04 April 2018
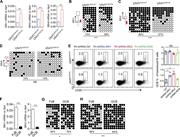
Figure 3. Uhrf1 is required for GC response. (A, B, and D) Mice of each genotype were immunized with SRBCs and analyzed at day 8. (A) Flow cytometric analysis of GC B cells (B220+CD95+GL7+) in spleen, mesenteric LN (mLN), and Peyer’s patches More about this image found in Uhrf1 is required for GC response. (A, B, and D) Mice of each genotype wer...
in Uhrf1 regulates germinal center B cell expansion and affinity maturation to control viral infection
> Journal of Experimental Medicine
Published: 04 April 2018
Figure 4. Uhrf1 loss impaired GC B cell proliferation without affecting cell survival. (A–E) Mice of each genotype were immunized with SRBCs and analyzed at days 7–10. (A) Cell cycle of GC B cells were analyzed by DNA content staining. n = 6. More about this image found in Uhrf1 loss impaired GC B cell proliferation without affecting cell survival...
in Uhrf1 regulates germinal center B cell expansion and affinity maturation to control viral infection
> Journal of Experimental Medicine
Published: 04 April 2018
Figure 5. Uhrf1 promotes GC B cell proliferation via Cdkn1a DNA methylation. (A) Dot blot analysis of total 5mC in genomic DNA extracted from GC B cells of each genotype. (B) Comparison of all differentially expressed genes (P < 0.05; fold More about this image found in Uhrf1 promotes GC B cell proliferation via Cdkn1a DNA meth...
in Uhrf1 regulates germinal center B cell expansion and affinity maturation to control viral infection
> Journal of Experimental Medicine
Published: 04 April 2018
Figure 6. Uhrf1 methylates Slfn1/2 gene locus to promote GC B cell proliferation. (A) RT-qPCR analysis of Slfn transcripts in GC B cells. n = 3. (B–D) Methylation analysis of Slfn1 (B), Slfn2 (C), and Slfn8 (D) were performed by bisulfite More about this image found in Uhrf1 methylates Slfn1/2 gene locus to promote GC B cell proliferation. (A)...
in Uhrf1 regulates germinal center B cell expansion and affinity maturation to control viral infection
> Journal of Experimental Medicine
Published: 04 April 2018
Figure 7. Uhrf1 loss compromised GC B cell SHM and affinity maturation. (A–F) Uhrf1GCB WT or Uhrf1GCB KO mice were immunized with NP-KLH and analyzed at time indicated. (A) Sorted GC B cells pooled from four mice of each genotype were used for More about this image found in Uhrf1 loss compromised GC B cell SHM and affinity maturation. (A–F) Uhrf1...
in Uhrf1 regulates germinal center B cell expansion and affinity maturation to control viral infection
> Journal of Experimental Medicine
Published: 04 April 2018
Figure 8. Uhrf1 in GC B cells is required for control of chronic LCMV infection. (A) GC B cell frequency and number in mice infected with LCMV cl13 were assessed by flow cytometry at day 40. n = 8. (B) Body weight before and after infection. More about this image found in Uhrf1 in GC B cells is required for control of chronic LCMV infection. (A) ...
1

