
Skip Nav Destination
Close Modal


![Characterization of IDsensitivity to 4-AP in MesV neurons. (A) Top: Timeline of experimental procedure in which recorded cells were exposed to increasing extracellular concentrations of 4-AP (0.03, 0.3, 3, 30, and 300 μM) every 10 min starting from the control condition (see Materials and methods). Middle: Representative membrane current recordings in response to a series of 50 ms voltage steps from 0 to 70 mV in steps of +5 mV, starting from a holding potential of −70 mV (bottom) control (first panel from left) and 4-AP (3 μM, second panel from left). To isolate the ID, current recordings in 4-AP were subtracted from those obtained in control conditions (third panel from left). (B) Plot of the maximum ID as a function of membrane voltage from the recordings shown in A. (C) Activation curve of the ID constructed from the data shown in B. Fits to a Boltzmann function (continuous trace) is superimposed on the experimental data (round symbols), and the vertical dashed line indicates the Vhalf value. (D) Representative recordings of the isolated ID obtained employing different concentrations of 4-AP in the same neuron. (E) Magnitude of the ID blocked as a function of the 4-AP concentration for the population of recorded neurons. Superimposed are the individual values (light blue circles) and the corresponding averages (dark blue circles; 0.3 μM: 1.67 ± 1.09 nA [SD], n = 9 cells, N = 5 mice; 3 μM: 4.93 ± 1.64 nA [SD], n = 9 cells, N = 5 mice; 30 μM: 8.88 ± 3.02 nA [SD], n = 13 cells, N = 6 mice; 60 μM: 11.75 ± 2.75 nA [SD], n = 6 cells, N = 3 mice; 100 μM: 9.35 ± 3.19 nA [SD], n = 7 cells, N = 3 mice; 300 μM: 10.34 ± 3.56 nA [SD], n = 7 cells, N = 3 mice). Also superimposed is the fit to a Hill equation. (F) Percentage of ID blockade as a function of 4-AP concentration obtained from data shown in E. Superimposed is the fit to a Hill equation (base: 12.42 ± 10.2%; max: 101.84 ± 11.3%; rate: 1.13 ± 0.83%; xhalf [IC50]: 4.45 ± 2.69 μM). Dashed vertical lines indicate the value of the IC50 (red) and the concentration used to evaluate the contribution of the ID to the excitability, coupling strength, and coincidence detection in the present study (black). (G) Vhalf values of the ID at each 4-AP concentration employed were determined as shown in C. Superimposed are the individual values (light blue circles) and the corresponding averages (dark blue circles; 0.3 μM: −26.05 ± 9.04 mV [SD], n = 9 cells, N = 5 mice; 3 μM: −32.24 ± 5.72 mV [SD], n = 9 cells, N = 5 mice; 30 μM: −33.24 ± 3.18 mV [SD], n = 13 cells, N = 6 mice; 60 μM: −32.06 ± 2.63 mV [SD], n = 6 cells, N = 3 mice; 100 μM: −31.72 ± 2.81 mV [SD], n = 7 cells, N = 3 mice; 300 μM: −30.33 ± 2.95 mV [SD], n = 7 cell, N = 3 mice; P = 0.0512, one-way ANOVA).](https://cdn.rupress.org/rup/content_public/journal/jgp/158/2/10.1085_jgp.202513883/1/s_jgp_202513883_fig1.png?Expires=2147483647&Signature=r0Qkn0KkgtYG8TllPRjz2rHaGPp-VlfXs8tsrLwQ2r48bHWxXR776rg1p3zuy0CEsuLMJKcwdD6ZGyCwb8raM~zdIvCiCcltbv96QMiEA2fKiDokh3p6NgSw5rfSJFTX2WspCd4i8UHTN4lwoYMXMXY9Q33Z7PDObU4dT8qChrplKZ7x6LHoxzeYiW4VAsejWiOR3lUya5UF7m0~d3qqbLPDDXK4-UiUCb6cId0kcADlHahLRZKwSVt9QQJsm0pdDvnKSoquS~keiUXElTDWjDpqMVnxGCZGCtE6f9pZYNtcb5vwrhe8uwORxzHnPTOTaYxWjnFOJhTkXV9l44zlzA__&Key-Pair-Id=APKAIE5G5CRDK6RD3PGA)
![IDcontributes to the passive and active electrophysiological properties of MesV neurons. (A) Superimposed membrane voltage responses (above) to depolarizing and hyperpolarizing current pulses (below, Im Cell) from a MesV neuron, in control (left), and after bath application of 10 μM 4-AP (right). Values at the left of membrane voltage traces denote RMP in this and subsequent figures. (B) Plot of the number of spikes evoked by current pulses of 200 ms in duration as a function of the injected current intensity for the same neuron as in A, before (black symbols) and after addition of 4-AP (blue symbols). Each data set was fitted to a linear function (superimposed) whose slope represents the neuron’s excitability (firing gain) in each condition. Coupled cells were pulsed independently (unloaded condition; see text). (C) Firing gain measured as shown in B, for the population of recorded MesV neurons in control (black symbols) and in the presence of 4-AP (10 μM; blue symbols) (control: 3.19 ± 4.67 spikes/nA [SD]; 4-AP: 10.50 ± 15.02 spikes/nA [SD]; n = 57 cells, N = 17 mice; P = 2.27 × 10⁻⁵, paired two-tailed t test). (D) RMP measured before (black symbols) and after (blue symbols) addition of 10 μM 4-AP (control: −53.12 ± 3.72 mV [SD]; 4-AP: −50.01 ± 3.13 mV [SD]; n = 45 cells, N = 11 mice; P = 3.85 × 10⁻⁹, paired two-tailed t test). (E) Rin before (black symbols) and after addition of 4-AP (10 μM; blue symbols) (control: 87.89 ± 21.79 MΩ [SD]; 4-AP: 108.4 ± 27.80 MΩ [SD]; n = 39 cells, N = 14 mice; P = 3.41 × 10⁻⁸, paired two-tailed t test). (F) Superimposed membrane voltage responses of a MesV neuron (above) to a hyperpolarizing current pulse (below, Im Cell), in control (black trace) and after addition of 10 μM 4-AP (blue trace). These responses were fitted to a single exponential function (orange traces) to estimate the membrane time constant (see Materials and methods). (G) Membrane time constant estimated as shown in F for the population of recorded MesV neurons before (black symbols) and after addition of 4-AP (blue symbols) (control: 8.79 ± 4.31 ms [SD], 4-AP: 10.63 ± 5.93 ms [SD]; n = 48 cells, N = 14 mice; P = 0.0159, paired two-tailed t test). Horizontal bars in C, D, E, and G represent population averages. *P < 0.05; ****P < 0.0001.](https://cdn.rupress.org/rup/content_public/journal/jgp/158/2/10.1085_jgp.202513883/1/s_jgp_202513883_fig2.png?Expires=2147483647&Signature=SqXBzZqNrGEceSzj8L1do5VQnPerE~szLP5ddu30nOI3OzUMCRPndrfHR3ZGh8msCkmvhC5JRECHyYF~BCQhkTDpDNDckYRCvPpt7rHqRbvTBj7PmsBb4yJ8KzJ4D2~kcZzgxZX3p6PTepxJTREfsvuLx0Ujew3Nm0vJsLOMbglATQEpQnWW6Zx216rtFG~Ry~BK2qahuKTgNTs8~xme7aJYPtN~4B0JC0u2CJTF-praP4YJVfmVOHvTncmoP2cqvupuJE2inCFhYQp7HpYpLiz0WhjggFEyflYk5TXgqHTWC4KJodTshgZNKA~PzgRxbrQu1Ku9bZq558AZklP8ag__&Key-Pair-Id=APKAIE5G5CRDK6RD3PGA)
![Contribution of the proximal axon membrane to the somatic electrophysiological properties of MesV neurons. (A) Representative images of two MesV neurons intracellularly labeled with Alexa Fluor 488 via the recording pipette, shown alongside their corresponding phase plots. The neuron on the left lacks a kink, indicative of AIS absence, whereas the neuron on the right displays a kink (oblique arrow), indicative of AIS presence. The image on the right is the same as that shown in Fig. 4 D. (B) Plot of kink incidence in phase plot of recorded neurons (grey symbols; presence = 1, absence = 0), as function of the axonal length measured in MesV neurons intracellularly labeled with Alexa Fluor 488 via the recording pipette. Continuous purple line represents the calculated probability from single cells, binned every 20 μm (n = 70 cells, N = 18 mice). The dashed red line denotes the minimal proximal axon length required to support a fully functional AIS. (C) Firing level as a function of axon length for the population of recorded neurons (n = 66 cells, N = 18 mice), determined from experiments like those shown in A. The plot displays values from neurons with an AIS (purple symbols) and without an AIS (grey symbols), according to the presence or absence of a kink in their phase plots. (D) Firing level values of neurons with AIS and without AIS from the same data displayed in C (No AIS: −32.14 ± 4.51 mV [SD], n = 20 cells, N = 13 mice; AIS: −38.29 ± 2.54 mV [SD], n = 46 cells, N = 17 mice; P = 1.35 × 10⁻⁹, unpaired two-tailed t test). (E) Rin as a function of axon length for the population of recorded neurons (n = 66 cells, N = 18 mice). (F) Rin values of neurons with AIS and without AIS from the same data displayed in E (No AIS: 146.0 ± 42.52 MΩ [SD], n = 20 cells, N = 13 mice; AIS: 104.9 ± 30.70 MΩ [SD], n = 46 cells, N = 17 mice; P = 5.28 × 10⁻⁵, unpaired two-tailed t test). (G) RMP as a function of axon length for the population of recorded neurons (n = 66 cells, N = 18 mice). (H) RMP values of neurons with AIS and without AIS from the same data displayed in G (No AIS: −50.13 ± 1.96 mV [SD], n = 20 cells, N = 13 mice; AIS: −51.40 ± 2.60 mV [SD], n = 46 cells, N = 17 mice; P = 0.0555, unpaired two-tailed t test). Horizontal bars in D, F, and H represent population averages. ****P < 0.0001.](https://cdn.rupress.org/rup/content_public/journal/jgp/158/2/10.1085_jgp.202513883/1/s_jgp_202513883_fig3.png?Expires=2147483647&Signature=S3wGVhFT4Rw6BC6KzACEroCScFVVFTYamisgYWhp~S8c-U3AltC-8Kk-4HbE1B13UiTlHRaUPTjDs9m0sNcht5Wa91C3rDgcq77Rfj7089B~gRYZjOKSW0dhh6F2ZR0YnY3SEfgV00djGFmF-0C14uM-Q1jo3MK3Sl5p6Atc-qIfCeyPx0g1nIKMe05KwRqdNLQrjXRR7WO5J7QfYDa3X6HCFyIdxWT~y5pTgORrqJkmbFfqVcBoqTd6qUrXNSFRO7mXTl66LmI3sooNxgMs5UZNkGpFjGZfmyeJ7pF4YtkRAyVRFwKwIcjB6q6BGsirnu-~FAFFrNv837IqpCuDAA__&Key-Pair-Id=APKAIE5G5CRDK6RD3PGA)
![IDof the proximal axon significantly contributes to the somatic excitability of MesV neurons. (A) Firing gain in control and after the application of 10 μM 4-AP for the population of neurons without AIS, defined by the phase plot profile. (control: 1.41 ± 0.65 spikes/nA [SD]; 4-AP: 2.25 ± 0.39 spikes/nA [SD]; n = 17 cells, N = 11 mice; P = 2 × 10⁻⁶, paired two-tailed t test). (B) Firing gain in control and after the application of 4-AP (10 μM) for the population of neurons with AIS, defined by the phase plot profile. (control: 4.72 ± 5.36 spikes/nA [SD]; 4-AP: 18.01 ± 17.90 spikes/nA [SD]; n = 18 cells, N = 7 mice; P = 0.0017, paired two-tailed t test). (C) From data shown in A and B, summary plot of the magnitude of change in the firing gain (ΔFiring gain) before and after 4-AP application for the population of recorded MesV neurons segregated according to absence (black symbols) or presence (purple symbols) of the AIS (No AIS: 0.84 ± 0.46 spikes/nA [SD], n = 17 cells, N = 11 mice; AIS: 13.29 ± 15.11 spikes/nA [SD], n = 18 cells, N = 7 mice; P = 0.0028, unpaired two-tailed t test with Welch’s correction). (D) Picture of a MesV neuron intracellularly labeled with Alexa Fluor 488 via the recording pipette (same image as that shown in Fig. 3 A, right), where the locations of the puffing pipettes filled with 4-AP (100 μM) are schematically represented at the axonal, somatic, and anti-axonal positions. Scale bar: 25 μm. (E) Superimposed membrane voltage responses before (black traces) and during 4-AP local applications (blue traces) at the anti-axon (first panel from top), soma (second panel from top), and axon (third panel from top) to a just suprathreshold depolarizing current pulse of 200 ms in duration (fourth panel from top, Im Cell). (F) Average plot of spike count per current pulse as a function of time for soma (n = 22 cells, N = 9 mice), axon (n = 17 cells, N = 8 mice), and anti-axon (n = 15 cells, N = 7 mice) 4-AP puffing locations from results like those depicted in E. Timing of 4-AP (100 μM) application is indicated by the horizontal bar in the upper part of the plot. (G) Plot of the maximum spike count per current pulse for each tested neuron during 4-AP (100 μM) puffing applications soma: 9.36 ± 6.25 spikes [SD], n = 22 cells, N = 9 mice; axon: 16.35 ± 8.72 spikes [SD], n = 17 cells, N = 8 mice; anti-axon: 2.93 ± 3.75 spikes [SD], n = 15 cells, N = 7 mice; P = 3.063 × 10⁻⁶, one-way ANOVA, adjusted by Bonferroni test for multiple comparisons; axon vs. soma: P = 0.006, unpaired two-tailed t test; axon vs. anti-axon: P = 7.92 × 10⁻⁶, unpaired two-tailed t test with Welch’s correction). (H) Average plot of spike count per current pulse as a function of time for soma (n = 11 cells) and axon (n = 7 cells) α-DTX puffing locations. Timing of α-DTX (2 μM) application is indicated by the horizontal bar in the upper part of the plot. (I) Plot of the maximum spike count per current pulse for each tested neuron during α-DTX (2 μM) puff applications (Soma: 6.73 ± 4.92 spikes [SD], n = 11 cells, N = 5 mice; Axon: 13.29 ± 7.20 spikes [SD], n = 7 cells, N = 3 mice; P = 0.035, unpaired, two-tailed t test). Shaded area in F and H represents SD. Horizontal bars in A, B, C, G, and I represent population averages. *P < 0.05; **P < 0.01; ****P < 0.0001.](https://cdn.rupress.org/rup/content_public/journal/jgp/158/2/10.1085_jgp.202513883/1/s_jgp_202513883_fig4.png?Expires=2147483647&Signature=HQxB~gR30patRezdbvwYfvWShQitnd9~cebXmUN5t-jkfwfcicywJsJobuIzI--0ejELOPzj97h~dIK5TUV33JLKbe63JFniuKuskuKTSkHcjo3OcxQWH5Ki6ZglwmNOFodGd5YhaZAQoONIpx5iJJvowCgrVQVZp3Ui~tS7WRfROOkWjw7Km7RQb9iLoAXSR3uohoJh4uiizrk~DgAveVz8ehNf2OoS5SiyRE0gYaT8xadLyNA0E47MnpXT13EFe5-kS82ZoLR6uzr5HEwCsf7heBeVNsdy~7l9hr02odutWq0pCcLPMZ2Tx5T6s7ujtVF4p8SsT-xGYxzLuXqoIg__&Key-Pair-Id=APKAIE5G5CRDK6RD3PGA)
![Electrotonic coupling between the soma and the proximal axon. (A) Simultaneous voltage-clamp recordings from the soma and proximal axon of the same MesV neuron. Hyperpolarizing voltage steps were applied either to the axon (Vm axon, left) or to the soma (Vm soma, right), while the membrane potential of the other compartment was held constant. This protocol evoked inward membrane currents in the stepped compartment and corresponding outward currents in the non-stepped compartment (Im Axon and Im Soma). The scheme above traces indicates the experiment configuration. (B) Plot of the membrane current in the non-stepped compartment (Im non-stepped compart.) as a function of the voltage difference between compartments (ΔV between compart.), obtained from the recordings shown in A. Each dataset was fitted with a linear function, and the slope values, representing intercompartment conductance, are indicated (G axon-to-soma and G soma-to-axon). (C and D) Intercompartment conductance (C) and corresponding CC values (D) determined for each tested neuron in each direction. Data of conductance (C) and CC (D) in the axon-to-soma direction were fitted by a function of the form G=offset+glength, whereas data of CC in the soma-to-axon direction (D) were fitted by a linear function. (E) CC values in both directions for the population of recorded neurons (CCsoma-to-axon: 0.70 ± 0.29 [SD]; CCaxon-to-soma: 0.48 ± 0.26 [SD]; n = 10 cells, N = 7 animals; P = 0.01084, paired two-tailed t test). Horizontal bars in E represent population averages. *P < 0.05.](https://cdn.rupress.org/rup/content_public/journal/jgp/158/2/10.1085_jgp.202513883/1/s_jgp_202513883_fig5.png?Expires=2147483647&Signature=VWR-epvHsn8JDZEMAXU4DWFljGjEQwtVvn3xxC4mj7zwbIaQzc5cTtJhPkJ2nEUIqOnxtRf83o0XZXByBStQu2E8UJNoCbmInnFRNEWbMcFqCNRa-d-Z0qhHSs3wcFN38BZc67SVv-Vychg~Tx4QxTYF89WwVb23KgYgsOQQAxHNufdcg9vghFKnH9NMkksMHgwxvkjjUioCV8s2e9F7MyxwUP3RU~BQfbxgdpHneyBtVoEwX799EfevcUdFZbzCMN3dtsklLMI~PEMKk3BxWy1rntx0toneAGSvFE0Dmyr-oz~fs9YYgaA-gYp1D4Jmu1lMX~TrG7GJGGUiEJFyOg__&Key-Pair-Id=APKAIE5G5CRDK6RD3PGA)
![IDdetermines the strength and temporal characteristics of electrical synaptic transmission between MesV neurons. (A) Paired recordings from a pair of electrically coupled MesV neurons in response to a hyperpolarizing current pulse (Im Cell 1) showing the membrane voltage response in the injected (Vm Cell 1) and coupled (Vm Cell 2) neurons, in control (black traces) and in the presence of 4-AP (10 μM) (blue traces). The scheme above traces indicates the experiment configuration. (B) From recordings like those depicted in A, in which a series of hyperpolarizing current pulses of increasing intensity were injected in one neuron, the CC was estimated by plotting the amplitude of membrane voltage changes (measured at the peak of hyperpolarizing responses, vertical dashed lines in A) in the postsynaptic cell (ΔVm Cell 2) as a function of membrane voltage changes in the presynaptic cell (ΔVm Cell 1), in control (black symbols) and in the presence of 4-AP (blue symbols). Each data set was fitted with a linear function whose slope values representing the CC are indicated. (C) Plot of CC values measured in control (black symbols) and after the addition of 10 μM 4-AP (blue symbols) for the population of assessed directions (control: 0.27 ± 0.17 [SD]; 4-AP: 0.31 ± 0.17 [SD]; n = 45 cells, N = 14 mice; P = 0.0089, paired, two-tailed t test). (D) Spike transmission, showing the presynaptic spike (above, Vm Cell 1) elicited by a short depolarizing current pulse and the corresponding coupling potential in the postsynaptic neuron (below, Vm Cell 2), in control (black traces) and after 4-AP (blue traces) application. Arrows denote presynaptic spike to postsynaptic spikelet transmission delay. (E) CCspike for the population of assessed directions, calculated from recordings like those depicted in D in control and after 10 μM 4-AP (control: 0.055 ± 0.023 [SD]; 4-AP: 0.074 ± 0.026 [SD]; n = 16 directions, N = 7 mice; P = 0.0001, paired, two-tailed t test). (F) Spike-to-spikelet delay transmission measured as depicted in D, in control and after 4-AP (10 μM) (control: 0.43 ± 0.13 ms [SD]; 4-AP: 0.96 ± 0.45 ms [SD]; n = 16 directions, N = 7 mice; P = 0.00002, paired, two-tailed t test). (G) Voltage clamp recording from a pair of electrically coupled MesV neurons during the application of a hyperpolarizing step-like voltage command in one cell (Vm Cell 1) while the membrane potential of the other cell was held constant (Vm Cell 2), showing the membrane current response elicited in the non-stepped neuron (above, Im Cell 2), corresponding to the Ij in control (black trace) and in the presence of 4-AP (30 μM) (blue trace). (H) From recordings like those depicted in G, in which a series of hyperpolarizing voltage commands of increasing magnitude were applied in one neuron, the junctional conductance (Gj) was estimated by plotting the amplitude of the postsynaptic membrane current as a function of the membrane voltage difference between cells (transjunctional voltage), in control (black symbols) and in the presence of 4-AP (blue symbols). Each data set was fitted with a linear function, and the slope values representing the Gj are indicated. (I) Gj values for the population of assessed directions in control and after 4-AP (30 μM) (control: 2.68 ± 1.16 nS [SD]; 4-AP: 2.68 ± 1.22 nS [SD]; n = 14 directions from 7 pairs, N = 3 mice; P = 0.9500, paired, two-tailed t test). Horizontal bars in C, E, F and I represent population averages. **P < 0.01; ***P < 0.001; ****P < 0.0001.](https://cdn.rupress.org/rup/content_public/journal/jgp/158/2/10.1085_jgp.202513883/1/s_jgp_202513883_fig6.png?Expires=2147483647&Signature=4aPEgHtKy4DzqxBGCdkjLnlEFG5wny550wy-W4ldYco30ExaolMTWx1j4a27Sq-UI2mZjDyl2FAzC4aZNO4wcusokcWosNvg~Sh9Kso9Zc7pg8gIrMSbO6kLStRRZ8UkbxFPqkAuObzMfR2WYv18KA81aXhpO4mT2zb5m0zSPkkp~T5uY7s3AiS7GMvgxGT5rlV9sxwD8Gzqx~Y1LOrWEbvie~XfcVR3KF630rX8L2wJIHP8OAWEQ44FEuEoHbDJSFiIHoz2lVfKRox72g22FL~k3ELUAVSjitRnBk3W6QVXWm5yrMzev6RYqY9z4zAG4EIbv9e19yc0M3Qhkernxw__&Key-Pair-Id=APKAIE5G5CRDK6RD3PGA)
![IDof MesV neurons contributes to set the gain of coincidence detection. (A) Membrane voltage responses of a pair of coupled MesV neurons (Vm Cell 1 and Vm Cell 2) to a current pulse delivered only to cell 1 (left) and to both cells at the same time (Im Cell 1 and Im Cell 2) (right). The schemes above each set of traces indicate the experiment configuration. (B) Minimum intensity for spike activation of a 200 ms current pulse (rheobase) when independently (Indep.) or simultaneously (Simult.) applied from recordings like those shown in A (independent: 362.5 ± 146.2 pA [SD]; simultaneous: 328.6 ± 133.4 pA [SD]; n = 56 cells, 28 pairs, N = 16 mice; P = 3.43 × 10⁻⁷, paired two-tailed t test). (C) For the same pair of MesV neurons depicted in A, membrane voltage responses to the same stimulating protocol applied in the presence of 4-AP (10 μM). (D) CD index, defined as the difference in spike count when stimuli were delivered simultaneously versus individually in control and after the addition of 4-AP (control: 0.52 ± 0.60 spikes [SD]; 4-AP: 1.18 ± 1.96 spikes [SD]; n = 55 cells, 28 pairs, N = 16 mice; P = 0.0182, paired two-tailed t test). (E) Superimposed membrane voltage responses of a MesV neuron (Vm Cell 2) from an electrically coupled pair to 10 consecutive just-suprathreshold current pulses simultaneously delivered to both coupled cells (Im Cell 1 and Im Cell 2) at 0.5 Hz, in control (left) and after the application of 10 μM 4-AP (right). (F and G) From recordings such as those shown in (E), spike latency (F) and spike jitter (G) were quantified across the recorded neuronal population. Spike latency was defined as the time from current pulse onset to the spike peak (horizontal double arrows in E) (control: 3.97 ± 0.90 ms [SD]; 4-AP: 6.11 ± 1.05 ms [SD]; n = 19 cells, 10 pairs, N = 5 mice; P = 1.00 × 10⁻⁷, paired two-tailed t test), and spike jitter as the corresponding SD (control: 0.11 ± 0.06 ms [SD]; 4-AP: 0.26 ± 0.16 ms [SD]; n = 19 cells, 10 pairs, N = 5 mice; P = 0.0004, paired two-tailed t test). Horizontal bars in B, D, F, and G represent population averages. *P < 0.05; ***P < 0.001; ****P < 0.0001.](https://cdn.rupress.org/rup/content_public/journal/jgp/158/2/10.1085_jgp.202513883/1/s_jgp_202513883_fig7.png?Expires=2147483647&Signature=XUiaCsrFTWnr7ylEA7nSJrrQYk7Sjwk0WYBU-RUUSQ9OvgO1Kmo1hvGC2wbDPhk5f0qeljNszQ15x5FH4oXnDM8d9r5DmVP0wxKwm4oIztzqcgouj7WAbN6VKB5wQp8hsz0R8u674OaTwxTK2c~yMa~WKDuKj4yk8FLfMXk-YfxxsB2TexMFAQpAYpDROlbLA1FQzNPMZPmea~l1GmVLY-bg7EN5SKBPlYarOqYtj9j35tWcoIqsoLZ~pFcCWkBspWo4k3PCgKUM-IBVAjbgyhnHnWZ06Ae1jEIPhCOTfktSFmHqp5F~sYZB77~YZEYw5AqT7QsvQkyP55QS3fHyFg__&Key-Pair-Id=APKAIE5G5CRDK6RD3PGA)
![IDof MesV neurons contributes to set the precision of coincidence detection. (A) Superimposed membrane voltage responses of a pair of coupled MesV neurons (Vm Cell 1 and Vm Cell 2) to a stimulation protocol consisting of near-threshold, short-duration (3 ms) current pulses delivered to each neuron (Im Cell 1 and Im Cell 2). The timing of the current pulses in one neuron (Cell 2, in this example) was kept constant, while in the other neuron (Cell 1) it was systematically varied in 0.5 ms increments. (B) For the pair of coupled MesV neurons shown in A, spike counts from both neurons were summed and plotted as a function of inter-stimuli delay in control (black symbols) and in the presence of 10 μM 4-AP (blue symbols). Both data sets were fit with a Gaussian function (continuous traces). (C) FWHM determined from Gaussian fits as shown in B for the population of recorded MesV neurons in control (black symbols) and in the presence of 4-AP (10 μM; blue symbols) (control: 4.53 ± 2.55 ms [SD]; 4-AP: 9.58 ± 3.02 ms [SD]; n = 12 coupled pairs, N = 8 mice; P = 2.69 × 10⁻⁵, paired two-tailed t test). (D) Average plot of spike counts from both neurons (coupled-pair output) as a function of inter-stimuli delay for the population of recorded MesV neurons coupled pairs in control (black symbols) and in the presence of 10 μM 4-AP (blue symbols). Shaded area represents SD. Superimposed are Gaussian fits to the data. Double arrows indicate the FWHM of each fit, with values of 4.01 ms for control (black) and 10.25 ms for 4-AP (blue). Gaussian fit parameters in control: y0 = 0.05 ± 0.008 spikes [SD], amplitude = 1.5 ± 0.04 spikes [SD], ×0 = 0.12 ± 0.05 ms [SD], width = 2.41 ± 0.07 ms [SD], FWHM = 4.01 ± 0.12 ms [SD]; in 4-AP: y0 = 0.085 ± 0.017 spikes [SD], amplitude = 1.27 ± 0.0425 spikes [SD], ×0 = 1.03 ± 0.16 ms [SD], width = 6.15 ± 0.26 ms [SD], FWHM = 10.25 ± 0.43 ms [SD]; n = 12 coupled pairs, N = 8 mice; paired representation; paired distribution comparison: P = 8.8 × 10⁻³⁵, Kolmogorov–Smirnov test). The shaded area in D represents SD, and the horizontal bars in C represent population averages. ***P < 0.001.](https://cdn.rupress.org/rup/content_public/journal/jgp/158/2/10.1085_jgp.202513883/1/s_jgp_202513883_fig8.png?Expires=2147483647&Signature=cPgbeshWv8JRejjZn30R-DDn5VLmmsVTExw6GjaLUKiEqjKroMYheO0d6mbf9lSCyAtwK1gTi9MWsazcsulhs2rStrp~i2yRAlJ6CevwrrZvydTIux~36LHx45e3kFLvfdrWN3-HLrFeUAM9XwbU6yXnl5Bin7bUc3zjNPdXzPDypsZUHBjLNT0XfW4eSuOncGsKYFEDBDvmtrAxztAKWvdALkBH4~vf8pb3hO7vViuqHJ2feV6Z1L6JkRuce6GJwwYKJWKvWE6FyfTpZznc67wmCZgtml-nklE2VKjbAxB22qGMop2qbhZK~N5LdzEIGuGIFqhq7~yCAaCM17-Fkw__&Key-Pair-Id=APKAIE5G5CRDK6RD3PGA)
1-20 of 31754
Follow your search
Access your saved searches in your account
Would you like to receive an alert when new items match your search?
1
Journal Articles
Journal:
Journal of General Physiology
J Gen Physiol (2026) 158 (2): e202513873.
Published: 06 February 2026
Includes: Supplementary data
in AMPK-mediated HCN4 channel phosphorylation contributes to age-related intrinsic bradycardia
> Journal of General Physiology
Published: 06 February 2026
Figure 1. AMPK activation inhibits I f in female and male mouse pacemaker cells. (A–D) Whole-cell recordings of If in 3-mo-old female (A and B) and 3-mo-old male (C and D) mouse SAN cells in control (black) and after 4-h treatment with AMPK More about this image found in AMPK activation inhibits I f in female and male mouse pacemake...
in AMPK-mediated HCN4 channel phosphorylation contributes to age-related intrinsic bradycardia
> Journal of General Physiology
Published: 06 February 2026
Figure 2. AMPK activation reduces membrane expression of HCN4 channels in HEK293 cells. Whole-cell recordings from HEK293T cells transfected with hHCN4 in control (black) and after 4-h treatment with the AMPK activator AICAR (1 mM) (red). (A) More about this image found in AMPK activation reduces membrane expression of HCN4 channels in HEK293 cell...
in AMPK-mediated HCN4 channel phosphorylation contributes to age-related intrinsic bradycardia
> Journal of General Physiology
Published: 06 February 2026
Figure 3. Removal of AMPK activation abolishes its action. (A and B) Top: Representative traces of current density recorded from HEK293F cells. Data were obtained from day-matched cells in control conditions or after treatment. (A) Bottom: More about this image found in Removal of AMPK activation abolishes its action. (A and B) Top: Representa...
in AMPK-mediated HCN4 channel phosphorylation contributes to age-related intrinsic bradycardia
> Journal of General Physiology
Published: 06 February 2026
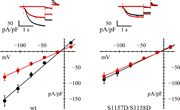
Figure 4. Involvement of hHCN4 serine 1157 in AMPK-mediated channel modulation. (A and B) In A and B, upper panels are typical current records, and lower panels are fully activated I/V relations, normalized to cell capacitance, from HEK293F More about this image found in Involvement of hHCN4 serine 1157 in AMPK-mediated channel modulation. (A an...
in AMPK-mediated HCN4 channel phosphorylation contributes to age-related intrinsic bradycardia
> Journal of General Physiology
Published: 06 February 2026
Figure 5. hHCN4 serine 1158 alone does not directly contribute to AMPK-mediated channel modulation. (A and B) In A and B, upper panels are typical current records, and lower panels are fully activated I/V relations, normalized to cell More about this image found in hHCN4 serine 1158 alone does not directly contribute to AMPK-mediated chann...
in AMPK-mediated HCN4 channel phosphorylation contributes to age-related intrinsic bradycardia
> Journal of General Physiology
Published: 06 February 2026
Figure 6. Loss of AMPK action on double mutant S1157D/S1158D. Representative current records (top) and fully activated I/V relations (bottom) normalized to cell capacitance, from HEK293F cells in control conditions (black) and after AICAR More about this image found in Loss of AMPK action on double mutant S1157D/S1158D. Representative current...
in AMPK-mediated HCN4 channel phosphorylation contributes to age-related intrinsic bradycardia
> Journal of General Physiology
Published: 06 February 2026
Figure 7. Age dependence of AMPK action of I f in pacemaker cells. (A–D) Whole-cell recordings of If in 3-mo-old (young) (A and B) and 24-mo-old (old) (C and D) mouse SAN cells in control (black) and after 4-h treatment with AMPK activator More about this image found in Age dependence of AMPK action of I f in pacemaker cells. (A–D...
in AMPK-mediated HCN4 channel phosphorylation contributes to age-related intrinsic bradycardia
> Journal of General Physiology
Published: 06 February 2026
Figure 8. AMPK is constitutively activated in old, but not in young, mice. (A–D) Whole-cell recordings of If in 3-mo-old (young) (A and B) and 24-mo-old (old) (C and D) mouse SAN cells in control (black) and after 4-h treatment with AMPK More about this image found in AMPK is constitutively activated in old, but not in young, mice. (A–D) Wh...
Journal Articles
Journal:
Journal of General Physiology
Series: Ion Channels in Health and Disease
J Gen Physiol (2026) 158 (2): e202513883.
Published: 30 January 2026
Includes: Supplementary data
in Coincidence detection supported by electrical synapses is shaped by the D-type K+ current
> Journal of General Physiology
Published: 30 January 2026
Figure 1. Characterization of I D sensitivity to 4-AP in MesV neurons. (A) Top: Timeline of experimental procedure in which recorded cells were exposed to increasing extracellular concentrations of 4-AP (0.03, 0.3, 3, 30, and 300 μM) every 10 More about this image found in Characterization of I D sensitivity to 4-AP in MesV neurons. (...
in Coincidence detection supported by electrical synapses is shaped by the D-type K+ current
> Journal of General Physiology
Published: 30 January 2026
Figure 2. I D contributes to the passive and active electrophysiological properties of MesV neurons. (A) Superimposed membrane voltage responses (above) to depolarizing and hyperpolarizing current pulses (below, Im Cell) from a MesV neuron, in More about this image found in I D contributes to the passive and active electrophysiological...
in Coincidence detection supported by electrical synapses is shaped by the D-type K+ current
> Journal of General Physiology
Published: 30 January 2026
Figure 3. Contribution of the proximal axon membrane to the somatic electrophysiological properties of MesV neurons. (A) Representative images of two MesV neurons intracellularly labeled with Alexa Fluor 488 via the recording pipette, shown More about this image found in Contribution of the proximal axon membrane to the somatic electrophysiologi...
in Coincidence detection supported by electrical synapses is shaped by the D-type K+ current
> Journal of General Physiology
Published: 30 January 2026
Figure 4. I D of the proximal axon significantly contributes to the somatic excitability of MesV neurons. (A) Firing gain in control and after the application of 10 μM 4-AP for the population of neurons without AIS, defined by the phase plot More about this image found in I D of the proximal axon significantly contributes to the soma...
in Coincidence detection supported by electrical synapses is shaped by the D-type K+ current
> Journal of General Physiology
Published: 30 January 2026
Figure 5. Electrotonic coupling between the soma and the proximal axon. (A) Simultaneous voltage-clamp recordings from the soma and proximal axon of the same MesV neuron. Hyperpolarizing voltage steps were applied either to the axon (Vm axon, More about this image found in Electrotonic coupling between the soma and the proximal axon. (A) Simultan...
in Coincidence detection supported by electrical synapses is shaped by the D-type K+ current
> Journal of General Physiology
Published: 30 January 2026
Figure 6. I D determines the strength and temporal characteristics of electrical synaptic transmission between MesV neurons. (A) Paired recordings from a pair of electrically coupled MesV neurons in response to a hyperpolarizing current pulse More about this image found in I D determines the strength and temporal characteristics of el...
in Coincidence detection supported by electrical synapses is shaped by the D-type K+ current
> Journal of General Physiology
Published: 30 January 2026
Figure 7. I D of MesV neurons contributes to set the gain of coincidence detection. (A) Membrane voltage responses of a pair of coupled MesV neurons (Vm Cell 1 and Vm Cell 2) to a current pulse delivered only to cell 1 (left) and to both cells More about this image found in I D of MesV neurons contributes to set the gain of coincidence...
in Coincidence detection supported by electrical synapses is shaped by the D-type K+ current
> Journal of General Physiology
Published: 30 January 2026
Figure 8. I D of MesV neurons contributes to set the precision of coincidence detection. (A) Superimposed membrane voltage responses of a pair of coupled MesV neurons (Vm Cell 1 and Vm Cell 2) to a stimulation protocol consisting of More about this image found in I D of MesV neurons contributes to set the precision of coinci...
Journal Articles
Journal:
Journal of General Physiology
Series: Contractile Function
J Gen Physiol (2026) 158 (2): e202513773.
Published: 28 January 2026
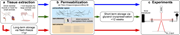
in A primer on the methods of skeletal and cardiac muscle mechanics using permeabilized preparations
> Journal of General Physiology
Published: 28 January 2026
Figure 1. Muscle fiber permeabilization pipelines. (a) Skeletal or cardiac muscles are initially excised along with connective tissues into samples of up to 1 cm thickness and can be stored at −20°C/−80°C for extended periods or immediately More about this image found in Muscle fiber permeabilization pipelines. (a) Skeletal or cardiac muscles a...
1

