
Skip Nav Destination
Close Modal
![CaV4 Ba2+current facilitation as a function of voltage and time. (A) Left: The voltage protocol was similar to that shown in Fig. 1 but with the strong conditioning pulse of variable amplitude from −10 to +80 mV (in red) in 10 mV increments. Exemplar Ba2+ current traces recorded during this protocol are displayed. Right: Ba2+ current facilitation (I2/I1) was then plotted as a function of the conditioning pulse amplitude. (B) Left: The voltage protocol was similar to that shown in Fig. 1 but with the strong conditioning pulse of variable duration from 10 to 90 ms in 10-ms increments. Exemplar Ba2+ current traces are shown on the bottom. Right: Ba2+ current facilitation, (I2/I1), plotted as a function of the conditioning pulse duration from 10 to 100 ms (in red). In this case, I2/I1 values were normalized to the I2/I1 value with a pP duration of 10 ms (n[I2/I1]). (C) Left: The voltage protocol was similar to that shown in Fig. 1 but with an interpulse between the strong pre-depolarization (at +80 mV) and P2 of variable duration from 4 to 50 ms in 5-ms increments. Exemplar Ba2+ current traces are shown on the bottom. Right: Current facilitation (I2/I1) as a function of the interpulse duration from 4 to 50 ms (in red).](https://cdn.rupress.org/rup/content_public/journal/jgp/158/2/10.1085_jgp.202413712/1/s_jgp_202413712_fig3.png?Expires=2147483647&Signature=2JYNaCvqTY4Ja97FII7xH2sAb1~o7yn-qHIfTL8GHwJV-PlGF6w9-9HmthZcYThEDQDCDsheJWkTIMxw48YVy0~2oWHlsisNuIalYVgMG8iit-MAovDFlWq~P30fv3LOuBdzDlZNguQm2OCTTQee8r9bOW98Rr5bsbcroLxw1IKOzkKLibMqf2h2PYrFxreWox7m46FJKPXRPMq7KFhDpndR64wJc796o~jkOsfrrGIwK3niKF1kmGAYyP~vxS1YxKYQXp88wn5i0byKvrxJXjm8nwBRtbD2j~4Cgf6q9sdcMwj05kW5SxREqz3j3BTlp-yY-3JqcrPTMX0vId9AjA__&Key-Pair-Id=APKAIE5G5CRDK6RD3PGA)


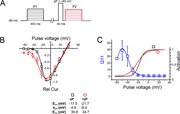
![Characterization of IDsensitivity to 4-AP in MesV neurons. (A) Top: Timeline of experimental procedure in which recorded cells were exposed to increasing extracellular concentrations of 4-AP (0.03, 0.3, 3, 30, and 300 μM) every 10 min starting from the control condition (see Materials and methods). Middle: Representative membrane current recordings in response to a series of 50 ms voltage steps from 0 to 70 mV in steps of +5 mV, starting from a holding potential of −70 mV (bottom) control (first panel from left) and 4-AP (3 μM, second panel from left). To isolate the ID, current recordings in 4-AP were subtracted from those obtained in control conditions (third panel from left). (B) Plot of the maximum ID as a function of membrane voltage from the recordings shown in A. (C) Activation curve of the ID constructed from the data shown in B. Fits to a Boltzmann function (continuous trace) is superimposed on the experimental data (round symbols), and the vertical dashed line indicates the Vhalf value. (D) Representative recordings of the isolated ID obtained employing different concentrations of 4-AP in the same neuron. (E) Magnitude of the ID blocked as a function of the 4-AP concentration for the population of recorded neurons. Superimposed are the individual values (light blue circles) and the corresponding averages (dark blue circles; 0.3 μM: 1.67 ± 1.09 nA [SD], n = 9 cells, N = 5 mice; 3 μM: 4.93 ± 1.64 nA [SD], n = 9 cells, N = 5 mice; 30 μM: 8.88 ± 3.02 nA [SD], n = 13 cells, N = 6 mice; 60 μM: 11.75 ± 2.75 nA [SD], n = 6 cells, N = 3 mice; 100 μM: 9.35 ± 3.19 nA [SD], n = 7 cells, N = 3 mice; 300 μM: 10.34 ± 3.56 nA [SD], n = 7 cells, N = 3 mice). Also superimposed is the fit to a Hill equation. (F) Percentage of ID blockade as a function of 4-AP concentration obtained from data shown in E. Superimposed is the fit to a Hill equation (base: 12.42 ± 10.2%; max: 101.84 ± 11.3%; rate: 1.13 ± 0.83%; xhalf [IC50]: 4.45 ± 2.69 μM). Dashed vertical lines indicate the value of the IC50 (red) and the concentration used to evaluate the contribution of the ID to the excitability, coupling strength, and coincidence detection in the present study (black). (G) Vhalf values of the ID at each 4-AP concentration employed were determined as shown in C. Superimposed are the individual values (light blue circles) and the corresponding averages (dark blue circles; 0.3 μM: −26.05 ± 9.04 mV [SD], n = 9 cells, N = 5 mice; 3 μM: −32.24 ± 5.72 mV [SD], n = 9 cells, N = 5 mice; 30 μM: −33.24 ± 3.18 mV [SD], n = 13 cells, N = 6 mice; 60 μM: −32.06 ± 2.63 mV [SD], n = 6 cells, N = 3 mice; 100 μM: −31.72 ± 2.81 mV [SD], n = 7 cells, N = 3 mice; 300 μM: −30.33 ± 2.95 mV [SD], n = 7 cell, N = 3 mice; P = 0.0512, one-way ANOVA).](https://cdn.rupress.org/rup/content_public/journal/jgp/158/2/10.1085_jgp.202513883/1/s_jgp_202513883_fig1.png?Expires=2147483647&Signature=r0Qkn0KkgtYG8TllPRjz2rHaGPp-VlfXs8tsrLwQ2r48bHWxXR776rg1p3zuy0CEsuLMJKcwdD6ZGyCwb8raM~zdIvCiCcltbv96QMiEA2fKiDokh3p6NgSw5rfSJFTX2WspCd4i8UHTN4lwoYMXMXY9Q33Z7PDObU4dT8qChrplKZ7x6LHoxzeYiW4VAsejWiOR3lUya5UF7m0~d3qqbLPDDXK4-UiUCb6cId0kcADlHahLRZKwSVt9QQJsm0pdDvnKSoquS~keiUXElTDWjDpqMVnxGCZGCtE6f9pZYNtcb5vwrhe8uwORxzHnPTOTaYxWjnFOJhTkXV9l44zlzA__&Key-Pair-Id=APKAIE5G5CRDK6RD3PGA)
1-20 of 31763
Follow your search
Access your saved searches in your account
Would you like to receive an alert when new items match your search?
1
Journal Articles
Journal:
Journal of General Physiology
J Gen Physiol (2026) 158 (2): e202613970.
Published: 11 February 2026
Journal Articles
Journal:
Journal of General Physiology
J Gen Physiol (2026) 158 (2): e202413712.
Published: 10 February 2026
in Prepulse facilitation of the honeybee CaV4 channel is produced by a shift in channel activation and requires an intact inactivation sequence
> Journal of General Physiology
Published: 10 February 2026
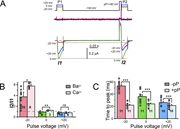
Figure 1. Ca V 4 voltage-dependent facilitation. (A) Ba2+ current traces showing the effect of a positive conditioning pP on the current recorded at voltage pulses of different amplitudes. The potentials for the control (P1) and the test More about this image found in Ca V 4 voltage-dependent facilitation. (A) Ba2+ cu...
in Prepulse facilitation of the honeybee CaV4 channel is produced by a shift in channel activation and requires an intact inactivation sequence
> Journal of General Physiology
Published: 10 February 2026
Figure 2. Influence of pP on the I–V curve parameters. (A) Schematic of the protocol used to extract the I–V curve parameters. 400-ms-long voltage steps from −80 to +40 mV were given before (in black, P1) or 4 ms after (in red, P2) a pP to +80 More about this image found in Influence of pP on the I–V curve parameters. (A) Schematic of the protocol...
in Prepulse facilitation of the honeybee CaV4 channel is produced by a shift in channel activation and requires an intact inactivation sequence
> Journal of General Physiology
Published: 10 February 2026
Figure 3. Ca V 4 Ba 2+ current facilitation as a function of voltage and time. (A) Left: The voltage protocol was similar to that shown in Fig. 1 but with the strong conditioning pulse of variable amplitude from −10 to +80 mV (in red) in More about this image found in Ca V 4 Ba 2+ current facilitation as a function o...
in Prepulse facilitation of the honeybee CaV4 channel is produced by a shift in channel activation and requires an intact inactivation sequence
> Journal of General Physiology
Published: 10 February 2026
Figure 4. Influence of an IFM-homologous sequence on the Ca V 4 Ba 2+ current facilitation. (A) Schematic of a CaV4 mutant in which the MFLT sequence, which is homologous to the IFMT sequence found in the loop between domains III and IV of More about this image found in Influence of an IFM-homologous sequence on the Ca V 4 Ba ...
in Prepulse facilitation of the honeybee CaV4 channel is produced by a shift in channel activation and requires an intact inactivation sequence
> Journal of General Physiology
Published: 10 February 2026
Figure 5. Ba 2+ current facilitation as a function of voltage and time for the Ca V 4(6) mutant. (A–C) Voltage-dependent (A) and time-dependent (B and C) regulation of facilitation (see Fig. 3, A–C , for the description of these protocols) More about this image found in Ba 2+ current facilitation as a function of voltage and time f...
in Prepulse facilitation of the honeybee CaV4 channel is produced by a shift in channel activation and requires an intact inactivation sequence
> Journal of General Physiology
Published: 10 February 2026
Figure 6. Current facilitation does not modify the single-channel conductance. (A and B) In cell-attached patches, using a 100 mM Ba2+ pipet solution, single-channel CaV4 Ba2+ current traces were recorded during 100 depolarizations from −100 mV More about this image found in Current facilitation does not modify the single-channel conductance. (A and...
in Prepulse facilitation of the honeybee CaV4 channel is produced by a shift in channel activation and requires an intact inactivation sequence
> Journal of General Physiology
Published: 10 February 2026
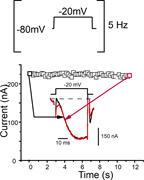
Figure 7. Absence of frequency-dependent facilitation for Ca V 4. Top: The oocytes were stimulated at a frequency of 5 Hz with −20 mV depolarizations. Bottom: Graph illustrating the changes in the current’s amplitude recorded over a 12-min More about this image found in Absence of frequency-dependent facilitation for Ca V 4. Top: ...
Journal Articles
Journal:
Journal of General Physiology
J Gen Physiol (2026) 158 (2): e202513873.
Published: 06 February 2026
Includes: Supplementary data
in AMPK-mediated HCN4 channel phosphorylation contributes to age-related intrinsic bradycardia
> Journal of General Physiology
Published: 06 February 2026
Figure 1. AMPK activation inhibits I f in female and male mouse pacemaker cells. (A–D) Whole-cell recordings of If in 3-mo-old female (A and B) and 3-mo-old male (C and D) mouse SAN cells in control (black) and after 4-h treatment with AMPK More about this image found in AMPK activation inhibits I f in female and male mouse pacemake...
in AMPK-mediated HCN4 channel phosphorylation contributes to age-related intrinsic bradycardia
> Journal of General Physiology
Published: 06 February 2026
Figure 2. AMPK activation reduces membrane expression of HCN4 channels in HEK293 cells. Whole-cell recordings from HEK293T cells transfected with hHCN4 in control (black) and after 4-h treatment with the AMPK activator AICAR (1 mM) (red). (A) More about this image found in AMPK activation reduces membrane expression of HCN4 channels in HEK293 cell...
in AMPK-mediated HCN4 channel phosphorylation contributes to age-related intrinsic bradycardia
> Journal of General Physiology
Published: 06 February 2026
Figure 3. Removal of AMPK activation abolishes its action. (A and B) Top: Representative traces of current density recorded from HEK293F cells. Data were obtained from day-matched cells in control conditions or after treatment. (A) Bottom: More about this image found in Removal of AMPK activation abolishes its action. (A and B) Top: Representa...
in AMPK-mediated HCN4 channel phosphorylation contributes to age-related intrinsic bradycardia
> Journal of General Physiology
Published: 06 February 2026
Figure 4. Involvement of hHCN4 serine 1157 in AMPK-mediated channel modulation. (A and B) In A and B, upper panels are typical current records, and lower panels are fully activated I/V relations, normalized to cell capacitance, from HEK293F More about this image found in Involvement of hHCN4 serine 1157 in AMPK-mediated channel modulation. (A an...
in AMPK-mediated HCN4 channel phosphorylation contributes to age-related intrinsic bradycardia
> Journal of General Physiology
Published: 06 February 2026
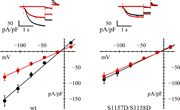
Figure 5. hHCN4 serine 1158 alone does not directly contribute to AMPK-mediated channel modulation. (A and B) In A and B, upper panels are typical current records, and lower panels are fully activated I/V relations, normalized to cell More about this image found in hHCN4 serine 1158 alone does not directly contribute to AMPK-mediated chann...
in AMPK-mediated HCN4 channel phosphorylation contributes to age-related intrinsic bradycardia
> Journal of General Physiology
Published: 06 February 2026
Figure 6. Loss of AMPK action on double mutant S1157D/S1158D. Representative current records (top) and fully activated I/V relations (bottom) normalized to cell capacitance, from HEK293F cells in control conditions (black) and after AICAR More about this image found in Loss of AMPK action on double mutant S1157D/S1158D. Representative current...
in AMPK-mediated HCN4 channel phosphorylation contributes to age-related intrinsic bradycardia
> Journal of General Physiology
Published: 06 February 2026
Figure 7. Age dependence of AMPK action of I f in pacemaker cells. (A–D) Whole-cell recordings of If in 3-mo-old (young) (A and B) and 24-mo-old (old) (C and D) mouse SAN cells in control (black) and after 4-h treatment with AMPK activator More about this image found in Age dependence of AMPK action of I f in pacemaker cells. (A–D...
in AMPK-mediated HCN4 channel phosphorylation contributes to age-related intrinsic bradycardia
> Journal of General Physiology
Published: 06 February 2026
Figure 8. AMPK is constitutively activated in old, but not in young, mice. (A–D) Whole-cell recordings of If in 3-mo-old (young) (A and B) and 24-mo-old (old) (C and D) mouse SAN cells in control (black) and after 4-h treatment with AMPK More about this image found in AMPK is constitutively activated in old, but not in young, mice. (A–D) Wh...
Journal Articles
Journal:
Journal of General Physiology
Series: Ion Channels in Health and Disease
J Gen Physiol (2026) 158 (2): e202513883.
Published: 30 January 2026
Includes: Supplementary data
in Coincidence detection supported by electrical synapses is shaped by the D-type K+ current
> Journal of General Physiology
Published: 30 January 2026
Figure 1. Characterization of I D sensitivity to 4-AP in MesV neurons. (A) Top: Timeline of experimental procedure in which recorded cells were exposed to increasing extracellular concentrations of 4-AP (0.03, 0.3, 3, 30, and 300 μM) every 10 More about this image found in Characterization of I D sensitivity to 4-AP in MesV neurons. (...
1

