
Skip Nav Destination
Close Modal


1-20 of 85
Follow your search
Access your saved searches in your account
Would you like to receive an alert when new items match your search?
1
Journal Articles
In Special Collection:
Mechanisms of Membrane Transport
Journal:
Journal of General Physiology
J Gen Physiol (2019) 151 (3): 381–394.
Published: 06 February 2019
Includes: Supplementary data
in Interpretation of spectroscopic data using molecular simulations for the secondary active transporter BetP
> Journal of General Physiology
Published: 06 February 2019
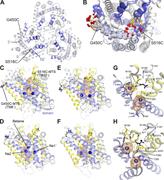
Figure 1. Structure of BetP and spin-label locations. (A and B) The structure of BetP shown as cartoon helices, highlighting TM helices 1′, 5′, 6′, and 8′ lining the substrate pathway (blue) and helices 3′, 4′, 8′, and 9′ in the hash domain More about this image found in Structure of BetP and spin-label locations. (A and B) The structure of Bet...
in Interpretation of spectroscopic data using molecular simulations for the secondary active transporter BetP
> Journal of General Physiology
Published: 06 February 2019
Figure 2. Measurements for BetP in E. coli polar lipid proteoliposomes with spin labels introduced at positions 450 and 516. (A) Uptake of betaine in nanomolar per milligram protein was measured at 0.6 osmol/kg as a function of time for WT and More about this image found in Measurements for BetP in E. coli polar lipid proteoliposom...
in Interpretation of spectroscopic data using molecular simulations for the secondary active transporter BetP
> Journal of General Physiology
Published: 06 February 2019
Figure 3. Convergence of simulated to experimental distance distributions. The probability of a distance P(r) is plotted versus distance (r). The PELDOR-based distances (black lines), measured in the presence of 500 mM NaCl (A) or 300 mM NaCl More about this image found in Convergence of simulated to experimental distance distributions. The proba...
in Interpretation of spectroscopic data using molecular simulations for the secondary active transporter BetP
> Journal of General Physiology
Published: 06 February 2019
Figure 4. The EBMetaD bias does not change the overall conformation of the protein. (A–D) Structural similarity (in RMSD) of each simulated ensemble with respect to the two extreme conformations of BetP. EBMetaD simulation trajectories initiated More about this image found in The EBMetaD bias does not change the overall conformation of the protein. (...
in Interpretation of spectroscopic data using molecular simulations for the secondary active transporter BetP
> Journal of General Physiology
Published: 06 February 2019
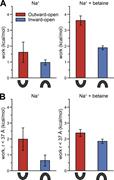
Figure 5. Work required by each simulation system to reproduce the experimental distance distribution. The work was computed by averaging the bias potential applied over the last 0.8 µs of each simulation of G450R5/S516R5. Simulations were More about this image found in Work required by each simulation system to reproduce the experimental dista...
in Interpretation of spectroscopic data using molecular simulations for the secondary active transporter BetP
> Journal of General Physiology
Published: 06 February 2019
Figure 6. Work required by each D470-protonated simulation system to reproduce the experimental distance distribution. The work was computed by averaging the bias potential applied over the last 0.8 µs of each simulation of G450R5/S516R5 with More about this image found in Work required by each D470-protonated simulation system to reproduce the ex...
in Interpretation of spectroscopic data using molecular simulations for the secondary active transporter BetP
> Journal of General Physiology
Published: 06 February 2019
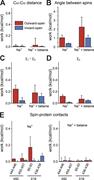
Figure 7. Breakdown of contributions to the work for each molecular simulation system. Work computed with the Kullback-Leibler divergence between the biased and debiased trajectories (see Materials and methods) for the distance between the Cα More about this image found in Breakdown of contributions to the work for each molecular simulation system...
in Interpretation of spectroscopic data using molecular simulations for the secondary active transporter BetP
> Journal of General Physiology
Published: 06 February 2019
Figure 8. Analysis of backbone distances and spin-label orientations . Distributions of Cα–Cα atom distances (A–D) and spin-label side chain orientations calculated for the biased trajectories (dashed lines) and after de-biasing those same More about this image found in Analysis of backbone distances and spin-label orientations . Distributions ...
Journal Articles
In Special Collection:
Mechanisms of Membrane Transport
Journal:
Journal of General Physiology
J Gen Physiol (2019) 151 (3): 316–327.
Published: 06 February 2019
Includes: Multimedia, Supplementary data
in A multiscale model of mechanotransduction by the ankyrin chains of the NOMPC channel
> Journal of General Physiology
Published: 06 February 2019
Figure 1. Structural features and mechanical abstraction of the NOMPC ion channel. (A) The NOMPC structure ( Jin et al., 2017 ). The channel is a homotetramer with the N-terminal domain starting at AR 1 in contact with an MT (blue and gray More about this image found in Structural features and mechanical abstraction of the NOMPC ion channel. (A...
in A multiscale model of mechanotransduction by the ankyrin chains of the NOMPC channel
> Journal of General Physiology
Published: 06 February 2019
Figure 2. Normal modes of the NOMPC channel. (A) Side view of the lowest-order NMA performed on the entire NOMPC channel. The starting structure is represented as a white tube, and the cyan and black tube representations of a single AR chain More about this image found in Normal modes of the NOMPC channel. (A) Side view of the lowest-order NMA p...
in A multiscale model of mechanotransduction by the ankyrin chains of the NOMPC channel
> Journal of General Physiology
Published: 06 February 2019
Figure 3. Mechanical properties of the AR chains extracted from equilibrium MD simulations. (A) Structure of ANK1 highlighting the six ARs and the second (cyan) and fifth (red) repeats used to calculate the COM-to-COM distance from AR2 to AR5 (d More about this image found in Mechanical properties of the AR chains extracted from equilibrium MD simula...
in A multiscale model of mechanotransduction by the ankyrin chains of the NOMPC channel
> Journal of General Physiology
Published: 06 February 2019
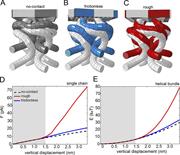
Figure 4. Shape, force, and energy of helical bundle deformation computed from the finite element model. (A–C) Starting (gray) and final representation (dark gray, blue, and red) of NOMPC for the no-contact (A), frictionless (B), and rough More about this image found in Shape, force, and energy of helical bundle deformation computed from the fi...
in A multiscale model of mechanotransduction by the ankyrin chains of the NOMPC channel
> Journal of General Physiology
Published: 06 February 2019
Figure 5. Force and twisting moment exerted on the TRP domain. (A) Cytoplasmic view of the channel domain with TRP domain highlighted blue. The radial/parallel direction r||, angular/tangential direction r⊥, and direction of positive torque mz More about this image found in Force and twisting moment exerted on the TRP domain. (A) Cytoplasmic view ...
1

