
Skip Nav Destination
Close Modal


1-20 of 128
Follow your search
Access your saved searches in your account
Would you like to receive an alert when new items match your search?
1
Journal Articles
In Special Collection:
Celebrating 100 years of JGP
Journal:
Journal of General Physiology
Series: JGP 100th Anniversary
J Gen Physiol (2019) 151 (10): 1163–1172.
Published: 20 August 2019
in The contribution of voltage clamp fluorometry to the understanding of channel and transporter mechanisms
> Journal of General Physiology
Published: 20 August 2019
Figure 1. VCF highlights the unique role of the sodium channel’s domain IV voltage sensor. (A) Membrane topology of a voltage-gated sodium ion channel. The location of the fluorescent probes on each of the S4s are highlighted using colored More about this image found in VCF highlights the unique role of the sodium channel’s domain IV voltage se...
Journal Articles
In Special Collection:
Celebrating 100 years of JGP
Journal:
Journal of General Physiology
Series: JGP 100th Anniversary
J Gen Physiol (2019) 151 (5): 623–627.
Published: 19 March 2019
in The enduring relationship between myosin enzymatic activity and the speed of muscle contraction
> Journal of General Physiology
Published: 19 March 2019
Figure 1. Relationship between maximal speed of shortening and actin-activated ATPase activities measured in skeletal and smooth muscles from a variety of mammalian species. The data plotted here were taken from Table IV in article by Bárány More about this image found in Relationship between maximal speed of shortening and actin-activated ATPase...
in The enduring relationship between myosin enzymatic activity and the speed of muscle contraction
> Journal of General Physiology
Published: 19 March 2019
Figure 2. Drs. Michael and Kate Bárány upon joining the faculty of the University of Illinois School of Medicine, 1975. Photo provided by Dr. Francis Bárány. Figure 2. Drs. Michael and Kate Bárány upon joining the faculty of the University of More about this image found in Drs. Michael and Kate Bárány upon joining the faculty of the University of ...
in The enduring relationship between myosin enzymatic activity and the speed of muscle contraction
> Journal of General Physiology
Published: 19 March 2019
Figure 3. Drs. Michael and Kate Bárány operating a Beckman Model E ultracentrifuge to determine protein molecular weights. Photo provided by Dr. R. John Solaro. Figure 3. Drs. Michael and Kate Bárány operating a Beckman Model E ultracentrifuge More about this image found in Drs. Michael and Kate Bárány operating a Beckman Model E ultracentrifuge to...
in The enduring relationship between myosin enzymatic activity and the speed of muscle contraction
> Journal of General Physiology
Published: 19 March 2019
Figure 4. Dr. Michael Bárány as Emeritus Professor at UIC. Photo provided by Dr. R. John Solaro. Figure 4. Dr. Michael Bárány as Emeritus Professor at UIC. Photo provided by Dr. R. John Solaro. More about this image found in Dr. Michael Bárány as Emeritus Professor at UIC. Photo provided by Dr. R. ...
Journal Articles
In Special Collection:
Celebrating 100 years of JGP
Journal:
Journal of General Physiology
Series: JGP 100th Anniversary
J Gen Physiol (2019) 151 (4): 417–434.
Published: 19 February 2019
Journal Articles
In Special Collection:
Celebrating 100 years of JGP
Journal:
Journal of General Physiology
Series: JGP 100th Anniversary
J Gen Physiol (2019) 151 (4): 407–416.
Published: 19 February 2019
Published: 19 February 2019
Figure 1. Morphological changes accompanying secretion are identified by EM. (A) Mucocyst discharge in the ciliated protist Tetrahymena pyriformis. A longitudinal section showing a cilium, its accompanying parasomal sac (ps), and a discharging More about this image found in Morphological changes accompanying secretion are identified by EM. (A) Muc...
Published: 19 February 2019
Figure 2. Events associated with fusion in the planar bilayer assay. (A) Progression of events associated with fusion from left to right. A multilamellar vesicle is situated on the cis side of a planar bilayer. It contains ion-permeable channels More about this image found in Events associated with fusion in the planar bilayer assay. (A) Progression...
Published: 19 February 2019
Figure 3. Fluorescence-based imaging of single-vesicle fusion. (A) Diagram of the fluorescence microscope arrangement and video equipment. The light sources, filters, dichroic mirror, objective, condenser, and eyepieces were components of an More about this image found in Fluorescence-based imaging of single-vesicle fusion. (A) Diagram of the fl...
in Evolution of our understanding of cell volume regulation by the pump-leak mechanism
> Journal of General Physiology
Published: 19 February 2019
Figure 1. The essentials of the PLM. The asymmetry in ion distributions between the cytoplasm and extracellular space is established by an NKA (top). The flexible membrane is permeable to Na+, K+, Cl−, and water. Impermeant molecules (X), mostly More about this image found in The essentials of the PLM. The asymmetry in ion distributions between the ...
in Evolution of our understanding of cell volume regulation by the pump-leak mechanism
> Journal of General Physiology
Published: 19 February 2019
Figure 2. The action of the NKA stabilizes cell volume. The line labeled “NKA on” indicates when the pump is turned on and then off (p = 0.5 μC cm−2 s−1). The composition of the extracellular solution is changed during the period indicated by More about this image found in The action of the NKA stabilizes cell volume. The line labeled “NKA on” in...
in Evolution of our understanding of cell volume regulation by the pump-leak mechanism
> Journal of General Physiology
Published: 19 February 2019
Figure 3. Constraints on the PLM. The steady-state intracellular ion concentrations ([Conc.], top), voltage (middle), and volume (bottom) are plotted as a function of the NKA pump rate (p). The concentrations are stacked as in Fig. 2 . The More about this image found in Constraints on the PLM. The steady-state intracellular ion concentrations ...
in Evolution of our understanding of cell volume regulation by the pump-leak mechanism
> Journal of General Physiology
Published: 19 February 2019
Figure 4. Joseph Hoffman (left) and Daniel Tosteson (right). Photograph from 1955 or 1956 at the Museum of National History, Frederiksborg Castle, Hillerød, Denmark, taken when Tosteson was a postdoctoral fellow in Hans Ussing’s laboratory in More about this image found in Joseph Hoffman (left) and Daniel Tosteson (right). Photograph from 1955 or...
Published: 19 February 2019
Figure 4. Ca2+-dependent release of intracellular constituents from intact and permeabilized bovine adrenal chromaffin cells. (A) Ca2+-dependent release from intact bovine chromaffin cells in response to 500 µM of the cholinergic agonist More about this image found in Ca2+-dependent release of intracellular constituents from intact...
Published: 19 February 2019
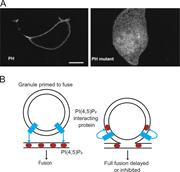
Figure 5. The role of inositol phospholipids in fusion. (A) PH-GFP identifies primarily PI(4,5)P2 in the plasma membrane (note fluorescence in cell periphery; left panel). When a critical basic residue for the interaction is mutated, GFP does More about this image found in The role of inositol phospholipids in fusion. (A) PH-GFP identifies primar...
Published: 19 February 2019
Figure 6. Heterogeneity of Ca2+ responses of cortical granules in the planar cortex assay. (A) Cortices treated with 0.1 µM Ca2+ (left panel) or 17 µM Ca2+ (right panel). Taken from Zimmerberg et al. (1985) , A is reprinted with permission from More about this image found in Heterogeneity of Ca2+ responses of cortical granules in the plan...
Published: 19 February 2019
Figure 7. Patch-clamp electrophysiology enables real-time detection of granule fusion in mast cells. (A) A sketch of the exocytotic fusion pore that has resulted from fusion. Superimposed on the cartoon is the equivalent circuit. Rc and Cc, More about this image found in Patch-clamp electrophysiology enables real-time detection of granule fusion...
1

