


The phototransduction cascade enables the photoreceptor to detect light over a wide range of intensities without saturation. The main second messenger of the cascade is cGMP and the primary regulatory mechanism is calcium feedback. However, some experimental data suggest that cAMP may also play a role in regulating the phototransduction cascade, but this would require changes in cAMP on a time scale of seconds. Currently, there is a lack of data on the dynamics of changes in intracellular cAMP levels on this timescale. This is largely due to the specificity of the sensory modality of photoreceptors, which makes it practically impossible to use conventional experimental approaches based on fluorescence methods. In this study, we employed the method of rapid cryofixation of retinal samples after light stimulation and subsequent isolation of outer segment preparations. The study employed highly sensitive metabolomics approaches to measure levels of cAMP. Additionally, PKA activity was measured in the samples using a western blot. The results indicate that when exposed to near-saturating but still moderate light, cAMP levels increase transiently within the first second and then return to pre-stimulus levels. The increase in cAMP activates PKA, resulting in the phosphorylation of PKA-specific substrates in frog retinal outer segments.
Introduction
The phototransduction cascade in vertebrate photoreceptors enables the visual system to operate effectively in a broad range of light levels, from moonless nights to bright midday. This wide range of sensitivity is provided by a multistage biochemical amplification system, with powerful feedback loops at each stage. Similar to other tissues, the retina depends on second messengers to carry out various functions, including phototransduction. In the vertebrate phototransduction cascade, two major cyclic nucleotide monophosphates, cGMP and cAMP, have distinct roles. cGMP regulates the permeability of plasma membrane channels in photoreceptors. Its role has been extensively studied (for review see Dell’Orco et al. [2021]; Lamb [2022]). After absorbing a quantum of light, a molecule of the visual pigment rhodopsin becomes active and activates several hundred molecules of the G-protein transducin. Each transducin molecule activates a cGMP-specific phosphodiesterase type 6 (PDE6), which reduces the intracellular concentration of cGMP. Closure of cGMP-dependent cation channels in the outer segment of the photoreceptor leads to hyperpolarization of the cell and generates a presynaptic signal at the synaptic end of the photoreceptor.
The phototransduction cascade’s feedback loops are believed to be regulated by calcium concentration through calcium-sensitive proteins associated with each stage of phototransduction. Changes in background illumination intensity or activation can alter the level of photoreceptor polarization, which is initially transient and then stabilizes at a new constant level. It is assumed that at each steady-state level of the intracellular potential, the calcium concentration remains unchanged, albeit at different levels. This should mean that the parameters of the phototransduction cascade are also unchanged. However, real physiological data indicate that when the photoreceptor is tested in steady-state at background illumination, slow processes with characteristic times of seconds and tens of seconds are observed (Nikolaeva et al., 2023). To explain the relatively slow changes in the parameters of the phototransduction cascade under steady-state stimulation, we must assume either an unknown mechanism of slow and delayed regulation of the intracellular calcium concentration in the photoreceptor or another mechanism of cascade regulation in addition to the one already described. Several cellular components of the retina have demonstrated the regulatory effects of cyclic AMP (cAMP). While cGMP has been extensively studied in the phototransduction cascade, cAMP has also been implicated in various processes such as circadian rhythms, intercellular contacts, and retinomotor effects (Burnside and Ackland, 1984; Hasegawa and Cahill, 1998, 1999; Chaurasia et al., 2006), for review see Steinle (2020); Erofeeva et al. (2023).
A regulatory effect of cAMP on the phototransduction cascade is a possibility. Several key proteins involved in the phototransduction cascade, including cGMP phosphodiesterase (PDE6), guanylate cyclase activation protein (GCAP), phosducin, cGMP-regulated channels in the plasma membrane, and rhodopsin kinase (GRK), are substrates for phosphorylation by protein kinase A (PKA) (reviewed in Astakhova et al. [2014]; Erofeeva et al. [2023]). In vivo studies have demonstrated the regulatory effects of cAMP and PKA on rhodopsin kinase (Osawa et al., 2008, 2011). Therefore, changes in cAMP levels could regulate the proteins of the phototransduction cascade by phosphorylation through PKA. It is known that the level of cAMP in the cytoplasm of rods changes cyclically throughout the day. Artificially reproducing these changes can result in significant functional changes in the operation of the phototransduction cascade (Astakhova et al., 2012). However, for a regulatory effect on the timescale of seconds and tens of seconds, significant changes in cAMP levels are required within this time range. Currently, there is a lack of data on the dynamics of intracellular cAMP level changes on a scale of seconds and minutes. This is mainly due to the specificity of the photoreceptor sensory modality, making it impractical to use conventional fluorescence-based experimental approaches. In this study, we employed the rapid cryofixation method on retinal samples after light stimulation, followed by the isolation of outer segment preparations. The study employed highly sensitive metabolomics approaches to measure the levels of cAMP in the preparations. Additionally, PKA activity was measured in the samples. The results indicate that when exposed to near-saturating but still moderate light, cAMP levels increase transiently within the first second and then return to pre-stimulus levels. The activation of PKA occurs through an increase in cAMP levels, resulting in the phosphorylation of PKA-specific substrates in the outer segments of the frog rods.
Materials and methods
Drugs and chemicals
cAMP was obtained from Merck (purity not <98%), аcetonitrile (HPLC grade) from ITW Group, formic acid from Sigma-Aldrich, isopropylic alcohol (purity not <99.8%) from Lenreactiv, and isotope-labeled cyclic adenosine monophosphate (cAMP-13C5, purity not <99%) produced by TRC was used as an internal standard. IBMX, forskolin, H89, and all the chemicals used in the preparation of the Ringer’s solution were purchased from Sigma-Aldrich.
Animals and preparation of retinal samples
Adult marsh frogs (Pelophylax ridibundus) were collected from the wild in southern Russia. The frogs were housed in water tanks at temperatures of 6–8°C for a maximum of 8 mo. Animals were handled in accordance with the Council Directive of the European Communities (24 November 1986; 86/609/EEC), and the experimental protocol was approved by the local Institutional Animal Care and Use Committee (protocol # 4/22 at 28.01.2022). Prior to the experiment, animals were transferred to room temperature and a 12/12 light cycle for several days. Animals were dark-adapted overnight and then decapitated under dark red light. Both eyes were isolated and enucleated, and the hemisphere of each eye was cut into two, three, or four equal segments. The retinas were then separated and layered on a filter paper. Before use in the cryofixation setup, retinal sections layered on filter paper were stored on a moist substrate at room temperature in the dark for no more than a few minutes. The normal Ringer solution used for the frog preparations and perfusion was (in mM): 90 NaCl, 2.5 KCl, 1.4 MgCl2, 1.05 CaCl2, 5 NaHCO3, 5 HEPES, 10 glucose, and 0.05 EDTA, pH adjusted to 7.6 with sodium hydroxide. In experiments with IBMX-induced and forskolin-induced changes in cAMP concentration, Ringer’s solution was prepared by adding either 225 mM IBMX stock solution in dimethylsulfoxide (DMSO) or 10 mM forskolin stock solution in DMSO. The final concentration of IBMX in the Ringer solution was 50 μM and forskolin was 10 μM. The incubation time prior to cryofixation was 5 min for IBMX Ringer solution and 20 min for Forskolin Ringer solution. In experiments with PKA inhibition, retina samples in Ringer solution were preincubated with H89 (50 µM, 10 min), then incubated with forskolin (10 µM, 10 min), or light-stimulated and prepared for western blot analysis with PKA substrate antibody.
Rapid retinal sample cryofixation
The setup for rapid cryofixation of retinal samples is a system of six identical computer-controlled sections. Each section is equipped with a fast stepper motor (max speed 150,000 rpm) driving a lever with an attached pad (Fig. 1). The sample is placed horizontally on the pad and is illuminated with LED light (λ max 525 nm) by computer control. The light intensity used to stimulate the retina was 4.6 × 10⁴ quanta/(s·µm2). After a programmable delay, the lever with the specimen makes an arc of 180° in ∼80 ms and presses the retinal specimen against the polished surface of a copper cylinder cooled to the temperature of liquid nitrogen. For samples with a light stimulus duration of up to 2 s, a 2-s light stimulation was used; for samples, a light stimulation duration of 5, 10, and 20 s, a 20-s light stimulus was used. To combine data obtained using several slightly different stimulation protocols and improve the statistical power of the results, we combined several closely spaced light stimulation time points: 0.16 and 0.2 s into a “0.2 s” group, 0.31 and 0.4 s into a “0.4 s” group, 1.1 and 1.6 s into “1.6 s” group, 10 and 20 s into “20 s” group, and 21, 25, and 30 s into “30 s” group.

Schematic diagram of the unit for cryofixation of retinal preparation. After light stimulation, a stepper motor moves the retina at 80 ms and presses it against a polished copper cylinder in liquid nitrogen.
Schematic diagram of the unit for cryofixation of retinal preparation. After light stimulation, a stepper motor moves the retina at 80 ms and presses it against a polished copper cylinder in liquid nitrogen.
For cryofixation of dark-frozen or light-stimulated retinal samples, the sample was placed in a light-isolated cryo-container and stored for no more than 2 h before use on the cryotome. The specimens were then placed on the Leica RM2265 rotary freezing cryotome with the photoreceptor side facing the knife, and the retinas were serially sectioned at 10-μm thickness until the orange-pink layer containing the photoreceptors was removed. The resulting cell shavings were visually inspected in situ to exclude white inclusion areas from the total material, representing the rod inner segment layer, and collected with a spatula into precooled Eppendorf tubes containing 500 μl of 0.1 M HCl. The harvested cell shavings were lysed and dissolved by sonication with a liquid nitrogen precooled ultrasonic tip (Vibra-Cell VCX 130; Sonics). The resulting suspension was stored at +0.1°C until aliquoted for protein assay and then at −80°C until further measurements.
Protein assay
A 50-μl aliquot of each sample was collected for protein concentration measurement using the Bradford Reagent. All assays were performed in triplicate using BSA as the standard. Absorbance at 595 nm was measured using flat-bottomed 96-well plates in the CLARIOstar Plus Microplate Reader (Labtech International). Protein concentrations were determined by plotting standard curves using Microsoft Excel 2010 (Microsoft).
Western blot analysis for detection of PKA activity
PKA activity was determined by an antibody that recognized phosphorylated PKA substrate (P-S/T PKA substrate antibodies, cat. #9621S; Cell Signaling). This antibody recognized substrates with a phosphorylated PKA consensus sequence RRX(S/T). Cell shavings were homogenized in 100 μl of the buffer (10 mM HEPES, 150 mM NaCl, 0.1% Triton X-100 [Sigma-Aldrich], with protease and phosphatase inhibitors), then an equal amount of Laemmli solution was added and samples were boiled at 95°C for 5 min. For western blot analysis, proteins (10 µg of protein/lane) were separated by SDS-PAGE (10% gel) and transferred to a nitrocellulose membrane. Membranes were stained by Ponceau S solution (Sigma-Aldrich) for 5 min and destained in TBST before processing to immunoblotting. (Tris buffer saline, 10 mM Tris, 150 mM NaCl, 0.1% Tween, all chemicals from Sigma-Aldrich). After washing in TBST, membranes were incubated with goat anti-rabbit IgG-conjugated with horseradish peroxidase (Sigma-Aldrich) and the signal was visualized by ECL detection (Amersham Pharmacia Biotech).
cAMP measurement: Liquid chromatography–tandem mass spectrometry (LC–MS/MS)
Sample extracts were analyzed using a high-resolution HPLC–MS/MS system consisting of a Dionex UltiMate 3000 HPLC (Thermo Fisher Scientific) with Q Exactive detector (Thermo Fisher Scientific) with electrospray ionization (ESI). After various tests to obtain the best signal response for each compound, chromatographic separation was achieved by injecting 20 μl of the sample extract into a Zorbax SB-C8 150 mm × 4.6 mm × 1.8 µm column. The mobile phase was a gradient mixture of two components: solvent A–0.1 M ammonium formate (Sigma-Aldrich) in water, solvent B–acetonitrile. The flow rate was set to 0.400 ml/min with the following gradient program: 0.0–2.0 min 2% solvent B, then the B content increased to 30% at 8.0 min, and remained at 30% until 9 min, then decreased to 2% at 9.1 min and remained at 2% until the end of the program. Mass spectrometric detection was performed using negative electrospray ESI(−). The analytes were identified by selecting characteristic target reactions (MRM transitions) and the retention time of the analytes. An example of a chromatogram and mass spectrа of the analytes is given in Fig. S1. The following MS parameters were kept constant during the analysis: nebulization voltage 4,800 V for positive ionization. The temperature of the cone was set at 300°C, the temperature of the heated probe at 400°C, the gas flow through the nebulizer at 3 liters/min, and the flow rate of the drying gas at 10 liters/min. Product ions and precursor ions were selected for analyte identification (Table 1).

Example of chromatograms and mass spectra of cAMP (lower) and internal standard isotope-labeled cAMP (upper) in a frog ROS sample.
Example of chromatograms and mass spectra of cAMP (lower) and internal standard isotope-labeled cAMP (upper) in a frog ROS sample.
Preparation of standard solutions
To prepare the stock internal standard solution, 10 mg of cAMP-13C5 was weighed using an AUW-220D analytic balance (Shimadzu), transferred to a 1,000 ml volumetric flask, and dissolved in 0.1 M HCl in water. Working internal standard solutions (10 ng/ml) were prepared by diluting the stock solutions with 0.1 M HCl in water. Stock solutions were stored at +4°C for no longer than 1 wk.
To prepare the standard solutions, 10 mg of each substance was accurately weighed (±0.1 mg) using an AUW-220D analytic balance (Shimadzu), transferred to a 25 ml volumetric flask, and dissolved in the working internal standard solution. Calibration solutions were prepared from the stock solution by dilution with a working internal standard solution. All stock solutions were stored at +4°C for no longer than 1 wk.
Sample preparation
50 µl of the working internal standard solution was added to each Eppendorf tube with sample and thoroughly mixed using a rotary shaker (15 min) and then an ultrasonic unit. After ultrasonic stirring for 15 min, the tubes were centrifuged at 14,000 rpm for 5 min. Approximately 40 μl of the supernatant was decanted and then transferred into glass vials for HPLC analysis.
Statistical analysis
All values are expressed as the mean ± SEM. All statistical analyses were performed using GraphPad Prism 8 software (GraphPad). For experiments with IBMX and forskolin, one-sample t test was used. For experiments with multiple light exposure time, one-way ANOVA with Dunnett test for multiple comparisons was used. The data were checked for normality by the Shapiro–Wilk test, and the outliers were removed with the ROUT method. A value of P < 0.05 was considered statistically significant (*P < 0.05, **P < 0.01).
Online supplemental material
Fig. S1 includes examples of chromatograms and mass spectra of cAMP (lower) and internal standard isotope-labeled cAMP (upper) in a frog ROS sample. Fig. S2 includes full blots and Ponceau S stained membrane of three independent experiments, each with samples collected in the dark (control) and after 0.5, 1, and 5 min of light exposure. Fig. S3 includes full blots and Ponceau S stained membrane of three independent experiments, each with samples collected without any stimulation (control), one stimulated with forskolin, one stimulated by light, and two preincubated with PKA inhibitor +H89 prior to stimulation. Fig. S4 includes a full blot and Ponceau S stained membrane with isolated human platelets with and without stimulation by forskolin. Table S1 lists the relative levels of cAMP after incubation with 50 μM IBMX and 10 μM forskolin. Table S2 lists the relative levels of cAMP in rod outer segments after various times of exposure to light or times after a 20 s light exposure.
Results
Dark level of cAMP and correlation of cAMP levels in two frog eyes
To estimate the dark level of cAMP in rod outer segments (ROS) of frog retina, we analyzed its level in all samples cryofixed in the dark. Based on 72 samples, we found the dark cAMP level to be 11.4 ± 0.5 pmol/mg of protein (mean ± SEM). Experimentally, we found that the minimum sample size to be measured by the method described in the Materials and methods section is 0.25 of the retina from one eye. The retinal specimen cryofixation unit allows for simultaneous fixation of up to six retinal specimens according to a preset program. Thus, we divided an eye into two or three segments. Using the six retinal samples from two eyes to simultaneously measure the dynamics of cAMP levels for three to five values of time delay after stimulus onset (plus one dark value) requires the cAMP levels in both eyes of the animal to be approximately the same. To test this assumption, we performed an experiment in which we compared the dark levels of cAMP in the halves of each eye. The ratio of cAMP content (first eye)/(second eyes) (according to the order in which they were dissected) was 1.04 ± 0.07 (mean ± SEM, n = 24). Thus the difference in intracellular cAMP content in two eyes of the same animal is statistically insignificant (P = 0.55), and we used retinal preparations to measure four to six different values of the post-stimulus in one animal.
Application of IBMX and forskolin leads to an increase in cAMP levels
As a positive control, we used the application of a nonspecific phosphodiesterase inhibitor IBMX and a direct activator of adenylate cyclases, forskolin. In both cases, the retina of one eye was cut into two halves, of which one half was incubated in normal Ringer’s solution and used as a control, and the other half was placed for 5 min in a solution containing 50 μM IBMX or for 20 min in a solution containing 10 μM forskolin. All measurements were taken in the dark. cAMP levels rose significantly in IBMX 1.99 ± 0.16 times (mean ± SEM, P = 0.0014; n = 6) and in forskolin 18.9 ± 5.7 times (P = 0.025; n = 6) (Fig. 2, A and B; and Table S1).

cAMP content in frog retina rod outer segments. (A and B) cAMP level in ROS after incubation for 5 min in 50 µM IBMX Ringer solution (A) or incubation for 20 min in 10 µM Forskolin Ringer solution (B). Data are relative to cAMP content in normal Ringer’s solution in the dark. (C) Concentration of cAMP in ROS after exposure to light of different durations (from 0.01 to 20 s) and after extinction of the stimulus of 20 s duration. Intensity 4.6 × 10⁴ quanta/(s·µm2). The black horizontal bar on the graph marks the beginning and end of light stimulation. All values are shown as relative to the measurement of the dark-adapted sample on the same eye or on the same frog. Error bars indicate SEM and stars indicate significant difference (one-way ANOVA with Dunnett’s multiple comparisons test).
cAMP content in frog retina rod outer segments. (A and B) cAMP level in ROS after incubation for 5 min in 50 µM IBMX Ringer solution (A) or incubation for 20 min in 10 µM Forskolin Ringer solution (B). Data are relative to cAMP content in normal Ringer’s solution in the dark. (C) Concentration of cAMP in ROS after exposure to light of different durations (from 0.01 to 20 s) and after extinction of the stimulus of 20 s duration. Intensity 4.6 × 10⁴ quanta/(s·µm2). The black horizontal bar on the graph marks the beginning and end of light stimulation. All values are shown as relative to the measurement of the dark-adapted sample on the same eye or on the same frog. Error bars indicate SEM and stars indicate significant difference (one-way ANOVA with Dunnett’s multiple comparisons test).
The dynamics of cAMP levels in the rod outer segments after the onset of light stimulation
The result is shown in Fig. 2 С and Table S2. The results show that as early as 200 ms after the onset of a saturating step of light with an intensity of 4.6 × 10⁴ quanta/(s·µm2), cAMP level in photoreceptor outer segments increases by 30–60%, stays increased between 200 and 600 ms, and then returns to approximately dark levels (points 1.6, 5, and 20 s) and remains at dark levels after light stimulation is turned off (point 30 s as determined by one-way ANOVA statistic F(2.3, 47) = 8.37, P = 0.0003).
Light stimulation activates PKA in frog outer segments
To evaluate whether the relatively small increase of cAMP (Fig. 2) can activate PKA in frog outer segments, we used western blot analysis. PKA activity could be monitored by the detection of phosphorylated serines or threonines within the consensus sequence RRX(S/T) recognized by PKA. Equal loading of proteins was controlled by Ponceau S staining (Fig. S2 and Fig. S3). The samples were collected in the dark (control) and after 0.5, 1, and 5 min of light exposure (Fig. 3, A and B). For each condition, before cryosectioning, the same retina was cut into five pieces: one was without any stimulation (control), one stimulated with forskolin, one stimulated by light, two preincubated with PKA inhibitor +H89 prior to stimulation by light or by forskolin. A band near 70 kDa, that was present in darkness, increased in intensity after only 0.5 min of light exposure and continued to increase in intensity during 5 min of light exposure. Interestingly, a strong signal was detected only on proteins around 70 kDa (see Fig. 3 A and Fig. S2 bottom panel), but blots with longer exposure times suggested phosphorylation to a lesser extent, of additional proteins between 55 and 130 kDa. The validity of our approach was tested by using the antibody on our well-established system, human platelets (Gambaryan et al., 2010). Stimulation of human platelets with forskolin led to the appearance of numerous bands indicating that the antibody was capable of detecting phosphorylated proteins over a broad range of molecular weights (Fig. S4). We conclude that in frog rod outer segments, phosphorylation of proteins with molecular weight around 70 kDa is predominant. To prove that these proteins are phosphorylated by PKA, the frog retina was preincubated with H89 (established PKA inhibitor) and then stimulated by forskolin or by light. H89 significantly inhibited forskolin and light-stimulated phosphorylation of PKA substrates (Fig. 3 C).
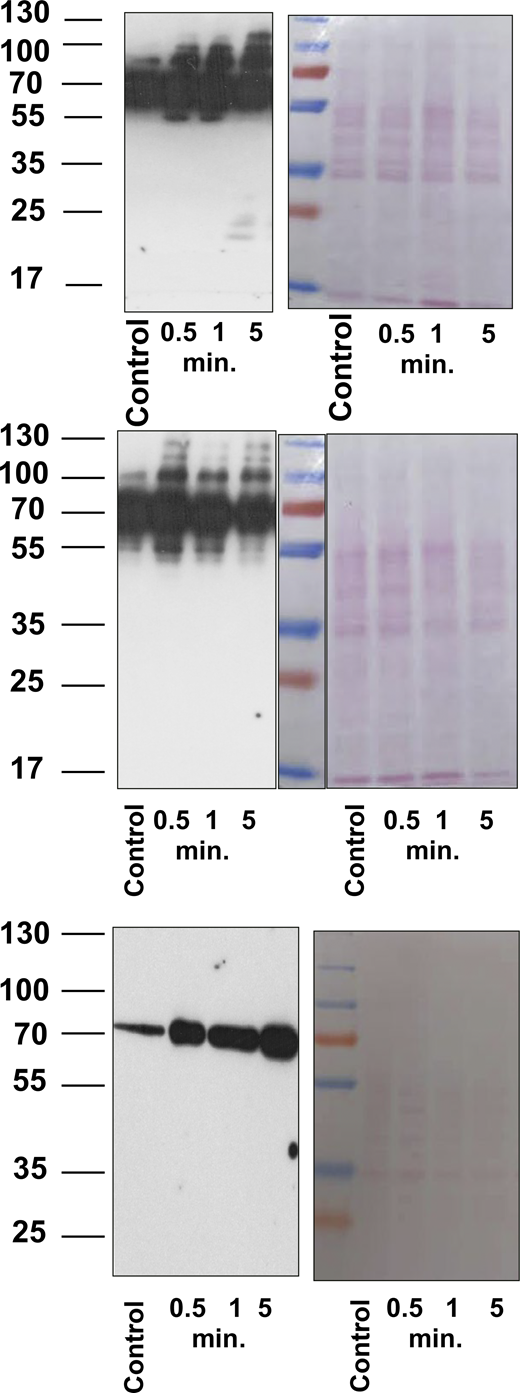
Full blots and Ponceau S stained membrane of three independent experiments. Source data are available for this figure: SourceDataFS2.
Full blots and Ponceau S stained membrane of three independent experiments. Source data are available for this figure: SourceDataFS2.
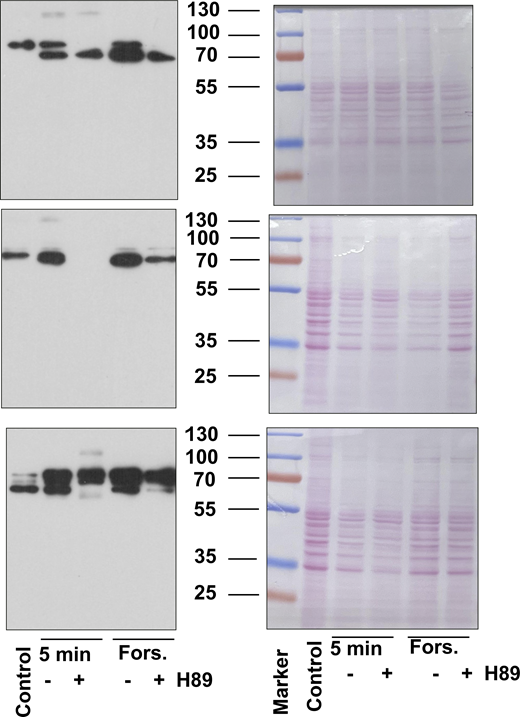
Full blots and Ponceau S stained membranes of three independent experiments. Source data are available for this figure: SourceDataFS3.
Full blots and Ponceau S stained membranes of three independent experiments. Source data are available for this figure: SourceDataFS3.

Light stimulation activates PKA in frog outer segments. (A and B) Frozen sections of outer segments in the dark (control) and after 0.5, 1, and 5 min of light stimulation were analyzed by western blotting with PKA substrate antibody (A and B). (C) Retina were preincubated with PKA inhibitor H89 (50 µM, 10 min) and then stimulated with forskolin (forskolin samples) or light-stimulated for 5 min. 10 µg of protein were loaded in each lane. The signal was visualized by ECL detection. A and B are the same blots exposed during 1 s (A) and 10 s (B). Light intensity is the same as in Fig. 2 C. Equal loading was controlled by Ponceau S staining of the membranes (Fig. S2 and Fig. S3). Source data are available for this figure: SourceData F3.
Light stimulation activates PKA in frog outer segments. (A and B) Frozen sections of outer segments in the dark (control) and after 0.5, 1, and 5 min of light stimulation were analyzed by western blotting with PKA substrate antibody (A and B). (C) Retina were preincubated with PKA inhibitor H89 (50 µM, 10 min) and then stimulated with forskolin (forskolin samples) or light-stimulated for 5 min. 10 µg of protein were loaded in each lane. The signal was visualized by ECL detection. A and B are the same blots exposed during 1 s (A) and 10 s (B). Light intensity is the same as in Fig. 2 C. Equal loading was controlled by Ponceau S staining of the membranes (Fig. S2 and Fig. S3). Source data are available for this figure: SourceData F3.
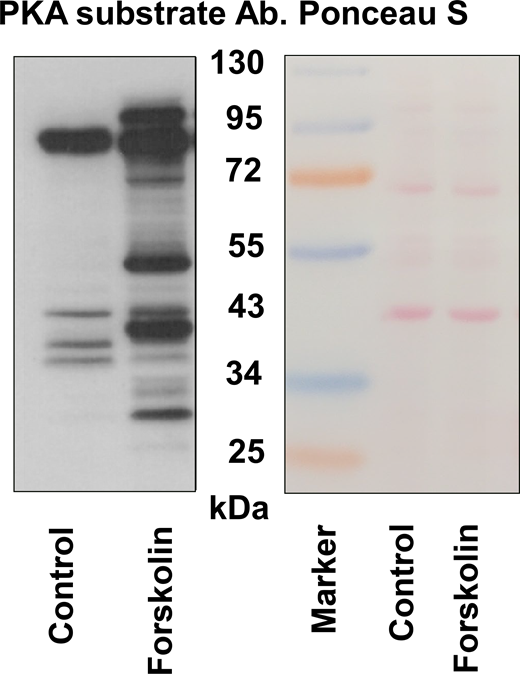
Isolated human platelets (3 × 10⁷/lane) without stimulation (control) and stimulated by forskolin (5 µM, 2 min) were prepared for western blot analysis with PKA substrate antibody. Membrane was stained by Ponceau S. Source data are available for this figure: SourceDataFS4.
Isolated human platelets (3 × 10⁷/lane) without stimulation (control) and stimulated by forskolin (5 µM, 2 min) were prepared for western blot analysis with PKA substrate antibody. Membrane was stained by Ponceau S. Source data are available for this figure: SourceDataFS4.
Discussion
A change in PKA activity in response to light stimulation in the mouse photoreceptor layer was previously shown in the work of Sato et al. (2020). They showed that stimulation with light of saturating intensity initially leads to a short-term decrease in PKA activity, which is then followed by a reverse increase in PKA activity that significantly exceeds the initial dark level. They also showed that the increase in PKA activity does not begin until the light stimulus is turned off.
It has been shown that light initiates the paracrine release of dopamine from dopaminergic amacrine cells (Popova, 2020). This process leads to stimulation of dopamine D4R receptors on the membrane of the photoreceptor outer segment and a decrease in cAMP levels and PKA activity (Jackson et al., 2011). Sato and colleagues suggested that switching the light stimulus on triggers two multidirectional processes of PKA inactivation and activation. The dopamine receptor activation develops more rapidly and it is also switched off quickly when the light stimulus is switched off. The second process, which leads to the activation of PKA, also starts with the onset of light stimulation and is mediated by rhodopsin in the photoreceptor itself. It responds more slowly to the on-and-off switching of the light stimulus.
In our work, we have applied a new, original approach that allows us to measure the dynamics of changes in cAMP content in the outer segments of frog photoreceptors for a period of <1 s after switching light stimulation on or off. The main advantage of the presented method is that the experimental protocol does not use light sources as required in optical fluorescence approaches. We have shown that almost immediately after switching on a light stimulus with an intensity close to the saturating intensity for rods (4.6 × 10⁴ quanta/s·µm2), the level of cAMP increases by about 30–60% relative to the dark level and then returns almost to the dark level after about 1 s and remains there during the continuation of the light step and during the first 10 s after switching the light off (Fig. 2 C). The intensity of the light stimulus was three orders of magnitude lower than in Sato’s experiments, but our data shows that such intensity is saturating or close to saturation for frog rods (Nikolaeva et al., 2023).
The small but statistically significant increase in the concentration of cAMP immediately after the onset of moderate-intensity light stimulation is puzzling. The small magnitude of the effect itself may be explained by the fact that cAMP signaling occurs in microdomains and local changes in the signaling metabolite may significantly exceed the average cellular changes. In a standard scheme of dynamic maintenance of the level of a signaling molecule at a stable level, there should be synthesizing and degrading elements working in synchrony. In the case of cyclic mononucleotides, and in particular cyclic adenosine monophosphate, synthesis is carried out by one or more adenylate cyclases and hydrolysis by phosphodiesterases. The exact composition of these enzymes in the outer segments of frog P. ridibundus photoreceptors is unknown. Adenylate cyclase isoforms are divided into four functional groups, which differ in their mechanism of activation by G-proteins and calcium (Halls and Cooper, 2011). The first group includes the calcium-activated adenylate cyclases (types 1, 3, and 8). Of these, the presence of AC1 in significant amounts has been shown in chick (Chaurasia et al., 2006) and rat (Fukuhara et al., 2004) photoreceptors, and the presence of AC8 has also been shown in chick photoreceptors (Chaurasia et al., 2006) (for a review see Erofeeva et al. [2023]). In addition, group 2 adenylate cyclases characterized by calcium inhibition have also been identified, including AC2, which has been found in the retinas of rodless knockout mice (Yoshida et al., 2004) and in the inner segments of fish photoreceptors (Nakao et al., 2012).
The composition of the enzymes that utilize cAMP in vertebrate photoreceptors is also not well understood. The outer segments of photoreceptors contain a large amount of phosphodiesterase 6 which is specific for cGMP but can also hydrolyze cAMP with low efficiency (Cote et al., 2022). In addition, the presence of PDE1A in the photoreceptor outer segment (Santone et al., 2006) and PDE4B in the outer and inner segments (Whitaker and Cooper, 2009) has been demonstrated in rats. PDE1A hydrolyses both cGMP and cAMP and its level of activity is positively dependent on calcium, whereas PDE4B is a cAMP-specific phosphodiesterase and its activity is thought to be independent of calcium levels (Omori and Kotera, 2007).
The dark level of free cytoplasmic calcium in amphibian rod photoreceptors is about 600 nM and it drops up to 30 nM when the rod is illuminated by saturating light (Pugh et al., 1999). A hypothetical scheme to explain the turnover of cAMP in the photoreceptor outer segment of the frog retina should include specific types of adenylate cyclase and phosphodiesterases to determine the sign of the response of these enzymes to a decrease in calcium concentration (Fig. 4). Unfortunately, we do not yet have information on the repertoire of these enzymes in frog photoreceptors, so we cannot directly correlate the results of our experiments with this scheme.

Hypothetical scheme of cAMP turnover in the outer segment of a photoreceptor cell. CNGC – cyclic nucleotide (cGMP) gated channel, AC – adenylate cyclase, PDE – phosphodiesterase, PKA – cAMP-dependent protein kinase. Approximately, 70 kDa – unidentified protein that undergoes phosphorylation upon PKA activation.
Hypothetical scheme of cAMP turnover in the outer segment of a photoreceptor cell. CNGC – cyclic nucleotide (cGMP) gated channel, AC – adenylate cyclase, PDE – phosphodiesterase, PKA – cAMP-dependent protein kinase. Approximately, 70 kDa – unidentified protein that undergoes phosphorylation upon PKA activation.
An increase in cAMP levels leads to an increase in PKA activity, which is also measured in photoreceptor outer segments. We have shown that PKA activity was increased by 30 s of light stimulation and activity remained high or may have increased further during 5 min of continuous light exposure. The light intensity we used approximates the light intensities used in physiological experiments where the existence of slow processes at the level of individual photoreceptors and isolated retina has been demonstrated (Rotov et al., 2021). At the same time, this intensity is three orders of magnitude lower than those at which Sato et al. demonstrated the effect of PKA on light stimulus activation, and four orders of magnitude lower than the intensities that elicited a significant OFF-response. However, to properly compare the effect of light on frog and mouse photoreceptors, it is necessary to convert the incident light intensity into the number of isomerizations of pigment molecules per rod per second (R*s−1). This value R is equal to R = I·A, where I is the incident light intensity and A is the effective absorption area calculated by the formula A = 2.3·f·Q·α·vos (Baylor et al., 1979), where f is a factor of light polarization, Q is the quantum efficiency of isomerization, α is the axial pigment density, and vos is the rod outer segment volume. The diameter and length of the wild-type mouse rod are 1.4 and 15 µm, respectively, vosmouse is equal to 23 µm3 (Sakurai et al., 2007) and in marsh frog with outer segment diameter and length of 7 and 40 µm, respectively (our own measurement) vos frog is equal 1,539 µm3, which is ∼70 times larger than the mouse outer segment volume. Thus, the rate of rhodopsin isomerization per rod differed by one to two orders of magnitude in Sato’s experiments and our experiments. We can assume that simultaneous processes leading to activation and inactivation of PKA have not only different rates but also different sensitivities to light. Then, the absence of a reliable phase of cAMP decrease in our experiments (in contrast to Sato’s experiments) can be explained by the fact that the dopamine-mediated process of cAMP synthesis suppression is weakly expressed compared to the process of cAMP synthesis activation. Of course, these reactions might also be different in mice and the cold-blooded amphibians used in our experiments.
Оur data indicate that the main target of phosphorylation by protein kinase A is a protein or a small group of proteins with a molecular mass of about 70 kDa. Some key proteins of the phototransduction cascade have molecular masses close to this value (like rhodopsin kinase, mol wt 67–70 kDa (Benovic, 2021) or the A1 subunit of the cyclic nucleotide-gated channel of the photoreceptor plasma membrane (Zhong et al., 2002), but additional experiments are needed for reliable identification. It should be mentioned that phospho-PKA substrate antibody clearly does not recognize all potential PKA substrates. This antibody recognizes substrates only with RRX(S/T) motif; however, PKA substrates are more broad and include R(K)R(K)X(S/T). PKA also can phosphorylate proteins with a single R or KX(S/T) (Neuberger et al., 2007). Quantitative phosphoproteomic approaches should be used for the identification of most PKA substrates in the outer segments of the frog retina. For example, in human platelets >300 proteins were phosphorylated by PKA activation and among them, only 137 proteins were predicted as PKA substrates (Beck et al., 2014). Such analysis will help in the future to identify PKA substrates in the outer segments of the retina and correlate them with the involvement of PKA in the mechanisms of signal transduction in these cells.
Data availability
Acknowledgments
Jeanne M. Nerbonne served as editor.
This research was funded by Russian Science Foundation grant # 22-25-00656 to M. Firsov.
Author contributions: O. Chernyshkova: Formal analysis, Investigation, N. Erofeeva: Methodology, Writing - original draft, D. Meshalkina: Investigation, Methodology, Resources, Writing - review & editing, A. Balykina: Investigation, Visualization, S. Gambaryan: Data curation, Formal analysis, Investigation, Methodology, Validation, Visualization, Writing - original draft, Writing - review & editing, M. Belyakov: Investigation, Methodology, Writing - original draft, M. Firsov: Conceptualization, Data curation, Formal analysis, Funding acquisition, Investigation, Methodology, Project administration, Software, Supervision, Validation, Visualization, Writing - original draft, Writing - review & editing.
Institutional Review Board Statement: The study was conducted in accordance with the Council Directive of the European Communities (24 November 1986; 86/609/EEC) and the experimental protocol # 4/22 was approved by the local Animal Care and Use Committee of Sechenov Institute at 28.01.2022.

