


Voltage-gated sodium (Nav) channels produce the upstroke of action potentials in excitable tissues throughout the body. The gating of these channels is determined by the asynchronous movements of four voltage-sensing domains (VSDs). Past studies on the skeletal muscle Nav1.4 channel have indicated that VSD-I, -II, and -III are sufficient for pore opening, whereas VSD-IV movement is sufficient for channel inactivation. Here, we studied the cardiac sodium channel, Nav1.5, using charge-neutralizing mutations and voltage-clamp fluorometry. Our results reveal that both VSD-III and -IV are necessary for Nav1.5 inactivation, and that steady-state inactivation can be modulated by all VSDs. We also demonstrate that channel activation is partially determined by VSD-IV movement. Kinetic modeling suggests that these observations can be explained from the cardiac channel’s propensity to enter closed-state inactivation (CSI), which is significantly higher than that of other Nav channels. We show that skeletal muscle Nav1.4, cardiac Nav1.5, and neuronal Nav1.6 all have different propensities for CSI and postulate that these differences produce isoform-dependent roles for the four VSDs.
Introduction
The rapid and varied kinetics of action potentials in the brain, heart, and skeletal muscle tissue are shaped by voltage-gated sodium (Nav) channels. The nine known Nav channels expressed in humans (Nav1.1–Nav1.9) each form a tetrameric, pore-forming structure from four non-identical domains (DI–DIV; Fig. 1 A; Catterall et al., 2005; Hull and Isom, 2018). Each domain contains six transmembrane segments (S1–S6) that are responsible for either voltage detection (S1–S4) or formation of the pore structure (S5–S6; Jiang et al., 2020; Pan et al., 2018; Ahern et al., 2016; Fig. 1 A). In particular, the S4 segment of each domain contains positively charged amino acid residues that function as gating charges (Catterall et al., 2020). Neutralizing these charges through mutagenesis and tracking S4 movements through voltage-clamp fluorometry (VCF) have provided insight into the roles that each domain plays in channel gating, specifically activation and inactivation (Chen et al., 1996; Kontis and Goldin, 1997; Mitrovic et al., 1998; Cha et al., 1999; Kühn and Greeff, 1999; Chanda and Bezanilla, 2002; Capes et al., 2013; Hsu et al., 2017).
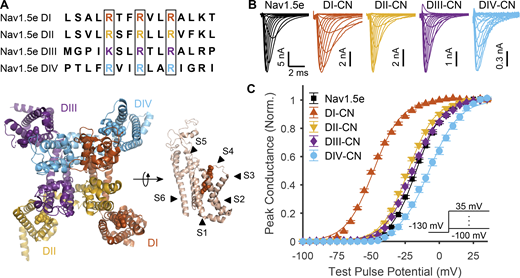
Impact of neutralizing VSDs on channel activation. (A) Top: Sequence alignment of the S4 voltage-sensing helices across domains I–IV of mNav1.5e. Outlined in black are the gating charges that were neutralized to glutamine in the CN mutants. Bottom: Top-down view of the structure of Nav1.5 from Jiang et al. (2020). To the right is a side view of domain I with the various transmembrane α helices annotated. Gating charges corresponding to those outlined in black boxes in the top of the panel are annotated as balls in the structure. (B) Representative traces of ionic currents corresponding to WT Nav1.5e (cell 20170418c2) and mutant channels (DI-CN, cell 20180307c1; DII-CN, cell 20180316c1; DIII-CN, cell 20180712c3; DIV-CN, cell 20190318c3) in response to depolarizing voltage steps ranging from −110 to 35 mV, following a holding potential of −130 mV (−100 mV for WT), recorded in HEK-293T cells. A scheme of this voltage step protocol is displayed in the inset of C. (C) Normalized peak conductance of WT and mutant channels. Inset: Voltage-step protocol used to assess channel activation. Solid lines are fitted Boltzmann curves. Parameter values are reported in Table S1. Similar data from adult Nav1.5 (mH1) is shown in Fig. S1.
Impact of neutralizing VSDs on channel activation. (A) Top: Sequence alignment of the S4 voltage-sensing helices across domains I–IV of mNav1.5e. Outlined in black are the gating charges that were neutralized to glutamine in the CN mutants. Bottom: Top-down view of the structure of Nav1.5 from Jiang et al. (2020). To the right is a side view of domain I with the various transmembrane α helices annotated. Gating charges corresponding to those outlined in black boxes in the top of the panel are annotated as balls in the structure. (B) Representative traces of ionic currents corresponding to WT Nav1.5e (cell 20170418c2) and mutant channels (DI-CN, cell 20180307c1; DII-CN, cell 20180316c1; DIII-CN, cell 20180712c3; DIV-CN, cell 20190318c3) in response to depolarizing voltage steps ranging from −110 to 35 mV, following a holding potential of −130 mV (−100 mV for WT), recorded in HEK-293T cells. A scheme of this voltage step protocol is displayed in the inset of C. (C) Normalized peak conductance of WT and mutant channels. Inset: Voltage-step protocol used to assess channel activation. Solid lines are fitted Boltzmann curves. Parameter values are reported in Table S1. Similar data from adult Nav1.5 (mH1) is shown in Fig. S1.
The voltage-dependent gating of Nav channels is distinct from the homotetrameric behavior of voltage-gated potassium channels in that each Nav channel domain appears to have a differentiated role. For example, DI and DII movements are thought to play no role in inactivation, and function only to drive pore opening (Ahern et al., 2016; Armstrong and Hollingworth, 2018; Angsutararux et al., 2021). Several experiments have pointed to DIV playing a unique role in inactivation (Chen et al., 1996; Chanda and Bezanilla, 2002; Capes et al., 2013); however, other studies have pointed to a role for both DIII and DIV in inactivation (Cha et al., 1999; Hsu et al., 2017). To explain this, two gating models for Nav channels have been proposed, one in which both DIII and DIV movements are necessary for inactivation (Armstrong, 2006; Armstrong and Hollingworth, 2018), and another in which DIV alone is sufficient for inactivation (Ahern et al., 2016; Capes et al., 2013). The idea that DIV alone is sufficient for inactivation derives primarily from studies on a single isoform, Nav1.4 (Chanda and Bezanilla, 2002; Goldschen-Ohm et al., 2013; Capes et al., 2013). It remains to be determined, therefore, the extent to which all Nav channels obey a common model of voltage-dependent gating.
To test the hypothesis that all Nav channels follow the same gating scheme as Nav1.4, we characterized the role of each voltage sensor in the gating of Nav1.5e, a neonatal splice variant of the cardiac sodium channel. We mutated the first three gating charges in each S4 segment to glutamines, generating four charge-neutralized (CN) mutant channels: DI-CN, DII-CN, DIII-CN, DIV-CN. We also determined the steady state behavior of each voltage sensor using VCF experiments. Here, we report the results of these CN and VCF experiments and present detailed kinetic modeling which together reveal how each voltage sensor contributes to the macroscopic gating properties of Nav1.5 channels. Our results point to a critical role for closed-state inactivation (CSI) in permitting voltage sensors to influence activation and inactivation properties. We show that Nav1.4, Nav1.5, and Nav1.6 all have different propensities for CSI and postulate that these differences produce isoform-dependent roles for the four voltage-sensing domains (VSDs).
Materials and methods
Molecular biology
The mouse mH1 pcDNA3.1(+)-plasmid was obtained from Dr. T. Zimmer (Friedrich Schiller University Jena, Jena, Germany; Camacho et al., 2006). Exon 6a cDNA was amplified out of mouse brain homogenates, using the Access RT-PCR System (Promega), and then exchanged with exon 6b in mH1 using the Quikchange method of site-directed mutagenesis (SDM; Braman et al., 1996), to generate the Nav1.5e plasmid.
CN mutations of Nav1.5e were engineered using single-primer reactions in parallel SDM (Edelheit et al., 2009). Primers (Integrated DNA Technologies) were designed containing both the amino acid exchanges of interest (Fig. 1 A) and a silent restriction site. After the PCR reaction, unmutated templates were digested using 0.4–0.8 U/μl of DpnI (New England Biolabs). The resulting PCR mixture was transformed into house-grown competent DH5α. Colonies were grown overnight on agar plates and picked for liquid culturing in 25 g/liter Lysogeny Broth (Fisher Bioreagents). Plasmids were harvested using QIAprep Spin Miniprep Kits (Qiagen). Mutations were screened via restriction digest and gel electrophoresis, using the silent restriction sites initially designed into the SDM primers. Plasmid sequences were verified with Sanger sequencing done by the Innovation Centre of McGill University and Genome Quebec, using Sequencher 4.8 and CLC Sequence Viewer 8.0.
Nav1.5e DIV-CN constructs were modified further by conjugating the Nav sequence to an engineered GFP fluorophore called Mystik (Mys) via a P2A linker. The P2A allowed for the stoichiometric 1:1 translation of the Mystik and Nav genes, so that cells showcasing the strongest fluorescence were the most likely to express the Nav channel in higher abundance (Ahier and Jarriault, 2014). Primers (Integrated DNA Technologies) with overhangs containing fragments of the Nav plasmid’s 5′ untranslated region or part of the P2A-Nav sequence were used to PCR amplify a double-stranded “megaprimer” containing (from 5′ to 3′) the 5′ untranslated region upstream of the Nav channel, the entire Mys gene, the P2A sequence, and the 5′ end of the Nav channel cDNA. This megaprimer was then isolated via gel electrophoresis, extracted into solution using MinElute Gel Extraction Kits (Qiagen), and inserted into the Nav channel plasmid by means of the Quikchange method of PCR discussed previously.
Cell culture
Human embryonic kidney cells mutated to overexpress the SV40 large T-antigen (HEK-293T cells) were used as the expression system for electrophysiological recordings. HEK-293T cultures were maintained in minimal essential medium containing Glutamax (MEM-glutamax; Gibco), supplemented with 10% FBS (Gibco), and kept at conditions of 37°C, 100% humidity, and 5% CO2 in a Thermo Forma Series II Water-Jacketed CO2 Incubator (Thermo Fisher Scientific). Main HEK-293T stocks were grown in T-25 Flasks (Corning) and twice a week passaged using Trypsin-EDTA solution (Gibco) into 35-mm Tissue-Culture Treated Culture Dishes (Corning) for transfection purposes. The calcium phosphate transfection protocol (Jordan et al., 1996) was used to transiently transfect HEK-293T cells ≥24 h before recordings. Each 35-mm culture dish was loaded with 0.5 µg of the Nav channel plasmid and 0.2 µg of the transfection reporter Mys (unless already present, as in the Mys-P2A-Nav constructs). The cDNA mixture was dissolved in 560 mM of CaCl2 (unless otherwise indicated, all chemical reagents are from Sigma-Aldrich), and an equal volume of 2XBES solution (in mM: 50 BES, 280 NaCl, and 1.5 Na2HPO4) was added to induce precipitate formation. After roughly 1 min, the DNA-calcium phosphate precipitates were added to a single culture dish. The dish was then returned to the incubator where cells had time to be transfected, typically over 6–9 h. The reaction was then quenched 6–9 h later by rinsing with PBS (in mM: 137 NaCl, 2.7 KCl, 10.1 Na2HPO4, and 2 NaH2PO4) containing 1 mM EDTA and rinsed with PBS containing 1 mM MgCl2 and 1 mM CaCl2. Transfected HEK-293T cells were left to recover overnight.
Electrophysiology
At least 2 h before the start of recordings, transfected cells were dissociated from their cultures using Accutase and then replated at a lower density. This step increased the yield of isolated cells, minimizing gap junctions that form between adjacent HEK-293T cells and optimizing the quality of the voltage-clamp conditions. Culture medium was replaced with external solution containing (in mM): 155 NaCl, 4 KCl, 5 HEPES, 1 MgCl2, and 1.8 CaCl2, with pH adjusted to 7.3–7.4 using NaOH. Cells were patched with microelectrodes containing an internal solution that was optimized for voltage-clamp conditions, made up of (in mM): 115 CsCl, 5 HEPES, 5 Cs4-BAPTA, 1 MgCl2, 0.5 CaCl2, and 10 Na2ATP, with pH adjusted to 7.3–7.4 using CsOH and sucrose added to keep the osmolality matching that of the external solution, 295–300 mOsm. Borosilicate glass capillaries—with an inner diameter of 1.15 mm, an outer diameter of 1.65 mm, a length of 100 mm, and a 0.1 mm filament (King Precision Glass)—were pulled using a PP-830 vertical puller (Narishige), yielding microelectrodes with a pipette resistance of 1–5 MΩ. Microelectrode tips were then dipped into Bees-Wax Pure Natural (Integra Miltex) and fire-polished with an MF-900 Micro Forge (Narishige), to reduce noise and improve membrane seals. Dissociated cells were viewed using an Eclipse Ti-U Inverted Microscope (Nikon). Transfected cells were identified by their green fluorescence, excited by a DC4104 4-Channel LED Driver (Thorlabs). Positive pressure was applied orally to electrodes before they were lowered to the bottom of the recording chamber using an MP-285 micromanipulator (Sutter Instrument). Once the electrode tip was positioned just above the surface of the cell, the release of the positive pressure was sufficient to form a glass-membrane seal of ≥1 GΩ. Pulses of negative pressure were then delivered to improve the strength of the seal and eventually break through, giving access to the whole-cell patch-clamp configuration. All recordings were done at room temperature.
Voltage commands were delivered through an AxoPatch 200B Amplifier (Axon Instruments). Capacitive transients from the pipette and from the cell were cancelled, cell capacitance and series resistance were monitored to avoid changes >30% over the course of the recording, and series resistance was compensated to the amplifier’s maximum (98%). Currents were acquired at 100 kHz, low-pass Bessel filtered at 5 kHz using a Model 900 Tunable Active Filter (Frequency Devices), and telegraphed via an Axon Digidata 1550 (Molecular Devices). All data was collected and saved digitally using pClamp 10.7 software (Axon Instruments).
Voltage-clamp protocols
When cells were not being recorded, either between protocols or between sweeps within a protocol, they were clamped at a holding potential of −60 mV. To assess channel activation, cells were stepped down to the baseline potential for 300 ms, depolarized to a series of potentials between −110 and +70 mV in increments of 5 mV for 100 ms, and returned to the baseline potential for another 300 ms. This baseline potential was either −100 mV for Nav1.5e or −130 mV in the case of the CN mutants, to counter the latter’s increased propensity for channel inactivation. To assess steady-state inactivation (SSI), cells were stepped down to the baseline potential for 300 ms, given a prepulse that varied from −160 mV to −5 mV in increments of 5 mV for 100 ms, pulsed directly to the test pulse potential of −10 mV for 50 ms, and returned to −100 mV for an additional 300 ms. To assess channel recovery from inactivation, an 80-ms prepulse to −10 mV was applied to inactivate all channels, followed by a −130 mV recovery pulse that lasted between 1 and 25 ms. Following this variable recovery interval, a test pulse to −10 mV was applied to determine the fraction of recovered channels. Leak subtraction was performed on the raw data in a custom Igor Pro (Wavemetrics) program post hoc.
VCF
All experiments conducted on Xenopus laevis were done with the approval of and according to the guidelines established by the Animal Care Committee of the National Institutes of Natural Sciences, an umbrella institution of the National Institute for Physiological Sciences. We obtained the Nav1.5 VCF constructs used by Varga et al. (2015) from J.R. Silva (Washington University, St. Louis, MO) and used SDM, as described previously, to convert them to their respective Nav1.5e variants (with the exception of position 215, which was not mutated to leucine because it was used as a labeling cysteine). The four Nav genes, inserted on pMax vectors, could be linearized using Pacl (Toyobo) and used as a template to generate cRNA using the mMESSAGE T7 RNA transcription kit (Thermo Fisher Scientific).
The oocytes of Xenopus were surgically harvested from anesthetized animals as described previously (Kume et al., 2018). Oocytes were separated and defolliculated using 2 mg/ml collagenase treatment for 6.5 h. Then oocytes were incubated overnight at 17°C in Ringer’s solution containing (in mM): 88 NaCl, 1 KCl, 2.4 NaHCO3, 0.3 Ca(NO3)2, 0.41 CaCl2, 0.82 MgSO4, and 15 HEPES, with pH adjusted to 7.4 with NaOH and use of 0.1% penicillin-streptomycin. The remaining follicular layers were manually peeled. 25 ng of Nav channel cRNA was injected into the vegetal pole of oocytes using Nanoject II (Drummond). Treated oocytes were then returned to their 17°C incubator and left for 1–3 d to express protein.
Oocytes were labeled for 20 min using 10 μM of methanethiosulfonate-carboxytetramethylrhodamine dye on ice. Dye conjugation was done in depolarizing solution (containing, in mM, 110 KCl, 1.5 MgCl2, 0.8 CaCl2, 0.2 EDTA, and 10 HEPES, pH adjusted to 7.1 with KOH) in an effort to expose and label S4 helices. Excess dye was removed by rinsing five times with fresh ND-96 solution (96 mM NaCl, 2 mM KCl, 1.8 mM CaCl2, 1 mM MgCl2, and 5 mM HEPES, with pH adjusted to 7.4 with NaOH). Oocytes in solution were kept on ice until use. Eventually, oocytes were transferred to the recording chamber filled with ND-96 solution, at room temperature, oriented in such a way that fluorescent recordings were done on the animal pole. Voltage clamp for macroscopic current recording was performed by using an amplifier (OC-725C; Warner Instruments). Borosilicate glass capillaries (World Precision Instruments) were used with a resistance of 0.1–0.3 MΩ when filled with 3 M KOAc and 10 mM KCl. The fluorescent recordings were performed with the fluorescence microscope (Olympus BX51WI) equipped with a water-immersion objective lens (Olympus XLUMPLAN FL 20×/1.00). The light source was emitted by a xenon arc lamp (L2194-01; Hamamatsu Photonics) and passed through a bandpass excitation filter (520–550 nm). The intensity of the excitation light was decreased by ND filters (Olympus U-25ND6 and U-25ND25) to prevent the fluorophore from bleaching. Emitted light was passed through a bandpass emission filter (580IF). The emission signals were detected by a photomultiplier (Hamamatsu Photonics H10722-110). The baseline signal was adjusted to 2 V. The detected current and fluorescent signal were acquired by a Digidata 1332 (Axon Instruments) and Clampex 10.3 software (Molecular Devices) at 100 kHz.
Oocytes were held at a baseline of −60 mV between sweeps and protocols. Once we could detect a visible change in fluorescence upon depolarization of the oocyte from −120 mV to +60 mV, we could run the following activation protocol. The oocyte was stepped down to −120 mV for ∼300 ms, hyperpolarized/depolarized to a series of potentials from −180 to +60 mV in increments of 10 mV for 100 ms, and stepped back to −120 mV for ∼300 ms before returning to baseline. The protocol was run and averaged 10 times to improve the signal-to-noise ratio in the fluorescent output. VCF data were analyzed automatically using custom-made Igor Pro scripts.
Data analysis and statistics
where g(t;V) is the experimentally observed channel conductance at time t for voltage step V. In the original method (Armstrong, 2006), OSI was scaled by assuming that 100% of SSI occurs from open states at 0 mV. However, our data displayed significantly more CSI than was observed by Armstrong (2006), and consequently OSI did not necessarily attain a maximum within the tested voltage range. We therefore modified this method by fitting a Boltzmann function, to the unscaled OSI/voltage curve to obtain a scaling factor, i.e., α. This allowed OSI to attain its maximum outside of the observed voltage range. For statistical analysis, Tukey’s method was used after one-way ANOVA, with a significance level of P < 0.01. All data are reported as mean ± SEM.
Modeling
For simulations of Nav channel conductance, two gating schemes were used in the study. The first, which we refer to as Gating Scheme I, is precisely the kinetic model of Nav1.4 developed by Capes et al. (2013) (Fig. 2 A). The second, which we refer to as Gating Scheme II (Fig. 10), is described in the final section of Results. Both schemes were fitted to Nav1.5e data with a custom-made evolutionary fitting algorithm programmed in Matlab 2017b (MathWorks). Microscopic reversibility was enforced. Goodness-of-fit was assessed on z-scores calculated with respect to our experimental observations of the integral, peak amplitude, and time to peak of the activation and inactivation currents, as well as the recovery from inactivation, SSI, and activation I/V curves. The resulting parameter values for Scheme I are reported in Table S2, and those for Scheme II are reported in Table S4.
When performing the two-parameter sensitive analysis in Fig. 3, the first three rightward transitions were accelerated by altering the rate α. Since the final rightward transition is governed by different rates for each row, whenever the rate γ was increased or decreased, the rates γ4 and γi were also changed by the same amount to uniformly alter the final rightward transition. Anywhere it is stated that γ is altered, it is implied that the rates γ4 and γi were also altered commensurately.
All simulations were performed with custom routines written in MATLAB code. As all applied voltage protocols were step functions, solutions to the model were computed using the exponential of the matrix of transition rates. Stochastic simulations were run using the Gillespie algorithm.
Online supplemental material
Figs. S1 and S3 parallel Figs. 1 and 5 and show data for CN adult Nav1.5 (mH1) channels. Fig. S2 demonstrates the relationship between first open latency and time to peak current for Gating Scheme I. Fig. S4 shows the fit of Gating Scheme II to Nav1.5e data. Table S1 presents the summary data for activation, inactivation, and recovery of Nav1.5e and the four CN mutants. Table S2 presents the parameters used to fit Gating Scheme I to Nav1.5e data. Table S3 presents summary VCF data. Table S4 presents the parameters used to fit Gating Scheme II to Nav1.5e data. Table S5 report the parameter changes to refit Gating Scheme II to CN mutant data or to adult Nav1.5 data.
Data availability
All the code and data used in the generation of figures is publicly available at https://github.com/niklasbrake/Nav2022. Raw data is available upon request from the authors.
Results
Voltage sensor charge neutralization identifies the dominant role of DI in channel activation
WT Nav1.5e as well as the four CN mutants were characterized in HEK-293T cells transiently transfected with cDNA. To assess channel activation, macroscopic Na+ currents were recorded while applying depolarizing voltage steps in increments of +5 mV (range, −110 and +70 mV), each from a holding potential of −130 mV (−100 mV for WT channels; Fig. 1 B). The voltage dependence of channel activation for WT and mutant channels was then determined by fitting the peak conductance with a Boltzmann function (Fig. 1 C).
The activation profiles of DI, DII, and DIV-CN mutant Nav1.5e channels were significantly different from WT, with DI charge neutralization producing the greatest impact (Fig. 1 C). Fits of peak conductance–voltage (G/V) relationships estimated the voltage for half-maximal activation (V1/2) to be −16.8 ± 0.45 mV (n = 51) for WT channels compared with −48.1 ± 0.55 mV (n = 24) for DI-CN (Fig. 1 C and Table S1), representing a 30-mV hyperpolarizing shift in channel activation (Q = 57.2; d.f. = 131; k = 5; P < 10−12, Tukey’s range test, significance threshold: P < 0.01). In contrast, charge neutralization of DII and DIII had a more modest effect on channel activation, with V1/2 values of −22.6 ± 0.54 mV (n = 26) and −19.0 ± 0.58 mV (n = 23), respectively (Fig. 1 C), corresponding to hyperpolarizing shifts in activation of ∼6 mV (Q = 10.8, P < 10−9) and 2 mV (Q = 3.91, P = 0.05). Finally, charge neutralization of DIV had the opposite effect on channel activation, shifting the V1/2 value to −7.4 ± 1.26 mV (n = 14; Fig. 1 C), representing a +10-mV depolarizing shift in channel activation compared with WT Nav1.5e (Q = 11.9, P < 10−9). Similar relative shifts in channel activation were observed when DI through DIV voltage sensors were CN in the adult form of Nav1.5 (i.e., mH1), demonstrating that our observations are not specific to the neonatal form of Nav1.5 (Fig. S1). Our observations of Nav1.5 are comparable with previous findings on skeletal muscle Nav1.4 channels, with the exception of DIV-CN, which did not depolarize activation in Nav1.4 (Capes et al., 2013).

Changes in peak G/V following domain neutralization in adult form of Nav1.5, mH1 . Related to Fig. 1. (A) Representative traces of ionic currents corresponding to WT Nav1.5 (cell 20170311c3) and mutant channels (DI-CN, cell 20180301c6; DII-CN, cell 20180711c3; DIII-CN, cell 20180309c12; DIV-CN, cell 20181022c7) in response to depolarizing voltage steps ranging from −110 to 35 mV, following a holding potential of −130 mV (−100 mV for WT), recorded in HEK-293T cells. (B) Summary data corresponding to A, showing normalized peak current following the test pulse, as a function of the test pulse voltage.
Changes in peak G/V following domain neutralization in adult form of Nav1.5, mH1 . Related to Fig. 1. (A) Representative traces of ionic currents corresponding to WT Nav1.5 (cell 20170311c3) and mutant channels (DI-CN, cell 20180301c6; DII-CN, cell 20180711c3; DIII-CN, cell 20180309c12; DIV-CN, cell 20181022c7) in response to depolarizing voltage steps ranging from −110 to 35 mV, following a holding potential of −130 mV (−100 mV for WT), recorded in HEK-293T cells. (B) Summary data corresponding to A, showing normalized peak current following the test pulse, as a function of the test pulse voltage.
DI movement is the rate-limiting step for pore opening
To understand the varied effects of VSD neutralization, we adapted a past Markov gating model of Nav1.4 (Capes et al., 2013; Fig. 2 A). This model (Gating Scheme I) encapsulates the view that DI–III movements are necessary for pore opening and DIV movement is sufficient and rate-limiting for inactivation (Ahern et al., 2016). We refitted the model parameters, allowing the model to successfully capture several functional properties of Nav1.5e WT channels, including its activation, inactivation, and recovery from inactivation behaviors (Fig. 2 and Table S2).
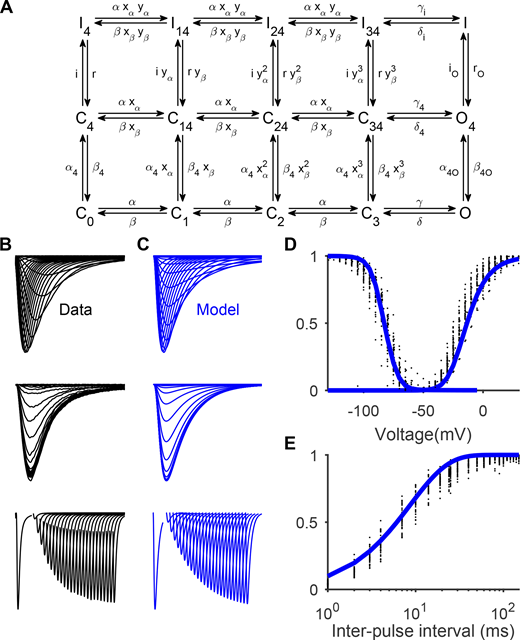
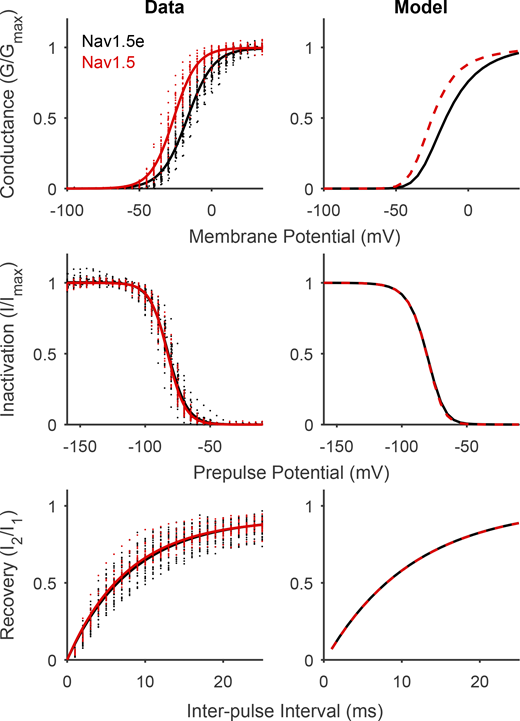
Gating Scheme I fitted to Nav1.5e data. (A) A kinetic model of Nav gating adopted from Capes et al. (2013), referred to here as Gating Scheme I. Horizontal transitions from left to right represent the nonspecific movement of DI–III, followed by pore opening. Vertical transitions from bottom to top represent the movement of DIV followed by the movement of the inactivation gate. (B) From top to bottom, averaged currents recorded from WT Nav1.5e channels during the activation protocol (as in Fig. 1), inactivation protocol (currents elicited by a test pulse to −10 mV, following a conditioning pulse ranging from −160 to −5 mV), and recovery from inactivation protocol (currents elicited by a test pulse of −10 mV, following a holding potential of −10 mV and a hyperpolarizing interpulse of −100 mV lasting 1–150 ms). (C) Model outputs of Gating Scheme I parameterized with the values in Table S2. (D) SSI (left) and G/V (right) curves computed from data (black) and model (blue). (E) Fraction of recovered current as a function of interpulse interval for the WT channel (black) and model (blue).
Gating Scheme I fitted to Nav1.5e data. (A) A kinetic model of Nav gating adopted from Capes et al. (2013), referred to here as Gating Scheme I. Horizontal transitions from left to right represent the nonspecific movement of DI–III, followed by pore opening. Vertical transitions from bottom to top represent the movement of DIV followed by the movement of the inactivation gate. (B) From top to bottom, averaged currents recorded from WT Nav1.5e channels during the activation protocol (as in Fig. 1), inactivation protocol (currents elicited by a test pulse to −10 mV, following a conditioning pulse ranging from −160 to −5 mV), and recovery from inactivation protocol (currents elicited by a test pulse of −10 mV, following a holding potential of −10 mV and a hyperpolarizing interpulse of −100 mV lasting 1–150 ms). (C) Model outputs of Gating Scheme I parameterized with the values in Table S2. (D) SSI (left) and G/V (right) curves computed from data (black) and model (blue). (E) Fraction of recovered current as a function of interpulse interval for the WT channel (black) and model (blue).
It has been proposed that DI-CN hyperpolarizes the G/V relationship because DI movement is rate limiting for pore opening (Capes et al., 2013). Based on this rationale, DIV-CN could depolarize activation by slowing the rate of pore opening. We explored this possibility using the kinetic gating model, in which the rates that determine the transitions from the resting state to the open state are α and γ (see Materials and methods). To investigate how the voltage dependence of the G/V relationship depends on these rates, we performed a sensitivity analysis with respect to both rates (Fig. 3 A). Notably, when α and γ were varied slightly from the fitted parameters, the V1/2 of activation was sensitive only to the rate γ. However, when γ was much faster, the V1/2 did not change and was sensitive only to the rate α (Fig. 3 A). This observation precisely shows that altering a transition to pore opening impacts V1/2 of activation only if the transition was slow compared to the other transitions, i.e., rate limiting. To show this directly, we simulated latencies to first pore opening by running stochastic simulations of the gating model. We found that shifts in the G/V relationship were associated with similar shifts in median first latency times (Fig. 3 A). In fact, these results indicated that changes to the activation pathway depolarized the G/V relationship only if they also slowed the latency to first channel opening (Fig. 3 A). The model predicts, therefore, that if DI movement is rate limiting for pore opening, then DI-CN should have faster latencies to pore opening. Importantly, if DIV-CN promotes a depolarization shift in the G/V relationship by affecting the activation pathway, then it must slow the latency to pore opening (Fig. 3 A). For macroscopic current recordings, the model predicts that if DI-CN accelerates pore opening, then DI-CN mutant channels should display faster current rise times (Figs. 3, B–D; and Fig. S2). Conversely, if DIV-CN channels slow activation, we would expect them to display slower current rise times (Figs. 3 D and S2).

A model of Nav gating predicts changes in current rise time. (A) Left: Sensitivity analysis for V1/2 of activation with respect to parameters α and γ (see Materials and methods). The point (1,1) indicates the baseline parameters fitted to the data (Fig. 2). Bluer hues indicate a more hyperpolarized activation curve, and redder hues indicate depolarized activation curves. Right: The average time to first pore opening, i.e., first latency, was computed for various values of α and γ following a voltage step from −130 to −30 mV. Bluer and redder hues indicate fast and slower latencies, respectively, with respect to baseline parameters. (B) Middle: Representative traces of the WT Nav1.5 model response to the activation protocol. Right: γ* has been decreased fivefold to simulate a slower activation rate. Left: γ* has been increased fivefold to simulate a faster activation rate. (C) G/V plots calculated from the traces of corresponding color in B. (D) Time to peak current calculated from the traces of corresponding color in B. (E) Representative traces showing the current (normalized to peak amplitude) elicited by the indicated voltage steps for WT (black; cell 20170428c1) and DI-CN mutant (red; cell 20180307c1) channels. (F) Time to peak current induced by voltage pulses ranging from −75 to 30 mV, starting from a holding potential of −130 mV, for Nav1.5e (black) and the four CN mutants. Line represents median; shading is 5–95% quantile interval. Time to peak was not calculated at voltages that did not elicit a current.
A model of Nav gating predicts changes in current rise time. (A) Left: Sensitivity analysis for V1/2 of activation with respect to parameters α and γ (see Materials and methods). The point (1,1) indicates the baseline parameters fitted to the data (Fig. 2). Bluer hues indicate a more hyperpolarized activation curve, and redder hues indicate depolarized activation curves. Right: The average time to first pore opening, i.e., first latency, was computed for various values of α and γ following a voltage step from −130 to −30 mV. Bluer and redder hues indicate fast and slower latencies, respectively, with respect to baseline parameters. (B) Middle: Representative traces of the WT Nav1.5 model response to the activation protocol. Right: γ* has been decreased fivefold to simulate a slower activation rate. Left: γ* has been increased fivefold to simulate a faster activation rate. (C) G/V plots calculated from the traces of corresponding color in B. (D) Time to peak current calculated from the traces of corresponding color in B. (E) Representative traces showing the current (normalized to peak amplitude) elicited by the indicated voltage steps for WT (black; cell 20170428c1) and DI-CN mutant (red; cell 20180307c1) channels. (F) Time to peak current induced by voltage pulses ranging from −75 to 30 mV, starting from a holding potential of −130 mV, for Nav1.5e (black) and the four CN mutants. Line represents median; shading is 5–95% quantile interval. Time to peak was not calculated at voltages that did not elicit a current.
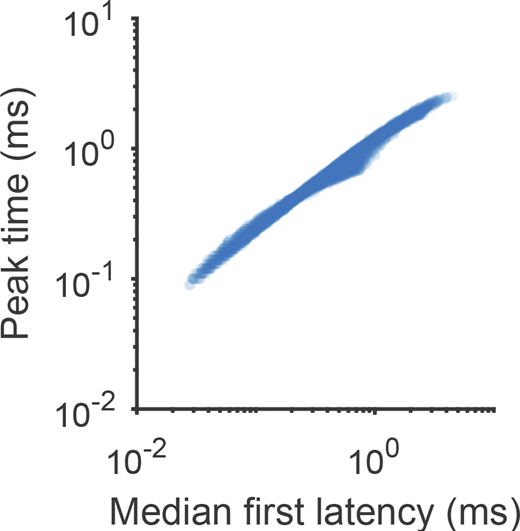
Correlation between time to peak current and latency to first channel opening in Nav1.5e gating model. Related to Fig. 3. Gating Scheme I was simulated with different parameter combinations. The rate α and the rates γ, γi, and γ4 were varied from 10-fold less to 10-fold more than their fitted values (Table S2). The median first open latency across 1,000 stochastic simulations is plotted against the peak time of the macroscopic current for each parameter combination.
Correlation between time to peak current and latency to first channel opening in Nav1.5e gating model. Related to Fig. 3. Gating Scheme I was simulated with different parameter combinations. The rate α and the rates γ, γi, and γ4 were varied from 10-fold less to 10-fold more than their fitted values (Table S2). The median first open latency across 1,000 stochastic simulations is plotted against the peak time of the macroscopic current for each parameter combination.
To test these model predictions, we measured the latency to peak current of each mutant Nav channel (Fig. 3, E and F). As anticipated, DI-CN channels displayed faster rise times at hyperpolarized membrane potentials (Fig. 3 F), suggesting that DI movement is rate limiting for pore opening. The rise times of DII-CN and DIII-CN mutant channels were consistent with their more modest impacts on the V1/2 of channel activation (Figs. 1 C and 3 F). DIV-CN mutants did not display different response rise times relative to WT channels (Fig. 3 F). This observation suggests that neutralizing DIV does not change the rate of pore opening, consistent with the idea that DIV is not directly involved in the activation process (Ahern et al., 2016). We therefore concluded that DIV-CN must shift the G/V relationship through a separate mechanism.
Neutralizing DIV alters activation by increasing inactivation from closed states
The foregoing results suggest that DIV-CN affects the G/V relationship through alterations in the inactivation pathways. To investigate this further, we determined how Gating Scheme I would behave upon increasing the propensity of DIV to transition from its resting to its active state. We accomplished this by increasing the DIV forward rates α4 and α4O by 20-fold and by decreasing the DIV backward rates β4 and β4O by 20-fold (Fig. 4 A). Surprisingly, biasing DIV led to a depolarizing shift in the G/V relationship (Fig. 4, B and D), consistent with our experimental observations from Nav1.5e DIV-CN mutants (Fig. 1 C). We obtained such behavior because the voltage dependence of activation is determined by the voltage when pore opening occurs faster than inactivation (Fig. 4 C), whereupon channel inactivation shifts from CSI to OSI. When DIV-CN is simulated, inactivation is faster (Fig. 4 E), shifting the balance toward CSI and thus requiring more depolarized voltages for pore opening to outcompete inactivation. These modeling results thus demonstrate that the effect of neutralizing DIV on the G/V relationship is consistent with DIV movement being rate limiting for inactivation (Capes et al., 2013).

G/V consequences of DIV-CN is consistent with removing rate-limiting step for inactivation. (A) Schematic depicting how CN was simulated in the gating model. The leftmost column of states was removed to simulate the charge neutralization of a nonspecific domain whose movement is necessary for pore opening (yellow). We refer to this model as the DII-CN model. The rates α4 and α4O were increased 20-fold, and β4 and β4O were decreased 20-fold to approximate the removal of the bottom row, thereby simulating DIV-CN (blue). (B) The G/V and SSI curves produced by the model before any manipulations (identical to Fig. 2). (C) The median latency to first inactivation (solid line) and first pore opening (dashed line) were determined at a range of voltages from stochastic simulations of the gating model. This panel shows that the G/V curve in B is nonzero at voltages where pore opening occurs faster on average than channel inactivation. (D) The G/V and SSI curves produced by the model following simulated DIV-CN (blue) overlaid with the original curves from B (black). SSI is hyperpolarized, and G/V is depolarized in the DIV-CN model. (E) Same as C, but for the DIV-CN model. The rate of inactivation is faster, whereas the rate of pore opening is relatively unchanged. (F and G) Same as D and E, but for the DII-CN model. The SSI curve is hyperpolarized, and the G/V curve is unchanged in the DII-CN model. The rate of inactivation is faster at hyperpolarized potentials.
G/V consequences of DIV-CN is consistent with removing rate-limiting step for inactivation. (A) Schematic depicting how CN was simulated in the gating model. The leftmost column of states was removed to simulate the charge neutralization of a nonspecific domain whose movement is necessary for pore opening (yellow). We refer to this model as the DII-CN model. The rates α4 and α4O were increased 20-fold, and β4 and β4O were decreased 20-fold to approximate the removal of the bottom row, thereby simulating DIV-CN (blue). (B) The G/V and SSI curves produced by the model before any manipulations (identical to Fig. 2). (C) The median latency to first inactivation (solid line) and first pore opening (dashed line) were determined at a range of voltages from stochastic simulations of the gating model. This panel shows that the G/V curve in B is nonzero at voltages where pore opening occurs faster on average than channel inactivation. (D) The G/V and SSI curves produced by the model following simulated DIV-CN (blue) overlaid with the original curves from B (black). SSI is hyperpolarized, and G/V is depolarized in the DIV-CN model. (E) Same as C, but for the DIV-CN model. The rate of inactivation is faster, whereas the rate of pore opening is relatively unchanged. (F and G) Same as D and E, but for the DII-CN model. The SSI curve is hyperpolarized, and the G/V curve is unchanged in the DII-CN model. The rate of inactivation is faster at hyperpolarized potentials.
We next asked whether the model could also capture the (lack of) effect of DII- and DIII-CN on the G/V relationship. Since the first three activation transitions in Gating Scheme I all use the same rates, each transition could not be independently altered. We therefore simply removed the leftmost column of the model, consisting of the states C0, C4, and I4 (Fig. 4 A). This is equivalent to assuming that the first step in the activation process is already complete; that is, the relevant domain has been biased toward its “active” conformation. Although this manipulation did not affect channel activation, it unexpectedly produced a leftward shift in the SSI curve (Fig. 4 F). This leftward shift occurred because of positive cooperativity between channel activation and inactivation (xα/xβ > 1, yα/yβ > 1; see Table S2): removing the first column of states accelerated the rate of CSI, thereby increasing the total amount of SSI (Fig. 4, F and G). We tested this prediction in the following sections.
All voltage sensors contribute to SSI of Nav1.5e channels
SSI of WT and mutant Nav1.5e channels was determined by applying a 100-ms-long conditioning pulse (range, −160 to −5 mV) followed by a test pulse of −10 mV to elicit Na+ currents (Fig. 5, A and B). SSI plots were then constructed by fitting the peak response at each test potential with a Boltzmann function (Fig. 5 C). The largest impact on SSI occurred from neutralizing DIV, shifting the V1/2 from −82.0 ± 0.52 mV in WT channels to −131.1 ± 2.55 mV (n = 13) in DIV-CN mutants (Q = 27.6, d.f. = 126, k = 5, P < 10−15; Tukey’s range test). The slope factor for the inactivation curve was significantly flatter for DIV-CN mutants (k = −13.7 ± 1.46, n = 13) than for WT Nav1.5e channels (k = −7.2 ± 0.14, n = 49; Q = 18.1, d.f. = 126, k = 5, P < 10−5; Tukey’s range test), indicating a lower sensitivity to membrane potential. Charge neutralization of DIII affected SSI in a manner similar to neutralizing DIV, hyperpolarizing the V1/2 of inactivation by 40 mV to −120.0 ± 1.09 mV (n = 23; Q = 26.0, P < 10−15) and flattening the SSI slope factor to −14.4 ± 0.15 (n = 23; Q = 14.2, P < 10−12). Although measurements of SSI for DI and DII-CN mutants differed from WT Nav1.5e, the shift was less than for DIII and DIV-CN mutants. The V1/2 of inactivation was estimated to be −100.9 ± 0.54 mV (n = 23) and −96.5 ± 0.82 mV (n = 25) for DI and DII-CN mutants, respectively (Fig. 5 C), corresponding approximately to 20 mV (Q = 12.9, P < 10−9) and 15 mV (Q = 10.3, P < 10−9) hyperpolarizing shifts. Similar relative shifts in SSI were also observed from CN adult Nav1.5 channel mutants (Fig. S3), again demonstrating that our observations are not specific to the neonatal form of Nav1.5.
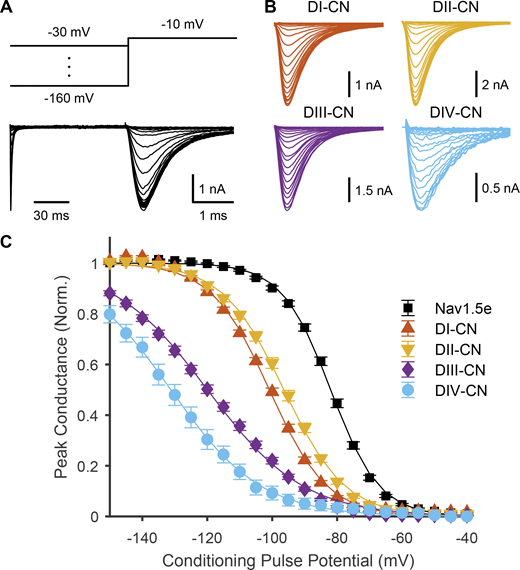
Impact of neutralizing VSDs on channel inactivation. (A) Top: Voltage-step protocol used to assess SSI. Conditioning pulses ranging from −160 to −30 mV were applied prior to a test pulse to −10 mV. Bottom: Representative traces of ionic currents through WT Nav1.5e (cell 20170418c3) elicited by voltage protocol shown above. The time scale during the test pulse is slowed (30:1 ratio) to show the dynamics of the current more clearly. (B) Representative traces of currents through the four CN mutants (DI-CN, cell 20180307c1; DII-CN, cell 20180316c1; DIII-CN, cell 20180712c3; DIV-CN, cell 20190318c3) following the test pulse to −10 mV. (C) Summary data corresponding to A and B, showing normalized peak current following the test pulse, as a function of the conditioning pulse voltage. Solid lines are fitted Boltzmann curves. Parameters are reported in Table S1.
Impact of neutralizing VSDs on channel inactivation. (A) Top: Voltage-step protocol used to assess SSI. Conditioning pulses ranging from −160 to −30 mV were applied prior to a test pulse to −10 mV. Bottom: Representative traces of ionic currents through WT Nav1.5e (cell 20170418c3) elicited by voltage protocol shown above. The time scale during the test pulse is slowed (30:1 ratio) to show the dynamics of the current more clearly. (B) Representative traces of currents through the four CN mutants (DI-CN, cell 20180307c1; DII-CN, cell 20180316c1; DIII-CN, cell 20180712c3; DIV-CN, cell 20190318c3) following the test pulse to −10 mV. (C) Summary data corresponding to A and B, showing normalized peak current following the test pulse, as a function of the conditioning pulse voltage. Solid lines are fitted Boltzmann curves. Parameters are reported in Table S1.

Changes in SSI following domain neutralization in adult form of Nav1.5, mH1. Related to Fig. 3. (A) Representative traces of ionic currents corresponding to WT Nav1.5 (cell 20170311c3) and mutant channels (DI-CN, cell 20180301c6; DII-CN, cell 20180711c3; DIII-CN, cell 20180309c12; DIV-CN, cell 20190305c4) in response to a test pulse to −10 mV following conditioning pulses ranging from −160 to −30 mV. (B) Summary data corresponding to A, showing normalized peak current following the test pulse, as a function of the conditioning pulse voltage.
Changes in SSI following domain neutralization in adult form of Nav1.5, mH1. Related to Fig. 3. (A) Representative traces of ionic currents corresponding to WT Nav1.5 (cell 20170311c3) and mutant channels (DI-CN, cell 20180301c6; DII-CN, cell 20180711c3; DIII-CN, cell 20180309c12; DIV-CN, cell 20190305c4) in response to a test pulse to −10 mV following conditioning pulses ranging from −160 to −30 mV. (B) Summary data corresponding to A, showing normalized peak current following the test pulse, as a function of the conditioning pulse voltage.
Nav channels exhibit different degrees of CSI
Our data show that neutralizing Nav1.5 voltage sensors affects channel activation and inactivation differently than reported for Nav1.4 channels (Capes et al., 2013). Specifically, DIV-CN depolarizes activation in Nav1.5, but not in Nav1.4, and DI–III hyperpolarizes SSI in Nav1.5, but not in Nav1.4. The differences in DI-, DII-, and DIV-CN can nevertheless be explained by a single gating scheme. Because CSI is central to the proposed mechanisms (Fig. 4), we hypothesized that Nav1.4 and Nav1.5 may display different degrees of CSI. To explore variation in inactivation among Nav channels, we collected data from three different Nav channels: namely, skeletal muscle Nav1.4 channels, cardiac Nav1.5 channels, and neuronal Nav1.6 channels.
To begin, we measured the fraction of inactivation occurring from open states (OSI) in each Nav isoform during 80-ms voltage steps ranging from −160 to −5 mV (Fig. 6, A and B; see Materials and methods). We then fitted Boltzmann functions to the resulting OSI–voltage curves to quantify its voltage dependence. In Nav1.5e, the V1/2 of OSI was −31.2 ± 0.4 mV (n = 48), which was significantly more hyperpolarized than Nav1.4 (−21.4 ± 0.5 mV, n = 21; P < 10−9; Tukey’s range test, k = 3, d.f. = 88) and Nav1.6 (−22.0 ± 0.2 mV, n = 22; P < 10−9). The OSI of Nav1.4 and Nav1.6 did not display distinct voltage dependences (P = 0.67). Overall, OSI followed a trend similar to SSI: SSI was also more hyperpolarized in Nav1.5e (Fig. 5 C) compared with Nav1.4 (−65.0 ± 0.4 mV, n = 21; P < 10−9) and Nav1.6 (−55.7 ± 0.6 mV, n = 26; P < 10−9; Fig. 6 C). However, unlike OSI, SSI had significantly different voltage dependences between Nav1.4 and Nav1.6, with Nav1.6 displaying a more depolarized SSI curve (P < 10−9; Fig. 6 C). This latter finding demonstrates that SSI and OSI can vary independently of each other among different Nav channel isoforms.

CSI is variable among Nav isoforms. (A) Representative Nav1.5e currents in response to voltage steps from −130 mV to −80 (top), −50 (middle), and −20 mV (bottom). The amount of OSI at each voltage was computed based on the integral of these transient currents (gray shading). See Materials and methods for details. (B) Amount of OSI at voltages ranging from −90 to −5 mV for three Nav isoforms: Nav1.5e (black), Nav1.4 (red), and Nav1.6 (blue). Dots are values from individual recordings, and solid lines are fitted Boltzmann curves. Boltzmann parameters are reported in the text. (C) SSI curves of the three Nav channel isoforms. Boltzmann parameters are reported in the text. (D) CSI was computed as the difference between SSI and OSI. Solid lines are the difference of two Boltzmann functions fitted to the data. (E) Total CSI was defined as the integral of the CSI curves reported in D. Colored dots represent individual cells. The white dots report the mean values for each isoform, and the black lines and shading represent box plots of the data. The Nav channel isoforms display distinct levels of total CSI.
CSI is variable among Nav isoforms. (A) Representative Nav1.5e currents in response to voltage steps from −130 mV to −80 (top), −50 (middle), and −20 mV (bottom). The amount of OSI at each voltage was computed based on the integral of these transient currents (gray shading). See Materials and methods for details. (B) Amount of OSI at voltages ranging from −90 to −5 mV for three Nav isoforms: Nav1.5e (black), Nav1.4 (red), and Nav1.6 (blue). Dots are values from individual recordings, and solid lines are fitted Boltzmann curves. Boltzmann parameters are reported in the text. (C) SSI curves of the three Nav channel isoforms. Boltzmann parameters are reported in the text. (D) CSI was computed as the difference between SSI and OSI. Solid lines are the difference of two Boltzmann functions fitted to the data. (E) Total CSI was defined as the integral of the CSI curves reported in D. Colored dots represent individual cells. The white dots report the mean values for each isoform, and the black lines and shading represent box plots of the data. The Nav channel isoforms display distinct levels of total CSI.
We next investigated CSI in each Nav channel isoform. Because all SSIs not occurring from an open state must have occurred directly from a closed state, we computed CSI as the difference between OSI and SSI (Armstrong, 2006). For Nav1.5e, CSI peaked at 100% of all SSIs and remained high for a large range of voltages (Fig. 6 D). On the other hand, Nav1.4 displayed a smaller but still substantial level of CSI (Fig. 6 D), with Nav1.6 displaying the least amount. To quantitatively compare CSI between isoforms, we fitted the CSI curves with the difference of two Boltzmann curves; the integral of this function was defined to be the total amount of CSI (Fig. 6 D). This analysis confirmed that the isoforms exhibited three distinct levels of CSI, with Nav1.5e displaying the most CSI, followed by Nav1.4, and finally Nav1.6 (Fig. 6 E). Overall, these data demonstrate that CSI of the Nav channel isoforms is different.
Degree of CSI determines consequences of voltage sensor neutralization
Given these findings, we aimed to determine whether lower CSI indeed leads to a more Nav1.4-like behavior following domain neutralization. To test this, we modified the Nav1.5 parameterization of Gating Scheme I to decrease the amount of CSI. We forced DIV to move exclusively after pore opening by decreasing the likelihood of DIV movement before pore opening (α4 decreased by 20-fold and β4 increased by 20-fold) and increasing the likelihood of DIV movement after pore opening (α4O increased by 20-fold and β4O decreased by 20-fold; Fig. 7 A). As expected, this parameter manipulation significantly reduced the amount of CSI compared with the original Nav1.5e model (Fig. 7 B). To understand how the sequential order of domain activation was altered, we measured the median latency to DIV movement and compared this against latency to DI–III movement in stochastic simulations of the two models; these simulations confirmed that the low CSI model followed a strict DIV-last domain movement order, unlike the Nav1.5e model in which DIV consistently moved before DI–III at all voltages less than −50 mV (Fig. 7 C).

CSI determines consequences of voltage sensor neutralization. (A) Schematic of the low CSI gating model. The thick black arrows represent the following parameter changes: rates α4 and β4O have been decreased 20-fold, and rates α4O and β4 have been increased 20-fold, in an effort to bias the channel away from CSI and toward OSI. (B) The probability (Prob.) of CSI during voltage steps from −130 mV to voltages ranging from −130 to 60 mV, computed from 1,000 stochastic simulations of the original Nav1.5e model (gray) and the low CSI model (black). The low CSI model has a significantly lower probability of CSI across all voltages. (C) Latencies were computed from the same simulations as B. Black lines represent the median latency until the Nav1.5e model (left) and low CSI model (right) reached the two rightmost columns of states, i.e., when DI–III had all moved. Red lines represent the median latency until the models reached the middle or top rows of states, i.e., latency to DIV movement. (D) The same manipulations for simulating DII-CN presented in Fig. 4 were applied to the low CSI model. In the low CSI model, DII-CN did not shift SSI significantly. (E) The same manipulations for simulating DIV-CN presented in Fig. 4 were applied to the low CSI model. This manipulation did not shift G/V significantly.
CSI determines consequences of voltage sensor neutralization. (A) Schematic of the low CSI gating model. The thick black arrows represent the following parameter changes: rates α4 and β4O have been decreased 20-fold, and rates α4O and β4 have been increased 20-fold, in an effort to bias the channel away from CSI and toward OSI. (B) The probability (Prob.) of CSI during voltage steps from −130 mV to voltages ranging from −130 to 60 mV, computed from 1,000 stochastic simulations of the original Nav1.5e model (gray) and the low CSI model (black). The low CSI model has a significantly lower probability of CSI across all voltages. (C) Latencies were computed from the same simulations as B. Black lines represent the median latency until the Nav1.5e model (left) and low CSI model (right) reached the two rightmost columns of states, i.e., when DI–III had all moved. Red lines represent the median latency until the models reached the middle or top rows of states, i.e., latency to DIV movement. (D) The same manipulations for simulating DII-CN presented in Fig. 4 were applied to the low CSI model. In the low CSI model, DII-CN did not shift SSI significantly. (E) The same manipulations for simulating DIV-CN presented in Fig. 4 were applied to the low CSI model. This manipulation did not shift G/V significantly.
Simulating DII-CN with this “low CSI” parameterization did not appreciably alter gating (Fig. 7 D), consistent with experimental observations of Nav1.4 (Capes et al., 2013). Similarly, simulating DIV-CN, as previously done (Fig. 4 A), did not cause a depolarization shift in the G/V relationship (Fig. 7 E), again consistent with Nav1.4 experiments (Capes et al., 2013). Together, these observations suggest that the consequences of DI- and DII-CN on inactivation, and the effects of DIV-CN on channel activation, can be determined by the channel’s intrinsic kinetics, and specifically the propensity for CSI. Thus, the effects of CN on Nav1.4 gating are consistent with a strict DIV-last gating sequence, whereas our Nav1.5e data indicate a channel preference for an early DIV gating sequence.
Neutralizing domain III and IV increases rate into CSI
At this point, all CN experimental results could be explained with Gating Scheme I, except for those associated with DIII-CN. The CN experiments suggest that, at least for Nav1.5, both DIII and DIV may be involved directly in inactivation, since their neutralization led to both a dramatic hyperpolarization of SSI and a decreased sensitivity of inactivation to changes in membrane potential. To investigate how the various domains, particularly DIII, contribute to the kinetics of inactivation, we measured the rate of recovery from inactivation for each CN mutant. An 80-ms prepulse to −10 mV was applied to inactivate all channels, followed by a −130-mV recovery pulse that lasted between 1 and 25 ms. After this variable recovery interval, a test pulse to −10 mV was applied to determine the fraction of recovered channels (Fig. 8 A). Recovery curves were constructed by computing the peak current ratio between the prepulse and test pulse for each recovery interval (Fig. 8 B). This measurement revealed that neutralizing each domain slowed recovery from inactivation. To quantify these effects, recovery rate was estimated by fitting the curves with a biexponential function (see Materials and methods). This quantification confirmed that all mutants slowed the rate of recovery (Fig. 8 B).
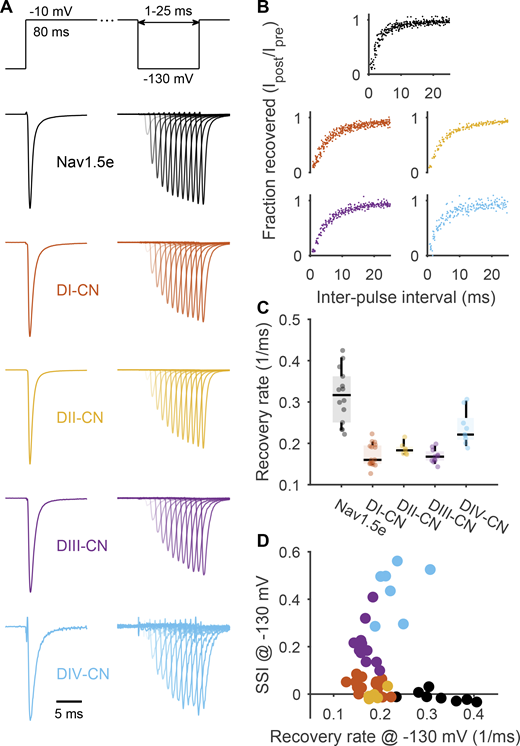
Neutralizing every voltage sensor in Nav1.5e slows recovery from inactivation. (A) Top: Voltage-step protocol used to assess recovery from inactivation. Conditioning pulse of −10 mV was applied for 80 ms to inactivate channels before stepping to a variable length recovery pulse at −130 mV. After an interpulse interval ranging from 1 to 25 ms, a −10-mV test pulse was applied to assess the fraction of recovered channels. Bottom: Representative traces of ionic currents through WT Nav1.5e and the four CN mutant channels. (B) Recovery curves of WT Nav1.5e and the four CN mutant channels. Color scheme is the same as in A. Recovery curves were constructed by computing the ratio of peak currents evoked by the conditioning pulse to those evoked by the test pulse following each interpulse interval. All CN mutants display slower recovery curves. (C) Recovery rates were determined by fitting each recovery curve to the equation, f(t) = Aexp(α1t) + (1 − A)exp(α2t) and were defined as αw = Aα1 + (1 − A)α2. See Table S1 for summary values. (D) The recovery rates determined from each cell are plotted against the amount of SSI at −130 mV. Even though all CN mutants have similar recovery rates at this potential, DIII- and DIV-CN display significantly more SSI.
Neutralizing every voltage sensor in Nav1.5e slows recovery from inactivation. (A) Top: Voltage-step protocol used to assess recovery from inactivation. Conditioning pulse of −10 mV was applied for 80 ms to inactivate channels before stepping to a variable length recovery pulse at −130 mV. After an interpulse interval ranging from 1 to 25 ms, a −10-mV test pulse was applied to assess the fraction of recovered channels. Bottom: Representative traces of ionic currents through WT Nav1.5e and the four CN mutant channels. (B) Recovery curves of WT Nav1.5e and the four CN mutant channels. Color scheme is the same as in A. Recovery curves were constructed by computing the ratio of peak currents evoked by the conditioning pulse to those evoked by the test pulse following each interpulse interval. All CN mutants display slower recovery curves. (C) Recovery rates were determined by fitting each recovery curve to the equation, f(t) = Aexp(α1t) + (1 − A)exp(α2t) and were defined as αw = Aα1 + (1 − A)α2. See Table S1 for summary values. (D) The recovery rates determined from each cell are plotted against the amount of SSI at −130 mV. Even though all CN mutants have similar recovery rates at this potential, DIII- and DIV-CN display significantly more SSI.
To determine how each mutant affects the rate into inactivation, we plotted the rate of recovery from inactivation against SSI measured at −130 mV (Fig. 8 D). At this voltage, DIII- and DIV-CN mutants displayed significantly more SSI than DI- and DII-CN mutants; however, they did not display slower rates of recovery from inactivation (Fig. 8 D). This observation indicates that the larger SSI shift from neutralizing DIII and DIV must result from accelerating the rate into inactivation. Since all SSI at this potential is CSI (Fig. 6), we can conclude that the dramatic SSI shifts of DIII and DIV-CN mutants are largely a result of faster rates into CSI.
VCF reveals that DIII and DIV are necessary for Nav1.5 inactivation
One of the arguments for DIV sufficiency in inactivation is that neutralizing DIV in Nav1.4 leads to a shift in SSI that is so hyperpolarized, domains with intact voltage sensors must be in their deactivated state (Ahern et al., 2016; Capes et al., 2013). To test whether this is indeed the case for the neonatal Nav1.5 used in this study, we quantified the intrinsic voltage sensitivity of each domain in Xenopus oocytes using VCF. Fluorescent probes were conjugated to each domain, thereby engineering four domain-tagged VCF constructs: DI*, DII*, DIII*, and DIV*. Steady-state fluorescence was then measured at voltage steps ranging from −150 mV (−180 mV for DIII*) to 50 mV (Fig. 9, A–D).
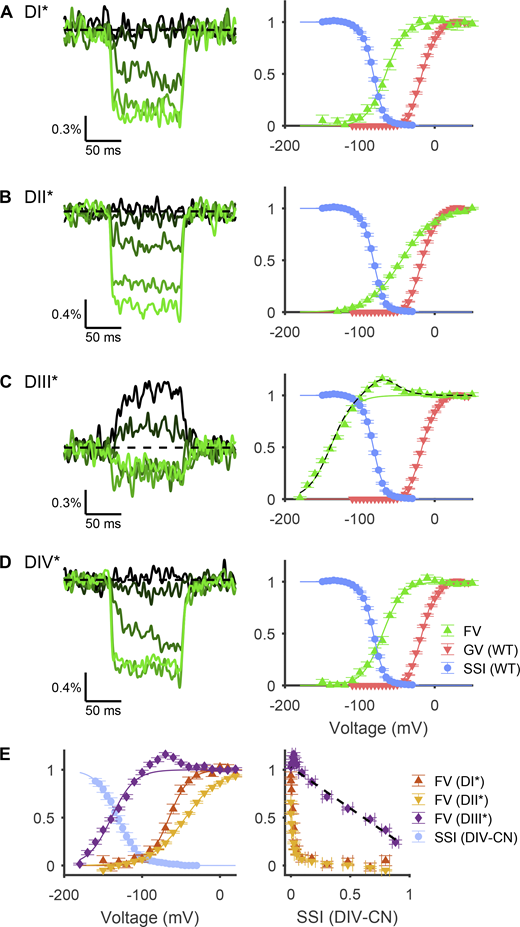
Voltage dependence of fluorescence from tagged VSDs. (A) Left: Representative fluorescence signals from a DI-tagged VCF construct (cell 20180510c2), recorded in Xenopus oocytes, in response to voltage steps of −140, −100, −60, −20, and +20 mV, shown by color from darkest to lightest hue. Right: Voltage dependence of normalized fluorescence change from baseline (green triangles). Solid green line is a fitted Boltzmann curve, parameters for which are reported in Table S3. Overlaid are the SSI (blue circles) and G/V curve (red inverted triangles) of WT Nav1.5e channels (Figs. 1 and 5). (B) Same as A, but for DII-tagged VCF constructs (representative traces from cell 20180512c1). (C) Left: Representative traces for DIII-tagged VCF constructs (cell 20180518c4) in response to voltage steps of −180, −140, −100, −60, and −20 mV. Right: The dashed black line is the sum of the solid green line plus the derivative of the solid green line from D. (D) Same as A, but for DIV-tagged VCF constructs (representative traces from cell 20180514c5). (E) Left: Light blue circles represent the SSI curve from DIV-CN mutants (Fig. 5) overlaid with the F/V relationship of VCF constructs DI*–DIII* (A–C). Right: Fluorescence change from baseline plotted against the SSI curve of DIV-CN. Line of best fit for DIII* versus DIV-CN SSI is shown as dashed black line (R2 = 0.97).
Voltage dependence of fluorescence from tagged VSDs. (A) Left: Representative fluorescence signals from a DI-tagged VCF construct (cell 20180510c2), recorded in Xenopus oocytes, in response to voltage steps of −140, −100, −60, −20, and +20 mV, shown by color from darkest to lightest hue. Right: Voltage dependence of normalized fluorescence change from baseline (green triangles). Solid green line is a fitted Boltzmann curve, parameters for which are reported in Table S3. Overlaid are the SSI (blue circles) and G/V curve (red inverted triangles) of WT Nav1.5e channels (Figs. 1 and 5). (B) Same as A, but for DII-tagged VCF constructs (representative traces from cell 20180512c1). (C) Left: Representative traces for DIII-tagged VCF constructs (cell 20180518c4) in response to voltage steps of −180, −140, −100, −60, and −20 mV. Right: The dashed black line is the sum of the solid green line plus the derivative of the solid green line from D. (D) Same as A, but for DIV-tagged VCF constructs (representative traces from cell 20180514c5). (E) Left: Light blue circles represent the SSI curve from DIV-CN mutants (Fig. 5) overlaid with the F/V relationship of VCF constructs DI*–DIII* (A–C). Right: Fluorescence change from baseline plotted against the SSI curve of DIV-CN. Line of best fit for DIII* versus DIV-CN SSI is shown as dashed black line (R2 = 0.97).
In agreement with other VCF studies of Nav1.5 channels, the F/V curve for DI* was more hyperpolarized than that for DII* (Fig. 9, A and B; Hsu et al., 2017; Varga et al., 2015). The voltage dependence of the fluorescence signal of both DI* and DII* exhibited V1/2 values of −65.4 ± 2.3 mV (n = 13) and −44.1 ± 0.7 mV (n = 17; Q = 13.8, d.f. = 68, k = 4, P < 10−5; Tukey’s range test), respectively, which were ∼10 mV more depolarized than V1/2 values reported for adult Nav1.5 channels (Hsu et al., 2017; Varga et al., 2015). This difference is in keeping with the more depolarized threshold for activation of Nav1.5e channels compared with the adult Nav1.5 splice variant (Onkal et al., 2008). Notably, the F/V plot of DII* had a shallower slope (k = 22.2 ± 0.6, n = 17) compared with DI* (k = 12.3 ± 1.2, n = 13; Q = 11.5, P < 10−5, d.f. = 68, k = 4; Tukey’s range test), indicating that DII has a lower sensitivity to changes in membrane potential.
The normalized F/V relationship for DIII* was significantly more hyperpolarized than those for DI* (Q = 45.2, P < 10−5) and DII* (Q = 13.8, P < 10−5), with a V1/2 value of −137.4 ± 1.1 mV (n = 27) and a slope factor of 15.9 ± 0.6 (Fig. 9, C and D). Interestingly, the fluorescence signal was biphasic, reaching a maximum at approximately −50 mV and declining in intensity at more depolarized potentials (Fig. 9 C). This finding suggests that the voltage sensor of DIII may exhibit two distinct movements, analogous to the dynamics of the voltage sensor reported for Shaker K+ channels (Cha and Bezanilla, 1997) and DIII of Nav1.4 channels (Cha et al., 1999).
The F/V relationship observed for DIV* fluorescence occurred over a voltage range similar to that of SSI in WT channels (Fig. 9 D), in keeping with the role of this domain in inactivation. The V1/2 value was −69.5 ± 1.3 mV (n = 15), and the slope factor was 13.2 ± 0.5 mV. Interestingly, at potentials with observed DIV movement, the F/V relationship of DIII* deviates distinctly from a Boltzmann function. We observed that the fluorescence change of DIII was well fitted by a Boltzmann function plus the derivative of the DIV* Boltzmann fit (Fig. 9 C). This observation seems to suggest an interaction between DIII and DIV movement, or between DIII and the binding of the inactivation motif.
Finally, the voltage dependence of the F/V plot for DIII* was strongly correlated with measurements of SSI in DIV-CN mutants (Fig. 9 E). In fact, plotting the SSI of DIV-CN mutants versus the fluorescence signal of DIII* at each membrane potential displayed a strong linear correlation (Fig. 9 E). In contrast, the F/V curves for DI* and DII* were too depolarized to be correlated to SSI in DIV-CN mutants. This finding suggests that in the absence of DIV gating charges, DIII movement determines the voltage-dependence of SSI. Together with our previous results, this observation indicates that in Nav1.5, both DIII and DIV are intrinsically necessary for channel inactivation, whereas DI and DII are not.
A structurally constrained Nav1.5 gating model
To summarize all our results, we introduce Gating Scheme II (Fig. 10 A). In this modified model, both DIII and DIV must move before channel inactivation, as opposed to Gating Scheme I, in which DIV is sufficient for inactivation. Although we did not find direct evidence that DIII is necessary for pore opening, we kept the formalism from the first gating scheme and made DI–III all necessary for pore opening. Another feature of Scheme II is that we identified a specific domain order for the activation sequence. Whereas previously, DI–III moved in a nonspecific order before pore opening (Fig. 2), here we identified the first transition with DIII, the second with DII, and the last with DI. This was motivated by several observations. First, DIII is active at much more negative voltages than DI and II (Fig. 9 B), making it likely that it would be first to activate during physiological changes in membrane potential. Additionally, DIII had the smallest effect on the peak G/V (Fig. 1), suggesting that the domain contributes least to the rate of pore opening (Fig. 3). Finally, because we found DI to be rate limiting for pore opening (Fig. 3), we made its activation the final step to pore opening. However, we note that these three domains are expected to activate in parallel (Chanda and Bezanilla, 2002) and stress that this sequential model is merely to reduce the complexity of the gating scheme.
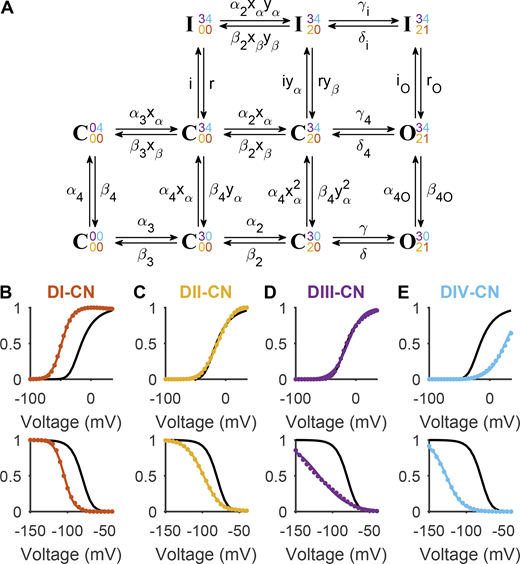
A new gating scheme in which both DIII and DIV are necessary for inactivation. (A) A kinetic model, referred to here as Gating Scheme II. The state represents the channel when all four voltage sensors are in their resting positions. The rightward transitions reflect the movement of the DIII voltage sensor, followed by DII, and finally DI. These three movements are sufficient to allow the channel to conduct. The transition from the bottom to middle row reflects DIV movement, while the transition from the middle to top row reflects binding of the inactivation motif. See main text for a full description of the model. (B) The G/V (top) and SSI (bottom) curves of Gating Scheme II when parameterized with values reported in Table S4 (black). See Fig. S4 for a full comparison between model outcomes and Nav1.5e data. In red are the model outcomes when the charges associated with DI movement (γ, γi, γ4, δ, δi, and δ4) were reduced and the intrinsic rates varied to reproduce DI-CN data. (C) DII-CN mutant data were reproduced by targeting parameters α2 and β2. (D) DIII-CN mutant data were reproduced by targeting parameters α3 and β3. (E) DIV-CN mutant data were reproduced by targeting parameters α4, α4O, β4, and β4O. Parameter values for all four CN models are reported in Table S5.
A new gating scheme in which both DIII and DIV are necessary for inactivation. (A) A kinetic model, referred to here as Gating Scheme II. The state represents the channel when all four voltage sensors are in their resting positions. The rightward transitions reflect the movement of the DIII voltage sensor, followed by DII, and finally DI. These three movements are sufficient to allow the channel to conduct. The transition from the bottom to middle row reflects DIV movement, while the transition from the middle to top row reflects binding of the inactivation motif. See main text for a full description of the model. (B) The G/V (top) and SSI (bottom) curves of Gating Scheme II when parameterized with values reported in Table S4 (black). See Fig. S4 for a full comparison between model outcomes and Nav1.5e data. In red are the model outcomes when the charges associated with DI movement (γ, γi, γ4, δ, δi, and δ4) were reduced and the intrinsic rates varied to reproduce DI-CN data. (C) DII-CN mutant data were reproduced by targeting parameters α2 and β2. (D) DIII-CN mutant data were reproduced by targeting parameters α3 and β3. (E) DIV-CN mutant data were reproduced by targeting parameters α4, α4O, β4, and β4O. Parameter values for all four CN models are reported in Table S5.
Fitting the rate constants of Gating Scheme II to Nav1.5e data allowed the model to reproduce the channel’s activation, SSI, and recovery from inactivation behavior (Fig. S4 and Table S4). In an attempt to capture the effects of VSD neutralization, we reduced the charge associated with each domain and refitted the intrinsic rate of domain movement (Table S5). Modifying the transitions associated with each domain successfully reproduced the consequences of neutralizing each respective VSD (Fig. 10, B–E; Fig. 1; and Fig. 5).
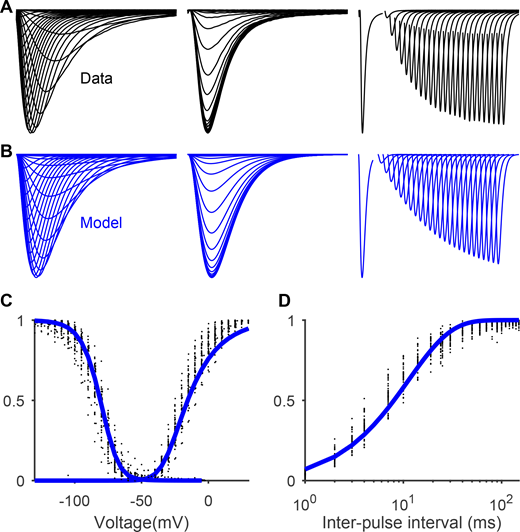
Gating Scheme II fitted to Nav1.5e data. Related to Figs. 9 and 10. (A) From left to right, averaged currents recorded from WT Nav1.5e channels during the activation protocol (as in Fig. 1), inactivation protocol (as in Fig. 5), and recovery from inactivation protocol (currents elicited by a test pulse of −10 mV, following a holding potential of −10 mV and a hyperpolarizing interpulse of −100 mV which lasted between 1–150 ms). (B) Model output of Gating Scheme II (Fig. 9) parameterized with the values presented in Table S4. (C) Steady-state inactivation (inverted triangles) and GV (square) curves of WT Nav1.5e channel (black) and model (blue). (D) Fraction of recovered current as a function of interpulse interval for the WT channel (black) and model (blue).
Gating Scheme II fitted to Nav1.5e data. Related to Figs. 9 and 10. (A) From left to right, averaged currents recorded from WT Nav1.5e channels during the activation protocol (as in Fig. 1), inactivation protocol (as in Fig. 5), and recovery from inactivation protocol (currents elicited by a test pulse of −10 mV, following a holding potential of −10 mV and a hyperpolarizing interpulse of −100 mV which lasted between 1–150 ms). (B) Model output of Gating Scheme II (Fig. 9) parameterized with the values presented in Table S4. (C) Steady-state inactivation (inverted triangles) and GV (square) curves of WT Nav1.5e channel (black) and model (blue). (D) Fraction of recovered current as a function of interpulse interval for the WT channel (black) and model (blue).
Finally, we used this new model to investigate the difference between Nav1.5e and the adult form Nav1.5. The adult splice variant of Nav1.5 displays a G/V relationship that is 10 mV more hyperpolarized than Nav1.5e, while SSI and recovery are indistinguishable (Mancino et al., 2022). This difference results from two amino acid residues in DI that are thought to facilitate the translocation of DI-S4 in Nav1.5 (Mancino et al., 2022). Consistent with this, we found that to reproduce the behavior of adult Nav1.5 with our model, it was sufficient to increase the forward rate of DI threefold (Fig. 11 and Table S5). In conclusion, by identifying specific domains in the gating scheme, structurally motivated parameter modifications were capable of replicating the consequences of neutralizing the various domains, as well as the gating differences between Nav1.5 splice variants.
Manipulating intrinsic DI kinetics in Gating Scheme II reproduces differences between Nav1.5 and Nav1.5e. Left: Comparison of G/V (top), SSI (middle), and recovery from inactivation (bottom) of Nav1.5e (black) and adult Nav1.5 (red). Solids lines represent Boltzmann fits. Data from Mancino et al. (2022). Right: Output of Gating Scheme II fitted to Nav1.5e data (black) and after DI movement was facilitated by increasing rates γ and γi threefold (red). Exact parameter values for Nav1.5 model are presented in Table S5.
Manipulating intrinsic DI kinetics in Gating Scheme II reproduces differences between Nav1.5 and Nav1.5e. Left: Comparison of G/V (top), SSI (middle), and recovery from inactivation (bottom) of Nav1.5e (black) and adult Nav1.5 (red). Solids lines represent Boltzmann fits. Data from Mancino et al. (2022). Right: Output of Gating Scheme II fitted to Nav1.5e data (black) and after DI movement was facilitated by increasing rates γ and γi threefold (red). Exact parameter values for Nav1.5 model are presented in Table S5.
Discussion
We have studied the role of each VSD, DI–IV, in Nav1.5 gating to investigate potential gating differences among Nav isoforms. We conclude that both DIII and DIV movements are necessary for Nav1.5 inactivation, unlike for Nav1.4, suggesting that cardiac sodium channels follow a gating scheme different from that of skeletal muscle sodium channels. Additionally, our results suggest that high levels of CSI permit all voltage sensors to influence inactivation, whereas low levels of CSI restrict each voltage sensor to influence either activation or inactivation. We postulate that the distinct propensities for CSI displayed by Nav1.4, Nav1.5, and Nav1.6 channels allow the same voltage sensors to shape macroscopic gating properties differently in each channel.
Contributions of VSDs to pore opening
Previous charge neutralization experiments have reported disparate changes to the voltage dependence of activation when comparing skeletal muscle (Capes et al., 2013; Chahine et al., 1994), neuronal (Kontis and Goldin, 1997), and cardiac (Chen et al., 1996) Nav channels. Here, we showed that changes to G/V curves are an unreliable marker for a domain’s role in activation, whereas the latency to peak current is more informative (Figs. 3 and 4). Using this measure, we found that in the neonatal sodium channel, Nav1.5e, DI movement is likely rate limiting for pore opening and DII movement contributes significantly, but to a lesser degree. Although DIII movement is thought to be necessary for channel activation in Nav1.4 skeletal muscle channels (Chanda and Bezanilla, 2002), neutralizing DIII in Nav1.5 did not alter the voltage dependence or kinetics of channel activation (Figs. 1 and 2). This is likely because DIII is already in its activated position in WT Nav1.5 channels at the voltage range used in our protocols (Fig. 5; Hsu et al., 2017; Zhu et al., 2017). Consequently, neutralizing the domain’s voltage sensor would not be expected to significantly alter the overall activation process. Finally, although DIV-CN Nav1.5 mutants exhibit an altered voltage dependence of activation, the observed effects are more consistent with an increased inactivation rate (Fig. 3 F). Considering this, we did not find evidence that DIV movement is necessary for activation, consistent with previous experiments on Nav1.4 channels that were mutated to prevent inactivation (Goldschen-Ohm et al., 2013). In summary, our results suggest that DI, and to a lesser extent DII, determines the rate of activation, whereas DIII, at least in Nav1.5, likely plays little role in activation at physiological membrane potentials.
All voltage sensors contribute to Nav channel inactivation
Charge-neutralization experiments on Nav1.4 have suggested that DIV is uniquely sufficient for inactivation (Capes et al., 2013). Here, we found that neutralizing either DIII or DIV leads to a similar hyperpolarizing shift and flattening of the SSI curve. Furthermore, we observed that SSI in DIV-CN Nav1.5 mutants is strongly correlated with DIII movement (Fig. 5 E). Together, these findings suggest that Nav1.5 inactivation is intrinsically coupled to DIII movement. Our results contrast with those of Cha et al. (1999), whose charge neutralization experiments on Nav1.5 identified a unique role for DIV in inactivation. Our experiments differed from those of Cha et al. (1999) in that we neutralized the first three gating charges of each domain, whereas they neutralized one charge at a time. It is therefore likely that the majority of gating charge for DIV is contributed by a single arginine, as previously suggested (Cha et al., 1999), while DIII gating charge is contributed more uniformly by the entire S4 sensor.
Notably, DIV-CN Nav1.4 mutants inactivate at voltages too hyperpolarized to be caused by the movement of DIII (Chanda and Bezanilla, 2002; Capes et al., 2013), and DIII-CN Nav1.4 mutants do not display significantly altered SSI (Capes et al., 2013). Both of these observations are starkly different from our measurements of Nav1.5 (Figs. 5 and 9). Accordingly, we conclude that DIII is coupled to inactivation differently in Nav1.4 and Nav1.5 channels, which could contribute to the divergent views surrounding the role of DIII in inactivation (Ahern et al., 2016; Armstrong and Hollingworth, 2018). Our results do, however, support the idea that DIV movement is rate limiting for inactivation (Capes et al., 2013). This follows from the fact that DIV-CN depolarized activation in our experiments without altering time to peak current, indicating that neutralizing DIV accelerates the rate of CSI (Figs. 3 and 4).
Finally, although we found that neutralizing DI and DII significantly affects Nav1.5 inactivation, these observations could be explained by coupling between channel activation and inactivation (Kuo and Bean, 1994), a feature also assumed about Nav1.4 gating (Capes et al., 2013). Therefore, discrepancies between neutralizing DI and DII in Nav1.4 and Nav1.5 are probably not from their separate gating schemes, per se. As explained below, we postulate that the variable contributions of DI and DII to SSI is a result of differing intrinsic propensities for CSI among Nav isoforms.
CSI is variable among different Nav channel isoforms
It is well established that Nav channels can inactivate from closed states (Aldrich et al., 1983; Armstrong, 2006; Bean, 1981; Lawrence et al., 1991; Vandenberg and Horn, 1984), which is thought to occur when DIII and DIV (possibly just DIV in Nav1.4) move before channel activation (Armstrong, 2006). Nevertheless, the prevailing idea is that DIV movement is substantially slower than the other domains across all voltages (Armstrong, 2006; Bosmans et al., 2008; Capes et al., 2013; Chanda and Bezanilla, 2002), implying that inactivation occurs predominantly from the open state. Our findings on Nav1.5 seem to contradict this view. Indeed, the effects of DI- and DII-CN on SSI (Fig. 5), the effects of DIV-CN on the G/V relationship (Fig. 1), and the high levels of CSI that turn entirely to OSI at more depolarized potentials (Fig. 6) all strongly indicate that the order of domain movements is governed by the relative dynamics of each voltage sensor, and not by a fixed sequence of movements. In fact, we conclude that DIV moves faster than DI–III at a large range of voltages.
It should be noted that we performed our CN experiments in HEK-293 cells with mouse Nav1.5e expressed alone, whereas the same experiments by Capes et al. (2013) were performed in oocytes on rat Nav1.4 channels coexpressed with β1 auxiliary subunits. Interestingly, past VCF experiments revealing slow DIV movement were also performed in oocytes in the presence of β subunits, on either human Nav1.4 (Cha et al., 1999) or rat Nav1.4 (Chanda and Bezanilla, 2002). This could point to intrinsic differences in activation sequences among Nav isoforms, as suggested by the different levels of CSI measured from Nav1.4, Nav1.5, and Nav1.6 (Fig. 6). However, it will be important to determine whether the dynamics of each domain are also affected by expression system, sequence differences among Nav paralogs, and/or the presence of β subunits.
The idea that CSI is variable has some interesting implications. Our results suggest that a high propensity for CSI permits DI and DII to alter SSI and also allows DIV to alter the voltage dependence of activation. Intriguingly, many gating modifiers influence channel behavior by targeting the movement of specific voltage sensors, and may thus have CSI-dependent effects. Several studies on toxins that target voltage sensors—which include certain scorpion, sea anemone, and cone snail toxins (Ahern et al., 2016)—have described varied effects across Nav channel isoforms (Alami et al., 2003; Leipold et al., 2006; Oliveira et al., 2004). Furthermore, auxiliary β subunits target specific VSDs (Zhu et al., 2017) and have variable effects on Nav1.4 and Nav1.5 (Bendahhou et al., 1995; Zhu et al., 2017; Dhar Malhotra et al., 2001; Nuss et al., 1995; Ferrera and Moran, 2006). It has been suggested that some of these observations result from steric effects of channel structure (Alami et al., 2003; Jiang et al., 2020). Our findings suggest that differences in channel dynamics, specifically as they pertain to CSI, may also contribute to these variable effects of Nav channel modifiers. We predict that channels with a low propensity for CSI may be less susceptible to gating modulation.
Finally, with respect to channel mutations, it has been suggested that insights into channelopathies may be realized through the analysis of “homologous” mutations across Nav channels (Loussouarn et al., 2016). Whether variation in gating kinetics alter the consequences of other mutations as profoundly as those of the voltage sensor–neutralizing mutations studied here is clearly of interest for future study.
Acknowledgments
Christopher J. Lingle served as editor.
We thank Dr. Mark Aurousseau, who cloned Nav1.5e from brain extracts, and Dr. Jonathan R. Silva for the gift of Nav1.5 VCF cDNA constructs. We also thank members of the Bowie laboratory for discussions and comments on the manuscript.
This work was supported by Canadian Institutes of Health Research Operating Grants CIHR MOP-342247 to D. Bowie, by the Natural Sciences and Engineering Council of Canada (NSERC) Discovery Grant to A. Khadra, and by Japan Society for the Promotion of Science KAKENHI grants 17H04021 and 20H03424 to Y. Kubo. N. Brake was supported by the NSERC-CREATE in Complex Dynamics Graduate Scholarship. A.S. Mancino was supported by the NSERC CGS-Master’s Scholarship.
The authors declare no competing financial interests.
Author contributions: Conceptualization: N. Brake, A.S. Mancino, and D. Bowie. Methodology: N. Brake, T. Shimomura, and Y. Kubo. Formal Analysis: N. Brake, A.S. Mancino, Y. Yan, and T. Shimomura. Investigation: N. Brake, A.S. Mancino, and Y. Yan. Writing—Original Draft: N. Brake and D. Bowie. Writing—Review & Editing: all authors. Visualization: N. Brake. Supervision: A. Khadra and D. Bowie. Project Administration, D. Bowie. Funding Acquisition: Y. Kubo, A. Khadra, and D. Bowie.

