


Large-conductance Ca2+-activated K+ (BK) channels control a range of physiological functions, and their dysfunction is linked to human disease. We have found that the widely used drug loperamide (LOP) can inhibit activity of BK channels composed of either α-subunits (BKα channels) or α-subunits plus the auxiliary γ1-subunit (BKα/γ1 channels), and here we analyze the molecular mechanism of LOP action. LOP applied at the cytosolic side of the membrane rapidly and reversibly inhibited BK current, an effect that appeared as a decay in voltage-activated BK currents. The apparent affinity for LOP decreased with hyperpolarization in a manner consistent with LOP behaving as an inhibitor of open, activated channels. Increasing LOP concentration reduced the half-maximal activation voltage, consistent with relative stabilization of the LOP-inhibited open state. Single-channel recordings revealed that LOP did not reduce unitary BK channel current, but instead decreased BK channel open probability and mean open times. LOP elicited use-dependent inhibition, in which trains of brief depolarizing steps lead to accumulated reduction of BK current, whereas single brief depolarizing steps do not. The principal effects of LOP on BK channel gating are described by a mechanism in which LOP acts as a state-dependent pore blocker. Our results suggest that therapeutic doses of LOP may act in part by inhibiting K+ efflux through intestinal BK channels.
Introduction
Large-conductance Ca2+-activated K+ (BK) channels are ubiquitously expressed in excitable and nonexcitable cells and are activated by depolarizing membrane voltage and cytosolic Ca2+ (Cui et al., 2009). Due to their large conductance, BK channels can mediate rapid efflux of K+ ions across cell membranes and are important for a range of physiological processes, including vascular tone, neuronal signaling, and electrolyte homeostasis (Ledoux et al., 2006; Meredith et al., 2006; Pluznick and Sansom, 2006). Clinically, both loss-of-function and gain-of-function mutations in BK channels have been linked to neurological deficits and disease in human patients, including epilepsy, dyskinesia, and developmental delay (Bailey et al., 2019; Chen, 2005; Liang et al., 2019; Yang et al., 2010). Although BK channels may be an important therapeutic target to treat disease, identifying clinically effective BK channel modulators has been challenging (Kaczorowski and Garcia, 2016).
Our understanding of the molecular gating mechanisms of BK channels may be an advantage toward determining mechanisms of BK channel modulators. BK channels exhibit a structure consisting of three functional modules: a central pore-gate domain (PGD), which is formed at the confluence of four identical pore-forming α-subunits, as well as voltage-sensing domains (VSDs) and cytosolic C-terminal calcium-sensing domains (CSDs), each of which is tethered directly to the PGD of each subunit (Hite et al., 2017; Tao et al., 2017; Tao and MacKinnon, 2019). BK channels can also contain β and/or γ auxiliary subunits that bind to the tetrameric BKα channels to modulate gating and/or pharmacology (Guan et al., 2017; Meera et al., 2000; Valverde et al., 1999; Wang et al., 2006; Wang et al., 2002; Yan and Aldrich, 2010). For BK channels, activation of the VSD by depolarization and activation of the CSD by binding of Ca2+ both facilitate opening at the PGD by a dual allosteric gating mechanism (Horrigan and Aldrich, 2002; Rothberg and Magleby, 2000). The mechanism, in turn, provides a quantitative framework to determine how drugs may specifically bind to and modulate activation of these domains, or the interactions between domains, in terms of effects on rates and/or equilibrium constants (Gessner et al., 2012; Rockman et al., 2020; Zhou and Lingle, 2014). Through quantitative analysis of the effects of drugs on channel gating, one may gain insight into the molecular basis of drug action and, ultimately, whether a drug may mitigate the functional effects of a disease-linked mutation.
Here, we examine effects of the μ-opioid agonist loperamide (LOP; 4-[4-(4-chlorophenyl)-4-hydroxypiperidin-1-yl]-N,N-dimethyl-2,2-diphenylbutanamide) on BK channel gating. LOP is a medication that is widely used to treat diarrhea and is known to act through a mechanism involving activation of enteric μ-opioid receptors (MORs) leading to slowed intestinal motility (Mackerer et al., 1976; Otterson and Sarna, 1994). At therapeutic doses (2–4 mg), LOP is largely retained in the intestinal lumen and epithelium, with very low absorption into the bloodstream and central nervous system; thus, the medicinal actions of LOP are limited to the gastrointestinal tract (Miller et al., 2017; Miyazaki et al., 1982; Miyazaki et al., 1979; Sadeque et al., 2000). Aside from activation of opioid receptors, LOP is also known to affect ion permeabilities in epithelial cells (Wehner et al., 1989), although mechanisms underlying these effects have been unclear.
We initially observed, in a fluorescence-based cellular assay, that LOP is a potent inhibitor of BK channel–mediated thallium flux (Vouga et al., 2019). Using patch-clamp electrophysiology, we now find that LOP leads to a reversible time- and dose-dependent inhibition of voltage-activated BK current over a wide range of cytosolic [Ca2+], with a half-maximal inhibitory concentration (IC50) of ~1 µM for open channels. This inhibitory effect is observed in BK channels composed of only α-subunits (BKα channels) as well as in BKα channels coexpressed with the auxiliary γ1-subunit (BKα/γ1 channels). LOP inhibits maximal BK current by decreasing channel open times at depolarized voltages, whereas hyperpolarization leads to rapid recovery from inhibition that can occur subsequent to channel closing. These kinetics give rise to a pattern of use dependence in which LOP inhibition increases over the course of a train of brief (1 ms) depolarizing pulses, whereas inhibition is nominal during a single brief pulse.
The inhibitory effect of LOP on BK channels over a wide range of voltage and [Ca2+] can be described quantitatively with an allosteric model in which LOP preferentially blocks open BK channels, coupled with a relative energetic stabilization of the open-blocked state. Because BK channels underlie a major pathway for K+ secretion in the distal colon, a therapeutic effect of LOP may thus involve preventing excess loss of K+ during diarrhea through blockade of epithelial BK channels (Sausbier et al., 2006; Sørensen et al., 2010).
Materials and methods
Channel expression system
Experiments using BK channels composed of an α-subunit only (BKα channels) were performed using excised inside-out patches from human embryonic kidney cells (HEK-293T; American Type Culture Collection) stably expressing the human BK channel α-subunit with a myc-epitope tag at the N terminus (referred to as “HF1 cells”; (Meera et al., 1997); obtained from the laboratory of Dr. R. Aldrich, University of Texas, Austin, TX). Unless specifically noted, the term “BK channel” refers to channels composed only of α-subunits.
Experiments using BK channels composed of α- and γ1-subunits (BKα/γ1 channels) were performed using HEK-293T cells stably expressing human BK channel α- and γ1-subunits. This cell line was generated by transfecting HEK-293T cells with a vector encoding the human BK channel α- and γ1-subunits (LRRC26) as a fusion protein (pcDNA6-myc-hslo-LRRC26-V5-His). As previously described, the BKα/γ1 fusion protein is cleaved by endogenous peptidases and leads to currents with consistent and reproducible gating properties that conform to established BKα/γ1 behavior (Yan and Aldrich, 2010, 2012). Stable transfectants were selected by standard protocols using 5 µg/ml blasticidin, and BKα/γ1-expressing clones were identified using patch-clamp electrophysiology.
Electrophysiological recording
All patch-clamp experiments were performed at room temperature (22°C). Recordings were acquired using either a Dagan PC-ONE amplifier controlled by pClamp9 software or a SutterPatch Integrated Patch Clamp Amplifier controlled by SutterPatch data acquisition software. Bath solutions were typically changed multiple times during the course of each experiment in a gravity-fed perfusable recording chamber to measure BK channel activity over a range of [Ca2+] and [LOP], as indicated. LOP was first dissolved in DMSO to make a 100 mM stock solution and was then aliquoted and further dissolved to yield a series of less concentrated stock solutions before experiments, so that the final concentration of DMSO in all experiments was 0.1% (vol/vol). All experiments performed in the absence of LOP also included 0.1% DMSO (vol/vol; final concentration), which was observed to have no significant effect on BK channel gating compared with experiments performed in DMSO-free solutions (Rockman et al., 2020).
For inside-out patch experiments, except where noted, solutions at both sides of excised patches contained 160 mM KCl and 10 mM HEPES (pH 7.4). Solutions bathing the cytosolic face of the patch additionally contained either 2 mM nitrilotriacetic acid with 0.972 mM CaCl2 to yield 88 µM free Ca2+ or 5 mM EGTA with no added CaCl2 to yield nominally 0 free Ca2+. Free [Ca2+] in our “nominally 0 Ca2+” solution is estimated to be <0.3 nM, based on calculations using published stability constants (Bers et al., 2010). Solutions bathing the cytosolic face of the patch also contained LOP (MilliporeSigma) at the indicated concentrations, ranging from 0 to 30 µM.
Leak subtraction was done using a −P/4 protocol with a holding potentials of −50 mV for recordings in the nominal absence of Ca2+ and −120 mV for recordings in 88 µM Ca2+. Each voltage protocol was typically repeated at least five times for each patch, and currents were digitized using a sampling rate of 50 kHz and averaged in real time using pClamp9 or SutterPatch software. To minimize voltage errors arising from series resistance, our analysis was limited to excised patch recordings in which the maximal current was <4 nA. We estimate that voltage errors arising from series resistance for our excised patch recordings were typically <6 mV, and data from excised patches are presented without correction for series resistance.
For whole-cell recordings, the pipette solution contained (in mM) 135 K-glutamate, 5 EGTA, and 10 HEPES (pH 7.2), and the extracellular bath solution contained (in mM) 135 Na-glutamate, 5 K-glutamate, 2 MgCl2, 2 CaCl2, and 10 HEPES (pH 7.2). TEA or LOP was also included in the bath solution as indicated. Pipette resistances for whole-cell recordings were typically 2–3 MΩ. Analyzed recordings had series resistance <10 GΩ, and series resistance was compensated 90%.
Data analysis
For recordings in which single-channel events were resolved for estimation of Po, dwell times at each conductance level were measured using 50% threshold detection in pClamp10, and NPo was calculated as the sum of the dwell times at each open conductance level divided by the recording time (McManus et al., 1987; Sigworth and Sine, 1987). The number of active channels (N) per patch was estimated by dividing the maximum macroscopic tail current amplitude for the patch by the single-channel current amplitude at the same voltage, and Po was calculated by dividing NPo by N (Koval et al., 2007; Rockman et al., 2020; Wang et al., 2006, 2009).
Quantification of inhibition kinetics during trains of depolarizing pulses to 90 mV in the presence of 3 µM LOP was performed by measuring tail current amplitudes (at −60 mV) that followed each depolarizing pulse in the train and normalizing as a fraction of the corresponding tail current in the absence of LOP. These were plotted as a function of open time; because channels were presumed to be opened nearly 100% of the time at 90 mV and ∼10% of the time at −60 mV (with 88 µM Ca2+), open time was calculated as the cumulative time at 90 mV + 0.1 × the cumulative time at −60 mV.
Data across different patches are presented as mean ± SEM. The experimental data presented represent results from a total of 123 different patches.
Kinetic model analysis
In Eq. 7, and M represents the equilibrium constant for LOP binding ([LOP]/KLOP, where KLOP represents the dissociation constant for LOP binding to the channel), and H represents the allosteric constant for interaction between LOP binding and the closed-open equilibrium (i.e., LOP binding changes the C-O equilibrium by H-fold). Fitting the parameters in Eq. 7 while holding H at a fixed value of 1.0 is equivalent to a mechanism in which the C-O equilibrium is not directly affected by LOP binding. The gating mechanisms described by Eq. 7 are represented as Schemes 1 and 2.
In Eq. 8, O and C are the same as in Eq. 7, and Thus, the open/LOP-bound (OB) states are conducting, and inhibition would occur with estimated values of H < 1, such that LOP binding drives the gating to favor the closed/LOP-bound (CB) states. In Eq. 8, the additional factor F was incorporated to account for allosteric coupling between LOP binding and VSD equilibrium (i.e., activation of each VSD changes LOP binding by F-fold). Thus, fitting the parameters in Eq. 8 while holding F at a fixed value of 1.0 is equivalent to a mechanism in which the VSD equilibrium is not directly affected by LOP binding (and vice versa).
To test whether LOP binding in the context of the blocking model (Eq. 7) might also be coupled to CSD activation, we incorporated the additional coupling constant W, resulting in Scheme 5. Parameters for Scheme 5 were estimated by fitting Eq. 7, with and
Eqs. 7 and 8 were fitted using the GlobalFit module in IgorPro8 (WaveMetrics).
Molecular docking
Docking of LOP into the human BK channel PGD (residues 16–343) was performed in AutoDock Vina, using the human BK channel structure (Protein Data Bank accession no. 6V22) and LOP coordinates obtained from PubChem (compound identifier 3955; Tao and MacKinnon, 2019; Trott and Olson, 2010). Prior to docking analysis, molecules were prepared in Autodock Tools, where rotatable bonds within the LOP ligand were determined and polar hydrogens were added to LOP and the BK channel PGD (Morris et al., 2009).
Docking analysis was performed in Autodock Vina (Trott and Olson, 2010) within an 8,000 Å3 search volume (20 × 20 × 20 Å box, centered at x = 166.314, y = 166.431, z = 147.149 in the PDB file). This search region is centered on the central axis of the pore near the center of the pore vestibule and is included the pore vestibule and a portion of the selectivity filter (incorporating residues T287 and V288). Further increases in the dimensions of the search region (up to 60 × 60 × 60 Å) yielded an overlapping set of top-ranked poses from those determined with the 20 × 20 × 20 Å volume.
The docking procedure involved automated rotation and translation of LOP rotamers within a specified volume of interest of a fixed protein conformation to minimize a binding energy estimate, which is based on a combination of knowledge-based potentials and empirical scoring functions. The potentials and scoring functions are meant to approximate the standard chemical potentials of the molecular system while increasing computational speed in exchange for more direct (and computationally intensive) estimates of free energies that would use explicit water, lipids, or ions. The resulting scores were used to identify a series of ranked unique poses solely for the purpose of developing a reasonable working hypothesis of the binding site. Figures were generated using MacPyMOL (PyMOL version 1.8.2.3 Enhanced for Mac OS X; Schrödinger, LLC).
Online supplemental material
Fig. S1 shows effects of LOP on BK channel gating. Fig. S2 shows IC50 versus voltage relations predicted using Scheme 2. Table S1 contains parameter values for curves shown in Fig. 1 B (BKα in 88 µM Ca2+) fitted with a Boltzmann equation (Eq. 2). Table S2 contains mean parameter values ± SEM for individual Boltzmann equation fits for BKα channels in 88 µM Ca2+. Table S3 contains mean parameter values for fits with a Hill equation (Eq. 3) for BKα channels in 88 µM Ca2+. Table S4 contains parameter values for curves shown in Fig. 3 B (BKα in nominally 0 Ca2+) fitted with Eq. 2. Table S5 contains mean parameter values ± SEM for individual Boltzmann equation fits for BKα channels in nominally 0 Ca2+. Table S6 contains mean parameter values for fits with a Hill equation for BKα channels in nominally 0 Ca2+. Table S7 contains parameter values for curves shown in Fig. 4 B (BKα/γ1 nominally 0 Ca2+ datasets fitted with Eq. 2). Table S8 contains mean parameter values ± SEM for individual Boltzmann equation fits for BKα/γ1 channels in nominally 0 Ca2+. Table S9 contains mean parameter values for fits with Hill equation for BKα/γ1 channels in nominally 0 Ca2+. Table S10 contains parameter values for inhibition kinetics during pulse train protocols shown in Fig. 11 (BKα channels; 88 µM Ca2+). Table S11 contains best fit parameters for gating schemes 1, 2, 3, 4, and 5, using global fitting with BKα in nominally 0 and 88 µM Ca2+. Table S12 contains parameter values obtained from fits with Eq. 2, using simulated data predicted from Scheme 2, [Ca2+] = 0 µM. Table S13 contains parameter values obtained from fits with Eq. 2, using simulated data predicted from Scheme 2, [Ca2+] = 88 µM.
Results
LOP strongly inhibits BK current at depolarized voltages
We assessed effects of LOP on BK channels by recording voltage-activated macroscopic BK currents over a range of LOP concentrations in excised, inside-out membrane patches. At depolarized voltages, with high [Ca2+] (88 µM) at the cytosolic side of the patch to achieve maximal Ca2+ activation, addition of LOP at the cytosolic side of the patch inhibited BK current (Fig. 1). Inhibition by LOP manifested as a time-dependent decay that occurred subsequent to voltage activation, as observed with currents in the presence of 3 µM LOP (Fig. 1 A and Fig. S1). These kinetics initially suggested that inhibition could arise from blockade of the open pore through a mechanism similar to that of BK channel blockade by large quaternary ammonium (QA) derivatives such as N-(4-[benzoyl]benzyl)-N,N,N-tributylammonium (bbTBA; Li and Aldrich, 2004; Wilkens and Aldrich, 2006). As with bbTBA, LOP contains multiple aromatic rings and is partially lipophilic, yet it also contains a basic nitrogen atom that is likely protonated (and thus positively charged) at pH 7.4 (Fig. 1 A). Thus, in principle, LOP could block the BK channel pore through a mechanism similar to that of bbTBA. Alternatively, time- and voltage-dependent inhibition could arise from an inhibitor acting at a nonpore locus, such as to decouple activation of the VSD from channel opening.
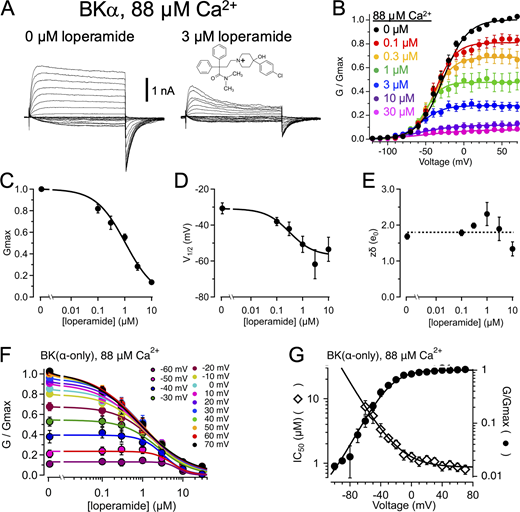
Effects of LOP on BK channel gating. (A) Representative current traces in the presence of 88 µM Ca2+ with 0 (left) or 3 µM LOP (right). Vhold = −120 mV; Vstep = −120 mV to 70 mV, 10-mV increments, 20 ms; Vtail = −90 mV. Molecular structure of LOP is shown at top right. (B) Normalized G-V relations from currents with 88 µM Ca2+ and the indicated [LOP], determined from tail currents following 50-ms depolarizations (Fig. S1). Solid lines represent fits with a Boltzmann equation (Eq. 2; fit parameters in Table S1). (C) Mean Gmax values versus [LOP], determined from Boltzmann equation fits. Solid line represents fit with a Hill equation (Eq. 3): max = 1.0, min = 0.0, IC50 = 1.06 ± 0.11 µM, nH = 0.79 ± 0.06. (D) Mean V1/2 values versus LOP. Solid line represents fit with Eq. 3: max = −31 ± 3 mV, min = −57 ± 8 mV, IC50 = 0.31 ± 0.3 µM; nH = 0.94 ± 0.6. (E) Effective gating valence (zδ) versus [LOP], determined from Boltzmann fits. Dashed line represents mean zδ value of 1.8 e0. (F) Normalized G versus [LOP] at the indicated voltages. Solid lines represent fits with Eq. 3 (fit parameters in Table S3). (G) IC50 versus voltage (open diamonds) and G-V relation with 0 LOP (filled circles), plotted on the same voltage axis on a semilogarithmic scale. IC50 versus voltage relations were fitted with Eq. 4 (A = 0.39; zδ = 1.2 e0; IC50(∞) = 0.87 µM). G-V curve is fitted with a Boltzmann equation (Eq. 2). IC50 values increase sharply with hyperpolarization, consistent with open-state dependence of inhibition. Symbols and error bars represent means ± SEM.
Effects of LOP on BK channel gating. (A) Representative current traces in the presence of 88 µM Ca2+ with 0 (left) or 3 µM LOP (right). Vhold = −120 mV; Vstep = −120 mV to 70 mV, 10-mV increments, 20 ms; Vtail = −90 mV. Molecular structure of LOP is shown at top right. (B) Normalized G-V relations from currents with 88 µM Ca2+ and the indicated [LOP], determined from tail currents following 50-ms depolarizations (Fig. S1). Solid lines represent fits with a Boltzmann equation (Eq. 2; fit parameters in Table S1). (C) Mean Gmax values versus [LOP], determined from Boltzmann equation fits. Solid line represents fit with a Hill equation (Eq. 3): max = 1.0, min = 0.0, IC50 = 1.06 ± 0.11 µM, nH = 0.79 ± 0.06. (D) Mean V1/2 values versus LOP. Solid line represents fit with Eq. 3: max = −31 ± 3 mV, min = −57 ± 8 mV, IC50 = 0.31 ± 0.3 µM; nH = 0.94 ± 0.6. (E) Effective gating valence (zδ) versus [LOP], determined from Boltzmann fits. Dashed line represents mean zδ value of 1.8 e0. (F) Normalized G versus [LOP] at the indicated voltages. Solid lines represent fits with Eq. 3 (fit parameters in Table S3). (G) IC50 versus voltage (open diamonds) and G-V relation with 0 LOP (filled circles), plotted on the same voltage axis on a semilogarithmic scale. IC50 versus voltage relations were fitted with Eq. 4 (A = 0.39; zδ = 1.2 e0; IC50(∞) = 0.87 µM). G-V curve is fitted with a Boltzmann equation (Eq. 2). IC50 values increase sharply with hyperpolarization, consistent with open-state dependence of inhibition. Symbols and error bars represent means ± SEM.

Effects of LOP on BK channel gating. Representative current traces in the presence of 88 µM Ca2+ with the indicated concentrations of LOP at the cytosolic face of the patch. Vhold = −120 mV; Vstep = −120 mV to 70 mV, 10-mV increments, 50 ms; Vtail = −90 mV.
Effects of LOP on BK channel gating. Representative current traces in the presence of 88 µM Ca2+ with the indicated concentrations of LOP at the cytosolic face of the patch. Vhold = −120 mV; Vstep = −120 mV to 70 mV, 10-mV increments, 50 ms; Vtail = −90 mV.
We quantified the inhibitory effect of LOP on BK current by fitting normalized G-V relations with a Boltzmann equation (Eq. 2; see Materials and methods; parameter values for Fig. 1 B in Table S1; mean parameter values in in Table S2). Fig. 1 B illustrates that increasing [LOP] most notably decreased the maximal normalized steady-state conductance (Gmax) from 1.0 with 0 LOP to 0.0763 ± 0.008 with 30 µM LOP. These Gmax values were plotted as a function of [LOP] and fitted with a Hill equation (Eq. 3) to yield an IC50 of 1.06 ± 0.11 µM and a Hill coefficient (nH) of 0.79 ± 0.06 (Fig. 1 C). In addition to affecting Gmax, V1/2 was shifted toward more hyperpolarizing voltages with increasing [LOP], ranging from −31 ± 3 mV with 0 LOP to −54 ± 7 mV with 10 µM LOP (Fig. 1 D). In contrast, the gating valence (zδ) value of the G-V relation (mean zδ = 1.83 ± 0.13 e0) showed no clear dose dependence over [LOP] ranging from 0 to 10 µM (Pearson’s correlation coefficient r(6) = −0.68; P = 0.14; Fig. 1 E).
The shift in V1/2 toward more hyperpolarized voltages with increasing [LOP] suggested that LOP binding may be coupled to stabilization of the open state, and thus LOP binding may exhibit state dependence. To further examine the possibility that LOP may bind more favorably to open channels than to closed channels, we plotted normalized conductance versus [LOP] relations over a range of voltages and fitted these with Eq. 4 to estimate IC50 values as a function of voltage (Fig. 1 F; Table S3). If LOP binds more favorably to open channels, then one would predict that the IC50 values would be lowest at depolarized voltages at which channels are mainly opened and should increase at hyperpolarized voltages where Po is decreased. Fig. 1 G shows that, in fact, IC50 values decrease to an asymptotic minimum (IC50(∞)) of 0.87 ± 0.07 µM with increasing depolarization as G/Gmax increases and are increased with hyperpolarization (zδ = 1.20 ± 0.18 e0). In addition, the relatively weak voltage dependence of IC50 values of 0.136 ± 0.076 e0 over depolarized voltages ranging from 10 to 70 mV (determined using Eq. 5), where G/Gmax in the absence of LOP is >0.9, suggests that intrinsic voltage dependence of inhibition is relatively weak, similar to that observed for bbTBA (Wilkens and Aldrich, 2006).
The LOP site is most accessible from the cytosolic side
Although we observe that LOP inhibits BK current when applied at the cytosolic side of the channel and likely contains a protonated piperidine nitrogen, LOP is also an overall lipophilic molecule with a calculated octanol–water partition coefficient (clogP) of 4.66 (Golfar and Shayanfar, 2019). In addition, the bath solutions contain a small amount of DMSO (0.1% vol/vol), which may increase the membrane permeability of LOP. Thus, it is possible for LOP to act directly at the cytosolic side of the channel, and/or diffuse into or through the plasma membrane, to inhibit BK current. It was important, therefore, to test whether the likely site of action of LOP on BK channels is at the cytosolic side or whether LOP may also be accessible to an inhibitory site from the extracellular side.
Application of 30 µM LOP to the cytosolic side of the membrane resulted in LOP reaching 90% of its maximal effect with a time constant of 7 ± 1 s in the presence of 88 µM Ca2+ (n = 3 patches), and LOP inhibition was completely reversed upon washout of the drug, typically within 1 min, with no substantial lag or delay after switching solutions from 30 to 0 µM LOP (Fig. 2 A; the time courses noted here represent the time required to switch solutions in the recording chamber and not the microscopic rate of channel inhibition). These properties are consistent with LOP acting at a site that was accessible to the aqueous solution at the cytosolic side of the patch.

LOP likely acts at the cytosolic side of the channel. (A) Normalized current amplitudes elicited by 20-ms pulses to either 120 mV from a holding voltage of 60 mV (0 µM Ca2+, open circles) or 90 mV from a holding voltage of −90 mV (88 µM Ca2+, filled circles) at 1-s intervals, plotted as a function of time. Measurements were the average current during the final 3 ms of each depolarizing pulse, normalized to the average current level between t = 0, and 5 s of 30 µM LOP was applied to the cytosolic side of the patch at t = 5 s and switched to 0 LOP at t = 55 s. After washout of LOP, currents recovered to nearly 100% of predrug amplitude. The curves superimposed on the decay phase show exponential fits to the data points, with τ = 8.5 and 7.1 s for this experiment (0 and 88 µM Ca2+, dashed and solid lines, respectively). Exponential fits to the wash phase yielded τ = 35 and 44 s for this experiment (0 and 88 µM Ca2+, respectively). These are limited by the speed of the perfusion system and do not correspond to the microscopic rates of inhibition or recovery. (B) Normalized current amplitudes recorded in excised patches with 88 µM Ca2+ at the cytosolic side and 3 µM extracellular LOP (in the pipette solution, indicated by gray bar), with representative current traces shown to the right. Currents were elicited by 20-ms pulses to 90 mV at 3-s intervals from a holding voltage of −90 mV, measured as in A. Extracellular LOP alone had little apparent effect on BK current amplitude or kinetics over several minutes of recording (t = 0 through 5 min; black trace at the far right). Addition of either 3 or 30 µM LOP to the cytosolic side of the patch (indicated by red and blue bars, respectively) led to rapid inhibition with decaying current kinetics (red/blue traces, right). Currents exhibited >90% recovery following washout of cytosolic LOP (gray traces, right). Similar results were observed in six different patches with LOP at the extracellular side of the membrane.
LOP likely acts at the cytosolic side of the channel. (A) Normalized current amplitudes elicited by 20-ms pulses to either 120 mV from a holding voltage of 60 mV (0 µM Ca2+, open circles) or 90 mV from a holding voltage of −90 mV (88 µM Ca2+, filled circles) at 1-s intervals, plotted as a function of time. Measurements were the average current during the final 3 ms of each depolarizing pulse, normalized to the average current level between t = 0, and 5 s of 30 µM LOP was applied to the cytosolic side of the patch at t = 5 s and switched to 0 LOP at t = 55 s. After washout of LOP, currents recovered to nearly 100% of predrug amplitude. The curves superimposed on the decay phase show exponential fits to the data points, with τ = 8.5 and 7.1 s for this experiment (0 and 88 µM Ca2+, dashed and solid lines, respectively). Exponential fits to the wash phase yielded τ = 35 and 44 s for this experiment (0 and 88 µM Ca2+, respectively). These are limited by the speed of the perfusion system and do not correspond to the microscopic rates of inhibition or recovery. (B) Normalized current amplitudes recorded in excised patches with 88 µM Ca2+ at the cytosolic side and 3 µM extracellular LOP (in the pipette solution, indicated by gray bar), with representative current traces shown to the right. Currents were elicited by 20-ms pulses to 90 mV at 3-s intervals from a holding voltage of −90 mV, measured as in A. Extracellular LOP alone had little apparent effect on BK current amplitude or kinetics over several minutes of recording (t = 0 through 5 min; black trace at the far right). Addition of either 3 or 30 µM LOP to the cytosolic side of the patch (indicated by red and blue bars, respectively) led to rapid inhibition with decaying current kinetics (red/blue traces, right). Currents exhibited >90% recovery following washout of cytosolic LOP (gray traces, right). Similar results were observed in six different patches with LOP at the extracellular side of the membrane.
To further test whether we could distinguish between an extracellular or cytosolic action on the channel, we applied LOP (3 µM) to the extracellular side of excised inside-out patches by including LOP in the patch pipette solution (with 88 µM Ca2+ at the cytosolic side). If the principal action of LOP observed above (Fig. 1 A, traces with 3 µMLOP) had arisen from a direct effect at the extracellular side of the channel, then one would expect the voltage-activated BK currents to contain the same rapid decaying component as observed with direct application of LOP at the cytosolic side, as in Fig. 1 A. However, currents exhibited no apparent inhibition with 3 µM extracellular LOP in this brief time frame (Fig. 2 B, black current traces). In the same patch, direct addition of 3 µM LOP at the cytosolic side of the patch resulted in rapid and reversible inhibition (Fig. 2 B, red current trace), and a subsequent switch to 30 µM LOP at the cytosolic side of the patch also resulted in rapid and reversible inhibition (Fig. 2 B, blue current trace).
Over several experiments with 3 µM extracellular LOP (in the pipette), the mean fractional current with 3 µM LOP added at the cytosolic side was 0.361 ± 0.013 (n = 4 patches). By comparison, direct addition of 3 µM LOP at the cytosolic side of the patch without extracellular LOP resulted in a mean fractional current of 0.292 ± 0.033 (n = 6), which was not significantly different from the result with 3 µM extracellular LOP (t test; P = 0.15). In experiments with 3 µM LOP in the pipette, the normalized current with 0 LOP added at the cytosolic side did exhibit a minor (5–10%) decrease after 30 min of continuous recording.
Together, these experiments are consistent with a site of action for LOP that is much more readily accessible from the cytosolic side of the membrane and is thus unlikely to be located at the extracellular side of the channel, where it would be rapidly accessed using extracellular LOP, or within the lipid bilayer, where it might be equally accessible from the cytosolic or extracellular side.
LOP action does not require Ca2+ activation
The experiments in Fig. 1 were performed using 88 µM Ca2+ at the cytosolic side of the membrane to elicit maximal Ca2+ activation of BK channels at the CSD. To test whether LOP inhibition required activation of the CSD, we measured the effect of LOP on voltage-activated BK channel current in the nominal absence of Ca2+. We observed that LOP inhibited maximal BK currents in the nominal absence of Ca2+, with normalized Gmax decreasing to 0.138 ± 0.13 with 30 µM LOP (Fig. 3; parameter values for Fig. 3 B in Table S4; mean parameter values inTable S5). The IC50 for the effect of LOP on Gmax at 0 Ca2+ was 1.4 ± 0.2 µM, which was not significantly different from the value of 1.1 ± 0.1 µM at 88 µM Ca2+ (t test; P = 0.22; Fig. 3 C). V1/2 values were also shifted toward more hyperpolarizing voltages with increasing [LOP], ranging from 179 ± 3 mV with 0 LOP to 165 ± 5 mV with 10 µM LOP (Fig. 3 D). As with experiments in 88 µM Ca2+, zδ values exhibited no apparent shift with increasing [LOP] (Fig. 3 E).
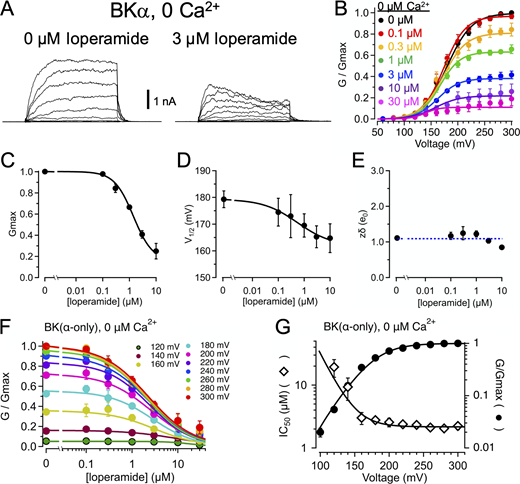
LOP inhibition does not require CSD activation.(A) Representative current traces in the presence of nominally 0 Ca2+ with 0 (left) or 3 µM LOP (right). Vhold = 60 mV; Vstep = 60 mV to 300 mV, 20-mV increments, 20 ms; Vtail = 80 mV. (B) Normalized G-V relations from currents with nominally 0 Ca2+ and the indicated [LOP]. Solid lines represent fits with a Boltzmann equation (Eq. 2; fit parameters in Table S4). (C) Mean Gmax values versus [LOP], determined from Boltzmann equation fits. Solid line represents fit with a Hill equation (Eq. 3): max = 1.0; min = 0.16 ± 0.04; IC50 = 1.41 ± 0.17 µM, nH = 1.2 ± 0.13. (D) Mean V1/2 values versus LOP. Solid line represents fit with Eq. 3: max = 179 ± 3.3 mV; min = 162 ± 16 mV; IC50 = 0.55 ± 1.9 µM; nH = 0.65 ± 1.1. (E) Effective gating valence (zδ) versus [LOP], determined from Boltzmann fits. Dashed line represents mean zδ value of 1.1 e0. (F) Normalized G versus [LOP] at the indicated voltages. Solid lines represent fits with Eq. 3 (fit parameters in Table S3). (G) IC50 versus voltage (open diamonds) and G-V relation with 0 LOP (filled circles), plotted on the same voltage axis on a semilogarithmic scale. As with 88 µM Ca2+, IC50 versus voltage relations were fitted with Eq. 4 [A = 5,500; zδ = 1.3 e0; IC50(∞) = 2.2 µM]; G-V curve is fitted with a Boltzmann equation (Eq. 2). These data are consistent with open state–dependent inhibition with nominally 0 Ca2+. Symbols and error bars represent means ± SEM.
LOP inhibition does not require CSD activation.(A) Representative current traces in the presence of nominally 0 Ca2+ with 0 (left) or 3 µM LOP (right). Vhold = 60 mV; Vstep = 60 mV to 300 mV, 20-mV increments, 20 ms; Vtail = 80 mV. (B) Normalized G-V relations from currents with nominally 0 Ca2+ and the indicated [LOP]. Solid lines represent fits with a Boltzmann equation (Eq. 2; fit parameters in Table S4). (C) Mean Gmax values versus [LOP], determined from Boltzmann equation fits. Solid line represents fit with a Hill equation (Eq. 3): max = 1.0; min = 0.16 ± 0.04; IC50 = 1.41 ± 0.17 µM, nH = 1.2 ± 0.13. (D) Mean V1/2 values versus LOP. Solid line represents fit with Eq. 3: max = 179 ± 3.3 mV; min = 162 ± 16 mV; IC50 = 0.55 ± 1.9 µM; nH = 0.65 ± 1.1. (E) Effective gating valence (zδ) versus [LOP], determined from Boltzmann fits. Dashed line represents mean zδ value of 1.1 e0. (F) Normalized G versus [LOP] at the indicated voltages. Solid lines represent fits with Eq. 3 (fit parameters in Table S3). (G) IC50 versus voltage (open diamonds) and G-V relation with 0 LOP (filled circles), plotted on the same voltage axis on a semilogarithmic scale. As with 88 µM Ca2+, IC50 versus voltage relations were fitted with Eq. 4 [A = 5,500; zδ = 1.3 e0; IC50(∞) = 2.2 µM]; G-V curve is fitted with a Boltzmann equation (Eq. 2). These data are consistent with open state–dependent inhibition with nominally 0 Ca2+. Symbols and error bars represent means ± SEM.
We examined the voltage dependence of IC50 values in nominally 0 Ca2+ and observed a reciprocal relation between IC50 and channel activity as a function of voltage similar to that observed with 88 µM Ca2+, with IC50 approaching an asymptotic value of 2.2 ± 0.1 µM with increasing depolarization (Table S6; Fig 3, F and G). Under these conditions, IC50 increased substantially with hyperpolarization with voltages between 160 and 120 mV with an effective valence of 1.20 ± 0.23 e0 (determined from fitting with Eq. 5), which was comparable to the gating valence of 1.11 ± 0.05 e0 for activity in nominally 0 Ca2+ with 0 LOP (Table S5). These results are thus further consistent with LOP preferentially inhibiting open-activated channels and support the idea that LOP inhibition does not depend on obligatory activation of the CSD. However, because the asymptotic value of IC50 with nominally 0 Ca2+ is slightly greater than that observed with 88 µM Ca2+ (2.2 ± 0.1 µM versus 0.87 ± 0.07 µM), we cannot entirely rule out an interaction between LOP and CSD activation, which may involve effects of CSD activation on the conformation of the open pore (Hite et al., 2017; Tao and MacKinnon, 2019).
LOP inhibits BKα/γ1 channels
Because the therapeutic actions of LOP are limited primarily to intestinal cells, which contain BK channels composed of α- and γ1-subunits (LRRC26), it was important to determine whether LOP might also inhibit BKα/γ1 channels. Coexpression of BK α- and γ1-subunits yields BK currents that exhibit substantial activation at negative voltages in the nominal absence of Ca2+ and underlie a resting K+ conductance in intestinal epithelial cells that may be important in fluid and electrolyte balance in the intestinal lumen (Gonzalez-Perez et al., 2021). We therefore tested the effects of LOP in patches excised from cells overexpressing both BK α- and γ1-subunits.
We observe that in the nominal absence of Ca2+, LOP inhibits BKα/γ1 channels with properties similar to those observed with BKα-only channels. Increasing [LOP] resulted in a decrease of Gmax (from 1.0 with 0 LOP to 0.12 ± 0.04 with 30 µM LOP) and shifted V1/2 values to more negative voltages (from 23 ± 3 mV with 0 LOP to −11 ± 5 mV with 30 µM LOP), while having no apparent dose-dependent effect on the slopes of G-V relations over [LOP] ranging from 0 to 30 µM (Fig. 4, A–E; parameter values for Fig. 4 B in Table S7; mean parameter values in Table S8). In addition, IC50 values were again voltage dependent in a manner that was correlated with channel activity (Table S9; Fig. 4, F and G). For example, IC50 at 0 mV was 11.3 ± 3.5 µM and decreased over voltages ranging from −30 to 30 mV with an effective valence of 0.82 ± 0.04 e0 (determined using Eq. 5). Fitting the IC50 versus voltage relation with Eq. 4 yielded an asymptotic value of 2.1 ± 0.2 µM with increasing depolarization, again showing that LOP affinity increases with channel activation and opening (Fig. 4, F and G).
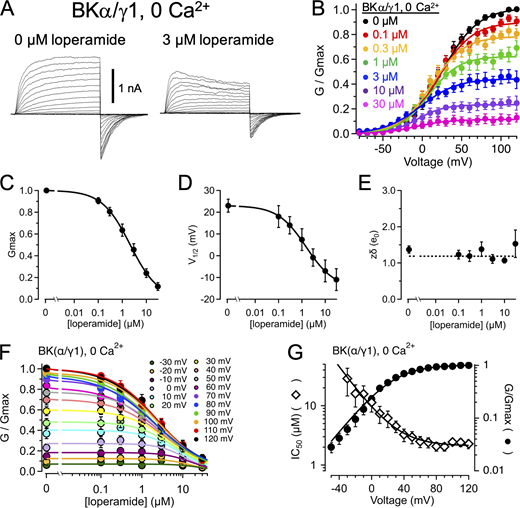
LOP inhibits BKα/γ1 channels.(A) Representative current traces from BKα/γ1 channels in nominally 0 Ca2+ with 0 (left) or 3 µM LOP (right). Vhold = −90 mV; Vstep = −80 mV to 120 mV, 10-mV increments, 20 ms; Vtail = −90 mV. (B) Normalized G-V relations from BKα/γ1 currents with nominally 0 Ca2+ and the indicated [LOP]. Solid lines represent fits with a Boltzmann equation (Eq. 2; fit parameters in Table S4). (C) Mean Gmax values versus [LOP], determined from Boltzmann equation fits. Solid line represents fit with a Hill equation (Eq. 3): max = 1.0; min = 0; IC50 = 2.13 ± 0.30 µM, nH = 0.74 ± 0.06. (D) Mean V1/2 values versus LOP. Solid line represents fit with Eq. 3: max = −23 ± 3 mV; min = −15 ± 11 mV; IC50 = 1.5 ± 1.7 µM; nH = 0.72 ± 0.4. (E) Effective gating valence (zδ) versus [LOP], determined from Boltzmann fits. Dashed line represents mean zδ value of 1.2 e0. (F) Normalized G versus [LOP] at the indicated voltages. Solid lines represent fits with Eq. 3 (fit parameters in Table S3). (G) IC50 versus voltage (open diamonds) and G-V relation with 0 LOP (filled circles), plotted on the same voltage axis on a semilogarithmic scale. IC50 versus voltage relations were fitted with Eq. 4 (A = 7.6; zδ = 1.1 e0; IC50(∞) = 2.1 µM); G-V curve is fitted with a Boltzmann equation (Eq. 2). As with BKα-only channels, IC50 values increase with hyperpolarization in BKα/γ1 channels, consistent with open state–dependent inhibition. Symbols and error bars represent means ± SEM.
LOP inhibits BKα/γ1 channels.(A) Representative current traces from BKα/γ1 channels in nominally 0 Ca2+ with 0 (left) or 3 µM LOP (right). Vhold = −90 mV; Vstep = −80 mV to 120 mV, 10-mV increments, 20 ms; Vtail = −90 mV. (B) Normalized G-V relations from BKα/γ1 currents with nominally 0 Ca2+ and the indicated [LOP]. Solid lines represent fits with a Boltzmann equation (Eq. 2; fit parameters in Table S4). (C) Mean Gmax values versus [LOP], determined from Boltzmann equation fits. Solid line represents fit with a Hill equation (Eq. 3): max = 1.0; min = 0; IC50 = 2.13 ± 0.30 µM, nH = 0.74 ± 0.06. (D) Mean V1/2 values versus LOP. Solid line represents fit with Eq. 3: max = −23 ± 3 mV; min = −15 ± 11 mV; IC50 = 1.5 ± 1.7 µM; nH = 0.72 ± 0.4. (E) Effective gating valence (zδ) versus [LOP], determined from Boltzmann fits. Dashed line represents mean zδ value of 1.2 e0. (F) Normalized G versus [LOP] at the indicated voltages. Solid lines represent fits with Eq. 3 (fit parameters in Table S3). (G) IC50 versus voltage (open diamonds) and G-V relation with 0 LOP (filled circles), plotted on the same voltage axis on a semilogarithmic scale. IC50 versus voltage relations were fitted with Eq. 4 (A = 7.6; zδ = 1.1 e0; IC50(∞) = 2.1 µM); G-V curve is fitted with a Boltzmann equation (Eq. 2). As with BKα-only channels, IC50 values increase with hyperpolarization in BKα/γ1 channels, consistent with open state–dependent inhibition. Symbols and error bars represent means ± SEM.
Together, results with both BKα and BKα/γ1 channels are consistent with a mechanism in which LOP inhibition depends primarily on opening of the channel.
LOP can inhibit BK current in whole cells
Because LOP likely inhibits BK channels at a site that is most accessible from the cytosolic side of the channel, for LOP to inhibit BK channels in intestinal tissues, it would need to cross the plasma membrane and enter the cytosol. We estimate that with a therapeutic dose of 2–4 mg, the extracellular concentration of LOP in the intestinal lumen may be ∼8 µM or more (assuming solvation of LOP in 1 liter of luminal fluid). Thus, to test whether BK current in whole cells may be inhibited by LOP, we obtained recordings from HEK-293T cells overexpressing BK channels composed of BK α- and γ1-subunits using the whole-cell patch configuration. We used cells expressing BK α- and γ1-subunits to approximate the likely composition of BK channels in intestinal epithelial cells and 10 µM LOP applied in the extracellular bath solution to approximate a potential therapeutic dose of LOP.
We observed that bath application of 10 µM LOP inhibited whole-cell BK current, with a mean fractional current of 0.39 ± 0.06 at equilibrium (n = 4 cells; Fig. 5). The level of inhibition for whole-cell currents produced by 10 µM LOP is less than that observed with the same [LOP] applied to the cytosolic side of excised patches (fractional current with 10 µM LOP applied directly to the cytosolic side, 0.14 ± 0.02; Fig. 1 C). If we assume that inhibition of BK current by LOP in whole-cell recordings is occurring through the same molecular mechanism as inhibition in excised patches, then the decreased inhibition observed in whole cells may arise either through a cellular mechanism that may oppose accumulation of LOP in the cytosol (e.g., extrusion of LOP by a transporter) or through a noncellular mechanism (e.g., slow diffusion of LOP from the cytosol into the patch pipette).

LOP can apparently cross the plasma membrane to inhibit BKα/γ1 channels from the cytosolic side. (A) Representative whole-cell recording experiment illustrating effects of extracellular (bath) application of 10 µM LOP and 1 mM TEA on currents from a cell overexpressing BKα/γ1 channels. Normalized whole-cell current amplitudes elicited by 50-ms pulses to 100 mV from a holding voltage of −120 mV at 5-s intervals are plotted as a function of time. Measurements were the average current during the final 3 ms of each depolarizing pulse, normalized to the average current level from the pulses between t = 0, and 5 min of 10 µM LOP was applied to the cell in the extracellular solution at t = 5 min, then switched directly to 1 mM TEA (without LOP) at t = 15 min, then back to 0 LOP/0 TEA at t = 17 min. A second application of 10 µM LOP was introduced at t = 21 min, followed by washout (0 LOP/0 TEA) at t = 25 min. After washout of LOP, currents recovered to ∼80% of predrug amplitude. The superimposed curves show exponential fits to the data points, with τ = 1.9 min (a), 7.3 s (b), 13.2 s (c), 32 s (d), and 51 s (e) for this experiment. These results indicate the appearance of blockade by extracellular TEA with a time course consistent with the speed of the perfusion system and the appearance of LOP inhibition with a time course that was much slower than that observed with direct application of LOP to the cytosolic side of the channel. (B) Representative whole-cell current traces corresponding to the indicated conditions from a BKα/γ1-overexpressing cell (top) and a nontransfected HEK-293T cell in the same conditions (bottom).
LOP can apparently cross the plasma membrane to inhibit BKα/γ1 channels from the cytosolic side. (A) Representative whole-cell recording experiment illustrating effects of extracellular (bath) application of 10 µM LOP and 1 mM TEA on currents from a cell overexpressing BKα/γ1 channels. Normalized whole-cell current amplitudes elicited by 50-ms pulses to 100 mV from a holding voltage of −120 mV at 5-s intervals are plotted as a function of time. Measurements were the average current during the final 3 ms of each depolarizing pulse, normalized to the average current level from the pulses between t = 0, and 5 min of 10 µM LOP was applied to the cell in the extracellular solution at t = 5 min, then switched directly to 1 mM TEA (without LOP) at t = 15 min, then back to 0 LOP/0 TEA at t = 17 min. A second application of 10 µM LOP was introduced at t = 21 min, followed by washout (0 LOP/0 TEA) at t = 25 min. After washout of LOP, currents recovered to ∼80% of predrug amplitude. The superimposed curves show exponential fits to the data points, with τ = 1.9 min (a), 7.3 s (b), 13.2 s (c), 32 s (d), and 51 s (e) for this experiment. These results indicate the appearance of blockade by extracellular TEA with a time course consistent with the speed of the perfusion system and the appearance of LOP inhibition with a time course that was much slower than that observed with direct application of LOP to the cytosolic side of the channel. (B) Representative whole-cell current traces corresponding to the indicated conditions from a BKα/γ1-overexpressing cell (top) and a nontransfected HEK-293T cell in the same conditions (bottom).
For these whole-cell experiments, which used the same perfusion system as with our excised patch experiments, the time for inhibition to reach equilibrium with extracellular bath-applied LOP had a mean time constant of 2.8 ± 0.4 min, which was ∼20 times slower than that observed with cytosolic application of LOP using excised inside-out patches (Fig. 2). In contrast, bath application of 1 mM TEA, which can block BK channels via a site at the extracellular side of the channel (Blatz and Magleby, 1984; Niu and Magleby, 2002), showed strong inhibition that developed rapidly (time constant to reach equilibrium, 8.4 ± 1 s; fractional current not blocked by 1 mM extracellular TEA, 0.082 ± 0.0007; n = 4 cells; Fig. 5). The perfusion time required for blockade by extracellular TEA was similar to the perfusion time required to inhibit BK current with direct application of LOP at the cytosolic side of excised inside-out patches (Fig. 2).
Following removal of LOP from the extracellular bath solution, BK currents were observed to recover only to ∼80% of predrug amplitudes (Fig. 5). This decrease in current amplitude may arise from incomplete clearance of LOP from the cytosol and/or some other time- or drug-dependent effect on the whole-cell current.
Together these results suggest that LOP can inhibit BK channels in whole cells. The time required for the inhibitory effect to equilibrate with extracellular bath application is slow compared with that required with perfusion at the cytosolic side of excised inside-out patches. Thus, these results further suggest that LOP must cross the plasma membrane of intact cells to inhibit the channels and is not likely inhibiting BK current by acting at an extracellular site.
LOP has a limiting effect on open dwell times
As noted above, the properties of LOP inhibition of BK current appear consistent with an open-channel blocking mechanism, although other mechanisms are possible. If LOP inhibits BK current by acting as an open channel blocker, then one would predict that in the presence of LOP, open channels should undergo transitions to a blocked state with decreased (or 0) conductance that could be resolved in single-channel recordings. To further examine the mechanism of inhibition, we obtained single-channel recordings from patches containing many BK channels in the presence of 0 and 30 µM LOP.
We observed that in the nominal absence of Ca2+ over voltages ranging from −100 to −60 mV, where the VSD is largely at rest, BK channels with 0 LOP gated with a low mean Po of 1.6 ± 0.10−6 (n = 7 patches). With 30 µM LOP, the mean Po was 1.7 ± 0.2 × 10⁻⁶ (n = 7 patches) over the same voltage range; thus, Po was not substantially affected by 30 µM LOP at these negative voltages (Fig. 6 A, upper panels). However, the inhibitory effect of 30 µM LOP becomes substantial at depolarized voltages. For example, the Po at +60 mV was increased to 4.8 ± 0.10−4 (n = 3), but it increased only to 1.3 ± 0.6 × 10⁻⁴ in the presence of 30 µM LOP (n = 3); thus, at +60 mV, Po was inhibited in 30 µM LOP by 3.7-fold. Similarly, at +80 mV, Po increased to 1.9 ± 0.7 × 10⁻³ with 0 LOP (n = 5), but it increased only to 5.4 ± 1.3 × 10⁻⁴ with 30 µM LOP (n = 5), for an inhibitory effect of 3.5-fold (Fig. 6 A, lower panels; Fig. 6 B, open circles). This inhibitory effect is further reflected in mean open times (plotted on the same voltage axis as Po in Fig. 6 B for comparison). Mean open times over the range of −100 to −60 mV, at which VSDs were largely at rest, were similar at 0.18 ± 0.006 ms and 0.18 ± 0.009 ms with 0 versus 30 µM LOP, respectively. Mean open times increased to 0.46 ± 0.04 ms at +60 mV with 0 LOP (n = 5 patches; 7,281 events total), but they only increased to 0.32 ± 0.03 ms with 30 µM LOP (n = 5 patches; 2,744 events total), and increased further to 0.57 ± 0.08 ms at +80 mV with 0 LOP (n = 4 patches; 7,144 events total), but increased only to 0.38 ± 0.008 ms with 30 µM LOP (n = 6 patches; 8,008 events total; Fig. 5 B, filled diamonds). Thus, LOP had a limiting effect on mean open time, consistent with the idea that as BK channels are driven from very brief openings toward longer-duration openings with depolarization, the channels are then driven to an inhibited or blocked state. Mean open times in the presence of 30 µM LOP were quantified by fitting with a Boltzmann equation, with an extrapolated maximum open time of 0.39 ± 0.04 ms at depolarized voltages under these conditions, consistent with an effective inhibition rate of 2,564 s−1 (1/0.39 ms).
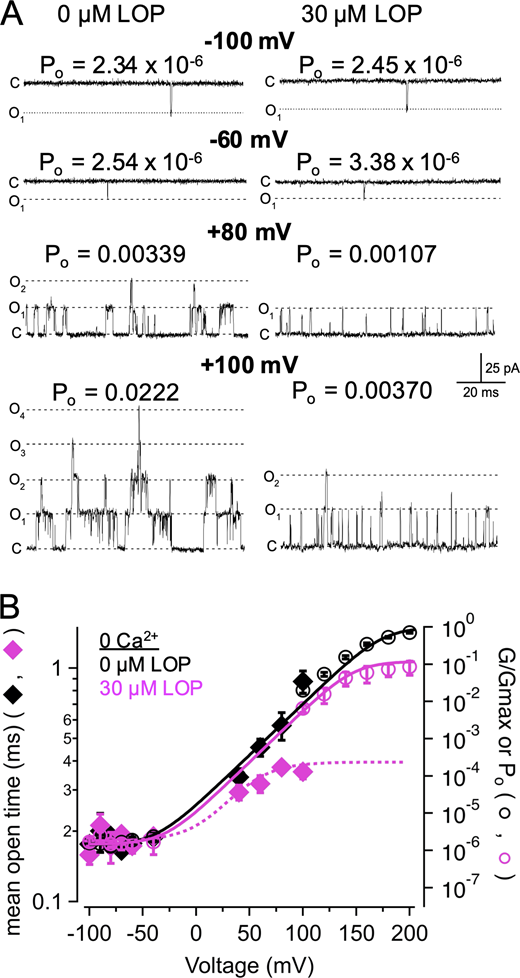
LOP has a limiting effect on mean open time.(A) Representative single-channel recordings in nominally 0 Ca2+ with 0 or 30 µM LOP at the indicated voltages. Po noted for each patch was determined by dividing NPo by the estimated number of channels in the patch (n = 23 channels for this experiment; see Materials and methods). (B) Po-V and G-V relations at nominally 0 Ca2+, with 0 (black open circles) or 30 µM LOP (magenta open circles), plotted together on semilogarithmic coordinates. Po was measured from single-channel recordings at −100 through 100 mV. Solid lines show fits with a Boltzmann equation (parameters in Table S1). Mean open times from single-channel recordings in nominally 0 Ca2+, at 0 or 30 µM LOP (black and magenta diamonds, respectively) at corresponding voltages illustrate that, with depolarized voltages, 30 µM LOP leads to substantially reduced open times, consistent with depolarization driving open channels toward closed or blocked states. Dashed magenta line shows fit of mean open times in 30 µM LOP with a Boltzmann equation (minimum open time = 0.18 ms; maximum open time = 0.40 ms; V1/2 = 37 mV; zδ = 1.2 e0). Symbols and error bars represent means ± SEM.
LOP has a limiting effect on mean open time.(A) Representative single-channel recordings in nominally 0 Ca2+ with 0 or 30 µM LOP at the indicated voltages. Po noted for each patch was determined by dividing NPo by the estimated number of channels in the patch (n = 23 channels for this experiment; see Materials and methods). (B) Po-V and G-V relations at nominally 0 Ca2+, with 0 (black open circles) or 30 µM LOP (magenta open circles), plotted together on semilogarithmic coordinates. Po was measured from single-channel recordings at −100 through 100 mV. Solid lines show fits with a Boltzmann equation (parameters in Table S1). Mean open times from single-channel recordings in nominally 0 Ca2+, at 0 or 30 µM LOP (black and magenta diamonds, respectively) at corresponding voltages illustrate that, with depolarized voltages, 30 µM LOP leads to substantially reduced open times, consistent with depolarization driving open channels toward closed or blocked states. Dashed magenta line shows fit of mean open times in 30 µM LOP with a Boltzmann equation (minimum open time = 0.18 ms; maximum open time = 0.40 ms; V1/2 = 37 mV; zδ = 1.2 e0). Symbols and error bars represent means ± SEM.
Similar effects of LOP were observed in BK channels activated with high Ca2+. With 88 µM Ca2+ over voltages ranging from −160 to −130 mV, at which VSDs are largely at rest, BK channels gated with Po of 0.0039 ± 0.0004 and 0.0037 ± 0.0003 with 0 and 30 µM LOP, respectively (n = 5 patches each; Fig. 7; Horrigan and Aldrich, 2002). Thus, with VSDs largely at rest, even with higher Po due to Ca2+ activation, Po was largely unaffected by 30 µM LOP. In the same patches, however, when VSDs were activated at −90 mV, Po was increased to 0.0196 ± 0.001 with 0 LOP, but increased only to 0.00728 ± 0.0010 with 30 µM LOP (2.7-fold inhibition; Fig. 7 B). This inhibition is also reflected in mean open times. Mean open times over the range of −160 to −130 mV, at which VSDs were largely at rest, were similar at 0.27 ± 0.003 ms and 0.26 ± 0.004 ms with 0 versus 30 µM LOP, respectively (n = 5 patches each; 2,796 and 3,812 events total, respectively). Mean open times increased to 0.41 ± 0.02 ms at −90 mV with 0 LOP (n = 5 patches; 824 events total), but only increased to 0.32 ± 0.03 ms with 30 µM LOP (n = 5 patches; 1,593 events total), and increased further to 0.90 ± 0.12 ms at −50 mV with 0 LOP (n = 5 patches; 5,485 events total), but increased only to 0.44 ± 0.026 ms with 30 µM LOP (n = 5 patches; 4,831 events total; Fig. 7 B, filled diamonds). Additionally, with 30 µM LOP, mean open time at +50 mV remained at 0.37 ± 0.044 ms and thus did not reach the durations of openings in the absence of LOP. Fitting these mean open times at 30 µM LOP with a Boltzmann equation predicted a maximum open time of 0.43 ± 0.03 ms at depolarized voltages under these conditions, which is consistent with an effective inhibition rate of 2,326 s−1 (1/0.43 ms).
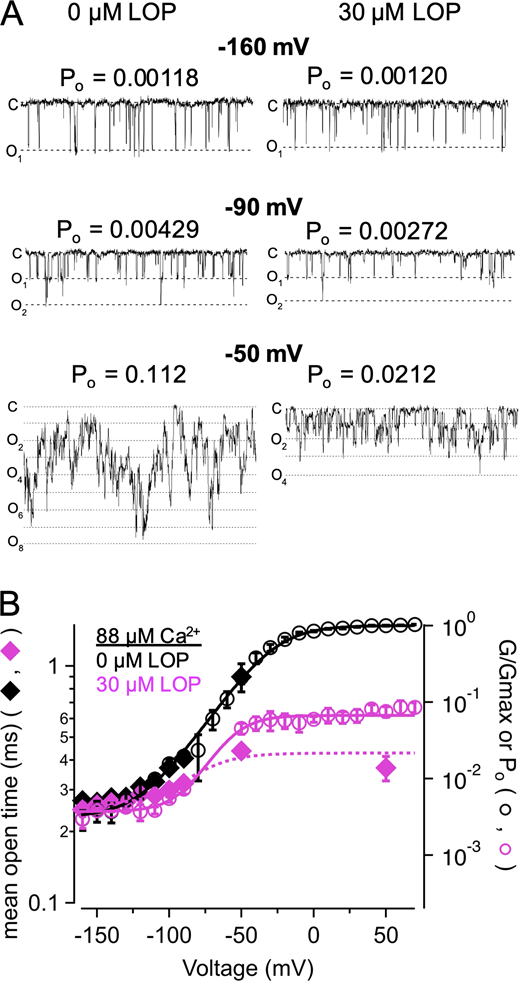
LOP limits mean open time in Ca2+-activated channels at hyperpolarized voltages.(A) Representative single-channel recordings in 88 µM Ca2+ with 0 or 30 µM LOP, at the indicated voltages (n = 53 channels for this experiment). (B) Po-V and G-V relations at 88 µM Ca2+, with 0 (black open circles) or 30 µM LOP (magenta open circles), Po was measured from single-channel recordings at −160 through −50 mV; recordings at 50 mV were obtained with 30 µM LOP. Solid lines show fits with a Boltzmann equation (parameters in Table S3). Mean open times from single-channel recordings in 88 µM Ca2+, at 0 or 30 µM LOP (black and magenta diamonds, respectively) at corresponding voltages illustrate that with depolarized voltages, 30 µM LOP leads to reduced open times, consistent with depolarization driving open channels toward closed or blocked states. Dashed magenta line shows fit of mean open times in 30 µM LOP with a Boltzmann equation (min. open time = 0.26 ms; max open time = 0.43 ms; V1/2 = −83 mV; zδ = 1.6 e0). Symbols and error bars represent means ± SEM.
LOP limits mean open time in Ca2+-activated channels at hyperpolarized voltages.(A) Representative single-channel recordings in 88 µM Ca2+ with 0 or 30 µM LOP, at the indicated voltages (n = 53 channels for this experiment). (B) Po-V and G-V relations at 88 µM Ca2+, with 0 (black open circles) or 30 µM LOP (magenta open circles), Po was measured from single-channel recordings at −160 through −50 mV; recordings at 50 mV were obtained with 30 µM LOP. Solid lines show fits with a Boltzmann equation (parameters in Table S3). Mean open times from single-channel recordings in 88 µM Ca2+, at 0 or 30 µM LOP (black and magenta diamonds, respectively) at corresponding voltages illustrate that with depolarized voltages, 30 µM LOP leads to reduced open times, consistent with depolarization driving open channels toward closed or blocked states. Dashed magenta line shows fit of mean open times in 30 µM LOP with a Boltzmann equation (min. open time = 0.26 ms; max open time = 0.43 ms; V1/2 = −83 mV; zδ = 1.6 e0). Symbols and error bars represent means ± SEM.
Thus, with nominally 0 or high (88 µM) Ca2+, 30 µM LOP has a quantitatively similar inhibitory effect on open dwell times. If we assume a kinetic mechanism in which the effective inhibition rates (determined from the mean open times) directly depend on the LOP concentration, then they would correspond to second-order rate constants of ∼8.9 × 10⁷ M−1 s−1 and 7.8 × 10⁷ M−1 s−1 for data with 0 or 88 µM Ca2+, respectively. Because mean open times with 30 µM LOP at voltages up to 100 mV were not >0.44 ms in either nominally 0 or 88 µM Ca2+, the inhibitory mechanism does not seem to depend on [Ca2+].
Dose- and voltage-dependent kinetics of inhibition
As it was possible to directly observe the time course of BK current inhibition in channels with high Ca2+ (88 µM) by stepping from a negative holding potential to depolarized voltages, we reasoned that the time constant of the current decay observed under these conditions could further inform estimates of the effective LOP on-rate and its possible voltage dependence. We quantified the time course of the current decay by fitting currents during a 50-mV pulse with single exponential functions and plotted the effective on-rates for LOP inhibition (1/τdecay) as a function of [LOP].
The representative currents in Fig. 8 A illustrate that the voltage activation rate of BK channels in the presence of increasing [LOP] is largely independent of the subsequent current decay. This observation is consistent with the idea that, at negative voltages where BK channels are largely closed, despite the presence of LOP in the bulk cytosolic solution, LOP is likely dissociated from the channel and appears to bind and inhibit after the membrane is depolarized and channels are opened.

Kinetics of LOP inhibition. (A) Representative BK currents in response to a voltage step to 50 mV, with the indicated [LOP] (Vhold = −90 mV; Ca2+ = 88 µM). Increasing [LOP] leads to faster decay of the current after depolarization. Scale bar is 50 pA × 10 ms. (B) Effect rate of inhibition (1/τdecay) versus [LOP], estimated from currents at 50 and 90 mV, as indicated, from single exponential fits. The superimposed regression lines yielded slopes of 4.3 ± 0.4 × 10⁷ M−1 s−1 at 50 mV (n = 4) and 5.8 ± 0.6 × 10⁷ M−1 s−1 at 90 mV (n = 3). Symbols and error bars represent means ± SEM.
Kinetics of LOP inhibition. (A) Representative BK currents in response to a voltage step to 50 mV, with the indicated [LOP] (Vhold = −90 mV; Ca2+ = 88 µM). Increasing [LOP] leads to faster decay of the current after depolarization. Scale bar is 50 pA × 10 ms. (B) Effect rate of inhibition (1/τdecay) versus [LOP], estimated from currents at 50 and 90 mV, as indicated, from single exponential fits. The superimposed regression lines yielded slopes of 4.3 ± 0.4 × 10⁷ M−1 s−1 at 50 mV (n = 4) and 5.8 ± 0.6 × 10⁷ M−1 s−1 at 90 mV (n = 3). Symbols and error bars represent means ± SEM.
Measurements of decay time constants support the idea that the effective on-rates conform to a linear function of [LOP] over the range of 0 to 30 µM, with a slope of 4.3 × 10⁷ ± 0.4 × 10⁷ M−1 s−1 (n = 4 patches) at 50 mV (Fig. 8 B). This rate constant is similar to those estimated on the basis of single-channel open times at low Po, but it is at least an order of magnitude slower than 109 M−1 s−1, the rate that would be expected for a diffusion-limited process in aqueous solution (Smoluchowski, 1916). Thus, it is possible that the binding mechanism has some ligand orientation dependence. Based on the rate constant of 4.3 × 10⁷ M−1 s−1 and the estimated IC50 value of ∼0.94 µM at 50 mV (Fig. 1 F and Table S3), we estimate the effective off-rate at this depolarized voltage to be relatively slow, ∼40 s−1 (9.4 × 10−7 M × 4.3 × 107 M−1 s−1). To further test whether this rate constant was voltage dependent for open channels, we obtained estimates of decay time constants using currents at 90 mV. The effective on-rate estimates at 90 mV yielded a similar slope of 5.8 × 10⁷ ± 0.6 × 10⁷ M−1 s−1 (n = 3 patches), and, based on the extrapolated IC50 value of 0.71 µM at 90 mV, this predicts an effective off-rate at 90 mV of 41 s−1 (7.10−7 M × 5.8 × 107 M−1 s−1). Using Eq. 5, the estimated on-rates at 50 and 90 mV with 88 µM Ca2+ predicted a nominal effective valence of 0.21 ± 0.11 e0.
Dissociation kinetics and escape from closed BK channels
We next estimated the LOP recovery rate using a two-pulse protocol in which BK channels were first driven to the inhibited state in the presence of LOP during a depolarizing (“conditioning”) pulse to 90 mV to activate and inhibit the channels, then stepped to a hyperpolarizing voltage for a defined time interval to drive recovery from inhibition, and then depolarized with a second (“test”) pulse to 90 mV (Fig. 9 A). The level of recovery was assessed by measuring peak current in response to the test pulse (expressed as a fraction of the peak current during the conditioning pulse). The fractional peak currents were plotted as a function of interpulse interval and fitted with an exponential function to estimate the time constant of recovery, with the reciprocal (i.e., 1/τrecovery) yielding the effective recovery rate.

Kinetics of recovery from LOP inhibition. (A) Representative currents from a double-pulse experiment in 0 (upper left) and 3 µM LOP (center left) for selected recovery times, with a diagram to illustrate the voltage protocol (bottom left): Vcond = 90 mV, 50 ms; Vrecov = −120 mV, 0.1 to 9 ms, 0.3-ms increments; Vtest = 90 mV. Expanded views of boxed sections are shown to the right. (B) Peak test current amplitude, expressed as a fraction of the peak conditioning current amplitude, versus Vrecov duration. Data are plotted for Vrecov = −120 mV with 3 µM (filled squares, n = 7) and 10 µM LOP (open squares, n = 5), and for −80 mV with 3 µM (filled circles, n = 5) and 10 µM LOP (open circles, n = 5). Curves show single exponential fits, yielding τrecovery of 2.04 ms (−120 mV, 3 µM LOP); 2.11 ms (−120 mV, 10 µM LOP); 3.87 ms (−80 mV, 3 µM LOP); 4.14 ms (−80 mV, 10 µM LOP). (C) Mean effective recovery rates (1/τrecovery) versus Vrecov, plotted on semilogarithmic coordinates. Lines represent fits of these data points with Eq. 5, with rate0 = 51.3 s−1, zδ = −0.48 e0, 3 µM LOP; rate0 = 91.1 s−1, zδ = −0.37 e0, 10 µM LOP. Symbols and error bars represent means ± SEM.
Kinetics of recovery from LOP inhibition. (A) Representative currents from a double-pulse experiment in 0 (upper left) and 3 µM LOP (center left) for selected recovery times, with a diagram to illustrate the voltage protocol (bottom left): Vcond = 90 mV, 50 ms; Vrecov = −120 mV, 0.1 to 9 ms, 0.3-ms increments; Vtest = 90 mV. Expanded views of boxed sections are shown to the right. (B) Peak test current amplitude, expressed as a fraction of the peak conditioning current amplitude, versus Vrecov duration. Data are plotted for Vrecov = −120 mV with 3 µM (filled squares, n = 7) and 10 µM LOP (open squares, n = 5), and for −80 mV with 3 µM (filled circles, n = 5) and 10 µM LOP (open circles, n = 5). Curves show single exponential fits, yielding τrecovery of 2.04 ms (−120 mV, 3 µM LOP); 2.11 ms (−120 mV, 10 µM LOP); 3.87 ms (−80 mV, 3 µM LOP); 4.14 ms (−80 mV, 10 µM LOP). (C) Mean effective recovery rates (1/τrecovery) versus Vrecov, plotted on semilogarithmic coordinates. Lines represent fits of these data points with Eq. 5, with rate0 = 51.3 s−1, zδ = −0.48 e0, 3 µM LOP; rate0 = 91.1 s−1, zδ = −0.37 e0, 10 µM LOP. Symbols and error bars represent means ± SEM.
By this protocol, we estimated the recovery rate (1/τrecovery) during a hyperpolarizing step to −120 mV, measured with 3 µM LOP, as 471 ± 49 s−1 (n = 5 patches; Fig. 9 B, filled squares). This was nearly the same as the recovery rate estimated in the presence of 10 µM LOP (533 ± 35 s−1; n = 5 patches; Fig. 9 B, open squares), suggesting that the recovery rate is largely independent of [LOP]. In addition, these rates are ∼10 times the estimated off-rate of 40 s−1 at 90 mV, consistent with the idea that LOP inhibition is state dependent and that hyperpolarization increases LOP dissociation.
To further test whether recovery might be state dependent, we reasoned that stepping to a more depolarizing interpulse voltage (i.e., more positive than −120 mV) should slow transitions from the open/inhibited to closed/disinhibited states and thus lead to slower recovery. We therefore performed experiments with an interpulse voltage of −80 mV. The results illustrate that at −80 mV, where the steady-state Po is threefold higher than at −120 mV (0.0073 versus 0.023), the recovery rate with 3 µM LOP is slower than that measured with −120 mV (242 ± 57 s−1 at −80 mV; n = 4 patches; Fig. 9 C, filled circles). Similarly, the recovery rate with 10 µM LOP at −80 mV is decreased compared with that measured with −120 mV (296 ± 53 s−1; n = 5 patches; Fig. 9 C, open circles). These results are further consistent with state-dependent inhibition, in which retaining channels in the open state can decrease the rate of recovery from inhibition.
The observation that greater hyperpolarization of BK channels leads to more rapid recovery from LOP inhibition raises the possibility that LOP may dissociate from closed channels. Thus, it was important to determine the relation between channel closing and disinhibition. For example, it is possible that LOP could dissociate from either open or closed channels, as observed with blockade of BK channels by QA derivatives; alternatively, LOP could remain bound when the channel is closed and become “trapped” in the closed channel, to dissociate only when the channel is in the open state, as with blockade of BK channels with the Shaker-derived ball peptide (Li and Aldrich, 2004, 2006; Wilkens and Aldrich, 2006).
To determine whether LOP dissociation and recovery from inhibition requires transitions from open/inhibited to open/conducting states, we compared tail current kinetics in the absence and presence of LOP. In the absence of LOP, BK tail current decay is described by a single exponential, corresponding to a single rate-limiting transition from the open to the closed conformation (Cui et al., 1997; Horrigan et al., 1999). If LOP were bound in an open channel and became “trapped” inside the pore upon closing (and thus could not unbind unless the channel were opened), then, depending on the rate of LOP dissociation from open channels, one would predict a rising or plateau phase in the tail current that would precede the decay, as well as a slowing of the tail current kinetics or appearance of additional exponential components in the decay that would be observed in the presence of LOP, corresponding to transitions from open/blocked to open/conducting states, before the closing step (Li and Aldrich, 2004, 2006). If, on the other hand, LOP can dissociate from the closed pore without a transition through the open state, then one would predict tail current kinetics in the presence of LOP that would be the same as those in the absence of LOP, corresponding to the closing of open (i.e., not blocked) channels, while channels in the open/blocked state transition to a closed/blocked state, from which LOP can subsequently dissociate.
BK channels were driven to open and inhibited states in the presence of LOP with depolarization to 90 mV and then stepped to negative voltages (−80 or −120 mV; Fig. 10, A and B). We observed that the tail current elicited by a step to −80 mV, while reduced in amplitude in the presence of 3 or 10 µM LOP, decayed with essentially the same time course in 0, 3, or 10 µM LOP (Fig. 10 A). This can be seen more clearly in Fig. 10 C, which shows the representative tail currents from Fig. 10 A scaled to the same amplitude. Superimposed on the scaled currents are single exponential fits, which provide good descriptions of the decay time courses that were not improved by incorporating a second exponential component. In additional experiments, we observed that the mean time constant in the absence of LOP at −80 mV was not significantly altered by LOP at 3 or 10 µM (mean τ at −80 mV = 1.64 ± 0.19, 1.82 ± 0.14, and 2.05 ± 0.6 ms for 0, 3, and 10 µM LOP, respectively; n = 5 patches for 0 and 3 µM LOP, n = 3 patches for 10 µM LOP; P = 0.44 and 0.57, t test for comparison between 0 and 3 µM and 0 and 10 µM LOP, respectively). Similarly, tail current time constants at −120 mV in the presence of 3 and 10 µM LOP were not significantly different from those in 0 LOP (Fig. 10, B, D, and F; mean τ at −120 mV = 0.75 ± 0.07, 0.71 ± 0.06, and 0.78 ± 0.07 ms for 0, 3, and 10 µM LOP, respectively; n = 5 patches for 0 and 3 µM LOP, n = 3 patches for 10 µM LOP; P = 0.67 and 0.77, t test for comparison between 0 and 3 µM and 0 and 10 µM LOP, respectively).

Deactivation kinetics are largely unaffected by LOP. (A) Representative tail currents at −80 mV (following a 20-ms depolarization to 90 mV) with 0 (black traces), 3 µM (red), and 10 µM LOP (blue). Complete trace is shown in inset at right. (B) Representative tail currents at −120 mV, with complete trace shown in inset. (C and D) Tail currents from A and B normalized to the same amplitude. Dashed lines represent single exponential fits to each trace (τ at −80 mV = 2.02, 2.25, and 1.73 ms for 0, 3, and 10 µM LOP, respectively; τ at −120 mV = 0.929, 0.876, and 0.694 ms for 0, 3, and 10 µM LOP, respectively). (E and F) Means of normalized tail currents; SEM is shown as shaded regions. Dashed lines represent single exponential fits to each mean trace (τ at −80 mV = 1.82, 1.99, and 1.77 ms for 0, 3, and 10 µM LOP, respectively; τ at −120 mV = 0.86, 0.82, and 0.85 ms for 0, 3, and 10 µM LOP, respectively).
Deactivation kinetics are largely unaffected by LOP. (A) Representative tail currents at −80 mV (following a 20-ms depolarization to 90 mV) with 0 (black traces), 3 µM (red), and 10 µM LOP (blue). Complete trace is shown in inset at right. (B) Representative tail currents at −120 mV, with complete trace shown in inset. (C and D) Tail currents from A and B normalized to the same amplitude. Dashed lines represent single exponential fits to each trace (τ at −80 mV = 2.02, 2.25, and 1.73 ms for 0, 3, and 10 µM LOP, respectively; τ at −120 mV = 0.929, 0.876, and 0.694 ms for 0, 3, and 10 µM LOP, respectively). (E and F) Means of normalized tail currents; SEM is shown as shaded regions. Dashed lines represent single exponential fits to each mean trace (τ at −80 mV = 1.82, 1.99, and 1.77 ms for 0, 3, and 10 µM LOP, respectively; τ at −120 mV = 0.86, 0.82, and 0.85 ms for 0, 3, and 10 µM LOP, respectively).
In addition to the lack of slowed tail currents, we could not consistently resolve the appearance of a substantial rising phase or plateau preceding the tail current decay in the presence of 3 or 10 µM LOP. Although this does not preclude the existence of a small amplitude or rapid rising or plateau phase, it is likely that such a component would be accompanied by a slowing of the tail current decay (Li and Aldrich, 2004).
As a further test of whether LOP dissociation and disinhibition must precede channel closing, we compared the current amplitudes at the end of pulse to 90 mV with the peak amplitude of the tail current at −80 or −120 mV (I90/I−80 or I90/I−120). We reasoned that if the ratio of these amplitudes in the presence of LOP were the same as the ratio in the absence of LOP, then this would mean that no additional channels were opened following the hyperpolarizing step to allow LOP dissociation. However, if the ratio of these currents were greater in the presence of LOP, then additional channels must open following hyperpolarization to allow LOP dissociation and disinhibition. We observed that I90/I−80 was −1.4 ± 0.08 with 0 LOP, compared with −1.7 ± 0.2 and −1.9 ± 0.2 with 3 and 10 µM LOP, respectively, and the values in the presence of LOP were not significantly different from those with 0 LOP (t test; P = 0.20 for 0 versus 3 µM LOP, P = 0.15, 0 versus 10 µM LOP). For I90/I−120, the values were −0.94 ± 0.05 with 0 LOP, compared with −0.94 ± 0.08 and −0.88 ± 0.07 with 3 and 10 µM LOP, respectively; again, the values in the presence of LOP were not significantly different from those with 0 LOP (t test; P = 0.99 for 0 versus 3 µM LOP, P = 0.48, 0 versus 10 µM LOP). Together, these observations are thus consistent with a majority of the recovery from inhibition at hyperpolarized voltages (−80 and −120 mV) occurring by transitions via a pathway from the open/inhibited through the closed/inhibited states, rather than from the open/inhibited through the open/conducting states.
Based on the tail current kinetics at −120 mV, the apparent closing rate in the presence of 3 µM LOP (1/τclosing), 1,460 ± 69 s−1 (n = 11 patches) is approximately three times faster than the recovery rate under the same conditions (471 s−1). In addition, at −80 mV, the apparent closing rate in the presence of 3 µM LOP (1/τclosing) of 684 ± 57 s−1 (n = 9) was also ∼2.8-fold faster than the recovery rate under the same conditions (242 s−1). While the closing rate reflects the time course of transitions from the open/conducting to the closed states, we reason that the recovery rate likely reflects the time course of transitions from both the open/inhibited and closed/inhibited to the closed/disinhibited states. This is because upon depolarization, the current increases as a function of occupancy of the closed/disinhibited states. Thus, because recovery can continue well after channels are closed, these observations seem further consistent with the idea that LOP can dissociate from the inhibitory site after channel closing.
Use-dependent inhibition
The apparent state dependence of LOP inhibition suggests that LOP may act as a use-dependent inhibitor, producing inhibition that would be greatest during periods of high channel activity and decreased or absent during low activity. To test the dynamic properties of inhibition, we recorded BKα currents (with 88 µM Ca2+) in response to trains of depolarizing steps over a range of frequencies in the absence and presence of 3 µM LOP.
In an initial series of experiments, the membrane potential was stepped from −60 to +90 mV with a 50% duty cycle at effective frequencies of 500, 250, 125, and 62.5 Hz (i.e., depolarizing pulse durations of 1, 2, 4, and 8 ms at intervals equal to the pulse duration). With this protocol, although the number of pulses in a train was varied, the open time during each train was approximately equal. If inhibition required channel opening, then the rate of inhibition (i.e., the rate of current decline) might be the same for each train, independent of pulse frequency. The development of inhibition is shown as the current amplitude versus open time from the beginning of the pulse train (Fig. 11 A). Consistent with dependence on channel open time, both the time constant of current decline and the final level of inhibition are approximately the same over the range of pulse frequencies tested (Table S10).
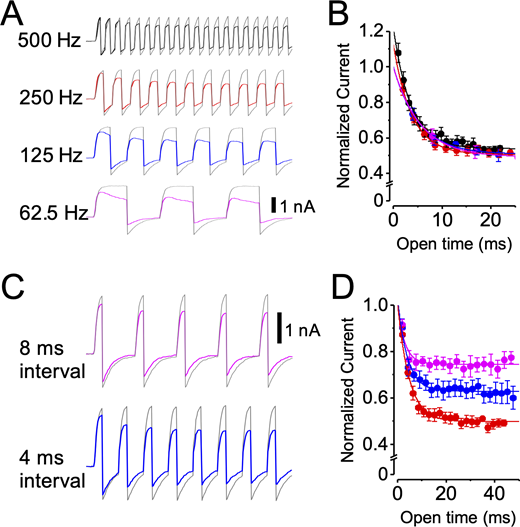
LOP inhibition is use dependent.(A) Representative currents from pulse train experiments using a 50% duty cycle (stepping between −60 and 90 mV) with 0 (gray traces) or 3 µM LOP (superimposed color traces) at the indicated pulse frequencies. Vertical scale bar, 1 nA. (B) Normalized tail currents plotted as a function of open time for trains at 500 (black), 250 (red), 125 (blue), and 62.5 Hz (magenta). Superimposed curves show fits with single exponential functions (mean parameters in Table S10). (C) Representative currents from pulse train experiments using 2-ms steps to 90 mV with steps to −60 mV with the indicated duration, with 0 (gray traces) or 3 µM LOP (superimposed color traces). 2-ms interval in these experiments is represented by 250-Hz traces in A. Vertical scale bar, 1 nA. (D) Normalized tail currents plotted as a function of open time for trains using 8-ms (magenta), 4-ms (blue), and 2-ms (red) interpulse intervals at −60 mV. Superimposed curves show fits with single exponential functions (mean parameters in Table S10). Trains with longer −60-mV intervals show decreased inhibition. Symbols and error bars represent means ± SEM.
LOP inhibition is use dependent.(A) Representative currents from pulse train experiments using a 50% duty cycle (stepping between −60 and 90 mV) with 0 (gray traces) or 3 µM LOP (superimposed color traces) at the indicated pulse frequencies. Vertical scale bar, 1 nA. (B) Normalized tail currents plotted as a function of open time for trains at 500 (black), 250 (red), 125 (blue), and 62.5 Hz (magenta). Superimposed curves show fits with single exponential functions (mean parameters in Table S10). (C) Representative currents from pulse train experiments using 2-ms steps to 90 mV with steps to −60 mV with the indicated duration, with 0 (gray traces) or 3 µM LOP (superimposed color traces). 2-ms interval in these experiments is represented by 250-Hz traces in A. Vertical scale bar, 1 nA. (D) Normalized tail currents plotted as a function of open time for trains using 8-ms (magenta), 4-ms (blue), and 2-ms (red) interpulse intervals at −60 mV. Superimposed curves show fits with single exponential functions (mean parameters in Table S10). Trains with longer −60-mV intervals show decreased inhibition. Symbols and error bars represent means ± SEM.
To further analyze LOP inhibition kinetics, we recorded responses to trains of brief depolarizations (90 mV, 2 ms) elicited at intervals of 2, 4, and 8 ms in which the patch was held at −60 mV (Fig. 11, C and D). Consistent with the idea that LOP rapidly inhibits the channel at 90 mV and recovers at −60 mV, we observed that longer recovery intervals at −60 mV led to a decreased level of inhibition (normalized current, 0.74 ± 0.032 with 8-ms interval; Fig. 11 D, magenta symbols), whereas briefer recovery intervals led to greater inhibition normalized current (0.50 ± 0.019 with 2-ms interval; Fig. 11 D, red symbols). This pattern of use-dependent inhibition could potentially alter action potential shape and firing patterns in neurons containing BK channels.
Quantitative description of mechanism
We next sought to account quantitatively for the inhibitory effects of LOP on BK channels. We reasoned that a valid kinetic scheme should minimally describe the steady-state activity of the channel over the range of [LOP] assessed in our experiments (from 0 to 30 µM), with either nominally 0 or 88 µM Ca2+, over a wide range of voltages and Po’s.
We developed a general scheme, Scheme 1, to describe LOP inhibition over a wide range of voltage and [Ca2+], based the dual allosteric model for BK channel activation (described in Materials and methods; Horrigan and Aldrich, 2002; Rothberg and Magleby, 1999, 2000). In the context of Scheme 1, without LOP, the channel gates among closed (C) and open (O) states corresponded to C and O conformations with 0, 1, 2, 3, or 4 VSDs and/or 0, 1, 2, 3, or 4 CSDs in the activated state. In a relatively simple inhibitory mechanism, each of these conformations can, in turn, bind a LOP molecule, giving rise to a set of LOP-bound blocked (B) states equal to the number of LOP-free C and O states. The transition of each state from LOP free to LOP bound is described by the equilibrium constant M. In addition, preference of LOP binding to the O versus C states is described by the coupling constant H, such that if H > 1, then this would indicate a relative preference for LOP binding to the O states. The parameters in Scheme 1 relate to channel activity as described by Eq. 7, with only nine free parameters to describe activity at nominally 0 and 88 µM Ca2+ over a 450-mV range of voltages, and Po ranging over seven orders of magnitude.

We used global (simultaneous) fitting to estimate parameters in Scheme 1 (Eq. 7), using pooled G-V and Po-V data at six different [LOP] values of 0, 0.1, 0.3, 1, 3, 10, and 30 µM. Scheme 1 thus enabled quantitative testing of the hypotheses that LOP binding drives the gating toward the blocked state and that LOP blockade is preferentially coupled to channel opening. Because our data in these studies focused on blockade in nominally 0 and 88 µM Ca2+, it was necessary to constrain the Kd for Ca2+ binding in the closed state (1/K from Eq. 7) to a fixed value of 20 µM, consistent with previous estimates (Horrigan and Aldrich, 2002; Sweet and Cox, 2008).
Fig. 12 A shows G-V data over a wide range of voltages, [Ca2+], and [LOP], with activity predicted by Scheme 1 superimposed on the experimental data, using Scheme 1 with the value of H fixed at 1 (referred to as Scheme 1). We observed that in the context of Scheme 1, although it is possible to nearly recapitulate the effect of LOP on channel activity at depolarized voltages, the scheme predicts decreasing Po values related to increasing [LOP] at very negative voltages, suggesting a level of blockade in closed-deactivated channels that is clearly inconsistent with the experimental data. The value of KLOP in both the closed and open states in the context of Scheme 1 is 2.24 µM (Table S11). Although this is close to the range of IC50 values determined from Hill equation fits with data at depolarized voltages, the scheme does not predict a decrease in affinity at hyperpolarized voltages as observed in the experimental data (Fig. 12 B).
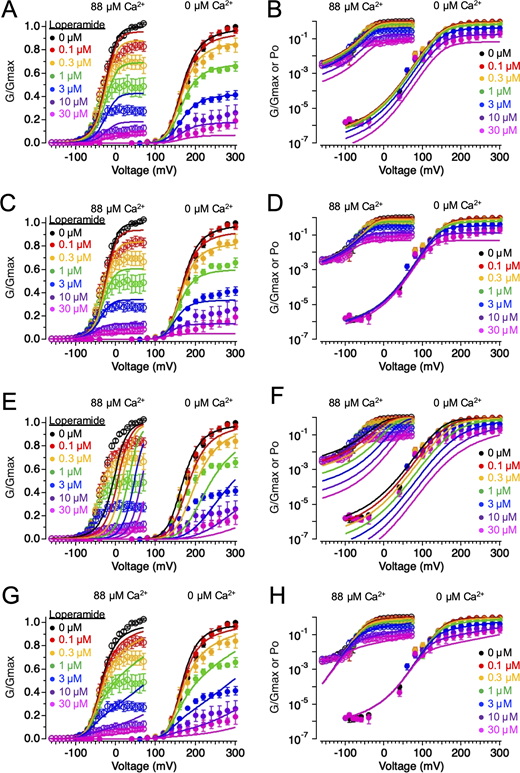
Quantitative description of LOP effects on BK channel activity.(A) G-V and Po-V relations from currents with nominally 0 Ca2+ (data at the right side of the plot, voltage range 60 to 300 mV) and 88 µM Ca2+ (data at the left side of the plot, voltage range −160 to 70 mV) at the indicated [LOP]. Solid lines represent fits using Scheme 1 (Eq. 7; parameters in Table S11). (B) G-V and Po-V relations from A presented on semilogarithmic coordinates to show data points and predicted curves with low Po. (C and D) Experimental data presented as in A and B; solid lines show fits using Scheme 2. (E and F) Experimental data, with fits using Scheme 3. (G and H) Experimental data with fits using Scheme 4. Scheme 2, which represents a pore-blocking model in which LOP binding yields a relative stabilization of the open/blocked state, provides the best description of the experimental data among these examined schemes. Symbols and error bars represent means ± SEM.
Quantitative description of LOP effects on BK channel activity.(A) G-V and Po-V relations from currents with nominally 0 Ca2+ (data at the right side of the plot, voltage range 60 to 300 mV) and 88 µM Ca2+ (data at the left side of the plot, voltage range −160 to 70 mV) at the indicated [LOP]. Solid lines represent fits using Scheme 1 (Eq. 7; parameters in Table S11). (B) G-V and Po-V relations from A presented on semilogarithmic coordinates to show data points and predicted curves with low Po. (C and D) Experimental data presented as in A and B; solid lines show fits using Scheme 2. (E and F) Experimental data, with fits using Scheme 3. (G and H) Experimental data with fits using Scheme 4. Scheme 2, which represents a pore-blocking model in which LOP binding yields a relative stabilization of the open/blocked state, provides the best description of the experimental data among these examined schemes. Symbols and error bars represent means ± SEM.
We next fitted Scheme 1 allowing the value of H to be estimated as a free parameter, as Scheme 2. This resulted in an estimated H of 34.4 (i.e., a 34.4-fold difference in LOP affinity between the closed and open states; Table S11). The value of KLOP in the closed state was 53.4 µM; thus, the estimated KLOP in the open state was 1.6 µM (53.4 µM/34.4). As with Scheme 1, Scheme 2 provided reasonable predictions of Po over a range of [LOP] at depolarized voltages (Fig. 12 C), but Scheme 2 additionally predicted the observed decreased action of LOP at hyperpolarized voltages (Fig. 12 D). Thus, Scheme 2 yielded a statistically improved description of the experimental data over Scheme 1 (χ2 = 822.3 for Scheme 2; 2456.0 for Scheme 1; Table S10) while capturing the major features of LOP blockade over a wide range of voltages, [Ca2+], and [LOP].

Schemes 1 and 2 both describe a mechanism in which LOP binding results in blockade of the pore, such that LOP-bound open and closed states are nonconducting. However, an alternative mechanism, based on our experimental observations, is that LOP could bind to an activated state to inhibit the channel by eliciting strong stabilization of closed states (Scheme 3). To test this idea, we estimated parameters in Eq. 8, which again describe gating among closed and open states with 0, 1, 2, 3, or 4 VSDs and/or 0, 1, 2, 3, or 4 CSDs in the activated states; however, in this scheme, the LOP-bound open states are fully conducting, and thus inhibition must arise from coupling of LOP binding to channel closing. This can be achieved in the context of Eq. 8 if the value of H is <1.

Fig. 12, E and F, illustrates that fitting with Scheme 3 could describe limited aspects of the gating in nominally 0 Ca2+ and in the low range of [LOP], but it yielded an overall poor description of the G-V curves over a broader range of voltage, [Ca2+], and [LOP]. To describe LOP-dependent inhibition, the value of H was estimated as a limiting small value (10−6), consistent with LOP-bound channels effectively remaining in closed states and rarely opening (Table S11). Although this could account for some aspects of LOP inhibition in nominally 0 Ca2+, CSD activation drives the C-O equilibrium even more strongly to open states, and this was not effectively counteracted by the low value of H.
To test whether a form of Scheme 3 might account for LOP inhibition by incorporating a parameter in which LOP binding was enhanced by VSD activation, which might also be consistent with experimental observations, we allowed an additional coupling factor, F, to be fitted, such that each VSD activation would change LOP binding by F-fold (Scheme 4). This approach yielded an improved description of the data (Fig. 12, G and H) and predicted decreases in Gmax that were roughly consistent with the observed LOP dependence, while also predicting the decreased effect of LOP in channels with VSDs in the resting state. However, Scheme 4 notably does not predict the plateaus in Po that are apparent in each G-V curve with increasing depolarization, and it also predicts a much lower Po at hyperpolarized voltages with 88 µM Ca2+ than that observed in experiments. Scheme 4 yielded a much better description of the data than Scheme 4 using several parameters that were quite different from Scheme 3, specifically by assuming a much lower affinity of the channel for LOP (KLOP reaching a limiting value of 35 mM LOP for Scheme 4), and also by incorporating a much stronger coupling between VSD and CSD activation (E = 174 in Scheme 4, >80 times the estimate for Scheme 3; Table S11). These two key differences resulted in LOP binding minimally at hyperpolarized voltages with either 0 or 88 µM Ca2+, but binding much more strongly with depolarization to drive the channel toward closed states, in Scheme 3.

Physical working hypothesis for LOP blockade
Our electrophysiological studies and subsequent analysis are consistent with a mechanism in which LOP acts as a pore blocker of BK channels. To explore the feasibility of a pore-blocking mechanism in the context of the human BK channel structure, we used in silico molecular docking of computed structures of LOP in conjunction with the cryo-EM structure of the human BK channel to determine a series of hypothetical binding poses in the BK channel pore (Tao and MacKinnon, 2019). Our results illustrate that an LOP molecule can fit snugly in the BK channel pore with a number of equivalent and presumed energetically favorable binding poses.
A representative binding pose is shown in Fig. 13 to illustrate the salient properties of the top nine ranked poses, all of which yielded scores ranging from −8.1 to −8.4 kcal/mol (determined using AutoDock Vina and not to be interpreted as estimates of binding free energy; see Materials and methods). The LOP molecule occupies a position in the cavity where the protonated nitrogen atom of the piperidine ring is located near the central axis of the pore, ∼3 Å below the plane formed by the T287 side chain oxygens, similar to the position in which QA nitrogens are thought to be located, based on experimentally determined K+ channel structures (Lenaeus et al., 2005; Posson et al., 2013). In addition, the hydroxyl group of LOP can be located at any of four equivalent off-axis positions in the cavity, within 2.9 Å of the side chain oxygen of T287, to form a putative hydrogen bond at the threshold of the selectivity filter. Finally, the aromatic rings located at the distal ends of the molecule form favorable steric interactions with hydrophobic side chains on the S6 helices (L312, F315, A316, V319, and P320) located at diagonally opposed subunits lining the cavity. Although hypothetical, the top-ranked LOP binding pose is at the threshold of the selectivity filter, near the physical edge of the transmembrane electric field (Jiang et al., 2002). Binding at this position would thus be consistent with the weak observed intrinsic voltage dependence of IC50 at depolarized voltages (0.14 e0; Figs. 1 G, 3 G, and 4 G).

Working hypothesis of LOP binding in the BK channel pore. (A) Structure of the BK channel transmembrane domains (S0 through S6 helices, residues 16–343), with LOP (sticks surrounded by gray surface) in a hypothetical binding pose in the cavity of the pore, determined by AutoDock Vina. Two of the four α-subunits are shown side by side (colored yellow and cyan) to visualize the transmembrane pore region. (B) Hypothetical LOP binding pose, viewed from the cytosolic end of the pore. LOP is extended across the diagonal axis of the cavity. (C) Closer view of the red boxed region in A. LOP is situated with the charged piperidine nitrogen at the central axis of the pore, near the threshold of the selectivity filter. The LOP hydroxyl group forms a putative hydrogen bond with the filter residue T287 (indicated by green dashed line), and the diphenyl group occupies a hydrophobic pocket bordered by the S6 side chains L312, F315, A316, V319, and P320.
Working hypothesis of LOP binding in the BK channel pore. (A) Structure of the BK channel transmembrane domains (S0 through S6 helices, residues 16–343), with LOP (sticks surrounded by gray surface) in a hypothetical binding pose in the cavity of the pore, determined by AutoDock Vina. Two of the four α-subunits are shown side by side (colored yellow and cyan) to visualize the transmembrane pore region. (B) Hypothetical LOP binding pose, viewed from the cytosolic end of the pore. LOP is extended across the diagonal axis of the cavity. (C) Closer view of the red boxed region in A. LOP is situated with the charged piperidine nitrogen at the central axis of the pore, near the threshold of the selectivity filter. The LOP hydroxyl group forms a putative hydrogen bond with the filter residue T287 (indicated by green dashed line), and the diphenyl group occupies a hydrophobic pocket bordered by the S6 side chains L312, F315, A316, V319, and P320.
Discussion
Possible physiological actions of LOP
LOP is a widely used over-the-counter medication that is used to treat diarrhea, and it is on the World Health Organization’s List of Essential Medicines (World Health Organization, 2019). LOP is known to be a potent MOR agonist and exerts its therapeutic effect in part by activating MORs in myenteric plexus neurons (located just peripheral to the intestinal mucosa) to inhibit their ability to drive intestinal peristalsis (Mackerer et al., 1976). The IC50 for LOP to inhibit contractions in intestinal longitudinal muscle is in the nanomolar range (Giagnoni et al., 1983; Mackerer et al., 1976), consistent with therapeutic levels of LOP in this tissue.
Although LOP can bind to either peripheral or brain MORs, orally administered LOP is almost entirely retained in the intestinal epithelium and lumen (Miller et al., 2017; Miyazaki et al., 1982; Miyazaki et al., 1979; Vakkalanka et al., 2017). Thus, with a therapeutic dose of 2–4 mg, plasma levels of LOP in humans generally do not exceed 2 ng/ml (∼4 nM), suggesting that relatively little paracellular transport of LOP occurs. In contrast, the concentration of LOP in the intestinal lumen with a therapeutic dose may be 8 µM or more (assuming its solvation in 1 liter of luminal fluid).
BKα/γ1 channels are known to be expressed in intestinal epithelium, where they form a major pathway for resting K+ secretion into the intestinal lumen in a system that is important for physiological electrolyte balance (Gonzalez-Perez et al., 2021; Sausbier et al., 2006; Sørensen et al., 2010; Yang et al., 2017). In disease that leads to diarrhea, where excessive intestinal water loss can be accompanied by K+ loss, it seems plausible that introduction and uptake of LOP into epithelial cells could lead to blockade of BK channels and consequently limit K+ loss to prevent hypokalemia (Brayden et al., 1997; Tytgat et al., 1977; Wehner et al., 1989).
Our experiments suggest that LOP may cross the cell membrane to inhibit BK currents in HEK-293T cells overexpressing BKα/γ1 channels (Figs. 2 B and 5), consistent with previous work showing that LOP can enter epithelial cells (Acharya et al., 2006; Miyazaki et al., 1982; Miyazaki et al., 1979). If the average transit time through the human colon is at least 10 h even in pathological conditions (such as diarrhea), then it seems plausible that LOP could be absorbed into intestinal cells to inhibit K+ efflux through BK channels in terms of the time frame of physiological exposure (Mourad et al., 1992; Yuan et al., 2012).
Very high doses of LOP can increase systemic and central nervous system absorption of LOP and potentially elicit an opioid-like euphoria, although dangerous side effects can occur (Klein et al., 2016; Miller et al., 2017; Vakkalanka et al., 2017). Aside from its actions on opioid receptors, LOP can inhibit Ca2+ channels, and may also inhibit cardiac HERG or other channels, leading to respiratory depression and cardiac arrhythmia (Hughes and Crowe, 2010; Klein et al., 2016; Ollier et al., 2015). It will be important to further understand mechanisms of LOP action to inform mechanisms underlying these adverse events.
Limitations of Scheme 2
We have found that state-dependent blockade of BK channels by LOP can be described quantitatively by Scheme 2, in which LOP binds preferentially to the channel in the open state and blocks K+ conduction through the pore. In the context of Scheme 2, the channel can undergo gating transitions between open/blocked and closed/blocked states with LOP bound, while LOP has a relative stabilizing effect on the open/blocked state and readily dissociates from closed channels upon hyperpolarization, consistent with experimental observations (Fig. 12, C and D).
Although the major features of LOP inhibition are described by Scheme 2, this scheme does not predict all aspects of the experimental data. Instead of predicting the greater apparent affinity of open channels for LOP in high Ca2+ compared with nominally 0 Ca2+ (0.87 µM versus 2.2 µM, respectively), Scheme 2 predicts a smaller shift in apparent affinity (1.5 µM versus 1.6 µM). The scheme could account reasonably well for IC50 values at nominally 0 Ca2+, but predicted overall higher values for IC50 at 88 µM Ca2+ (Fig. S2). Our measurements of channel activity in the presence of LOP appeared to be at equilibrium in both nominally 0 and 88 µM Ca2+ (Fig. S1); however, if blockade was not at full equilibrium with some experiments in nominally 0 Ca2+, this could contribute to some of the apparent shift toward greater IC50 values in this condition. Aside from this possibility, differences between IC50 values observed with 0 versus 88 µM Ca2+ in the experimental data may also arise in part from a difference in pore conformation and/or electrostatic profile that is linked to Ca2+ activation, which is not explicitly parameterized in the context of Scheme 2. In addition, although Scheme 2 does predict shifts in V1/2 with increasing LOP, it does not quantitatively predict the experimental V1/2 values, yielding V1/2 values that are more depolarized than experimental values with 88 µM Ca2+ and more negative than experimental values with nominally 0 Ca2+ (Table S12 and Table S13).

IC50 versus voltage relations predicted using Scheme 2. (A and B) IC50 versus voltage (open diamonds) from experimental data with nominally 0 Ca2+ (A) and 88 µM Ca2+ (B), with predicted IC50 values using Scheme 2 (red circles). Predicted IC50 values were estimated by fitting predicted conductance versus [LOP] relations at the indicated voltages with a Hill equation. Predicted IC50 versus voltage relations were fitted with Eq. 4 (nominally 0 Ca2+: A = 10,000; zδ = 1.33 e0; IC50(∞) = 1.64 µM; 88 µM Ca2+: A = 0.44; zδ = 1.37 e0; IC50(∞) = 1.46 µM). Symbols and error bars represent means ± SEM.
IC50 versus voltage relations predicted using Scheme 2. (A and B) IC50 versus voltage (open diamonds) from experimental data with nominally 0 Ca2+ (A) and 88 µM Ca2+ (B), with predicted IC50 values using Scheme 2 (red circles). Predicted IC50 values were estimated by fitting predicted conductance versus [LOP] relations at the indicated voltages with a Hill equation. Predicted IC50 versus voltage relations were fitted with Eq. 4 (nominally 0 Ca2+: A = 10,000; zδ = 1.33 e0; IC50(∞) = 1.64 µM; 88 µM Ca2+: A = 0.44; zδ = 1.37 e0; IC50(∞) = 1.46 µM). Symbols and error bars represent means ± SEM.
To test whether coupling between CSD activation and LOP binding could account for the observed relation between IC50 values and [Ca2+], we incorporated a coupling constant (W) in the context of Eq. 7 (see Materials and methods) to yield Scheme 5 and fitted the experimental data with Scheme 5 to determine whether the predictions were improved. Although the additional coupling constant (with a fitted value of 1.09) resulted in an overall statistical improvement in the fits (χ2 =770.1 with W = 1.09 versus 822.3 with W = 1; Table S11), the improvement in prediction of V1/2 values was nominal. Because the actual gating mechanism of BK channels is known to be more complex than that represented within the simplified Schemes 1, 2, and 3, with multiple Ca2+ binding sites on each subunit instead of one Ca2+ site per subunit represented in these schemes, it is possible that a more complex scheme taking multiple Ca2+ sites into account could provide a better description of the inhibitory mechanism (Magleby, 2003; Qian et al., 2006; Zeng et al., 2005). Thus, based on its limitations, Scheme 2 should be considered only as an initial working hypothesis of the mechanism.

Conclusions
As a use-dependent blocker, the mechanism of LOP inhibition appears to be different from that of the selective BK inhibitors paxilline or iberiotoxin, opening the possibility of identifying a new class of small-molecule BK channel inhibitors that might specifically mitigate gain-of-function mutations that underlie BK channelopathies (Candia et al., 1992; Du et al., 2005; Giangiacomo et al., 1992; Moldenhauer et al., 2020; Wang et al., 2009; Zhou and Lingle, 2014; Zhou et al., 2020). Further development of this possibility would require an understanding of structure–activity relations for LOP and related compounds in terms of their actions on BK and other channels.
Acknowledgments
Christopher J. Lingle served as editor.
The authors thank Vincenzo Carnevale and Christine Neville for helpful discussions on interpretation of molecular docking results.
This work was supported by National Institutes of Health grant R01 GM126581 to B.S. Rothberg and National Institutes of Health grant R01 NS078152 to J. Yan.
The authors declare no competing financial interests.
Author contributions: A.G. Vouga designed experiments, acquired and analyzed data, and wrote the first draft of the manuscript. M.E. Rockman assisted with acquiring and analyzing data. M.A. Jacobson assisted with acquiring and analyzing data and provided critical reagents. J. Yan provided critical reagents. B.S. Rothberg supervised the project, designed experiments, analyzed data, and reviewed and edited the manuscript.

