


Voltage-gated sodium (NaV) channels are responsible for the initiation and propagation of action potentials. In the heart, the predominant NaV1.5 α subunit is composed of four homologous repeats (I–IV) and forms a macromolecular complex with multiple accessory proteins, including intracellular fibroblast growth factors (iFGF). In spite of high homology, each of the iFGFs, iFGF11–iFGF14, as well as the individual iFGF splice variants, differentially regulates NaV channel gating, and the mechanisms underlying these differential effects remain elusive. Much of the work exploring iFGF regulation of NaV1.5 has been performed in mouse and rat ventricular myocytes in which iFGF13VY is the predominant iFGF expressed, whereas investigation into NaV1.5 regulation by the human heart-dominant iFGF12B is lacking. In this study, we used a mouse model with cardiac-specific Fgf13 deletion to study the consequences of iFGF13VY and iFGF12B expression. We observed distinct effects on the voltage-dependences of activation and inactivation of the sodium currents (INa), as well as on the kinetics of peak INa decay. Results in native myocytes were recapitulated with human NaV1.5 heterologously expressed in Xenopus oocytes, and additional experiments using voltage-clamp fluorometry (VCF) revealed iFGF-specific effects on the activation of the NaV1.5 voltage sensor domain in repeat IV (VSD-IV). iFGF chimeras further unveiled roles for all three iFGF domains (i.e., the N-terminus, core, and C-terminus) on the regulation of VSD-IV, and a slower time domain of inactivation. We present here a novel mechanism of iFGF regulation that is specific to individual iFGF isoforms and that leads to distinct functional effects on NaV channel/current kinetics.
Introduction
In the heart, voltage-gated sodium (NaV) channels are responsible for the rapid upstroke of action potentials (APs) in atrial and ventricular myocytes, and in Purkinje fibers (Nerbonne and Kass, 2005). The predominant NaV channel pore-forming (α) subunit responsible for generating these channels in the mammalian myocardium is NaV1.5 (Abriel and Kass, 2005). Precise regulation of NaV1.5 gating is essential for the proper electromechanical functioning of the heart and the disruption of gating in acquired and inherited cardiac diseases predisposes individuals to potentially life-threatening arrhythmias (Noble and Noble, 2006; Mangold et al, 2017; Ton et al, 2021). Mutations in SCN5A, the gene which encodes NaV1.5, for example, are linked to congenital cardiac arrhythmia syndromes, including the long QT type 3 (LQT3) and Brugada syndromes (Ruan et al., 2009). Similar to other NaV α-subunits, NaV1.5 has four homologous repeats (I–IV), each of which contains six α-helical transmembrane segments (S1–S6; Yu and Catterall, 2003). The S1–S4 segments in each repeat form the voltage sensor domains VSD-I through VSD-IV, and the S5–S6 segments in the four repeats combine to constitute the Na+-selective pore. The activation of each VSD on membrane depolarization is coupled to conformational changes in the channel, leading to a rapid opening of the activation gate, followed closely by channel inactivation (Varga et al., 2015).
Native myocardial NaV channels function in macromolecular complexes, comprising the NaV1.5 α-subunit and various auxiliary subunits, including NaV β-subunits (Calhoun and Isom, 2014), calmodulin (CaM; Gardill et al, 2019), and intracellular fibroblast growth factors (iFGFs; Yang et al., 2016; Pitt and Lee, 2016) that influence channel stability, trafficking, and biophysical properties (Abriel and Kass, 2005; Meadows and Isom, 2005; Abriel, 2010). It has been previously demonstrated that the auxiliary β-subunits differentially regulate the expression, gating, and pharmacological sensitivity of NaV channels (Dhar Malhotra et al, 2001; Zhu et al, 2017; Angsutararux et al, 2021b). Although less well-studied, iFGFs have been shown to bind to the C-terminal domain of NaV α-subunits, including NaV1.5, and to modulate the time- and voltage-dependent properties of heterologously expressed (Liu et al., 2001; Liu et al., 2003) and native (Pablo and Pitt, 2017; Goldfarb et al., 2007) NaV1.5-encoded currents.
The iFGFs, also known as fibroblast growth factor homologous factors (FHFs), are a subfamily of FGFs, consisting of iFGF11–iFGF14 that have similar “core” sequences and distinct N-termini (Olsen et al., 2003; Goldfarb, 2005). Alternative exon usage and differential N-terminal splicing generate further iFGF protein diversity (Munoz-Sanjuan et al., 2000; Pablo and Pitt, 2017). The crystal structure of the NaV1.5 C-terminus in complex with iFGF13 and CaM revealed that the binding of iFGF13 is mediated by amino acids in the core domain (Wang et al., 2012; Musa et al., 2015; Hennessey et al., 2013). The earlier structure of iFGF12 alone (Goetz et al., 2009) and the later structure of iFGF12B in complex with NaV1.5 C-terminus and CaM (Wang et al., 2014) reveal iFGF12 structures nearly identical to iFGF13, especially in the core region. Although these findings suggest that all iFGFs might modulate the properties of NaV channels encoded by a given NaV α-subunit (such as NaV1.5) similarly, this is not the case. Indeed, various iFGF proteins have been shown to exert dramatically different effects on the gating of NaV channels that depend on both the subtype of NaV α-subunit and the specific isoform of iFGF (Munoz-Sanjuan et al., 2000; Liu et al., 2003; Goetz et al., 2009; Wang et al., 2011b; Chakouri et al., 2022). For example, three iFGF13 splice variants, iFGF13S (iFGF13A), iFGF13U (iFGF13B), and iFGF13VY, were shown to produce distinct effects on the gating of NaV1.5 channels (Yang et al., 2016). Two iFGF14 isoforms, iFGF14A and iFGF14B, have also been shown to differentially modulate NaV1.5-encoded currents and to produce functional effects markedly different from iFGF13-mediated effects (Lou et al., 2005).
The most prominent iFGF expressed in the human heart, iFGF12B, has been linked to inherited cardiac arrhythmias (Hennessey et al., 2013; Li et al., 2017). In addition, LQT3 and Brugada syndrome-linked mutations in NaV1.5 have been shown to disrupt iFGF binding and/or to modify iFGF-mediated effects on the properties of NaV1.5-encoded currents (Musa et al., 2015; Liu et al., 2003). The mechanisms underlying iFGF12B-mediated regulation of cardiac NaV1.5 channels, however, have not been defined. The experiments here were designed to address this knowledge gap and, in addition, to directly compare the effects of iFGF12B on cardiac NaV1.5 channels with those of the extensively studied iFGF13VY, the predominant iFGF expressed in rodent ventricles (Wang et al., 2011a; Park et al., 2016).
Materials and Methods
Experimental animals
Adult (8–20-wk-old) male and female wild-type (WT), Fgf12KO, Fgf13 floxed, and cFgf13KO C57BL/6J mice were used in the experiments here. The Fgf12KO line (Goldfarb et al., 2007) was obtained from Drs. Mitchell Goldfarb (City University of New York, New York, NY) and David Ornitz (Washington University School of Medicine, St. Louis, MO). The Fgf13 floxed and cFgf13KO lines were generated as described below. The transgenic C57BL/6J mouse line (Tg(Myh6-cre)2182Mds), expressing Cre-recombinase driven by the cardiac-specific α-myosin heavy chain (α-MHC) promoter, was purchased from The Jackson Laboratory. Adult female Xenopus laevis of sizes >9 cm were obtained from Xenopus 1 Corp, and oocytes were harvested using previously described methods (Varga et al., 2015). All animals were handled in accordance with the National Institutes of Health (NIH) Guide for the Care and Use of Laboratory Animals, and all experimental protocols were approved by the Washington University Institutional Animal Care and Use Committee (IACUC).
Generation and validation of mice with cardiac specific deletion of Fgf13 (cFgf13KO)
To enable conditional deletion of Fgf13, mice in which the Fgf13 locus (on the X chromosome) was floxed were generated by the Genome Editing and Stem Cell (GESC) Center in the McDonnell Genome Institute and the Mouse Genetics Core at Washington University using CRISPR-Cas9 gene editing technology (Doudna and Charpentier, 2014), modified to provide robust and reliable generation of floxed alleles (Sentmanat et al., 2022). Briefly, guide RNAs (gRNAs) and single-stranded oligodeoxynucleotides (ssODNs) were designed to introduce a 5′-side LoxP (5′ LoxP) site into the intron upstream of exon 2 and a 3′-side LoxP (3′ LoxP) site into the intron downstream of exon three of the Fgf13 gene (Fig. S1 A). These gRNAs and ssODNS, together with Cas9, were electroporated into single-cell C57BL/6J embryos, and these embryos were transferred into the oviducts of pseudopregnant females, ∼20 embryos per recipient.
Following preliminary screening of the founder (F0 generation) pups, proper insertion and localization of the loxP sites were confirmed by sequencing. To ensure germline transmission and that both loxP sites were on the same allele, F0 animals positive for both loxP sites were crossed to WT C57BL/6J animals and the resulting (F1 generation) offspring were also screened by sequencing. Heterozygous Fgf13 floxed (Fgf13fl/+) female and hemizygous Fgf13 floxed (Fgf13fl/y) male (F1) offspring were mated to produce (F2) females homozygous for the floxed Fgf13 locus, Fgf13fl/fl (Fig. S1 A). The Fgf13fl/fl and Fgf13fl/y animals were then crossed with transgenic animals (Tg(Myh6-cre)2182Mds) expressing Cre-recombinase driven by the (cardiac specific) α-MHC promoter (Fig. S1 A). Crossing Cre-recombinase-expressing hemizygous male (Fgf13fl/y) offspring with Fgf13fl/fl females (or Cre-recombinase-expressing heterozygous Fgf13fl/+ females with Fgf13fl/y males) provided cardiac-specific Fgf13 targeted deletion hemizygous male (cFgf1−/y) and homozygous female (cFgf13−l−) animals, referred to here collectively as cardiac-specific Fgf13 knockouts, cFgf13KO. Offspring (from this and subsequent crosses) were screened by PCR using the primers given in Table S1 A, and representative results are illustrated in Fig. S1 B.
To confirm the elimination of the iFGF13 protein in the myocardium of cFgf13KO animals, protein lysates were prepared from WT and cFgf13KO left ventricles (LVs). Following protein fractionation and transfer, membranes were probed with a polyclonal anti-FGF13 antibody (generously provided by Dr. Geoffrey Pitt, Weill Cornell Medical School, New York, NY). As illustrated in Fig. S1 C (left panel), two bands, at ∼32 and ∼24 kD, were detected with the anti-iFGF13 antibody in the WT LV samples, whereas these bands were not detected in the cFgf13KO LV samples, consistent with the elimination of the iFGF13 protein. Similar analyses, conducted on LV protein lysates prepared from Fgf12KO animals, revealed iFGF13 protein expression indistinguishable from that observed in WT LV (Fig. S1 C, right panel).
AAV vector production
AAV9 vectors were prepared by the Hope Center Viral Vectors Core at Washington University, as described previously (Zolotukhin et al, 2002). Briefly, HEK-293 cells, maintained in Dulbecco’s modified Eagle’s medium (DMEM), supplemented with 5% fetal bovine serum (FBS), 100 U/ml penicillin, and 100 µg/ml streptomycin at 37°C in a 95% air/5% CO2 incubator, were plated at 30–40% confluence in CellSTACS (Corning). Approximately 24 h later, cells were cotransfected with 0.6 mg of the AAV transfer plasmid containing the construct of interest (e.g., human iFGF12B, hFGF12B) and 1.8 mg of a helper plasmid (pXYZ1) using the calcium phosphate precipitation method (Zolotukhin et al, 2002). The transfection medium was removed after 6 h, and the cells were incubated at 37°C for 3 d. For harvesting, cells were lysed by three freeze/thaw cycles and the cell lysates were collected and treated with 50 U/ml of Benzonaze, followed by iodixanol gradient centrifugation. The iodixanol gradient fraction was further purified on a HiTrap Q column and concentrated (Zolotukhin et al, 2002). The vector titer of hFGF12B, determined by Dot blot assay, was 3.8 × 10¹³ vg/ml (viral genomes/ml).
Virus injections
Adult (8–12 wk) male and female WT and cFgf13KO C57BL/6J mice were anesthetized by intraperitoneal (ip) injection of 1 ml/kg of a ketamine/xylene (30 mg/ml/4 mg/ml) cocktail; the body temperature was maintained at 37°C with a feedback-controlled heating pad. Each animal was placed on its left side with the head facing to the right, and virus injections were made into the right retro-orbital sinus. Gentle downward pressure was applied to the skin dorsal and ventral to the eye, making the eye protrude slightly. Retro-orbital injection of a 1:1 mixture of the hFGF12B-expressing (20 μl) and the eGFP-expressing AAV9 (20 μl) viruses was then made. For injections, the virus solution (20–40 μl) was drawn up into an (0.5 ml) insulin syringe and the (12.7 mm) syringe needle was then placed at the medial canthus of the eye at an angle of ∼30° and with the bevel facing down. After inserting the needle until it reached the back of the orbit, the virus solution was injected (10 μl/min) slowly. The needle was then gently and slowly removed to prevent damage to the eye. The grips around the eye were then released, the eyelid was closed, and mild pressure was applied to the injection site for a few seconds. Animals were monitored for ∼2 h to ensure that there were no unexpected deleterious effects of the anesthesia or the injections and were then returned to their home cages.
To confirm the expression of iFGF12 and determine the time course of eGFP/iFGF12 expression in the ventricles of virus-injected animals, protein lysates were prepared from cFgf13KO LV at 2, 3, and 4 wk following the injections of the hFGF12B-expressing and eGFP-expressing AAV9 viruses. Following protein fractionation and transfer, membranes were probed with a polyclonal anti-eGFP antibody (Fig. S4 A) or with a polyclonal anti-iFGF12 antibody (Fig. S4 B). The anti-iFGF12 antibody was validated using protein lysates prepared from WT and Fgf12KO adult mouse left and right atria. A prominent band at ∼20 kD was detected with the anti-iFGF12 antibody in the WT, but not in the Fgf12KO, atrial protein samples (Fig. S4 C), consistent with the elimination of iFGF12 proteins and validating the anti-FGF12 antibody for Western blot analyses of iFGF12 protein expression.
Xenopus oocyte expression constructs
cDNAs encoding human SCN5A, Fgf12B, and Fgf13VY were produced from pMAX and pBSTA vectors accordingly. Point mutations were made in the SCN5A gene using the QuikChange II site-directed mutagenesis kit (Agilent) with primers from Sigma-Aldrich containing the mutation. The DNA constructs of the iFGF chimeras were synthesized by GeneArt Gene Synthesis (Thermo Fisher Scientific). All mutations and chimeras were confirmed by sequencing. Complementary RNAs (cRNAs) were synthesized with the mMessage mMACHINE T7 Transcription kit (Life Technologies) after linearizing the corresponding cDNAs with the appropriate restriction enzyme and purifying with the NucleoSpin Gel and PCR Clean-up kit (Macherey-Nagel). Each cRNA was reconstituted with double-distilled H2O at a concentration of ∼1 µg/μl.
Myocyte isolation
Myocytes were isolated from the LV of adult (10–20-wk-old) male and female WT, Fgf13 floxed (female Fgf13fl/fl and male Fgf13fl/y), cFgf13KO (female cFgf13−/− and male cFgf13−/y), and Fgf12KO mice by enzymatic and mechanical dissociation using previously described methods (Xu et al. 1999; Brunet et al., 2004). In addition, LV myocytes were isolated from cFgf13KO mice (4–6 wk) after retro-orbital (eGFP- + FGF12B-expressing) AAV9 injections. Briefly, hearts were quickly removed from avertin-anesthetized mice and perfused retrogradely through the aorta with collagenase-containing solution (Type II, Worthington) at 37°C. After 15–20 min perfusion, the LV was separated, minced, and dispersed by gentle trituration. The resulting cell suspension was filtered and resuspended in serum-free medium-199 (M-199; Sigma-Aldrich). Isolated myocytes were plated on laminin-coated coverslips and maintained in a 95% air-5% CO2 incubator at 37°C until used (within 24–48 h) in electrophysiological experiments.
NaV current (INa) recordings from adult mouse LV myocytes
Whole-cell voltage-clamp recordings were obtained from adult mouse LV myocytes within 24–36 h of isolation at room temperature (22–24°C) using an Axopatch 1D (Axon Instruments) amplifier interfaced with a Digidata 1332 data acquisition system (Axon Instruments) and the pClamp 10 (Axon Instruments) software to a Dell computer. Recording pipettes contained (in mM) 90 CsCH3O3S, 20 CsCl, 5 NaCl, 5 MgATP, 0.4 TrisGTP, 10 EGTA, and 10 HEPES (pH 7.3; 300 mOsm). Pipette resistances were routinely 1.5–3.0 MΩ when filled with the recording solution. The bath solution contained (in mM) 20 NaCl, 65 CsCl, 50 TEACl; 2 MgCl2, 1 CaCl2, 0.5 CdCl2, 10 HEPES, and 10 glucose (pH 7.3; 310 mOsm).
Electrophysiological data were acquired at 100 KHz and signals were low-pass filtered at 5 kHz prior to digitization and storage. After the formation of a gigaohm-seal (>1 GΩ) and establishment of the whole-cell configuration, brief (10 ms) ± 10 mV voltage steps from the holding potential (HP) of −90 mV were presented to allow measurements of whole-cell membrane capacitances (Cm), input resistances (Rin), and series resistances (Rs). In each cell, Cm and Rs were compensated electronically by ∼85%; voltage errors resulting from uncompensated series resistances were always <2 mV and were not corrected. Leak currents were always <50 pA and were not corrected.
To determine the voltage-dependences of steady-state inactivation of INa in WT, Fgf13 floxed, cFgf13KO, Fgf12KO, and eGFP- + hFGF12B-expressing cFgf13KO LV myocytes, whole-cell NaV currents, evoked at −30 mV following brief (25 ms) conditioning voltage steps (ranging from −130 to −15 mV in 5 mV increments), presented from a HP of −90 mV, were recorded. Peak INa, evoked at −30 mV from each conditioning potential in each cell, was measured and normalized to the maximal peak current (INa,max) evoked (in the same cell) from the most hyperpolarized conditioning potential (of −130 mV). Mean ± SEM normalized current amplitudes (INa/INa,max), determined in WT, Fgf13 floxed, cFgf13KO, Fgf12KO, and hFGF12B- + eGFP-expressing cFgf13KO LV myocytes, were then plotted as a function of the conditioning membrane potential (Vm) and fitted using the Boltzmann equation (Eq. 1).
Cut-open oocyte voltage-clamp and voltage-clamp fluorometry (VCF)
Harvested oocytes were then digested into single cells with collagenase (Sigma-Aldrich). Oocytes were injected with cRNAs and incubated in ND93 solution (93 mM NaCl, 5 mM KCl, 1.8 mM CaCl2, 1 mM MgCl2, 5 mM HEPES, 2.5 mM Na pyruvate, and 1% penicillin/streptomycin, pH 7.4) at 18°C for 3–6 d before electrophysiological recordings. Each oocyte was injected with 50–56 ng of either SCN5A cRNA alone or a combination of SCN5A and Fgf12B/Fgf13VY cRNAs at a 4:1 M ratio for coexpression.
Cut-open voltage-clamp recordings were performed at 19°C, maintained with a temperature controller (HCC-100A; Dagan Corporation), using a cut-open amplifier (CA-1B; Dagan Corporation), interfaced to a computer using an A/D converter (Digidata 1440; Molecular Devices) and the pClamp version 10 software (Molecular Devices). Data were collected using Clampex (Molecular Devices) and analyzed using Clampfit 10.7 (Molecular Devices). The internal recording solution was composed of 105 mM N-methyl-D-glucamine (NMDG), 10 mM 2-(N-Morpholino)ethanesulfonic acid (MES) sodium salt (Na-MES), 20 mM HEPES, and 2 mM EGTA, at a pH level of 7.4, and the external recording solution contained 25 mM NMDG, 90 mM Na-MES, 20 mM HEPES, and 2 mM Ca-MES2, at a pH level of 7.4.
For VCF, oocytes were labeled for 30 min on ice with 10 µmol/liter of methanethiosulfonate–carboxytetramethylrhodamine (MTS-TAMRA; Santa Cruz Biotechnology) in a depolarizing solution composed of 110 mM KCl, 1.5 mM MgCl2, 0.8 mM CaCl2, 0.2 mM EDTA, and 10 mM HEPES at a pH of 7.1. Simultaneous recordings of ionic current and fluorescence emissions were collected on a custom rig as described previously (Rudokas et al., 2014; Varga et al., 2015; Zhu et al., 2017). After teal LED light illumination by the SPECTRA X (Lumencor), fluorescence emission was measured by a photodiode (PIN-040A; United Detector Technology) and a patch-clamp amplifier (Axopatch-200A; Molecular Devices).
Voltage-clamp records were analyzed with Clampfit (Molecular Devices) and Excel (Microsoft). Steady-state activation curves were generated from currents recorded during 100-ms voltage steps to various test potentials (−120 to 60 mV) from a HP of −120 mV. The calculated conductance (G) was normalized to the maximum conductance at 20 mV. For steady-state inactivation curves, cells were preconditioned at voltages ranging from −150 to 20 mV for 200 ms and the channel availability at −20 mV was then determined. The normalized conductance-voltage (G-V) curves were fitted with a Boltzmann equation (Eq. 1). The time constants describing the fast inactivation kinetics of the currents were calculated by fitting the peak current decay to a sum of two exponentials function (Eq. 2).
Recovery from inactivation was determined by a double-pulse protocol with varying recovery durations between two pulses. The first depolarizing pulse was applied at −20 mV for 200 ms to induce fast inactivation. The second pulse, applied at −20 mV for 20 ms, was used to test channel recovery. The recovery duration was measured from 1 to 1,000 ms, and the normalized recovery curve was fitted to a double exponential equation (Eq. 3).
Electrophysiological data analyses
Electrophysiological data were analyzed using Clampfit (Molecular Devices) and Prism 9 (Graph Pad). The statistical significance of apparent differences between/among data sets was evaluated with Welch ANOVA, followed by Dunnett’s post-hoc test. Comparisons between the two groups were done using the unpaired Welch’s t test. Pearson correlation analysis was used to determine correlation coefficients (r), together with the coefficients of determination (R2). Multiple linear regression analysis was applied to test the relationship between parameters of different measurements.
Western blot analyses
Protein lysates were prepared from WT, Fgf12KO, cFgf13KO, and hFGF12B- + eGFP-expressing cFgf13KO ventricles and from Fgf12KO atria in 20 mM HEPES + 150 mM NaCl buffer with 0.5% CHAPS and a protease inhibitor tablet (Roche) using previously described methods (Marionneau et al., 2008). Lysates were fractionated by SDS-PAGE (4–15% gradient), transferred to polyvinylidene fluoride (PVDF) membranes (Biorad), and probed for: iFGF13 expression using a rabbit polyclonal anti-iFGF13 antibody (generous gift of Dr. Geoffrey Pitt, Weill Cornell Medical School); eGFP expression using a rabbit polyclonal anti-eGFP antibody (catalog number AB3080; Sigma-Aldrich); or iFGF12 expression using a rabbit polyclonal anti-iFGF12 antibody (catalog number SAB2700759; Sigma-Aldrich). Blots were also probed with a mouse monoclonal anti-tubulin (1:10,000; Abcam) antibody to verify equal protein loading of the gel lanes.
RNA preparation and quantitative RT-PCR analysis
Quantitative RT-PCR analyses were completed using previously described methods (Marionneau et al., 2008). Briefly, for the preparation and analyses of RNA, adult (9–10 wk) WT (n = 6), cFgf13−/− (n = 6), and Fgf12−/− (n = 6) animals were sacrificed by cervical dislocation under isoflurane anesthesia and the hearts were rapidly removed. LVs were dissected and snap-frozen in liquid nitrogen. After homogenization, total RNA was isolated using the TRIzol Reagent (Invitrogen), and DNase was treated with the RNeasy Fibrous Tissue Mini Kit (Qiagen). The concentration of total RNA in each sample was measured spectrophotometrically using a NanoDrop ND-1000 (NanoDrop Technologies). RNA quality was examined using gel electrophoresis, and genomic DNA contamination was assessed by PCR amplification of total RNA without prior cDNA synthesis; no genomic DNA was detected.
First-strand cDNA was synthesized from 2 μg of total RNA using the High-Capacity cDNA Archive Kit (Applied Biosystems). The expression levels of the Fgf13VY, Fgf13S(A), Fgf13U(B), Fgf12B, Fgf12A, Fgf11, Fgf14A, and Fgf14B transcripts were determined by quantitative real-time RT-PCR using SYBR Green PCR Master Mix (Applied Biosystems). PCR reactions were performed on 10 ng of cDNA using sequence-specific primer pairs (Table S1 B) and the ABI PRISM 7900HT Sequence Detection System. The cycling conditions included a hot start at 95°C for 10 min, followed by 40 cycles at 95°C for 15 s, and 60°C for 1 min. All primer pairs were tested using mouse cDNA as the template, and templates giving 90–100% efficiency were chosen. In all cases, a single amplicon of the appropriate melting temperature or size was detected using the dissociation curve or gel electrophoresis. Data were collected with instrument spectral compensations using the Applied Biosystems SDS 2.2.2 software and analyzed using the comparative threshold cycle (CT) relative quantification method (Schmittgen and Livak, 2008). The hypoxanthine-guanine phosphoribosyl-transferase gene (HPRT) was used as an endogenous control to normalize the data (deKok et al., 2005). Individual sample measurements (n = 6) were averaged and 2ΔCT values for each gene, corresponding to the relative expression level of that gene compared with HPRT, were calculated and are reported here; all CT values were <30. Negative control experiments using RNA samples incubated without reverse transcriptase during cDNA synthesis showed no amplification.
Online supplemental material
Fig. S1 illustrates the generation and validation of cardiac-specific deletion of Fgf13 in mice. Fig. S2 shows the measurement of Fgf transcripts expression in WT, cFgf13KO, and Fgf12KO adult mouse LVs. Fig. S3 shows the amplitudes/densities of INa in cFgf13KO and Fgf12KO mouse LV myocytes. Fig. S4 shows the time dependence of AAV9-mediated expression of iFGF12B and eGFP in adult mouse LV. Fig. S5 portrays results from the iFGF chimeras experiment switching the N-terminal domains between iFGF12B and iFGF13VY. Fig. S6 demonstrates the effects of multiple iFGF chimeras on the voltage dependence of VSD-IV activation. Fig. S7 illustrates additional correlation and linear regression analysis between the VSD-IV activation and INa gating kinetics. Table S1 lists primers used in screening Fgf13 floxed (Fgf13fl/+ and Fgf13fl/fl) and cFgf13KO mice. Table S2 lists biexponential fits to the decay phases of INa recorded at various test potentials from LV myocytes isolated from WT, cFgf13KO, and cFgf13KO + iFGF12B mice. Table S3 lists biexponential fits to the decay phases of INa evoked at various test potentials from oocytes expressing NaV1.5 alone or NaV1.5 combined with iFGF12B or iFGF13VY. Table S4 lists properties of INa recorded from Xenopus oocytes expressing NaV1.5 in combination with iFGF chimeras.
Results
Loss of Fgf13 alters the properties of INa in adult mouse LV myocytes
To generate mice (cFgf13KO) with cardiac-specific deletion of Fgf13, we floxed the Fgf13 locus, using CRISPR-Cas 9 gene editing technology, and crossed these mice with transgenic mice expressing Cre-recombinase driven by the cardiac-specific α-MHC promoter as described in Materials and methods (Fig. S1, A and B). The loss of the Fgf13 transcript and the iFGF13 protein in the heart was confirmed by quantitative RT-PCR (Fig. S2) and Western blot analyses (Fig. S1 C, left; and Fig. S2). Whole-cell voltage-clamp recordings revealed that the waveforms and the densities of the voltage-gated INa in LV myocytes isolated from WT and cardiac-specific Fgf13 deletion (cFgf13KO) mice are remarkably similar (Fig. 1 A). Quantitative analyses of peak INa densities revealed no significant differences in Fgf13 floxed, compared with WT (P values >0.10 at all voltages), or in cFgf13KO, compared with Fgf13 floxed or WT (P values >0.15 at all voltages; Fig. S3 A). Analysis of the voltage-dependences of steady-state activation and inactivation of INa in WT and cFgf13KO LV myocytes revealed a hyperpolarizing shift in the voltage at which half the channels are inactivated (V1/2, inact), whereas the voltages at which half the channels are activated (V1/2, act) in WT and cFgf13KO LV myocytes are indistinguishable (Fig. 1 B and Table 1). The finding that steady-state inactivation of INa is selectively affected in cFgf13KO LV myocytes is consistent with previous studies with acute, shRNA-mediated, knockdown of Fgf13 or the targeted deletion of Fgf13 (Wang et al., 2011a; Park et al., 2016; Wang et al., 2017; Park et al., 2020).
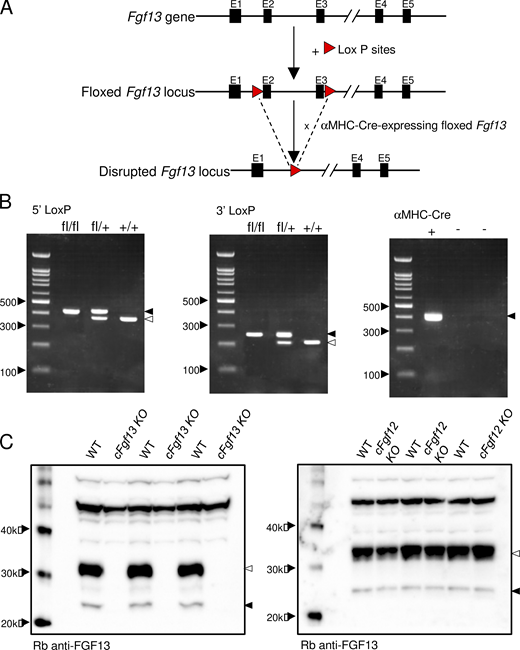
Targeted disruption of the Fgf13 locus and generation/validation of cardiac-specific Fgf13 targeted deletion mice. (A) Schematics of the endogenous Fgf13 locus (top), located on the X chromosome, and the floxed Fgf13 locus (middle). Following sequencing of the first and second generation of offspring, heterozygous Fgf13 floxed (Fgf13fl/+) female mice and hemizygous Fgf13 floxed (Fgf13fl/y) male mice were crossed to also generate homozygous Fgf13 floxed (Fgf13fl/fl) females. The Fgf13fl/y and Fgf13fl/fl animals were then crossed with transgenic mice expressing Cre recombinase driven by the cardiac-specific α-MHC promoter. Crossing the Cre recombinase positive, hemizygous floxed male (Fgf13fl/y) offspring with Fgf13fl/fl females (or Cre recombinase heterozygous Fgf13fl/+ females with Fgf13fl/y males) provided cardiac-specific Fgf13 targeted deletion hemizygous male and homozygous female animals, referred to collectively here as cardiac-specific Fgf13 knockouts, cFgf13KO. Three sets of primers were employed to detect the 5′ LoxP site, the 3′ LoxP site, and the α-MHC-driven Cre-recombinase (see Materials and methods). (B) Representative results from PCR analyses of homozygous Fgf13fl/fl, heterozygous Fgf13fl/+, and WT (+/+) female mice using primers targeting the 5′ LoxP site (left) and the 3′ LoxP site (middle) are shown. Further screening of these animals with primers to the α-MHC–Cre-recombinase transgene identified Cre recombinase positive animals (right). (C) Western blot analyses confirmed loss of iFGF13 protein expression. Protein lysates (1 µg), prepared from WT, cFgf13KO, and Fgf12 targeted deletion (Fgf12KO) ventricles, were fractionated, transferred, and membranes were probed with an anti-iFGF13 antibody, as described in Materials and methods. A prominent band at ∼32 kD and a faint band at ∼24 kD were detected with the anti-iFGF13 antibody in the WT (left and right panels) and Fgf12KO (right panel) LV protein samples, whereas these bands were not detected in the cFgf13KO LV samples (left panel), consistent with the elimination of iFGF13 proteins. Source data are available for this figure: SourceData FS1.
Targeted disruption of the Fgf13 locus and generation/validation of cardiac-specific Fgf13 targeted deletion mice. (A) Schematics of the endogenous Fgf13 locus (top), located on the X chromosome, and the floxed Fgf13 locus (middle). Following sequencing of the first and second generation of offspring, heterozygous Fgf13 floxed (Fgf13fl/+) female mice and hemizygous Fgf13 floxed (Fgf13fl/y) male mice were crossed to also generate homozygous Fgf13 floxed (Fgf13fl/fl) females. The Fgf13fl/y and Fgf13fl/fl animals were then crossed with transgenic mice expressing Cre recombinase driven by the cardiac-specific α-MHC promoter. Crossing the Cre recombinase positive, hemizygous floxed male (Fgf13fl/y) offspring with Fgf13fl/fl females (or Cre recombinase heterozygous Fgf13fl/+ females with Fgf13fl/y males) provided cardiac-specific Fgf13 targeted deletion hemizygous male and homozygous female animals, referred to collectively here as cardiac-specific Fgf13 knockouts, cFgf13KO. Three sets of primers were employed to detect the 5′ LoxP site, the 3′ LoxP site, and the α-MHC-driven Cre-recombinase (see Materials and methods). (B) Representative results from PCR analyses of homozygous Fgf13fl/fl, heterozygous Fgf13fl/+, and WT (+/+) female mice using primers targeting the 5′ LoxP site (left) and the 3′ LoxP site (middle) are shown. Further screening of these animals with primers to the α-MHC–Cre-recombinase transgene identified Cre recombinase positive animals (right). (C) Western blot analyses confirmed loss of iFGF13 protein expression. Protein lysates (1 µg), prepared from WT, cFgf13KO, and Fgf12 targeted deletion (Fgf12KO) ventricles, were fractionated, transferred, and membranes were probed with an anti-iFGF13 antibody, as described in Materials and methods. A prominent band at ∼32 kD and a faint band at ∼24 kD were detected with the anti-iFGF13 antibody in the WT (left and right panels) and Fgf12KO (right panel) LV protein samples, whereas these bands were not detected in the cFgf13KO LV samples (left panel), consistent with the elimination of iFGF13 proteins. Source data are available for this figure: SourceData FS1.

Loss of Fgf13 or Fgf12 does not measurably affect the expression levels of other Fgf transcripts in adult mouse LV. The expression levels of the Fgf11, Fgf12A, Fgf12B, Fgf13S(A), Fgf13VY, Fgf13U(B), Fgf14A, and Fgf14B transcripts in WT, cFgf13KO, and Fgf12KO LV samples were measured and normalized to Hprt expression in the same sample, as described in Materials and methods. These analyses revealed that the Fgf13 transcripts are undetectable in cFgf13KO LV. In addition, the mean ± SEM relative expression levels of the other Fgf transcripts in cFgf13KO and WT LV are indistinguishable.
Loss of Fgf13 or Fgf12 does not measurably affect the expression levels of other Fgf transcripts in adult mouse LV. The expression levels of the Fgf11, Fgf12A, Fgf12B, Fgf13S(A), Fgf13VY, Fgf13U(B), Fgf14A, and Fgf14B transcripts in WT, cFgf13KO, and Fgf12KO LV samples were measured and normalized to Hprt expression in the same sample, as described in Materials and methods. These analyses revealed that the Fgf13 transcripts are undetectable in cFgf13KO LV. In addition, the mean ± SEM relative expression levels of the other Fgf transcripts in cFgf13KO and WT LV are indistinguishable.
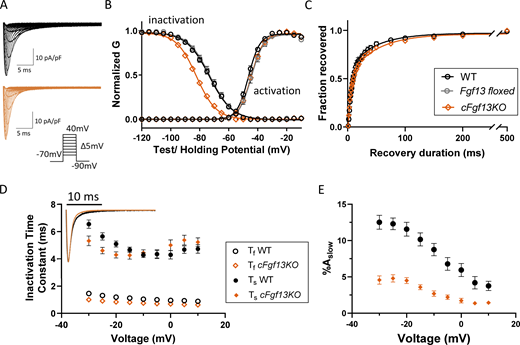
Cardiac-specific deletion of Fgf13 (cFgf13KO) alters inactivation, but not activation, of INain LV myocytes. (A) Representative INa waveforms recorded from LV myocytes isolated from WT (black) and cardiac-specific Fgf13 deletion (cFgf13KO; orange) mice; the voltage-clamp protocol is illustrated below the current records. (B) Mean ± SEM normalized conductances (G) of INa activation and inactivation were plotted as a function of voltage and fitted to single Boltzmann functions (solid lines). There is a marked hyperpolarizing shift in the voltage-dependence of INa inactivation in cFgf13KO (orange) compared with WT (black) LV myocytes (P value <0.001; Table 1), whereas the voltage-dependences of INa activation are indistinguishable in cFgf13KO and WT LV myocytes (P value = 0.12; Table 1). Control experiments revealed that the voltage-dependences of INa activation and inactivation in Fgf13 floxed (grey) LV myocytes are indistinguishable from WT LV myocytes (P values are 0.11 and 0.97, respectively; Table 1). It was not possible, however, to conduct additional control experiments to independently determine if there are any of the previously reported cardiotoxic effects (Pugach et al., 2015) of the prolonged expression of Cre-recombinase in our cFgf13KO mice. (C) Analysis of INa recovery from inactivation, examined using a three-step protocol as described in Materials and methods, reveals that recovery follows a biexponential time course (see Table 1). The decay phases of INa in all WT adult mouse LV myocytes were best fitted with the sum of two exponentials as described in Materials and methods. (D) The mean ± SEM (n = 19) fast (Ƭf) and slow (Ƭs) time constants of INa decay determined in WT cells are plotted as a function of the test potentials in D. As is evident, neither time constant displays any appreciable voltage dependence (P value = 0.26; Table 1). Inset: Overlaying representative INa waveforms recorded from cFgf13KO and WT LV myocytes reveal that current decay is accelerated in cFgf13KO compared with WT cells. Indeed, in 13 (of 26) cFgf13KO LV myocytes, the decay phases of INa were best described by single exponentials characterized (see text near Fig. 1 D citation) by Ƭ values indistinguishable from Ƭf determined in WT cells, i.e., the slow component of INa decay was undetectable in these 13 cells. For the remaining 13 (of 26) cFgf13KO LV myocytes, INa decay was well described by two exponentials, with Ƭf and Ƭs values similar to those determined in WT cells at all test potentials (see values in Table S2). (E) The mean ± SEM fractional amplitudes of the slow component of INa decay (%Aslow) in these (13 of 26) cFgf13KO LV myocytes, however, were significantly lower than those determined in WT cells at all test potentials (see values in Table S2).
Cardiac-specific deletion of Fgf13 (cFgf13KO) alters inactivation, but not activation, of INain LV myocytes. (A) Representative INa waveforms recorded from LV myocytes isolated from WT (black) and cardiac-specific Fgf13 deletion (cFgf13KO; orange) mice; the voltage-clamp protocol is illustrated below the current records. (B) Mean ± SEM normalized conductances (G) of INa activation and inactivation were plotted as a function of voltage and fitted to single Boltzmann functions (solid lines). There is a marked hyperpolarizing shift in the voltage-dependence of INa inactivation in cFgf13KO (orange) compared with WT (black) LV myocytes (P value <0.001; Table 1), whereas the voltage-dependences of INa activation are indistinguishable in cFgf13KO and WT LV myocytes (P value = 0.12; Table 1). Control experiments revealed that the voltage-dependences of INa activation and inactivation in Fgf13 floxed (grey) LV myocytes are indistinguishable from WT LV myocytes (P values are 0.11 and 0.97, respectively; Table 1). It was not possible, however, to conduct additional control experiments to independently determine if there are any of the previously reported cardiotoxic effects (Pugach et al., 2015) of the prolonged expression of Cre-recombinase in our cFgf13KO mice. (C) Analysis of INa recovery from inactivation, examined using a three-step protocol as described in Materials and methods, reveals that recovery follows a biexponential time course (see Table 1). The decay phases of INa in all WT adult mouse LV myocytes were best fitted with the sum of two exponentials as described in Materials and methods. (D) The mean ± SEM (n = 19) fast (Ƭf) and slow (Ƭs) time constants of INa decay determined in WT cells are plotted as a function of the test potentials in D. As is evident, neither time constant displays any appreciable voltage dependence (P value = 0.26; Table 1). Inset: Overlaying representative INa waveforms recorded from cFgf13KO and WT LV myocytes reveal that current decay is accelerated in cFgf13KO compared with WT cells. Indeed, in 13 (of 26) cFgf13KO LV myocytes, the decay phases of INa were best described by single exponentials characterized (see text near Fig. 1 D citation) by Ƭ values indistinguishable from Ƭf determined in WT cells, i.e., the slow component of INa decay was undetectable in these 13 cells. For the remaining 13 (of 26) cFgf13KO LV myocytes, INa decay was well described by two exponentials, with Ƭf and Ƭs values similar to those determined in WT cells at all test potentials (see values in Table S2). (E) The mean ± SEM fractional amplitudes of the slow component of INa decay (%Aslow) in these (13 of 26) cFgf13KO LV myocytes, however, were significantly lower than those determined in WT cells at all test potentials (see values in Table S2).

The amplitudes/densities of I Na in mouse LV myocytes are not affected by the loss of iFGF13, and the properties of I Na in mouse LV myocytes are not affected by the loss of iFGF12. (A) The cardiac-specific deletion of Fgf13 does not affect peak INa densities in LV myocytes: peak INa densities at all voltages in WT, Fgf13 floxed, and cFgf13KO mouse LV myocytes are not significantly different (P values >0.15 at all voltages). (B and C) Consistent with the negligible expression of Fgf12 transcripts in adult mouse LV (see Fig. S2), peak INa densities at all voltages (B) and the voltage-dependences of INa activation and inactivation (C) determined in adult Fgf12KO LV myocytes are indistinguishable (P values >0.13) from INa in WT LV myocytes at all voltages.
The amplitudes/densities of I Na in mouse LV myocytes are not affected by the loss of iFGF13, and the properties of I Na in mouse LV myocytes are not affected by the loss of iFGF12. (A) The cardiac-specific deletion of Fgf13 does not affect peak INa densities in LV myocytes: peak INa densities at all voltages in WT, Fgf13 floxed, and cFgf13KO mouse LV myocytes are not significantly different (P values >0.15 at all voltages). (B and C) Consistent with the negligible expression of Fgf12 transcripts in adult mouse LV (see Fig. S2), peak INa densities at all voltages (B) and the voltage-dependences of INa activation and inactivation (C) determined in adult Fgf12KO LV myocytes are indistinguishable (P values >0.13) from INa in WT LV myocytes at all voltages.

The time-dependence of AAV9-mediated expression of iFGF12B and eGFP in adult mouse LV and the validation of the anti-iFGF12 antibody. (A and B) Western blots of fractionated protein lysates prepared from cFgf13KO ventricles 2, 3, or 4 wk following retro-orbital injections of a 1:1 mixture of the hFGF12B-expressing and eGFP-expressing AAV9 viruses, probed with an anti-EGFP (A) or anti-iFGF12 (B) antibody, as described in Materials and methods. (C) To validate the anti-iFGF12 antibody used in the Western blot in B, protein lysates prepared from WT and Fgf12KO adult mouse left and right atria were fractionated, transferred, and the membranes were probed with an anti-iFGF12 antibody, as described in Materials and methods. A prominent band at ∼20 kD was detected with the anti-iFGF12 antibody in the WT, but not in the Fgf12KO, atrial protein samples, consistent with the elimination of iFGF12 proteins and validating the anti-iFGF12 antibody for Western blot analyses of iFGF12 protein expression. Source data are available for this figure: SourceData FS4.
The time-dependence of AAV9-mediated expression of iFGF12B and eGFP in adult mouse LV and the validation of the anti-iFGF12 antibody. (A and B) Western blots of fractionated protein lysates prepared from cFgf13KO ventricles 2, 3, or 4 wk following retro-orbital injections of a 1:1 mixture of the hFGF12B-expressing and eGFP-expressing AAV9 viruses, probed with an anti-EGFP (A) or anti-iFGF12 (B) antibody, as described in Materials and methods. (C) To validate the anti-iFGF12 antibody used in the Western blot in B, protein lysates prepared from WT and Fgf12KO adult mouse left and right atria were fractionated, transferred, and the membranes were probed with an anti-iFGF12 antibody, as described in Materials and methods. A prominent band at ∼20 kD was detected with the anti-iFGF12 antibody in the WT, but not in the Fgf12KO, atrial protein samples, consistent with the elimination of iFGF12 proteins and validating the anti-iFGF12 antibody for Western blot analyses of iFGF12 protein expression. Source data are available for this figure: SourceData FS4.
Properties of INa in LV myocytes isolated from various mouse linesa
| WT | Fgf13 floxed | cFgf13KO | cFgf13KO + iFGF12B | Fgf12KO | |
|---|---|---|---|---|---|
| G-V activation (n) | (24 cells, 7 mice) | (15 cells, 6 mice) | (26 cells, 8 mice) | (19 cells, 4 mice) | (19 cells, 6 mice) |
| V1/2, act (mV) | −46.3 ± 0.6 | −44.1 ± 1.0 | −44.4 ± 0.6 | −37.48 ± 0.9 | −44.6 ± 0.8 |
| P valueb | 0.45 | 0.28 | <0.001 (***) | 0.69 | |
| P valuec | 0.99 | <0.001 (***) | 0.99 | ||
| P valued | <0.001 (***) | ||||
| kact | 3.6 ± 0.1 | 2.9 ± 0.2 | 4.0 ± 0.1 | 4.3 ± 0.1 | 3.7 ± 0.2 |
| P valueb | 0.93 | 0.17 | 0.002 (**) | 0.99 | |
| P-valuec | 0.99 | 0.73 | 0.99 | ||
| P valued | 0.51 | ||||
| G-V inactivation (n) | (24 cells, 7 mice) | (15 cells, 6 mice) | (26 cells, 8 mice) | (17 cells, 4 mice) | (19 cells, 6 mice) |
| V1/2, inact (mV) | −73.4 ± 1.0 | −72.8 ± 1.3 | −82.5 ± 0.8 | −77.2 ± 0.5 | −70.1 ± 1.0 |
| P valueb | 0.99 | <0.001 (***) | 0.028 (*) | 0.26 | |
| P valuec | <0.001 (***) | 0.05 (*) | 0.67 | ||
| P valued | <0.001 (***) | ||||
| kinact | 7.2 ± 0.1 | 7.1 ± 0.1 | 6.7 ± 0.2 | 6.9 ± 0.1 | 7.2 ± 0.1 |
| P valueb | 0.99 | 0.10 | 0.23 | 0.99 | |
| P valuec | 0.62 | 0.92 | 0.99 | ||
| P valued | 0.19 | ||||
| Inactivation recovery (n) | (9 cells, 2 mice) | (9 cells, 2 mice) | (9 cells, 2 mice) | ||
| ƬR,1 (ms) | 8.2 ± 1.3 | 6.3 ± 0.9 | 4.0 ± 0.6 | ||
| P valueb | 0.38 | 0.015 (**) | |||
| P valued | 0.04 (*) | ||||
| ƬR,2 (ms)e | 85.4 ± 18.1 | 58.9 ± 8.4 | 28.2 ± 2.8 |
Values are means ± SEM; n = number of biological replicates (cells and mice).
P values are obtained from a comparison to recordings in WT LV myocytes (see Materials and methods). Significant differences are designated as *, **, and *** for P values <0.05, 0.01, and 0.001, respectively.
P values are obtained from a comparison to recordings in Fgf13 floxed LV myocytes. Significant differences are designated as *, **, and *** for P values <0.05, 0.01, and 0.001, respectively.
P values are obtained from a comparison to recordings in cFgf13KO LV myocytes. Significant differences are designated as *, **, and *** for P values <0.05, 0.01, and 0.001, respectively.
Recovery time constant for the slower component contributes very little. A comparison is thus omitted.
Additional experiments revealed that the kinetics of INa recovery from inactivation, determined from measurements of the normalized peak INa amplitudes as a function of the recovery interval as described in Materials and methods, are similar in WT and cFgf13KO LV myocytes (Fig. 1 C and Table 1). The records in Fig. 1 A and the overlay of INa recordings evoked at −20 mV (Fig. 1 D, inset), however, reveal that the conditional knockout of Fgf13 accelerated peak INa decay. In WT LV myocytes, the decay phases of the currents were best fitted with a sum of two exponentials, providing the fast (Ƭf) and slow (Ƭs) time constants of peak INa decay, corresponding to the fast and intermediate modes of open-state inactivation (Silva, 2014; Silva and Goldstein, 2013a; Silva and Goldstein, 2013b). Analyses of INa in cFgf13KO LV myocytes, however, revealed that the decay phases of the currents in many (13 of 26) cFgf13KO cells were not well-fitted by the sum of two exponentials. Rather, the decay phases of INa in these cells were well-described by single exponential with Ƭ values similar to the fast component (Ƭf) determined in WT cells. For all cells in which two exponentials were required, Ƭf and Ƭs were similar to the values determined in WT LV myocytes (Fig. 1 D and Table S2), although the relative amplitude of the slow component of INa decay (%Aslow) in the (13) cFgf13KO LV myocytes with two decay components was much lower than in WT LV myocytes (Fig. 1 E and Table S2). The apparent acceleration of INa decay in cFgf13KO LV myocytes (Fig. 1, A and D, inset), therefore, reflects a reduction (or, in many cells, elimination) of the slow component of current decay. Expression of iFGF13VY, therefore, reduces the fast component of INa decay.
Additional experiments revealed that the amplitudes and properties of INa recorded from LV myocytes isolated from Fgf12KO (Fig. S3, B and C) mice were indistinguishable from the currents in WT cells (Table 1), consistent with the negligible expression of Fgf12 in adult mouse ventricles (Fig. S2).
Distinct effects of iFGF12B expression on INa in cFgf13KO LV myocytes
To examine the effects of iFGF12B on native INa, we generated an iFGF12B-expressing AAV9 and delivered this virus, mixed at a 1:1 ratio with eGFP-expressing AAV9, into cFgf13KO mice by retro-orbital sinus injection (see Materials and methods and Fig. S4). Representative recordings of INa from control cFgf13KO LV myocytes and an iFGF12B- + eGFP-expressing cFgf13KO LV myocytes are presented in Fig. 2 A. As illustrated in Fig. 2 B, the expression of iFGF12B shifted the voltage-dependence of INa inactivation in the depolarizing direction relative to the results in cFgf13KO myocytes, i.e., back toward the WT G-V plot (Table 1). In addition, however, iFGF12B expression shifted the activation curve for INa, also in the depolarizing direction relative to the G-V curve for cFgf13KO and WT (Fig. 2 B) LV myocytes. The addition of iFGF12B did not alter the amplitudes of INa when compared to INa recorded from cFgf13KO (or WT) myocytes (Fig. 2 A). The addition of iFGF12B also accelerated the kinetics of INa recovery from inactivation, relative to the data in cFgf13KO myocytes (Fig. 2 C and Table 1). Analyses of the waveforms of the currents in cFgf13KO LV myocytes expressing iFGF12B, however, revealed that, similar to cFgf13KO LV myocytes, the decay phases of the currents in many (13 of 19) cells were best described by single exponentials characterized by Ƭ values similar to Ƭf measured in WT and cFgf13KO LV myocytes (Table S2). For the remaining (6 of 19) cFgf13KO LV myocytes expressing iFGF12B, INa was well-described by the sum of two exponentials with Ƭf and Ƭs values and %Aslow similar to those measured in cFgf13KO LV myocytes (Fig. 2, D and E; and Table S2). In contrast with iFGF13VY, therefore, iFGF12B does not measurably affect the fast or the slow component of decay of mouse ventricular INa.
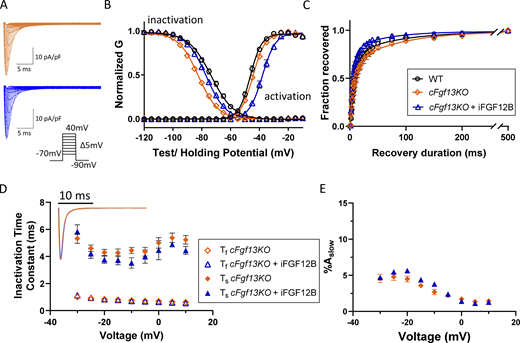
Expression of iFGF12B in cFgf13KO LV myocytes alters the voltage-dependence of INaactivation and inactivation. (A) Representative INa waveforms recorded from cFgf13KO LV myocytes without (orange) and with (blue) iFGF12B expression; the voltage-clamp protocol is illustrated below the current records. (B) The expression of iFGF12B in cFgf13KO LV myocytes resulted in depolarizing shifts in INa activation and inactivation (blue) compared with cFgf13KO LV myocytes (orange; P values are <0.001 for both G-V activation and inactivation; Table 1). (C) Expression of iFGF12B in cFgf13KO LV myocytes also accelerated INa recovery from inactivation compared with the currents in both WT and cFgf13KO LV myocytes (P value = 0.04; Table 1). (D) The decay phases of the currents in cFgf13KO cells expressing iFGF12B (blue), however, are indistinguishable from cFgf13KO (orange) LV myocytes (inset). In addition, in 13 (of 19) cFgf13KO + iFGF12B-expressing LV myocytes, the decay phases of INa were best described by single exponentials with Ƭ values indistinguishable from Ƭf determined in WT cells, i.e., the slow component of INa decay was undetectable in these 13 cells. In the remaining (6 of 19) cFgf13KO + iFGF12B-expressing LV myocytes, INa decay was well described by the sum of two exponentials (D) with Ƭf and Ƭs values similar to those in cFgf13KO and WT (Fig. 1 D) cells (see values in Table S2). (E) In addition, the fractional amplitudes of the slow component of INa decay (%Aslow) in cFgf13KO + iFGF12B-expressing LV myocytes are indistinguishable at all test potentials from those determined in cFgf13KO cells (see values in Table S2).
Expression of iFGF12B in cFgf13KO LV myocytes alters the voltage-dependence of INaactivation and inactivation. (A) Representative INa waveforms recorded from cFgf13KO LV myocytes without (orange) and with (blue) iFGF12B expression; the voltage-clamp protocol is illustrated below the current records. (B) The expression of iFGF12B in cFgf13KO LV myocytes resulted in depolarizing shifts in INa activation and inactivation (blue) compared with cFgf13KO LV myocytes (orange; P values are <0.001 for both G-V activation and inactivation; Table 1). (C) Expression of iFGF12B in cFgf13KO LV myocytes also accelerated INa recovery from inactivation compared with the currents in both WT and cFgf13KO LV myocytes (P value = 0.04; Table 1). (D) The decay phases of the currents in cFgf13KO cells expressing iFGF12B (blue), however, are indistinguishable from cFgf13KO (orange) LV myocytes (inset). In addition, in 13 (of 19) cFgf13KO + iFGF12B-expressing LV myocytes, the decay phases of INa were best described by single exponentials with Ƭ values indistinguishable from Ƭf determined in WT cells, i.e., the slow component of INa decay was undetectable in these 13 cells. In the remaining (6 of 19) cFgf13KO + iFGF12B-expressing LV myocytes, INa decay was well described by the sum of two exponentials (D) with Ƭf and Ƭs values similar to those in cFgf13KO and WT (Fig. 1 D) cells (see values in Table S2). (E) In addition, the fractional amplitudes of the slow component of INa decay (%Aslow) in cFgf13KO + iFGF12B-expressing LV myocytes are indistinguishable at all test potentials from those determined in cFgf13KO cells (see values in Table S2).
The results presented above demonstrate that iFGF13VY and iFGF12B have distinct effects on the time- and voltage-dependent properties of native (mouse) myocardial INa. To explore the molecular mechanisms underlying these differences, we turned to a heterologous expression system (Xenopus oocytes) and obtained voltage-clamp current and VCF recordings from oocytes expressing NaV1.5 alone or in combination with iFGF12B or iFGF13VY.
iFGF12B regulates NaV1.5 kinetics via the modulation ofVSD-IV activation
In subsequent experiments, NaV1.5-encoded currents were recorded from Xenopus oocytes expressing NaV1.5 alone or NaV1.5 combined with iFGF12B (Fig. 3 A). In comparison to NaV1.5 alone, iFGF12B coexpression shifted the steady-state activation and inactivation curves in the depolarizing direction (Fig. 3 B and Table 2). In the presence of iFGF12B, therefore, NaV1.5 channels begin to open at more depolarized membrane potentials. The rate of recovery of INa from inactivation was also faster in the presence of iFGF12B (Fig. 3 C and Table 2).
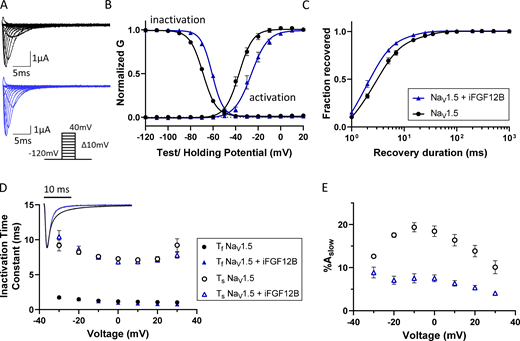
Coexpression of iFGF12B modulates the time- and voltage-dependent properties of NaV1.5-encoded currents in Xenopus oocytes. (A) Representative human NaV1.5-encoded (INa) waveforms recorded from Xenopus oocytes expressing NaV1.5 alone (black) or together with iFGF12B (blue); the voltage-clamp protocol is illustrated below the current records. (B) The mean ± SEM normalized conductance-versus-voltage plots reveal marked depolarizing shifts in the voltage-dependences of activation and inactivation of the currents with iFGF12B coexpression (blue), relative to NaV1.5 expressed alone (black; P values are 0.012 and <0.001, respectively; Table 2). (C) The rate of INa recovery from inactivation is also accelerated with iFGF12B coexpression (P value = 0.04; Table 2). (D and E) Inset: Overlaying representative INa waveforms, recorded on membrane depolarizations to −20 mV, illustrates the difference in the decay phases of the currents recorded from Xenopus oocytes expressing NaV1.5 alone (black) or NaV1.5 with iFGF12B (blue). Analyses of the decay phases of the currents revealed that the time constants of the fast and slow components of INa decay (Ƭf and Ƭs, respectively; D) are indistinguishable in the absence and the presence of iFGF12B, whereas the fractional amplitude of the slow component of current decay (%Aslow; E) was reduced markedly with iFGF12B coexpression at all test potentials (see values in Table S3).
Coexpression of iFGF12B modulates the time- and voltage-dependent properties of NaV1.5-encoded currents in Xenopus oocytes. (A) Representative human NaV1.5-encoded (INa) waveforms recorded from Xenopus oocytes expressing NaV1.5 alone (black) or together with iFGF12B (blue); the voltage-clamp protocol is illustrated below the current records. (B) The mean ± SEM normalized conductance-versus-voltage plots reveal marked depolarizing shifts in the voltage-dependences of activation and inactivation of the currents with iFGF12B coexpression (blue), relative to NaV1.5 expressed alone (black; P values are 0.012 and <0.001, respectively; Table 2). (C) The rate of INa recovery from inactivation is also accelerated with iFGF12B coexpression (P value = 0.04; Table 2). (D and E) Inset: Overlaying representative INa waveforms, recorded on membrane depolarizations to −20 mV, illustrates the difference in the decay phases of the currents recorded from Xenopus oocytes expressing NaV1.5 alone (black) or NaV1.5 with iFGF12B (blue). Analyses of the decay phases of the currents revealed that the time constants of the fast and slow components of INa decay (Ƭf and Ƭs, respectively; D) are indistinguishable in the absence and the presence of iFGF12B, whereas the fractional amplitude of the slow component of current decay (%Aslow; E) was reduced markedly with iFGF12B coexpression at all test potentials (see values in Table S3).
Properties of INa determined in Xenopus oocytes expressing NaV1.5 alone or in combination with iFGF12B or iFGF13VYa
| NaV1.5 | NaV1.5 + iFGF12B | NaV1.5 + iFGF13VY | |
|---|---|---|---|
| G-V activation (n) | (5) | (6) | (6) |
| V1/2, act (mV) | −37.0 ± 0.6 | −26.2 ± 2.2 | −32.3 ± 3.1 |
| P valueb | 0.006 (**) | 0.33 | |
| kact | 6.1 ± 0.3 | 6.6 ± 0.4 | 5.5 ± 0.5 |
| P valueb | 0.44 | 0.60 | |
| G-V inactivation (n) | (9) | (7) | (6) |
| V1/2, inact (mV) | −69.0 ± 0.5 | −60.9 ± 0.4 | −54.5 ± 1.8 |
| P valueb | <0.001 (***) | <0.001 (***) | |
| kinact | 5.8 ± 0.3 | 4.9 ± 0.3 | 4.7 ± 0.4 |
| P valueb | 0.06 | 0.09 | |
| Inactivation recovery (n) | (8) | (5) | (5) |
| ƬR,1 (ms) | 2.5 ± 0.2 | 1.9 ± 0.3 | 1.3 ± 0.1 |
| P valueb | 0.04 (*) | <0.001 (***) | |
| ƬR,2 (ms)c | 15.8 ± 1.4 | 12.5 ± 1.3 | 8.5 ± 1.3 |
Values are means ± SEM; n = number of biological replicates (cells).
P values are obtained from a comparison to recordings from oocytes expressing NaV1.5 alone (see Materials and methods). Significant differences are designated as *, **, and *** for P values <0.05, 0.01, and 0.001, respectively.
Recovery time constant for the slower component contributes very little. A comparison is thus omitted.
Superimposing recordings of INa evoked by a −20-mV voltage step from oocytes expressing NaV1.5 alone or NaV1.5 with iFGF12B revealed that current decay was accelerated with iFGF12B coexpression (Fig. 3 D, inset). Analyses of the kinetics of peak INa decay revealed that the data were best fit to the sum of two exponentials, and the measured time constants (Ƭf and Ƭs) were similar for the currents produced by NaV1.5 alone and NaV1.5 combined with iFGF12B (Fig. 3 D and Table S3). The fractional amplitudes of the slower component of inactivation (%Aslow), however, were markedly reduced in the presence of iFGF12B (Fig. 3 E and Table S3). iFGF12B, therefore, enhanced the faster component of inactivation of heterologously expressed (human) NaV1.5.
Next, we employed VCF to probe the molecular mechanism(s) contributing to iFGF12B modulation of NaV1.5 channel gating (Mannuzzu et al., 1996; Stefani and Bezanilla, 1998; Gandhi and Olcese. 2008; Rudokas et al., 2014). A cysteine mutation was introduced into the extracellular linker S3–S4 in each VSD for fluorophore (MTS-TAMRA) tagging (Varga et al., 2015; Zhu et al., 2016). The movement of S4 upon membrane depolarization can then be detected by a change in fluorescence emission, reflecting an altered surrounding environment (Varga et al., 2015; Zhu et al., 2016). To improve sensitivity, a cysteine mutation was created in the background of WT-LFS (large fluorescence signal) bearing Y1977A-C373Y mutations that ablate a ubiquitination site and prevent non-specific labeling (Varga et al., 2015). Previous work showed that the LFS mutations do not substantially affect NaV channel activation or inactivation kinetics (Varga et al., 2015). Plotting changes in the fluorescence signals as a function of voltage (i.e., F versus V curves) for each VSD allows estimation of the conformational changes that occur during VSD activation.
As illustrated in Fig. 4, coexpression of iFGF12B caused no changes in the half-maximal voltages (V1/2) of VSD-I, VSD-II, or VSD-III F-V curves compared with NaV1.5 expressed alone. For VSD-III, however, we observed a change at potentials greater than −50 mV. Multiple lines of evidence suggest that VSD-III can activate in two discrete steps (Chanda and Bezanilla, 2002; Hsu et al., 2017; Zhu et al., 2017). iFGF12B did not affect the initial activation at very hyperpolarized potentials. However, the second translation of VSD-III was modulated by iFGF12B, as seen by the deflection at higher potentials (Fig. 4). This second VSD-III activation has been proposed to regulate the open-state inactivation (Angsutararux et al., 2021a).

iFGF12B regulates the activation of the voltage sensor in repeat IV of Na V 1.5. VCF recordings were obtained as described in Materials and methods. Representative fluorescence signals recorded from Xenopus oocytes expressing NaV1.5 alone (black) or with iFGF12B (blue) in response to 50-ms depolarizing voltage steps to −140, −80, −20, and 40 mV, are presented; only four fluorescence traces are shown for clarity. The mean ± SEM normalized steady-state fluorescence signals were plotted and fitted with a single Boltzmann function (solid lines). Coexpression of iFGF12B induced a hyperpolarizing shift in the VSD-IV F-V curve (P value <0.001, Table 3), but caused no change in the F-V curves of the other VSDs (see Table 3).
iFGF12B regulates the activation of the voltage sensor in repeat IV of Na V 1.5. VCF recordings were obtained as described in Materials and methods. Representative fluorescence signals recorded from Xenopus oocytes expressing NaV1.5 alone (black) or with iFGF12B (blue) in response to 50-ms depolarizing voltage steps to −140, −80, −20, and 40 mV, are presented; only four fluorescence traces are shown for clarity. The mean ± SEM normalized steady-state fluorescence signals were plotted and fitted with a single Boltzmann function (solid lines). Coexpression of iFGF12B induced a hyperpolarizing shift in the VSD-IV F-V curve (P value <0.001, Table 3), but caused no change in the F-V curves of the other VSDs (see Table 3).
iFGF12B coexpression induced marked changes in the F-V curve of VSD-IV F-V, specifically causing a hyperpolarizing shift in V1/2 and a decrease in the slope factor (k; Fig. 4 and Table 3). The alterations in the F-V curve in the presence of iFGF12B reflected the facilitated activation of VSD-IV and its accelerated outward translation, resulting in its fully activated conformation at less depolarized potentials. Together, these results suggest that the facilitation of VSD-IV activation underlies the observed effects of iFGF12B on the gating properties and kinetics of INa inactivation.
Parameters determined from Boltzmann fits to the voltage dependences of steady-state F-V curves for NaV1.5 voltage sensor domains, VSD-I–VSD-IVa
| NaV1.5 | NaV1.5 + iFGF12B | NaV1.5 + iFGF13VY | |
|---|---|---|---|
| VSD-I (n) | (4) | (3) | (4) |
| V1/2 (mV) | −75.2 ± 3.6 | −77.6 ± 4.6 | −50.1 ± 3.1 |
| P valueb | 0.99 | 0.003 (**) | |
| k | 19.4 ± 0.9 | 21.2 ± 2.7 | 13.7 ± 1.2 |
| P valueb | 0.97 | 0.008 (**) | |
| VSD-II (n) | (5) | (4) | (5) |
| V1/2 (mV) | −51.6 ± 1.8 | −53.1 ± 2.9 | −53.4 ± 1.7 |
| P valueb | 0.99 | 0.25 | |
| k | 33.0 ± 4.9 | 27.4 ± 2.0 | 38.7 ± 0.9 |
| P valueb | 0.84 | 0.50 | |
| VSD-III (n) | (10) | (8) | (6) |
| V1/2 (mV) | −149.7 ± 1.6 | −145.6 ± 2.1 | −153.4 ± 4.3 |
| P valueb | 0.28 | 0.68 | |
| k | 21.4 ± 0.8 | 20.6 ± 0.7 | 22.0 ± 2.0 |
| P valueb | 0.71 | 0.95 | |
| VSD-IV (n) | (8) | (8) | (8) |
| V1/2 (mV) | −52.9 ± 2.0 | −66.2 ± 2.3 | −60.4 ± 1.3 |
| P valueb | 0.001 (***) | 0.02 (*) | |
| k | 20.5 ± 1.3 | 16.5 ± 1.2 | 9.4 ± 1.0 |
| P valueb | 0.08 | <0.001 (***) |
Values are means ± SEM; n = number of biological replicates (cells).
P values are obtained from a comparison to recordings from oocytes expressing NaV1.5 alone (see Materials and methods). Significant differences are designated as *, **, and *** for P values <0.05, 0.01, and 0.001, respectively.
Distinct effects of iFGF13VY on NaV1.5 gating and VSD activation
Next, we investigated the effect of iFGF13VY on NaV1.5. Analysis of the ionic currents (Fig. 5 A) produced on the expression of NaV1.5 alone and NaV1.5 coexpressed with iFGF13VY revealed a shift in the steady-state inactivation curve toward depolarizing potentials in the presence of iFGF13VY, with no effect on the voltage-dependence of current activation (Fig. 5 B and Table 2). The depolarizing shift in the V1/2 for inactivation seen with iFGF13VY (Fig. 5 B and Table 2) was substantially larger than the shift seen with coexpression of iFGF12B (Fig. 3 B and Table 2). Recovery from inactivation was also facilitated by iFGF13VY (Fig. 5 C and Table 2). Compared to NaV1.5 alone, we also found that iFGF13VY coexpression accelerates the apparent rate of current decay (Fig. 5 D, inset) by reducing %Aslow (Fig. 5 E), as Ƭf and Ƭs are unchanged in the presence of iFGF13VY (Fig. 5 D and Table S3).
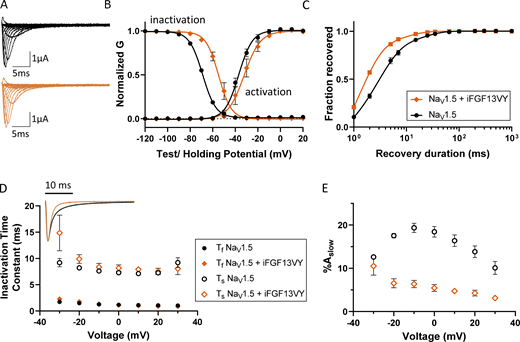
Coexpression of iFGF13VY affects the voltage dependence of steady-state inactivation and the inactivation kinetics of NaV1.5-encoded currents in Xenopus oocytes. (A) Representative INa waveforms recorded from Xenopus oocytes expressing NaV1.5 alone (black) or with iFGF13VY (orange); the voltage-clamp protocol is illustrated below the current records. (B) The mean ± SEM conductance versus voltage plots reveal marked depolarizing shifts in the voltage dependence of inactivation with iFGF13VY coexpression compared with NaV1.5 expressed alone (P value <0.001; Table 2). The voltage dependence of INa activation, however, is not affected by iFGF13VY (P value = 0.3; Table 2). (C and D) Coexpression of iFGF13VY accelerated INa recovery from inactivation (C; P value <0.001; Table 2) and overlay of representative INa waveforms (D, inset), evoked at −20 mV, illustrates the difference in the decay phases of INa in recordings from Xenopus oocytes expressing NaV1.5 without (black) and with (orange) iFGF13VY. (E) Analyses of the decay phases of the currents revealed that the time constants, Ƭf and Ƭs, of the fast and slow components of INa decay, respectively, (D) are indistinguishable for the currents in the absence and presence of iFGF13VY, whereas the fractional amplitude of the slow component of current decay (%Aslow; E) was reduced markedly with iFGF13VY coexpression at all test potentials (see values in Table S3).
Coexpression of iFGF13VY affects the voltage dependence of steady-state inactivation and the inactivation kinetics of NaV1.5-encoded currents in Xenopus oocytes. (A) Representative INa waveforms recorded from Xenopus oocytes expressing NaV1.5 alone (black) or with iFGF13VY (orange); the voltage-clamp protocol is illustrated below the current records. (B) The mean ± SEM conductance versus voltage plots reveal marked depolarizing shifts in the voltage dependence of inactivation with iFGF13VY coexpression compared with NaV1.5 expressed alone (P value <0.001; Table 2). The voltage dependence of INa activation, however, is not affected by iFGF13VY (P value = 0.3; Table 2). (C and D) Coexpression of iFGF13VY accelerated INa recovery from inactivation (C; P value <0.001; Table 2) and overlay of representative INa waveforms (D, inset), evoked at −20 mV, illustrates the difference in the decay phases of INa in recordings from Xenopus oocytes expressing NaV1.5 without (black) and with (orange) iFGF13VY. (E) Analyses of the decay phases of the currents revealed that the time constants, Ƭf and Ƭs, of the fast and slow components of INa decay, respectively, (D) are indistinguishable for the currents in the absence and presence of iFGF13VY, whereas the fractional amplitude of the slow component of current decay (%Aslow; E) was reduced markedly with iFGF13VY coexpression at all test potentials (see values in Table S3).
Examination of the activation of the individual VSDs revealed marked effects of iFGF13VY on the F-V curves for VSD-I and VSD-IV (Fig. 6 and Table 3). The VSD-I F-V curve was shifted toward positive potentials with iFGF13VY coexpression (Fig. 6), an effect that is not observed with iFGF12B (Fig. 4). iFGF13VY coexpression also increases the steepness (slope) of the F-V curve for VSD-IV and results in a hyperpolarizing shift in the V1/2. The modulatory effects of iFGF13VY on VSD-IV activation (Fig. 6), therefore, are distinct from the effect of iFGF12B (Fig. 4). iFGF13VY markedly increased the slope of the F-V curve (reduced slope factor k), whereas iFGF12B shifted the V1/2 in the hyperpolarizing direction.

Distinct modulation of Na V 1.5 voltage sensor conformations with iFGF13VY coexpression. The F-V curves for all four VSDs of NaV1.5 recorded from Xenopus oocytes expressing NaV1.5 alone (black) or with iFGF13VY (orange) show that iFGF13VY affects the voltage-dependences of activation of VSD-I and VSD-IV. For VSD-I, iFGF13VY coexpression shifts the F-V curve toward depolarizing potentials (P value = 0.002; Table 3). For VSD-IV, the F-V curves show that iFGF13VY results in a steeper slope and a small shift toward more hyperpolarized membrane potentials relative to NaV1.5 expressed alone (P values are 0.022 and <0.001, respectively; Table 3). The effect on the VSD-IV F-V curve with iFGF13VY coexpression is distinct from that observed with iFGF12B coexpression (compare with Fig. 4).
Distinct modulation of Na V 1.5 voltage sensor conformations with iFGF13VY coexpression. The F-V curves for all four VSDs of NaV1.5 recorded from Xenopus oocytes expressing NaV1.5 alone (black) or with iFGF13VY (orange) show that iFGF13VY affects the voltage-dependences of activation of VSD-I and VSD-IV. For VSD-I, iFGF13VY coexpression shifts the F-V curve toward depolarizing potentials (P value = 0.002; Table 3). For VSD-IV, the F-V curves show that iFGF13VY results in a steeper slope and a small shift toward more hyperpolarized membrane potentials relative to NaV1.5 expressed alone (P values are 0.022 and <0.001, respectively; Table 3). The effect on the VSD-IV F-V curve with iFGF13VY coexpression is distinct from that observed with iFGF12B coexpression (compare with Fig. 4).
iFGF chimeras to probe the distinct functional effects of iFGF12B and iFGF13VY on VSD-IV
Like other FGFs, the iFGFs consist of three main domains: the N-terminus, the β-trefoil core, and the C-terminus. The core domains of iFGF11–iFGF14 are highly homologous (Olsen et al., 2003). According to resolved crystal structures, the amino acid residues that mediate iFGF interaction with the C-termini of NaV α subunits are in the core domain (Goetz et al., 2009; Wang et al., 2012; Musa et al., 2015; Hennessey et al., 2013). If the same residues are involved in the binding of iFGF12B and iFGF13VY to NaV1.5, the distinct functional effects on NaV channel gating must reflect interactions with other parts of these proteins which are distinct. Alignment of the iFGF12B and iFGF13VY proteins reveals the prominent difference in the N-termini of these two proteins (Fig. 7 A). Previous studies have shown that the unique N-terminal sequences of iFGF14 splice variant N-termini result in distinct effects on NaV channel gating (Lou et al, 2005; Laezza et al, 2009; Barbosa et al, 2017; Ali et al, 2018; Singh et al, 2020, 2021). Similarly, the differing N-terminal sequences of the five splice variants of iFGF13 (iFGF13S(A), iFGF13U(B), iFGF13V, iFGF13Y, and iFGF13VY) result in distinct regulatory effects on NaV1.5 channel gating (Wang et al., 2017). In addition, it has been reported that the specific sequence of iFGF A variants, including iFGF12A, can inhibit the late sodium current, which is not observed with other splice variants, including iFGF12B (Chakouri et al., 2022). Together, these studies point to the significance of the iFGF N-termini in determining the specific modulatory effects of the different variants.
![Analysis of iFGF12B, iFGF13VY, and iFGF12B/13VY chimeras reveals a strong correlation between the slopes of the VSD-IV F-V curves and the slow component of INainactivation. (A) Alignment of the iFGF12B and iFGF13VY sequences highlights the prominent difference in N-termini. (B–D) Several iFGF12B/13VY chimeras were constructed by swapping the N-termini, C-termini, and both C- and N-termini domains. Each chimera was coexpressed with NaV1.5, and effects on the time-and voltage-dependent properties of INa and VSD-IV activation were determined. Correlation and linear regression analyses were performed on these results obtained from iFGF chimeras, iFGF12B, and iFGF13VY. (B and C) The analyses revealed that the slow time constants of INa decay (Ƭs; B) and the fractional amplitudes of the slow component (%Aslow; C), determined for currents evoked at 0 mV, are both strongly (negatively [B] or positively [C]) correlated with the VSD-IV F-V k values. (D) The k and V1/2 values, determined from the VSD-IV F-V curves, can be used to predict %Aslow.](https://cdn.rupress.org/rup/content_public/journal/jgp/155/5/10.1085_jgp.202213300/3/m_jgp_202213300_fig7.png?Expires=1767697439&Signature=GKPgDrIT6egeKRT4NSvfLsFWv8L2I8zozE-tnsC2XhGpQCJCHV1tyCRCKQmmAq1LigQQu08mzYyADVWdkRTkVN5NFPFKhUPHA7-drp~2GKQcwCbV1SWlyVDwPfQADoIP1IsB-BHDJosH~DwhTlkLWPsTyIb3DHDvWcpBbqcgzWlyBerLJLuqdI9CbkGkBnlEXQnUGC12GONxG~9mlD32WqzbdAL25hezxiXPNOT4ayYlHPbH8y6TkrztzlnZpa7Hg3~n3UcDcM~H1hQVPfPg6FTEGDTTqIOvRJyDRMVeSxJwZfBfwr88jf3HaiDKMDAZk6CQDgVFNMjDDH1tNpWbqQ__&Key-Pair-Id=APKAIE5G5CRDK6RD3PGA)
Analysis of iFGF12B, iFGF13VY, and iFGF12B/13VY chimeras reveals a strong correlation between the slopes of the VSD-IV F-V curves and the slow component of I Na inactivation. (A) Alignment of the iFGF12B and iFGF13VY sequences highlights the prominent difference in N-termini. (B–D) Several iFGF12B/13VY chimeras were constructed by swapping the N-termini, C-termini, and both C- and N-termini domains. Each chimera was coexpressed with NaV1.5, and effects on the time-and voltage-dependent properties of INa and VSD-IV activation were determined. Correlation and linear regression analyses were performed on these results obtained from iFGF chimeras, iFGF12B, and iFGF13VY. (B and C) The analyses revealed that the slow time constants of INa decay (Ƭs; B) and the fractional amplitudes of the slow component (%Aslow; C), determined for currents evoked at 0 mV, are both strongly (negatively [B] or positively [C]) correlated with the VSD-IV F-V k values. (D) The k and V1/2 values, determined from the VSD-IV F-V curves, can be used to predict %Aslow.
Analysis of iFGF12B, iFGF13VY, and iFGF12B/13VY chimeras reveals a strong correlation between the slopes of the VSD-IV F-V curves and the slow component of I Na inactivation. (A) Alignment of the iFGF12B and iFGF13VY sequences highlights the prominent difference in N-termini. (B–D) Several iFGF12B/13VY chimeras were constructed by swapping the N-termini, C-termini, and both C- and N-termini domains. Each chimera was coexpressed with NaV1.5, and effects on the time-and voltage-dependent properties of INa and VSD-IV activation were determined. Correlation and linear regression analyses were performed on these results obtained from iFGF chimeras, iFGF12B, and iFGF13VY. (B and C) The analyses revealed that the slow time constants of INa decay (Ƭs; B) and the fractional amplitudes of the slow component (%Aslow; C), determined for currents evoked at 0 mV, are both strongly (negatively [B] or positively [C]) correlated with the VSD-IV F-V k values. (D) The k and V1/2 values, determined from the VSD-IV F-V curves, can be used to predict %Aslow.
To determine whether the differences we observed in the effects of iFGF12B and iFGF13VY on NaV1.5-encoded currents are the result of the distinct N-termini of these two proteins, we created two iFGF chimeras by swapping the N-terminal domains (NTD) of iFGF12B (aa1–4) and iFGF13VY (aa1–72), and iFGF12B/13 (12NTD-13Core-13CTD) and iFGF13VY/12 (13NTD-12Core-12CTD; Fig. S5 A). If the NTD was sufficient to produce an iFGF-specific effect, we would expect the shifts in the G-V and VSD-IV F-V curves produced by the iFGF12B/13 and iFGF13VY/12 chimeras to resemble those produced by iFGF12B and iFGF13VY, respectively. These iFGF chimeras, however, produced modulatory effects on NaV channels G-V and VSD-IV F-V curves that are different from the effects of iFGF12B and iFGF13VY (Fig. S5 B and Table S4), implying that the N-terminal sequence alone is not enough to confer the specificity of iFGF-mediated effects. Therefore, we generated additional chimeras switching (1) the C-termini or (2) both the N- and C-termini of iFGF12B and iFGF13VY. Remarkably, neither of these chimera pairs replicated the modulation of the VSD-IV F-V curves produced by iFGF12B and iFGF13VY (Fig. S6 and Table S4), suggesting that all iFGF domains contribute to VSD-IV regulation.

Switching N-terminal domains between iFGF12B and iFGF13VY is not sufficient to replicate the iFGF-specific modulation of Na V 1.5 gating and function. (A) Schematics of iFGF12B, iFGF13VY, and the iFGF chimeras generated with the iFGF12B and iFGF13VY N-termini exchanged (iFGF12B/13 and iFGF13VY/12). (B) Normalized inactivation, G-V, and VSD-IV F-V curves for NaV1.5 expressed alone (grey dashed line), with iFGF12B (blue dashed line), iFGF13VY (orange dashed line), or one of the iFGF chimeras, FGF12B/13 (blue triangle) or FGF13VY/12 (orange diamond). The effects of the two iFGF chimeras on the G-V and F-V curves are distinct from those observed with either iFGF12B or iFGF13VY, implying that the N-termini of iFGF12B and iFGF13VY alone do not confer iFGF-specific regulation of NaV1.5.
Switching N-terminal domains between iFGF12B and iFGF13VY is not sufficient to replicate the iFGF-specific modulation of Na V 1.5 gating and function. (A) Schematics of iFGF12B, iFGF13VY, and the iFGF chimeras generated with the iFGF12B and iFGF13VY N-termini exchanged (iFGF12B/13 and iFGF13VY/12). (B) Normalized inactivation, G-V, and VSD-IV F-V curves for NaV1.5 expressed alone (grey dashed line), with iFGF12B (blue dashed line), iFGF13VY (orange dashed line), or one of the iFGF chimeras, FGF12B/13 (blue triangle) or FGF13VY/12 (orange diamond). The effects of the two iFGF chimeras on the G-V and F-V curves are distinct from those observed with either iFGF12B or iFGF13VY, implying that the N-termini of iFGF12B and iFGF13VY alone do not confer iFGF-specific regulation of NaV1.5.

iFGF chimeras differentially modulate the voltage dependence of VSD-IV activation (VSD-IV F-V). Three pairs of iFGF chimeras were constructed by switching the various iFGF domains of iFGF12B and iFGF13VY: the N-termini (left), the C-termini (middle), and both the N- and C-termini (right). The VSD-IV F-V curves of the various iFGF chimeras (black circle) are plotted together with those of either iFGF12B (blue dashed line) or iFGF13VY (orange dashed line). The top row presents data for iFGF chimeras with the iFGF13VY core domain and the iFGF12B N- (left), C- (middle), or both N- and C-termini (right) exchanged, and the bottom row shows the reverse configurations, i.e., the iFGF12B core domain with the iFGF13VY N- (left), C- (middle), or both N- and C-termini (right) exchanged. In both cases, the exchanged domain(s) is (are) underlined. As is evident, none of these chimeras confer functional effects on the activation of VSD-IV identical to those seen with native iFGF12B or iFGF13VY.
iFGF chimeras differentially modulate the voltage dependence of VSD-IV activation (VSD-IV F-V). Three pairs of iFGF chimeras were constructed by switching the various iFGF domains of iFGF12B and iFGF13VY: the N-termini (left), the C-termini (middle), and both the N- and C-termini (right). The VSD-IV F-V curves of the various iFGF chimeras (black circle) are plotted together with those of either iFGF12B (blue dashed line) or iFGF13VY (orange dashed line). The top row presents data for iFGF chimeras with the iFGF13VY core domain and the iFGF12B N- (left), C- (middle), or both N- and C-termini (right) exchanged, and the bottom row shows the reverse configurations, i.e., the iFGF12B core domain with the iFGF13VY N- (left), C- (middle), or both N- and C-termini (right) exchanged. In both cases, the exchanged domain(s) is (are) underlined. As is evident, none of these chimeras confer functional effects on the activation of VSD-IV identical to those seen with native iFGF12B or iFGF13VY.
Activation of VSD-IV was previously shown to facilitate NaV channel fast inactivation (Chahine et al., 1994; Horn et al., 2000; Chanda and Bezanilla, 2002; Hsu et al., 2017). In addition, charge neutralization mutations in the S4 segment of VSD-IV caused a shift in the V1/2 of inactivation of NaV1.5 currents (Capes et al., 2013). To explore the relationships between VSD-IV regulation and NaV1.5 gating kinetics, we investigated possible correlations between/among the measured voltage-dependences of INa activation and inactivation, INa decay kinetics, and VSD-IV F-V curves for NaV1.5 coexpressed with each of the iFGF chimeras (Table S4). Surprisingly, the iFGF and iFGF chimera data showed no correlation between the V1/2 values determined for steady-state inactivation of INa (V1/2, inact) and the VSD-IV F-V curves, yielding a Pearson’s correlation coefficient (r) equal to 0.23 and an R2 of 0.054 (Fig. S7 A), and only modest correlation with the slope (k) values (r = 0.62, R2 = 0.4; Fig. S7 C). Similarly, no correlation was found between the voltage-dependences of INa activation (V1/2, act) and the VSD-IV F-V curves (for V1/2: r = 0.005, R2 = 3 × 10⁻⁵, for k: r = −0.34, R2 = 0.12; Fig. S7, B and D).

Correlation and linear regression analyses reveal no correlations between the VSD-IV F-V and the G-V curves of activation and inactivation determined for Na V 1.5 coexpressed with iFGF12B, iFGF13VY, or the iFGF12B/13VY chimeras. The data derived from the voltage-clamp and VCF recordings of NaV1.5 coexpressed with iFGF12B, iFGF13VY, and the iFGF12B/13VY chimeras were plotted to determine if there were any correlations between the parameters (V1/2 and k) derived from the Boltzmann fits to the VSD-IV F-V and the G-V curves. (A and B) As is evident in the plots shown, there are no correlations between V1/2 determined from the VSD-IV F-V curves and the G-V curves for INa inactivation (A) or activation (B). (C and D) Comparison of the slope factors, k, of VSD-IV F-V and the G-V curves reveals a modest correlation for INa inactivation (C), but no correlation for INa activation (D). (E and F) In addition, the VSD-IV F-V V1/2 values are not well correlated with either the slow inactivation time constants (E) or the fractional amplitudes of the slow component of INa decay (F). (G) The k and V1/2 values, determined from the VSD-IV F-V curves, cannot be used to predict the inactivation G-V V1/2 values.
Correlation and linear regression analyses reveal no correlations between the VSD-IV F-V and the G-V curves of activation and inactivation determined for Na V 1.5 coexpressed with iFGF12B, iFGF13VY, or the iFGF12B/13VY chimeras. The data derived from the voltage-clamp and VCF recordings of NaV1.5 coexpressed with iFGF12B, iFGF13VY, and the iFGF12B/13VY chimeras were plotted to determine if there were any correlations between the parameters (V1/2 and k) derived from the Boltzmann fits to the VSD-IV F-V and the G-V curves. (A and B) As is evident in the plots shown, there are no correlations between V1/2 determined from the VSD-IV F-V curves and the G-V curves for INa inactivation (A) or activation (B). (C and D) Comparison of the slope factors, k, of VSD-IV F-V and the G-V curves reveals a modest correlation for INa inactivation (C), but no correlation for INa activation (D). (E and F) In addition, the VSD-IV F-V V1/2 values are not well correlated with either the slow inactivation time constants (E) or the fractional amplitudes of the slow component of INa decay (F). (G) The k and V1/2 values, determined from the VSD-IV F-V curves, cannot be used to predict the inactivation G-V V1/2 values.
These analyses, however, did reveal that the slope (k values) of the VSD-IV F-V curves correlated with the parameters describing INa decay, specifically with the slow inactivation time constants (Ƭs) and the fractional amplitudes of the slow component of inactivation (%Aslow). As illustrated for INa evoked at 0 mV, the r and R2 values between VSD-IV k values and the Ƭs were 0.79 and 0.63 (Fig. 7 B). Similarly, the calculated r and R2 values for the correlation between the measured %Aslow and VSD-IV k values were 0.76 and 0.59, respectively (Fig. 7 C). No correlations, however, were established between the V1/2 values of the VSD-IV F-V curves and neither the Ƭslow nor the %Aslow of INa (for Ƭslow: r = 0.53, R2 = 0.29, for %Aslow: r = 0.06, R2 = 0.004; Fig. S7, E and F).
Combining the two parameters derived from the VSD-IV F-V curves (i.e., V1/2 and k values) predicts the %Aslow with higher accuracy than achieved with the V1/2, inact. The R2 values between the predicted and actual values for %Aslow and the V1/2, inact were 0.72 and 0.58, respectively (Fig. 7 D and Fig. S7 G). Together, these results suggest that the slope of VSD-IV F-V curve is a strong determinant of the slower component of NaV channel inactivation. We also found that a steeper VSD-IV F-V curve, corresponding to the earlier completion of VSD-IV activation at more hyperpolarized potentials, contributes to a reduction in the relative amplitude of the slower component of inactivation. The absence of correlation between the V1/2, inact and the V1/2 of VSD-IV F-V curve hints that at least one additional element is involved in iFGF modulation of the voltage-dependence of steady-state inactivation of NaV1.5 currents.
Discussion
In this study, we demonstrate that the differential regulation of the time- and voltage-dependent properties of NaV1.5-encoded currents by iFGF12B and iFGF13VY reflects distinct effects on VSD-IV activation. Although previous studies have reported the importance of the iFGF N-terminal domain in the isoform-specific modulation of INa gating (Lou et al, 2005; Laezza et al, 2009; Yang et al, 2016; Barbosa et al, 2017; Ali et al, 2018; Singh et al, 2020, 2021; Chakouri et al, 2022), our results show that switching the N-termini of iFGF12B and iFGF13VY is not sufficient to confer the iFGF-specific modulation of NaV1.5 channel gating and VSD-IV activation. Rather, our results indicate that all regions of the iFGF proteins (i.e., the N-terminal, core, and C-terminal domains) contribute to determining iFGF-specific effects on INa gating and VSD-IV activation.
Physiological relevance
In native mouse cardiomyocytes, we observed a change in the voltage dependence of steady-state inactivation of INa with the deletion of iFGF13. This alteration results in decreased numbers of channels available to activate and conduct INa. The expression of iFGF12B in cFgf13KO ventricular myocytes rescues NaV channel steady-state availability, revealing roles for the iFGF proteins in regulating cardiac myocyte excitability. Patients carrying mutations on the binding interface of iFGF12B and NaV1.5 exhibit phenotypes associated with Brugada (Hennessey et al., 2013) and long-QT type 3 syndrome (Wang et al., 2012). In addition, a missense mutation in Fgf12 was shown to increase arrhythmia susceptibility in mice (Veliskova et al., 2021). The expression of iFGF12B also exerts an additional effect on NaV channel steady-state activation. The shift in voltage dependence of INa activation toward more positive potentials with iFGF12B means that larger depolarizations are required to activate the channels and, therefore, to reach the threshold for triggering APs. This effect will lead to a longer refractory period, where myocytes cannot be activated and could suppress arrhythmic activity.
Previous studies of Fgf13 knockdown or knockout in mice myocytes reported a reduction in the peak INa density (Wang et al., 2011a; Park et al., 2016; Wang et al., 2017). Here, however, we did not observe any significant reduction in the INa density with cardiac-specific iFGF13 knockout or with the addition of iFGF12B in cFgf13KO ventricles. These differences may reflect the mouse strain or knockout techniques employed or the INa recording conditions used in the previous versus the present studies. Interestingly, Park and colleagues reported a reduction in peak INa density in mouse ventricular myocytes lacking iFGF13 at 30°C but not at 25°C (Park et al., 2016). Whether iFGF12B and/or iFGF13VY directly affect cardiac NaV1.5 trafficking and membrane localization, as demonstrated for iFGFs in some neuronal cells (Laezza et al., 2009), requires further study.
Comparing iFGF regulation of NaV1.5 in myocytes and oocytes
The regulation of VSD-IV activation is evident not only with iFGFs but also with other NaV channel accessory proteins including the β subunits. Past studies showed that both the NaVβ1 and NaVβ3 subunits induce depolarizing shifts in VSD-IV activation, i.e., effects opposite iFGFs-mediated effects (Zhu et al, 2017, 2021). The presence of NaVβ subunits and other NaV channel accessory subunits in mouse myocytes, therefore, could affect iFGF-mediated changes in INa decay kinetics, accounting for observed differences in inactivation kinetics compared with the results observed in the Xenopus oocyte expression systems. In addition, the binding of Ca2+/calmodulin (CaM) on the NaV C-terminus is in the same vicinity as iFGF binding and might influence the function of iFGF, similar to how iFGF enhances the CaM function in NaV1.5 variants of reduced CaM binding affinity (Gade et al., 2020; Abrams et al., 2020). Different levels of Ca2+/calmodulin could thus contribute to system-specific effects of iFGF. Finally, posttranslational modification, such as phosphorylation on the NaV1.5 C-terminus, that occurs in mammalian cells, but not in Xenopus oocytes, can also affect the binding of iFGFs (Burel et al., 2017; Iqbal and Lemmens-Gruber, 2019; Lorenzini et al., 2021). The synergistic effects of multiple regulatory proteins and posttranslation channel modifications suggest that VSD-IV may act as a signaling hub where the regulation by many different NaV channel complex components is integrated to determine inactivation kinetics. In addition, other NaV α subunits, such as NaV1.6, might be present in native mouse cardiomyocytes (Maier et al, 2004; Lopez-Santiago et al, 2007), producing INa with different gating properties and differentially affected by iFGF coexpression.
Contribution of different iFGF domains to NaV1.5 regulation
The structures of the iFGF13/iFGF12 proteins in complex with the NaV1.5 C-terminus reveal that the common iFGF core domain is critical for binding (Wang et a., 2012; Wang et al., 2014). In addition, the folding of the core domain is nearly identical in iFGF13 (PDB accession nos. 3HBW [Goetz et al., 2009] and 4DCK [Wang et a., 2012]) and iFGF12 (PDB accession nos. 1Q1U [Goetz et al., 2009] and 4JQ0 [Wang et al., 2014]). It should also be noted that the iFGF N- and C-terminal domains are omitted from all of these structures. Both ends of the core domain structures, where the N- and C-terminal domains are located, however, are in the vicinity of the iFGF–NaV1.5 interaction sites. The N- and C-terminal domains of the iFGFs, therefore, might be expected to also interact with other parts of the NaV α subunit or assembled NaV1.5 channel and influence channel/current properties. Consistent with this hypothesis, it has previously been reported that mutation of a single proline residue in iFGF12 outside the iFGF–NaV C-terminus binding interface altered the (iFGF–NaV C-terminus) binding affinity (Wang et al., 2011b). Similar functional effects were observed when the corresponding proline residue in iFGF13 was modified. These observations led the authors of this study to suggest that the iFGFs may contain multiple NaV α subunit interaction sites, each contributing to the specific modulatory effects of the iFGF on different NaV α subunits and, therefore, on different NaV channels (Wang et al., 2011b). It has also been demonstrated that the perturbation of iFGF binding sites at two distinct interfaces, for example, using (two) peptides mimicking different sequences of iFGF14, led to differential modulation of NaV1.6-encoded channel gating (Ali et al, 2018; Singh et al, 2021). The differential effects of the various iFGF proteins on NaV channels/currents encoded by different NaV α subunits is thus likely the result of multiple and variable interactions, involving the diverse iFGF N- and C-termini, as well as the canonical binding interface, and resulting in distinct functional effects on VSD-IV dynamics and NaV channel gating.
Analyses of electrophysiological data obtained from iFGF12B/13VY chimeras coexpressed with NaV1.5 revealed a strong correlation between the slope(s) of the VSD-IV activation curve(s) and the kinetics of INa decay. This finding is consistent with previous studies demonstrating that the activation of VSD-IV is necessary for initiating fast inactivation (Chahine et al., 1994; Horn et al., 2000; Chanda and Bezanilla, 2002). Additional studies using site-3 toxins, which bind to the extracellular loop near repeat IV S4, showed that intermediate activation of VSD-IV prevents NaV channel transition into a fast inactivated state (Hanck and Sheets, 2007; Campos et al., 2004). These results imply that the full activation of VSD-IV is required for NaV fast inactivation (Campos and Beirão, 2006; Campos et al., 2008; Jiang et al., 2021a; Jiang et al., 2021b). According to the cryo-EM structure of mouse NaV1.5 with α-scorpion toxin, the intermediate-activated VSD-IV made the binding of the IFMT motif less stable and the activation gate wider (Jiang et al., 2021a). The presence of iFGFs facilitates the movement of VSD-IV toward the fully activated state and thus promotes the binding of the IFMT motif or the fast component of inactivation, which also recovers at a faster rate. The competition between two kinetically different pathways of inactivation implies that fast inactivation may limit the contribution of the slow component of inactivation (Richmond et al, 1998; Ransdell et al, 2022). The larger impact on the slope of VSD-IV F-V thus correlates with a larger fraction of the fast component of inactivation (equivalent to reduced %Aslow) that can recover faster and partially contribute to increasing channel availability.
iFGF regulation of the NaV1.5 VSDs
Modulation of VSD-IV is likely the direct effect of iFGF being bound to the NaV C-terminal domain. A two-switch model for fast inactivation has been proposed based on the chimeric structures of NaVPaS-hNaV1.7 in complex with the α-scorpion toxin to link VSD-IV activation and the fast inactivation (Clairfeuille et al., 2019). It is hypothesized that the interaction between resting VSD-IV and NaV C-terminus, termed switch 1, causes the sequestration of the III–IV linker by the CTD (switch 2), and the activation of VSD-IV alters the CTD conformation to release III–IV linker. We proposed that the binding of iFGF could potentially change the NaV CTD interaction, mediating earlier activation of VSD-IV (switch 1) and the preceding channel inactivation, as illustrated in the schematic diagram of the iFGF mechanism in Fig. 8.

The mechanism of iFGF regulation of the Na V channel gating. At the resting membrane potential, the closed-state NaV channel has all voltage sensors (VSD-I–VSD-IV) down in their resting conformations and the activation gate is closed. This schematic portrays two interactions between the resting VSD-IV and the C-terminal domain, and the C-terminal domain and the III–IV linker in the NaV channel, as proposed by Clairfeuille et al. (2019). The activation of VSD-I to VSD-III leads to the transition of NaV1.5 from a closed to an open state, allowing for Na+ conductance. The resulting activation of VSD-IV facilitates NaV channel fast inactivation. The coexpression of iFGF facilitates the activation of VSD-IV and thus facilitates the NaV1.5 channel inactivation.
The mechanism of iFGF regulation of the Na V channel gating. At the resting membrane potential, the closed-state NaV channel has all voltage sensors (VSD-I–VSD-IV) down in their resting conformations and the activation gate is closed. This schematic portrays two interactions between the resting VSD-IV and the C-terminal domain, and the C-terminal domain and the III–IV linker in the NaV channel, as proposed by Clairfeuille et al. (2019). The activation of VSD-I to VSD-III leads to the transition of NaV1.5 from a closed to an open state, allowing for Na+ conductance. The resulting activation of VSD-IV facilitates NaV channel fast inactivation. The coexpression of iFGF facilitates the activation of VSD-IV and thus facilitates the NaV1.5 channel inactivation.
Additional modulation of the NaV channel inactivation gate by the iFGF protein(s) is also possible. It has, for example, previously been reported that the E1784K mutation in NaV1.5 disrupts the switch 2 interaction and results in iFGF12B being ineffective in reducing the persistent component of NaV1.5-encoded currents (Gade et al., 2020), implying that the interaction between the NaV III–IV linker and the C-terminal domain is important for the iFGF-mediated modulation of the persistent NaV current. Another auxiliary protein bound to the NaV1.5 C-terminal domain, calmodulin, has also been suggested to modulate intramolecular interactions in the NaV α subunit (Gade et al., 2020), providing an additional mechanism to regulate the persistent NaV current (Abrams et al., 2020; Chakouri et al., 2022). The binding of iFGF to the NaV1.5 C-terminal domain, however, might additionally impact the calmodulin-binding conformation (Gabelli et al., 2014) and negatively affect the calmodulin function, as has been demonstrated for Ca2+/calmodulin-dependent inactivation of skeletal muscle NaV1.4-encoded channels (Gardill et al, 2019). Further studies are needed to fully understand the complex interactions, including antagonistic and/or synergistic interactions, and how these impact the regulation/modulation of NaV channel function by its various auxiliary subunits or combinations of auxiliary subunits.
The modulation of VSD-I activation by iFGF13VY, but not iFGF12B, may be due to the longer N-terminus of iFGF13VY disrupting the coupling between VSDs and resulting in an indirect modulation of VSD-I. Because of the domain-swapped arrangement in NaV α subunit, the VSD of one repeat is placed near the S5–S6 linker of the neighboring repeat, allowing two VSDs to be coupled (Chanda et al., 2004). Previous work showed that the binding of local anesthetic drugs inside NaV channel pores can alter VSD coupling, especially between VSD-I and VSD-IV, resulting in their F-V curves shifting in opposite directions (Muroi and Chanda, 2009). The longer N-terminus of the A-type iFGF isoform, iFGF14A, was also found to localize near the channel intracellular gate where it could regulate the pore (White et al., 2019; Yan et al., 2014). It is therefore possible that the N-terminus of iFGF13VY may remodel VSD coupling, causing altered VSD-I activation as an indirect effect that is connected to VSD-IV modulation.
Conclusion
In this study, we demonstrated distinct effects of iFGF12B and iFGF13VY on the regulation of NaV1.5 gating kinetics. Our results demonstrate that iFGFs facilitate the outward translation of VSD-IV from resting to activated conformation, leading to a reduction in the slow component of inactivation. The iFGF-specific effects are partially derived from the differential regulation of VSD-IV activation. The ability to modulate the activation of VSD-IV, however, is not unique to the iFGFs. Other regulatory proteins, toxins, and antiarrhythmic drugs can modulate VSD-IV activation and affect NaV channel inactivation. Taken together, we present a novel mechanism of iFGF modulation of cardiac INa that accounts for distinct iFGF effects.
Acknowledgments
Olaf S. Andersen served as editor.
The authors thank Dr. A. Burkhalter for assistance with and training in retro-orbital virus injections, Drs. M. Goldfarb and D. Ornitz for providing the Fgf12KO mouse line, Dr. G. Pitt for the polyclonal anti-iFGF13 antibody, and R. Wilson for expert technical assistance.
We gratefully acknowledge the financial support provided by the National Heart Lung and Blood Institute of the NIH (R01 142520 to J.M. Nerbonne and R01 HL150637 to J.M. Nerbonne and J.R. Silva), the NIH National Center for Research Resources (UL1 RR024992 to the Institute for Clinical and Translational Sciences at Washington University), and the Children’s Discovery Institute Pediatric Disease Mouse Models Core at Washington University. Viruses were generated in the Hope Center Viral Vectors Core, supported by a Neuroscience Blueprint Core grant (P30 NS057105) at Washington University Medical School. None of these funding sources were involved in study design, data collection, data analyses, data interpretation, manuscript preparation, or the decision to submit this article for consideration for publication.
The authors declare no competing financial interests.
Author contributions: P. Angsutararux, J.M. Nerbonne, and J.R. Silva intiated the project; P. Angsutararux, M. Marras, J.M. Nerbonne, and J.R. Silva supervised the work; P. Angsutararux, A.K. Dutta, M. Marras, C. Abella, R.L. Mellor, and J. Shi conducted the research; P. Angsutararux, J.R. Silva, and J.M. Nerbonne wrote the manuscript. All authors provided edits and feedback.
References
This work is part of a special issue on Structure and Function of Ion Channels in Native Cells and Macromolecular Complexes.
