


In the tumor microenvironment (TME), cancer-associated fibroblasts (CAFs) play a crucial role in promoting tumor progression by creating an immunosuppressive environment through cytokine secretion and antigen presentation. While previous studies have demonstrated that CAFs exhibit distinct metabolic profiles compared with normal fibroblasts, it remains unclear how these metabolic programs influence the immune landscape within tumors and which factors drive metabolic reprogramming in CAFs. Here, we found that glutamine synthesis by CAFs promotes the polarization of pro-tumorigenic tumor-associated macrophages (TAMs) and supports tumor growth by altering TAM composition, highlighting the pivotal role of CAFs in shaping the immunosuppressive TME. Mechanistically, we found that tumor-derived palmitic acid activates a signaling cascade involving TLR4, Syk, and NF-κB in fibroblasts, leading to inflammatory CAF polarization and IL-6–induced glutamine synthesis. These findings uncover a novel metabolic symbiosis whereby tumor cells manipulate TAM polarization through CAF-mediated glutamine metabolism, presenting potential therapeutic targets for cancer immunotherapy.
Introduction
The immunosuppressive features in the tumor microenvironment (TME) have been shown to play a significant role in supporting tumor immune evasion and progression (de Visser and Joyce, 2023). Therapies that reprogram the immunosuppressive nature of the TME have gained increasing attention in cancer treatments. The metabolic features of the TME are generally considered to be nutrient-deprived, hypoxic, and acidic (Wei et al., 2022), which can impair host anti-tumor immunity (Lim et al., 2020). However, tumor cells can undergo metabolic adaptations to meet their increased energy demands within the TME (Vaupel et al., 2019). The impact of metabolic stress on the tumor stroma, such as endothelial cells, cancer-associated fibroblasts (CAFs), tumor-associated macrophages (TAMs), regulatory T cells, and other lymphocytes, is underexplored. Moreover, it remains elusive whether these stromal cells can hamper host anti-tumor immunity through metabolic crosstalk.
CAFs, a predominant component of stromal cells in the TME, have been suggested to promote tumor progression via their immunomodulatory activities, including antigen presentation and cytokine production (Huang et al., 2022; Chen et al., 2021). Recent evidence suggests that CAFs and TAMs communicate in the TME to suppress host anti-immunity. Firstly, TAMs are often located in proximity to CAFs (Qi et al., 2022; Mayer et al., 2023). Secondly, CAFs release multiple soluble mediators, such as stromal cell-derived factor-1 (SDF-1) (Gok Yavuz et al., 2019; Mayer et al., 2023), Granulocyte-macrophage colony-stimulating factor (GM-CSF) (Cho et al., 2018), C-X-C motif chemokine ligands (CXCLs) (Wu et al., 2022), and interleukins (ILs), including IL-6 (Cho et al., 2018), which can influence the recruitment of macrophages and pro-tumorigenic polarization of TAMs. Lastly, CAFs have been shown to secrete extracellular matrix proteins to affect TAM phenotypes (Acerbi et al., 2015). These studies suggest that CAFs and TAMs communicate through cytokines and chemokines. Interestingly, CAFs have been shown to produce lactate through a process known as “Reverse Warburg Effect,” which provides tumor cells with necessary macromolecules to meet their energy requirement (Liang et al., 2022). Moreover, a recent study has demonstrated that CAFs can produce glutamine to support energy production and biosynthesis in cancer cells under conditions of glutamine deprivation (Yang et al., 2016), emphasizing that CAFs can modulate the TME not only by cytokine secretion but also through metabolic crosstalk. However, the underlying mechanisms by which CAFs acquire the ability to secrete glutamine in the tumor remain unclear, and it has yet to be described whether CAFs can modulate immune responses in the TME through their metabolic programs.
Metabolic reprogramming has been demonstrated to tailor activation and functional polarization of macrophages (Zeng et al., 2023). Interestingly, TAMs have been shown to undergo metabolic adaptations, including increased lipid metabolism, endoplasmic reticulum (ER) stress responses (Di Conza et al., 2021), elevated hypoxic responses (Murdoch and Lewis, 2005; Casazza et al., 2013), and lactate utilization (Colegio et al., 2014), to support their survival and pro-tumorigenic polarization in response to metabolic stress in the TME. Glutamine utilization by macrophages has also been reported to alter functional polarization by regulating production of α-ketoglutarate and succinate (Liu et al., 2017). In fact, TAMs have been shown to obtain glutamine in tumors to support their pro-tumorigenic polarization (Jha et al., 2015; Oh et al., 2020); yet, CD40-mediated immune activation can rewire glutamine metabolism in TAMs for the anti-tumorigenic polarization (Liu et al., 2023). These studies highlight the potential of targeting glutamine metabolism in cancer treatment by modulating TAM polarization; however, it remains unclear whether glutamine availability to TAMs can be supported by tumor cells or other stromal components.
Here, we found that CAFs are one of the major cell types in the tumor expressing high glutamine synthesis genes. Genetic ablation of glutamine synthetase (GS), a rate-limiting enzyme of glutamine synthesis, in fibroblasts led to improved anti-tumor immunity by reprogramming TAM phenotype. Mechanistically, tumor cell–produced lipids, particularly palmitate, metabolically reprogram CAFs, enhancing glutamine synthesis pathway and functional specialization via a TLR4-dependent lipid-sensing process. CAFs then activate the spleen tyrosine kinase (Syk)–NF-κB signaling pathway, leading to inflammatory CAF (iCAF) polarization and glutamine synthesis through autocrine IL-6 signaling. These findings were supported by a clear co-localization of glutamine-synthesizing iCAFs and TAMs in human breast cancer. Together, our findings uncover an unexplored metabolic symbiosis occurring among tumor cells, CAFs, and TAMs that supports tumor progression by orchestrating TME-induced iCAFs in driving TAM-mediated immunosuppression. Moreover, this study provides proof-of-concept for the development of cancer treatments that disrupt the communication between cancer cells, CAFs, and TAMs.
Results
CAFs expressing GS associate with elevated abundance of pro-tumorigenic TAMs
To examine the availability of amino acids in the TME of murine melanoma models, we collected serum and tumor-interstitial fluid (TIF) from mice engrafted with the YUMM1.7 melanoma cell line and inducible Braf/Pten melanoma model (Dankort et al., 2009) for targeted metabolomics. As expected, lactate was highly enriched in TIF compared with serum, and glucose/fructose was low. Interestingly, several amino acids were enriched in the TIF, including glutamine (Fig. 1, A and B; and Fig. S1, A and B). Glutamine has been shown to suppress anti-tumor immunity by tailoring macrophage polarization (Oh et al., 2020) and T cell differentiation (Leone et al., 2019), emphasizing that glutamine metabolism might be a key immunometabolic regulator in the TME. Of note, the increase in amino acids has also been reported in recent studies on colorectal carcinomas (Denkert et al., 2008; Qiu et al., 2014; Yang et al., 2020) and murine tumor models (Ma et al., 2024), showing that while levels may vary depending on tumor type and metabolic context, glutamate and glutamine are notably enriched in several instances. We could confirm that TIF of hepatocellular carcinomas from seven patients contained higher levels of glutamine compared with matched serum samples (Fig. S1, C and D). Thus, to examine what caused elevated glutamine in the TME, we analyzed RNA-sequencing (RNA-seq) results and found that cancer stroma, compared with normal stroma samples, in both ovarian cancer and colon cancer patients had higher expression of GS (Glul) mRNA (Fig. S2 A). GS encodes Glutamine Synthetase to control anabolic glutamine production (Yang et al., 2016). We speculated that stromal cells in the TME display elevated ability to synthesize glutamine, which drives the establishment of an immunosuppressive TME. To explore this, we examined the glutamine synthesis pathway in cell subsets within the TME by weighing the gene expression related to glutamine production in single-cell RNA-seq (scRNA-seq) datasets of melanomas and sarcomas (Fig. S2 B) (Xiao et al., 2019; Sanderson et al., 2020, Preprint; Davidson et al., 2020). In murine melanomas and sarcomas, we found that CAFs exhibited the highest score of glutamine synthesis pathway compared with other cell types (Fig. 1 C and Fig. S2 C). However, CAFs ranked second, with TAMs displaying the highest score of glutamine synthesis pathway compared with other cell types in human melanomas (Fig. S2 D), highlighting that two of the major cellular components in tumor stroma (CAFs and TAMs) may modulate glutamine availability in the TME. We then compared GS enzyme activity in TAMs and CAFs and found that CAFs exhibited higher enzyme activity compared with TAMs (Fig. 1 D). Moreover, CAFs upregulated GS protein expression and expression of genes controlling glutamine synthesis pathway compared with normal fibroblasts (NFs) (Fig. S2, E and F).

Depletion of GS in CAFs remodels TAM phenotype and restrains tumor progression. (A and B) Glutamine concentrations in the TME were quantified by LC-MS in serum and TIF from engrafted Yumm1.7 melanoma model (n = 8) (A) or inducible Braf/Pten melanoma model (n = 8) (B). (C) Distributions of glutamine synthesis pathway scores and heatmap displaying normalized gene expression in glutamine synthesis pathway in different cell types from murine melanoma scRNA-seq dataset. (D) Comparison of GS activity in TAMs and CAFs in engrafted Yumm1.7 melanoma model (n = 10). (E) Correlation of GS transcription level and pro-tumorigenic TAMs signature of melanoma patients in TCGA datasets. (F) Representative images of immunofluorescence staining on sections from human patients with colon cancer. Green: anti-CD68, white: anti-CD163, blue: anti-PDPN, and red: anti-GS. Cyan arrowheads indicate GS+ fibroblasts (GS+PDPN+). Yellow arrowheads indicate M2-like (CD163+CD68+) macrophages. White arrowheads indicate M1-like (CD163−CD68+) macrophages. Scale bars, 50 μm. (G) Correlation of GS+CAFs (GS+PDPN+) with the number of M1-like (CD163−CD68+) macrophages (red) or M2-like (CD163+CD68+) macrophages (blue) per field in the tumor sections derived from human colon cancer patients. (H) qPCR analysis of relative mRNA level of Cd206, Arg1 and Cd163 (pro-tumorigenic TAM markers) in BMDMs co-cultured with NFs or CAFs under glutamine-deficient condition for 48 h. (I) qPCR analysis of relative mRNA level of Cd206, Arg1, and Cd163 in BMDMs co-cultured with Ctrl CAFs or GSKO CAFs under glutamine-deficient condition for 48 h. (J and K) Tumor growth (J) and tumor weight (K) of Yumm1.7 melanomas from GS f/f (n = 8) and GS f/f FSP1cre mice (n = 8). (L–N) Percentages of iTAMs (L) and mTAMs (M) in Ly6G−CD11b+ myeloid cells from tumor-bearing GS f/f and GS f/f FSP1cre mice and ratio of iTAMs to mTAMs (N). (O and P) Tumor growth (O) and tumor weight (P) of Yumm1.7 melanomas from GS f/f (n = 12) and GS f/f FSP1cre mice (n = 11) treated with PBS or with anti-CSF1R antibodies. (Q) Yumm1.7 melanoma tumor cells were co-injected with either Ctrl CAFs or GSKO CAFs on the right or left flanks of GSf/f FSP1cre mice. (R and S) Tumor growth (R) and tumor weight (S) of Yumm1.7 melanomas co-injected with Ctrl CAFs or GSKO CAFs on GSf/f FSP1cre mice (n = 8). (T–V) Paired percentages of iTAMs (T) and mTAMs (U) in Ly6G−CD11b+ myeloid cells derived from Yumm1.7 melanomas co-injected with Ctrl CAFs or GSKO CAFs on GSf/f FSP1cre mice and paired ratio of iTAMs to mTAMs (V). Data are the cumulative results from at least two independent experiments (A, B, D, J–N, and R–V) or are representative of at least two independent experiments with similar results (H, I, O, P, and T–V). All data are shown as mean ± SEM and were analyzed by two-tailed, paired Student’s t test (A, B, and D) and two-tailed, unpaired Student’s t test (H–P, R, and S). ****P < 0.0001; ***P < 0.001; **P < 0.01; *P < 0.05; P > 0.05 not significant (ns).
Depletion of GS in CAFs remodels TAM phenotype and restrains tumor progression. (A and B) Glutamine concentrations in the TME were quantified by LC-MS in serum and TIF from engrafted Yumm1.7 melanoma model (n = 8) (A) or inducible Braf/Pten melanoma model (n = 8) (B). (C) Distributions of glutamine synthesis pathway scores and heatmap displaying normalized gene expression in glutamine synthesis pathway in different cell types from murine melanoma scRNA-seq dataset. (D) Comparison of GS activity in TAMs and CAFs in engrafted Yumm1.7 melanoma model (n = 10). (E) Correlation of GS transcription level and pro-tumorigenic TAMs signature of melanoma patients in TCGA datasets. (F) Representative images of immunofluorescence staining on sections from human patients with colon cancer. Green: anti-CD68, white: anti-CD163, blue: anti-PDPN, and red: anti-GS. Cyan arrowheads indicate GS+ fibroblasts (GS+PDPN+). Yellow arrowheads indicate M2-like (CD163+CD68+) macrophages. White arrowheads indicate M1-like (CD163−CD68+) macrophages. Scale bars, 50 μm. (G) Correlation of GS+CAFs (GS+PDPN+) with the number of M1-like (CD163−CD68+) macrophages (red) or M2-like (CD163+CD68+) macrophages (blue) per field in the tumor sections derived from human colon cancer patients. (H) qPCR analysis of relative mRNA level of Cd206, Arg1 and Cd163 (pro-tumorigenic TAM markers) in BMDMs co-cultured with NFs or CAFs under glutamine-deficient condition for 48 h. (I) qPCR analysis of relative mRNA level of Cd206, Arg1, and Cd163 in BMDMs co-cultured with Ctrl CAFs or GSKO CAFs under glutamine-deficient condition for 48 h. (J and K) Tumor growth (J) and tumor weight (K) of Yumm1.7 melanomas from GS f/f (n = 8) and GS f/f FSP1cre mice (n = 8). (L–N) Percentages of iTAMs (L) and mTAMs (M) in Ly6G−CD11b+ myeloid cells from tumor-bearing GS f/f and GS f/f FSP1cre mice and ratio of iTAMs to mTAMs (N). (O and P) Tumor growth (O) and tumor weight (P) of Yumm1.7 melanomas from GS f/f (n = 12) and GS f/f FSP1cre mice (n = 11) treated with PBS or with anti-CSF1R antibodies. (Q) Yumm1.7 melanoma tumor cells were co-injected with either Ctrl CAFs or GSKO CAFs on the right or left flanks of GSf/f FSP1cre mice. (R and S) Tumor growth (R) and tumor weight (S) of Yumm1.7 melanomas co-injected with Ctrl CAFs or GSKO CAFs on GSf/f FSP1cre mice (n = 8). (T–V) Paired percentages of iTAMs (T) and mTAMs (U) in Ly6G−CD11b+ myeloid cells derived from Yumm1.7 melanomas co-injected with Ctrl CAFs or GSKO CAFs on GSf/f FSP1cre mice and paired ratio of iTAMs to mTAMs (V). Data are the cumulative results from at least two independent experiments (A, B, D, J–N, and R–V) or are representative of at least two independent experiments with similar results (H, I, O, P, and T–V). All data are shown as mean ± SEM and were analyzed by two-tailed, paired Student’s t test (A, B, and D) and two-tailed, unpaired Student’s t test (H–P, R, and S). ****P < 0.0001; ***P < 0.001; **P < 0.01; *P < 0.05; P > 0.05 not significant (ns).

Selective metabolite enrichment in TIF compared with serum. (A–C) Heatmaps show metabolites involved in TIF and serum derived from engrafted melanoma-bearing mice (A), inducible Braf/Pten melanoma mice (B), and human liver cancer patients (C). (D) Glutamine concentrations in the TME were quantitated by LC-MS in serum and TIF from human liver cancer patients (n = 7). Data in D are shown as mean ± SEM and were analyzed by two-tailed, paired Student’s t test. **P < 0.01.
Selective metabolite enrichment in TIF compared with serum. (A–C) Heatmaps show metabolites involved in TIF and serum derived from engrafted melanoma-bearing mice (A), inducible Braf/Pten melanoma mice (B), and human liver cancer patients (C). (D) Glutamine concentrations in the TME were quantitated by LC-MS in serum and TIF from human liver cancer patients (n = 7). Data in D are shown as mean ± SEM and were analyzed by two-tailed, paired Student’s t test. **P < 0.01.
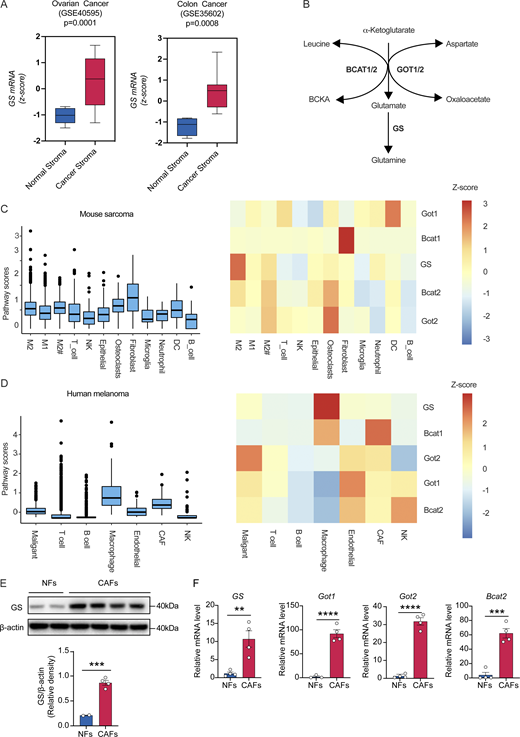
High production of glutamine by CAFs in the TME. (A) Tukey boxplots displaying z-score values of GS mRNA expression in normal stroma and cancerous stroma from ovarian cancer and colon cancer (colon: normal, n = 4; cancer, n = 13. Ovary: normal, n = 8; cancer, n = 31). (B) Schematic of glutamine synthesis pathway. (C) Distributions of glutamine synthesis pathway scores and heatmaps displaying normalized gene expression in glutamine synthesis pathway in different cell types from mouse sarcoma scRNA-seq dataset. (D) Distributions of glutamine synthesis pathway scores and heatmaps displaying normalized gene expression in glutamine synthesis pathway in different cell types from human melanoma scRNA-seq dataset. (E) GS protein expression levels were determined by western blot in NFs (n = 2) and CAFs (n = 4). (F) Relative mRNA expression of genes (GS, Got1, Got2, and Bcat2) involved in glutamine synthesis pathway in NFs and CAFs. Data are shown as mean ± SEM and were analyzed by two-tailed, unpaired Student’s t test (E and F). ****P < 0.0001; ***P < 0.001; **P < 0.01; P > 0.05 not significant (ns). Source data are available for this figure: SourceData FS2.
High production of glutamine by CAFs in the TME. (A) Tukey boxplots displaying z-score values of GS mRNA expression in normal stroma and cancerous stroma from ovarian cancer and colon cancer (colon: normal, n = 4; cancer, n = 13. Ovary: normal, n = 8; cancer, n = 31). (B) Schematic of glutamine synthesis pathway. (C) Distributions of glutamine synthesis pathway scores and heatmaps displaying normalized gene expression in glutamine synthesis pathway in different cell types from mouse sarcoma scRNA-seq dataset. (D) Distributions of glutamine synthesis pathway scores and heatmaps displaying normalized gene expression in glutamine synthesis pathway in different cell types from human melanoma scRNA-seq dataset. (E) GS protein expression levels were determined by western blot in NFs (n = 2) and CAFs (n = 4). (F) Relative mRNA expression of genes (GS, Got1, Got2, and Bcat2) involved in glutamine synthesis pathway in NFs and CAFs. Data are shown as mean ± SEM and were analyzed by two-tailed, unpaired Student’s t test (E and F). ****P < 0.0001; ***P < 0.001; **P < 0.01; P > 0.05 not significant (ns). Source data are available for this figure: SourceData FS2.
Since glutamine uptake is critical for macrophage polarization (Liu et al., 2017), we hypothesized that CAFs might synthesize glutamine to support the formation of pro-tumorigenic TAMs within the tumors. By analyzing TCGA data, we observed a positive correlation between GS expression and pro-tumorigenic TAM signature score in melanoma, colorectal cancer, lung cancer, and prostate cancer patients (Fig. 1 E and Fig. S3 A). We next examined the spatial relationship of GS+ CAFs and CD163+ TAMs in human colorectal tumors. GS+ CAFs, characterized by podoplanin (PDPN) expression, were not differentially localized in proximity to pro-tumorigenic TAMs (CD163+CD68+) or anti-tumorigenic TAMs (CD163−CD68+) (Fig. S3, B and C). However, the density of GS+ CAFs per field was significantly linked with the abundance of pro-tumorigenic TAMs, but not anti-tumorigenic TAMs (Fig. 1, F and G), indicating that CAFs may support accumulation of pro-tumorigenic TAMs. By examining the expression of genes involved in glutamine catabolism, including Slc1a5 (a glutamine transporter), Gls1 (an enzyme converting glutamine to glutamate), and Glud1 (an enzyme mediating the conversion of glutamate to α-ketoglutarate), we further confirmed that TAMs expressed higher levels of genes contributing to glutamine consumption compared with macrophages in the spleen derived from tumor-bearing mice (Fig. S3 D). We therefore wondered whether CAFs can promote macrophage pro-tumorigenic polarization in a GS-dependent manner. To test this, we applied a transwell-based co-culture system to avoid direct cell–cell interaction, in which we co-cultured bone marrow-derived macrophages (BMDMs) with NFs or CAFs under glutamine-deficient conditions. Our results showed that CAFs, but not NFs, promoted the expression of Cd206, arginase 1 (Arg1), and Cd163 pro-tumorigenic markers (Di Conza et al., 2021) in BMDMs (Fig. 1 H). To further test whether CAF-driven pro-tumorigenic polarization in macrophages is GS-dependent, we generated primary CAFs and then immortalized them with SV40. Next, we transduced this immortalized CAF cell line with either guide RNA (gRNA) targeting scramble sequence or GS by using a CRISPR/Cas9 all-in-one system (Franco et al., 2023). We confirmed that CAF cell line transduced with GS-targeting gRNA (referred to GSKO CAFs) had ablated expression of GS protein and production of glutamine (Fig. S3, E and F). Co-culture of BMDMs with either CAFs expressing control gRNA (Ctrl CAFs) or GSKO CAFs under glutamine-deficient conditions showed that GSKO CAFs displayed lower ability to stimulate the expression of CD206 and Arg1 in BMDMs compared with control CAFs (Fig. 1 I), indicating that CAFs can promote macrophage pro-tumorigenic polarization in a glutamine production-dependent manner. Altogether, our results suggest that CAFs display an elevated ability to support glutamine production that may modulate functional polarization in TAMs by altering glutamine availability in the TME.
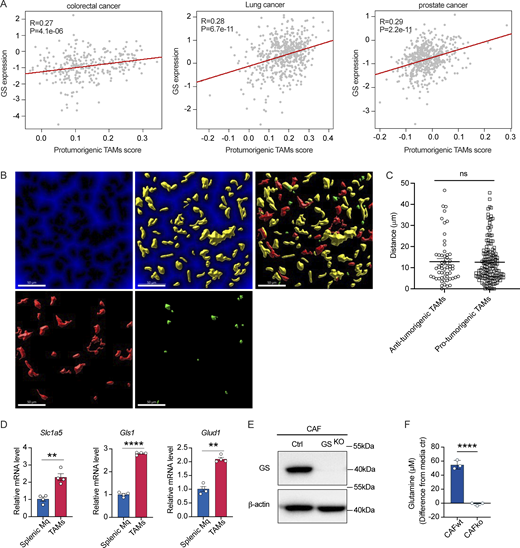
CAFs expressing GS associates with the elevated abundance of pro-tumorigenic TAMs. (A) Correlation analysis of GS transcriptomic expression level and pro-tumorigenic TAMs signature of colorectal cancer, lung cancer, and prostate cancer patients in TCGA datasets. (B and C) Distance of M2-like macrophages (CD163+CD68+, red) and M1-like macrophages (CD163−CD68+, green) from GS+ fibroblasts (yellow). Scale bars, 50 μm (B), and quantification of distance (C). (D) qPCR analysis of relative mRNA level of genes (Slc1a5, Gls1, and Glud1) (n = 4) involved in glutamine consumption pathway in macrophages sorted from spleen or Yumm1.7 melanomas. (E) Knockout of GS expression in CAFs by using lentivirus infection validated by western blot. (F) Glutamine levels in spent medium of CAF-WT and CAF-GSKO cultured in TCM for 24 h, normalized to unspent medium. Data in A are analyzed with Spearman correlation test. Data are representative of at least two independent experiments with similar results (D–F). Data are shown as mean ± SEM and were analyzed by two-tailed, unpaired Student’s t test (C, D, and F). ****P < 0.0001; **P < 0.01; P > 0.05 not significant (ns). Source data are available for this figure: SourceData FS3.
CAFs expressing GS associates with the elevated abundance of pro-tumorigenic TAMs. (A) Correlation analysis of GS transcriptomic expression level and pro-tumorigenic TAMs signature of colorectal cancer, lung cancer, and prostate cancer patients in TCGA datasets. (B and C) Distance of M2-like macrophages (CD163+CD68+, red) and M1-like macrophages (CD163−CD68+, green) from GS+ fibroblasts (yellow). Scale bars, 50 μm (B), and quantification of distance (C). (D) qPCR analysis of relative mRNA level of genes (Slc1a5, Gls1, and Glud1) (n = 4) involved in glutamine consumption pathway in macrophages sorted from spleen or Yumm1.7 melanomas. (E) Knockout of GS expression in CAFs by using lentivirus infection validated by western blot. (F) Glutamine levels in spent medium of CAF-WT and CAF-GSKO cultured in TCM for 24 h, normalized to unspent medium. Data in A are analyzed with Spearman correlation test. Data are representative of at least two independent experiments with similar results (D–F). Data are shown as mean ± SEM and were analyzed by two-tailed, unpaired Student’s t test (C, D, and F). ****P < 0.0001; **P < 0.01; P > 0.05 not significant (ns). Source data are available for this figure: SourceData FS3.
Depletion of GS in CAFs remodels TAM phenotype and restrains tumor progression
To investigate whether GS expression in CAFs can modulate pro-tumorigenic phenotype of TAMs in vivo and tumor growth, we first generated fibroblast-specific GS knockout mice by crossing GSflox/flox mice with fibroblast-specific protein 1 (FSP1)-cre mice (referred to GScKO mice). We then engrafted YUMM1.7 melanoma cells into GSflox/flox (as the WT) and GScKO mice and found that GScKO mice displayed reduced tumor growth and weight compared with WT mice (Fig. 1, J and K). Next, we examined the abundance of immature TAMs (iTAMs) and mature TAMs (mTAMs), in which iTAMs expressed lower levels of MHCII, but higher levels of programmed death-ligand 1 (PD-L1), CD163, and Arg1 compared with mTAMs (Fig. S4, A–D) (Movahedi et al., 2010; Di Conza et al., 2021; Etzerodt et al., 2019). We found that tumors in GScKO mice contained less iTAMs but a slight increase of mTAMs, leading to a diminished ratio of iTAMs to mTAMs compared with WT mice (Fig. 1, L–N). These results suggested that the genetic ablation of GS in CAFs could alleviate pro-tumorigenic features in TAMs and restrain tumor growth. However, FSP1 was recently found to be expressed by a subset of inflammatory macrophages (Österreicher et al., 2011), which highlighted the possibility that nonspecific GS ablation in myeloid cells may contribute to reduced tumor burden in GScKO mice. To rule out this possibility, we generated macrophage-specific GS knockout mice by crossing GSflox/flox mice with LysM-cre mice (Fig. S4 E). In contrast to mice with fibroblast-specific GS ablation, genetic ablation of GS in macrophages affected neither tumor growth nor the abundance of iTAMs and mTAMs (Fig. S4, F–J), further confirming the importance of glutamine synthesis in CAFs in modulating TAM phenotype and tumor growth. Since we observed reduced tumor growth and iTAMs/mTAMs ratio in GScKO mice, we speculated that altered phenotype in TAMs was responsible for the declined tumor growth. To examine this, we administered either control vehicle or anti-CSF 1 receptor (CSF1R) antibody to deplete macrophages in tumor-bearing WT and GScKO mice (Fig. S4, K and L). Depletion of macrophages with anti-CSF1R antibody restored tumor growth in GScKO mice and abolished the difference of tumor burden between WT and GScKO mice (Fig. 1, O and P). To validate that GS-expressing CAFs were sufficient in promoting tumor growth and modulating pro-tumorigenic features in TAMs and to exclude that unspecific GS knockout in TAMs could influence the results, we mixed YUMM1.7 melanoma cells with either CAF expressing control gRNA (Ctrl CAFs) or GSKO CAFs and then engrafted them into GScKO mice (Fig. 1 Q). We found that co-injection of YUMM1.7 cells with GSKO CAFs resulted in reduced tumor growth and burden compared with YUMM1.7 cells with control CAFs (Fig. 1, R and S). Furthermore, co-engraftment of YUMM1.7 cells with GSKO CAFs increased the frequency of mTAMs and resulted in a reduced abundance in iTAMs, which led to a declined ratio of iTAMs to mTAMs (Fig. 1, T–V). Collectively, our data suggest that GS upregulation in CAFs can promote tumor growth by boosting the accumulation of pro-tumorigenic TAMs.
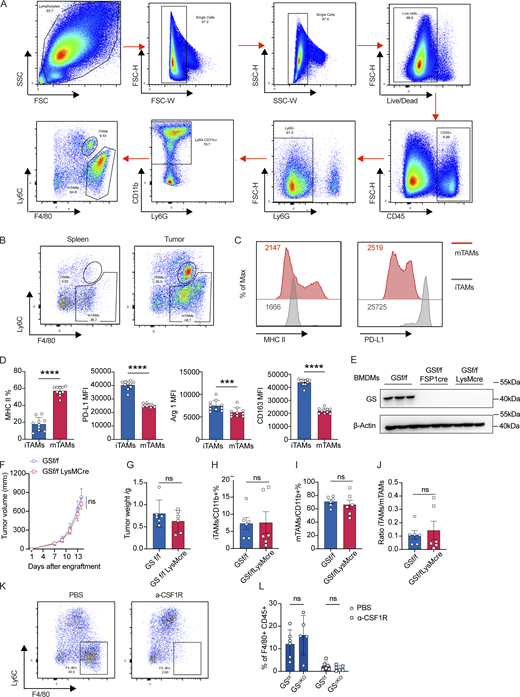
CAFs promote M2 macrophage polarization under glutamine-deficient condition. (A) Gating strategy of iTAMs and mTAMs. iTAMs: single cells/live cells/CD45+/Ly6G−/CD11b+/F4/80+Ly6Cint; mTAMs: single cells/live cells/CD45+/Ly6G−/CD11b+/F4/80+Ly6C−. (B) Representative FACS plots of gating for iTAMs and mTAMs populations in spleen and tumor from Yumm1.7 melanoma-bearing mice. (C) Representative histograms of MHC II and PD-L1 in mTAMs and iTAMs from Yumm1.7 melanoma-bearing mice. (D) Validation of gating strategy by confirming M2-like macrophage markers (CD163, Arg1, MHCII, and PDL1) expression on iTAM and mTAMs. (E) Western blot validating GS knockout in macrophages by both FSP1- and LysM-driven cre. (F and G) Tumor growth (F) and tumor weight (G) of Yumm1.7 melanomas from GS f/f (n = 6) and GS f/f LysM cre mice (n = 6). (H–J) Percentages of iTAMs (H) and mTAMs (I) in Ly6G−CD11b+ myeloid cells from tumor-bearing GS f/f and GS f/f LysM cre mice and ratio of iTAMs to mTAMs (J). (K) Representative FACS plots of macrophages in the spleen of Yumm1.7 melanoma-bearing mice treated with PBS or anti-CSF1R antibodies to validate macrophage depletion. (L) Percentages of macrophages (F4/80+ cells in CD45+ immune cells). Data are representative of at least two independent experiments with similar results (A–C, E, and K) or are the cumulative results from at least two independent experiments (D, F–J, and L). All data are shown as mean ± SEM and were analyzed by two-tailed, unpaired Student’s t test (D, F–J, and I) or two-way ANOVA with Sidak’s multiple comparison test (I). ****P < 0.0001; ***P < 0.001; P > 0.05 not significant (ns). PD-L1, programmed death-ligand 1. Source data are available for this figure: SourceData FS4.
CAFs promote M2 macrophage polarization under glutamine-deficient condition. (A) Gating strategy of iTAMs and mTAMs. iTAMs: single cells/live cells/CD45+/Ly6G−/CD11b+/F4/80+Ly6Cint; mTAMs: single cells/live cells/CD45+/Ly6G−/CD11b+/F4/80+Ly6C−. (B) Representative FACS plots of gating for iTAMs and mTAMs populations in spleen and tumor from Yumm1.7 melanoma-bearing mice. (C) Representative histograms of MHC II and PD-L1 in mTAMs and iTAMs from Yumm1.7 melanoma-bearing mice. (D) Validation of gating strategy by confirming M2-like macrophage markers (CD163, Arg1, MHCII, and PDL1) expression on iTAM and mTAMs. (E) Western blot validating GS knockout in macrophages by both FSP1- and LysM-driven cre. (F and G) Tumor growth (F) and tumor weight (G) of Yumm1.7 melanomas from GS f/f (n = 6) and GS f/f LysM cre mice (n = 6). (H–J) Percentages of iTAMs (H) and mTAMs (I) in Ly6G−CD11b+ myeloid cells from tumor-bearing GS f/f and GS f/f LysM cre mice and ratio of iTAMs to mTAMs (J). (K) Representative FACS plots of macrophages in the spleen of Yumm1.7 melanoma-bearing mice treated with PBS or anti-CSF1R antibodies to validate macrophage depletion. (L) Percentages of macrophages (F4/80+ cells in CD45+ immune cells). Data are representative of at least two independent experiments with similar results (A–C, E, and K) or are the cumulative results from at least two independent experiments (D, F–J, and L). All data are shown as mean ± SEM and were analyzed by two-tailed, unpaired Student’s t test (D, F–J, and I) or two-way ANOVA with Sidak’s multiple comparison test (I). ****P < 0.0001; ***P < 0.001; P > 0.05 not significant (ns). PD-L1, programmed death-ligand 1. Source data are available for this figure: SourceData FS4.
IL-6/STAT3 pathway reinforces iCAF polarization and glutamine synthesis in fibroblasts
CAFs have been shown to support the metabolic needs of tumor cells by producing glutamine from atypical carbon and nitrogen sources, an ability that cannot be engaged by NFs (Yang et al., 2016). Of note, recent scRNA-seq studies have distinguished three main subsets of CAFs across various tumor types, including inflammatory CAFs (iCAFs), myofibroblastic CAFs (myCAFs), and antigen-presenting CAFs (apCAFs) (Lavie et al., 2022). Among these subsets, iCAFs, which are characterized by high production of IL-6 and low expression of α-smooth muscle actin (α-SMA), have been recognized for their role in promoting tumor growth by secreting diverse pro-inflammatory cytokines (Biffi et al., 2019), but their metabolic contributions within the TME remain unknown. The previous findings suggest that the TME can reprogram the metabolic capacity in fibroblasts, yet the underlying mechanisms by which cancer cells stimulate glutamine synthesis in CAFs remain elusive. To test whether tumor cell–derived factors can promote the glutamine synthesis pathway in fibroblasts, we treated NFs with the tumor cell–conditioned medium (TCM) collected from YUMM1.7 melanoma cell line (Yu et al., 2020; Wang et al., 2020). TCM treatment induced expression of genes related to glutamine anabolism and GS protein expression in NFs in a time-dependent manner (Fig. 2, A and B). In contrast, conditioned medium derived from primary murine embryonic fibroblasts (MEF) did not affect expression of genes related to glutamine anabolism in NFs, nor did it increase the relative glutamine levels in the medium to the same degree as TCM (Fig. 2, C and D). To fully understand how TCM tailors fibroblast phenotype, we treated NFs with control medium or TCM and then performed RNA-seq. By applying gene set enrichment analysis (GSEA), we found that NFs treated with TCM displayed enrichment of genes associated with iCAFs and IL-6/JAK/STAT3 signaling pathway (Fig. 2, E and F). We confirmed that key genes from the iCAF gene set (Il6, Cxcl1, Cxcl3, Il1r1, and Ly6c1) were enriched by TCM but not MEF-conditioned medium (Fig. S5 A). Intriguingly, we found that iCAFs in scRNA-seq of several human tumor types also increased expression of genes related to glutamine anabolism compared with myCAFs (Fig. 2 G). Together, our results suggest that tumor cell–derived factors can promote metabolic and functional transition in NFs, driving them toward an iCAF-like phenotype and elevated glutamine anabolic pathways.
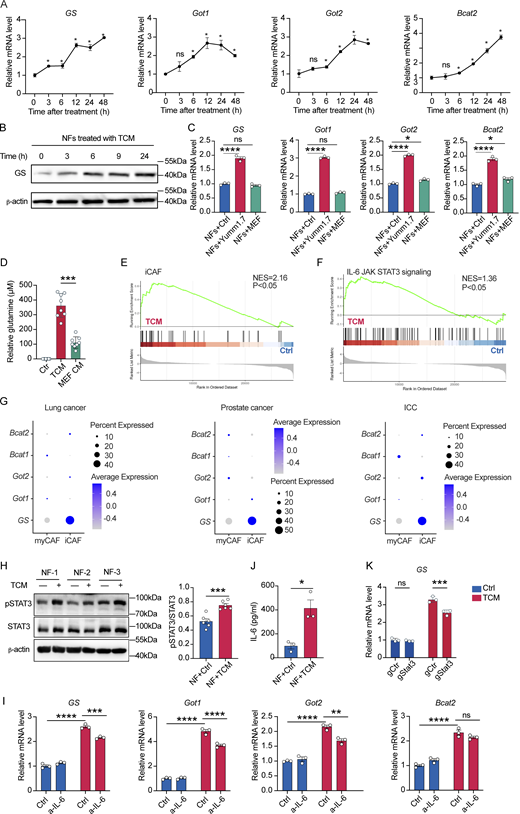
IL-6/STAT3 pathway reinforces iCAFs polarization and glutamine synthesis in fibroblasts. (A) qPCR analysis of relative mRNA expression levels of glutamine synthesis pathway associated genes in NFs treated with TCM at indicated different time points. (B) Western blots of GS protein expression level in NFs treated with TCM at indicated time points. (C) qPCR analysis of relative mRNA expression levels of glutamine synthesis pathway associated genes in NFs treated with TCM or MEF CM for 24 h. (D) Glutamine levels in spent culture medium of NFs treated with TCM or MEF-conditioned medium (MEF CM) for 24 h. Glutamine levels are normalized to unspent medium and shown relative to NFs glutamine production in normal medium (Ctr). (E and F) GSEA for iCAF (E), IL-6/JAK/STAT3 signaling pathway (F) in NFs treated with TCM versus control. Significant NES >1; q value <0.05. (G) Bubble plots comparing expression of genes associated with glutamine synthesis pathway in mCAF and iCAF. (H) Western blots of STAT3 were shown in NFs treated with or without TCM for 24 h. Quantification was calculated by ImageJ. (I) qPCR analysis of relative mRNA expression levels of glutamine synthesis pathway associated genes in NFs treated with Yumm1.7 CM in the presence of anti–IL-6 neutralization antibody (100 μg/ml). (J) ELISA of IL-6 protein level in the supernatant of NFs treated with or without TCM. (K) qPCR analysis of relative mRNA expression of GS in TCM treated NFs after STAT3 knockdown. Data are the cumulative results from at least two independent experiments (D) or are representative of at least two independent experiments with similar results (A–C and H–K). All data are shown as mean ± SEM and were analyzed by two-tailed, unpaired Student’s t test (A, B, H, and J), one-way ANOVA with Tukey’s multiple comparison test (C), or two-way ANOVA with Sidak’s multiple comparison test (I and K). ****P < 0.0001; ***P < 0.001; **P < 0.01; *P < 0.05; P > 0.05 not significant (ns). Source data are available for this figure: SourceData F2.
IL-6/STAT3 pathway reinforces iCAFs polarization and glutamine synthesis in fibroblasts. (A) qPCR analysis of relative mRNA expression levels of glutamine synthesis pathway associated genes in NFs treated with TCM at indicated different time points. (B) Western blots of GS protein expression level in NFs treated with TCM at indicated time points. (C) qPCR analysis of relative mRNA expression levels of glutamine synthesis pathway associated genes in NFs treated with TCM or MEF CM for 24 h. (D) Glutamine levels in spent culture medium of NFs treated with TCM or MEF-conditioned medium (MEF CM) for 24 h. Glutamine levels are normalized to unspent medium and shown relative to NFs glutamine production in normal medium (Ctr). (E and F) GSEA for iCAF (E), IL-6/JAK/STAT3 signaling pathway (F) in NFs treated with TCM versus control. Significant NES >1; q value <0.05. (G) Bubble plots comparing expression of genes associated with glutamine synthesis pathway in mCAF and iCAF. (H) Western blots of STAT3 were shown in NFs treated with or without TCM for 24 h. Quantification was calculated by ImageJ. (I) qPCR analysis of relative mRNA expression levels of glutamine synthesis pathway associated genes in NFs treated with Yumm1.7 CM in the presence of anti–IL-6 neutralization antibody (100 μg/ml). (J) ELISA of IL-6 protein level in the supernatant of NFs treated with or without TCM. (K) qPCR analysis of relative mRNA expression of GS in TCM treated NFs after STAT3 knockdown. Data are the cumulative results from at least two independent experiments (D) or are representative of at least two independent experiments with similar results (A–C and H–K). All data are shown as mean ± SEM and were analyzed by two-tailed, unpaired Student’s t test (A, B, H, and J), one-way ANOVA with Tukey’s multiple comparison test (C), or two-way ANOVA with Sidak’s multiple comparison test (I and K). ****P < 0.0001; ***P < 0.001; **P < 0.01; *P < 0.05; P > 0.05 not significant (ns). Source data are available for this figure: SourceData F2.
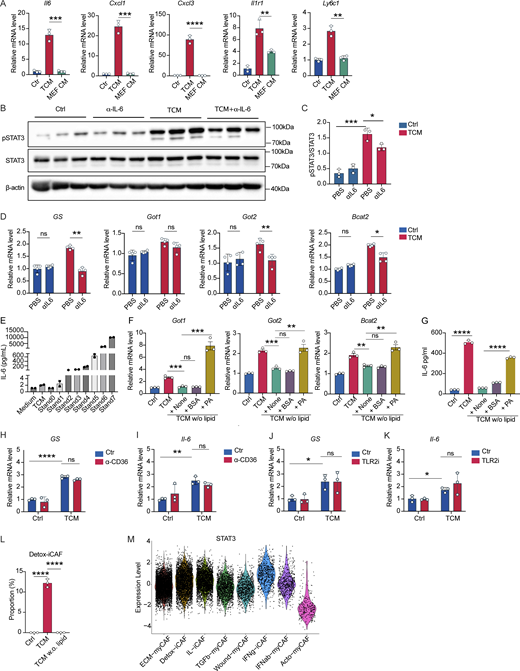
Tumor-derived lipids induce an IL-6/STAT3 autocrine pathway to promote glutamine synthesis in NFs. (A) qPCR analysis of relative mRNA expression levels of iCAF signature genes in NFs treated with TCM or MEF CM for 24 h. (B and C) Western blot of STAT3 in NFs treated with TCM with or without anti–IL-6 neutralization antibody for 24 h (B). Quantification calculated by ImageJ (C). (D) qPCR analysis of relative mRNA expression levels of glutamine synthesis pathway associated genes in NFs treated with TCM derived from ER+ breast cancer EO771 cells with or without IL-6–blocking antibody for 24 h. (E) Multiplex cytokine array was used to detect IL-6 levels in TCM as compared with the control medium. Positive control was the supernatant collected from NFs after TCM treatment for 24 h. (F and G) NFs were treated with TCM or TCM w/o lipid or TCM w/o lipid supplemented with palmitate conjugated with BSA (200 μM) for 24 h. BSA alone was used as a control. qPCR analysis of expression of glutamine synthesis pathway genes (Got1, Got2, and Bcat2) (F) and ELISA measurements of IL-6 (G). (H and I) NFs were treated with TCM in the presence of anti-CD36 antibody for 24 h at indicated concentrations. qPCR analysis of relative mRNA expression levels of glutamine synthesis pathway associated genes was determined in H, and Il6 mRNA level was checked in I. (J and K) NFs were treated with TCM in the presence of TLR2 inhibitor for 24 h at indicated concentrations. qPCR analysis of relative mRNA expression levels of glutamine synthesis pathway-associated genes was determined in J, and Il6 mRNA level was checked in K. (L) Proportion of Detox-iCAF signature (from Kieffer et al. [2020]) deconvoluted on bulk RNA-seq data on NFs treated with TCM or TCM w/o lipid for 24 h. (M) STAT3 transcription factor activity inference analysis performed on scRNA-seq data from CAFs of breast cancer patients. Data are representative of at least two independent experiments with similar result. All data are shown as mean ± SEM and were analyzed by two-tailed, unpaired Student’s t test (A–C), two-way ANOVA with Sidak’s multiple comparison test (D and H–K), one-way ANOVA with Tukey’s multiple comparison test (F–G), or two-tailed unpaired Student’s t test (L). ****P < 0.0001; ***P < 0.001; **P < 0.01; *P < 0.05; P > 0.05 not significant (ns). MEF CM, MEF-conditioned medium. Source data are available for this figure: SourceData FS5.
Tumor-derived lipids induce an IL-6/STAT3 autocrine pathway to promote glutamine synthesis in NFs. (A) qPCR analysis of relative mRNA expression levels of iCAF signature genes in NFs treated with TCM or MEF CM for 24 h. (B and C) Western blot of STAT3 in NFs treated with TCM with or without anti–IL-6 neutralization antibody for 24 h (B). Quantification calculated by ImageJ (C). (D) qPCR analysis of relative mRNA expression levels of glutamine synthesis pathway associated genes in NFs treated with TCM derived from ER+ breast cancer EO771 cells with or without IL-6–blocking antibody for 24 h. (E) Multiplex cytokine array was used to detect IL-6 levels in TCM as compared with the control medium. Positive control was the supernatant collected from NFs after TCM treatment for 24 h. (F and G) NFs were treated with TCM or TCM w/o lipid or TCM w/o lipid supplemented with palmitate conjugated with BSA (200 μM) for 24 h. BSA alone was used as a control. qPCR analysis of expression of glutamine synthesis pathway genes (Got1, Got2, and Bcat2) (F) and ELISA measurements of IL-6 (G). (H and I) NFs were treated with TCM in the presence of anti-CD36 antibody for 24 h at indicated concentrations. qPCR analysis of relative mRNA expression levels of glutamine synthesis pathway associated genes was determined in H, and Il6 mRNA level was checked in I. (J and K) NFs were treated with TCM in the presence of TLR2 inhibitor for 24 h at indicated concentrations. qPCR analysis of relative mRNA expression levels of glutamine synthesis pathway-associated genes was determined in J, and Il6 mRNA level was checked in K. (L) Proportion of Detox-iCAF signature (from Kieffer et al. [2020]) deconvoluted on bulk RNA-seq data on NFs treated with TCM or TCM w/o lipid for 24 h. (M) STAT3 transcription factor activity inference analysis performed on scRNA-seq data from CAFs of breast cancer patients. Data are representative of at least two independent experiments with similar result. All data are shown as mean ± SEM and were analyzed by two-tailed, unpaired Student’s t test (A–C), two-way ANOVA with Sidak’s multiple comparison test (D and H–K), one-way ANOVA with Tukey’s multiple comparison test (F–G), or two-tailed unpaired Student’s t test (L). ****P < 0.0001; ***P < 0.001; **P < 0.01; *P < 0.05; P > 0.05 not significant (ns). MEF CM, MEF-conditioned medium. Source data are available for this figure: SourceData FS5.
We next postulated that the activation of IL-6–STAT3 signal axis in response to the exposure of TCM may be a key process to induce glutamine synthesis since IL-6 has been shown to play important roles in modulating fibroblast phenotype (O’Reilly et al., 2014). In support of this, we confirmed that TCM stimulation induced STAT3 phosphorylation in NFs (Fig. 2 H). In addition, the presence of neutralizing anti–IL-6 antibody reduced TCM-stimulated STAT3 phosphorylation (Fig. S5, B and C). Importantly, we found that neutralizing anti–IL-6 antibody significantly impaired the TCM-induced expression of genes related to glutamine synthesis in fibroblasts (Fig. 2 I), which we also confirmed using TCM derived from the breast cancer cell line EO771 (Fig. S5 D). These results indicate that the exposure of TCM can induce IL-6–dependent STAT3 activation to promote glutamine synthesis pathway in fibroblasts. However, IL-6 was hardly detected in the TCM as we reported before (Di Conza et al., 2021) (Fig. S5 E). Surprisingly, we found that NFs could produce low amounts of IL-6, but the IL-6 concentration was increased in cultures when NFs were treated with TCM (Fig. 2 J), suggesting that TCM stimulation drive autocrine IL-6 signaling, reprogramming functionality, and metabolic activities in fibroblasts. Knockout of STAT3 did reduce the GS upregulation in response to TCM (Fig. 2 K), suggesting that STAT3 signaling contributes to the TCM-induced GS expression; however, since neutralization of IL-6 only partially reverted the TCM-induced STAT3 activation (Fig. S5, B and C), we can suspect that other signaling pathways contribute to the IL-6–driven glutamine synthesis pathway (Biffi et al., 2019). Altogether, our results indicate that TCM promotes glutamine synthesis in fibroblasts by stimulating an IL-6 autocrine pathway.
Tumor cells boost IL-6–driven glutamine synthesis in fibroblasts by activating the Syk–NF-κB pathway
We next explored the signal pathways driving IL-6 production in fibroblasts in response to TCM stimulation. By performing a kinome assay, we found that the kinase activity of Syk was robustly elevated upon TCM treatment (Fig. 3 A). To examine whether Syk activation is required for the TCM-induced functional and metabolic reprogramming in fibroblasts, we treated NFs with TCM plus either control vehicle or Syk inhibitor R406 (Braselmann et al., 2006). The presence of R406 effectively diminished TCM-induced expression of GS in fibroblasts (Fig. 3 B). Moreover, TCM-induced IL-6 expression in fibroblasts was significantly reduced in the presence of R406 (Fig. 3 C), indicating that Syk activation is critical for the TCM-induced IL-6 and metabolic reprogramming. We then sought to elucidate how Syk modulates IL-6 production in fibroblasts. Given that Syk is reported to activate NF-κB signaling pathway (Lee et al., 2009) and the activation of NF-κB has been shown to drive iCAF transcriptional program (Biffi et al., 2019), we speculated that TCM exposure can drive IL-6 production and functional alterations in fibroblasts via a Syk–NF-κB signal axis. To test this, we pre-incubated fibroblasts with either control vehicle or pyrrolidine dithiocarbamate (PDTC) (Lee et al., 2009), a NF-κB inhibitor for 30 min and then TCM for another 24 h. Our results showed that PDTC pre-treatment efficiently blocked TCM-induced GS (Fig. 3 D) as well as IL-6 production (Fig. 3 E). Finally, we partially knocked out Syk or NF-κB p65 in immortalized NFs, which likewise reduced glutamine synthesis pathway and Il-6 expression (Fig. 3, F and G). Taken together, these data indicate that TCM exposure activates the Syk–NF-κB signaling axis, resulting in IL-6 production necessary for metabolic reprogramming of fibroblasts.

Tumor cells boost IL-6–driven glutamine synthesis in fibroblasts by activating Syk/NF-κB pathway. (A) Kinome assay of NFs treated with or without TCM for 3 h (n = 4 for each group). Median final score is plotted against mean kinase statistic, which represents normalized kinase statistics (>0 indicates higher activity in TCM group). (B and C) NFs were treated with TCM in the presence of Syk inhibitor R406 for 24 h. qPCR analysis of relative mRNA expression levels of GS (B) and Il6 (C). (D and E) NFs were pretreated with NF-κB inhibitor PDTC for 30 min and then were treated with TCM for 24 h. qPCR analysis of relative mRNA expression levels of GS (D) and Il6 (E). (F and G) qPCR analysis of relative mRNA expression levels of glutamine synthesis pathway genes (F) or Il6 (G) in NFs with Syk or NFkB p65 knockdown treated with TCM for 24 h. Data in A were analyzed using paired t test with a false discovery rate (FDR) correction applied for multiple comparisons at a threshold of 0.1. Data are representative of at least two independent experiments with similar results (B–E and G) or cumulative results from at least two independent experiments (F and G). All data are shown as mean ± SEM and were analyzed by two-way ANOVA with Sidak’s multiple comparison test (B–G). ****P < 0.0001; ***P < 0.001; **P < 0.01; *P < 0.05; P > 0.05 not significant (ns).
Tumor cells boost IL-6–driven glutamine synthesis in fibroblasts by activating Syk/NF-κB pathway. (A) Kinome assay of NFs treated with or without TCM for 3 h (n = 4 for each group). Median final score is plotted against mean kinase statistic, which represents normalized kinase statistics (>0 indicates higher activity in TCM group). (B and C) NFs were treated with TCM in the presence of Syk inhibitor R406 for 24 h. qPCR analysis of relative mRNA expression levels of GS (B) and Il6 (C). (D and E) NFs were pretreated with NF-κB inhibitor PDTC for 30 min and then were treated with TCM for 24 h. qPCR analysis of relative mRNA expression levels of GS (D) and Il6 (E). (F and G) qPCR analysis of relative mRNA expression levels of glutamine synthesis pathway genes (F) or Il6 (G) in NFs with Syk or NFkB p65 knockdown treated with TCM for 24 h. Data in A were analyzed using paired t test with a false discovery rate (FDR) correction applied for multiple comparisons at a threshold of 0.1. Data are representative of at least two independent experiments with similar results (B–E and G) or cumulative results from at least two independent experiments (F and G). All data are shown as mean ± SEM and were analyzed by two-way ANOVA with Sidak’s multiple comparison test (B–G). ****P < 0.0001; ***P < 0.001; **P < 0.01; *P < 0.05; P > 0.05 not significant (ns).
Palmitic acid-TLR4 signal drives autocrine IL-6 signaling and iCAFs formation
Recent literature suggested that the TME imposes metabolic stress, including hypoxia, the accumulation of lipids, and deprivation of nutrients (Møller et al., 2022; Ho et al., 2015; Li et al., 2019). We thus hypothesized that metabolic stress could lead to metabolic reprogramming of CAFs. Since our results show that TCM treatment can promote fibroblast polarization to gain an iCAF-like transcription signature, we postulated that the different metabolic profiles of iCAFs and myCAFs may arise from different metabolic adaptations caused by tumor-imposed metabolic stress. By analyzing published scRNA-seq data from various human cancers, including lung cancer, prostate cancer, and intrahepatic cholangiocarcinomas (ICC) (Luo et al., 2022), we observed that iCAFs robustly upregulated gene sets involved in lipid metabolism pathways compared with myCAFs (Fig. 4 A), indicating that tumor cells may impose lipids or lipid-related stresses to CAFs that leads to iCAF formation by promoting metabolic reprogramming. To test this, we deprived fatty acids and cholesterol in YUMM1.7 TCM (referred to TCM w/o lipid) by a lipid removal reagent as reported previously (Di Conza et al., 2021). Next, we treated NFs with YUMM1.7 TCM with or without lipids and examined their transcriptomes by RNA-seq. Strikingly, fibroblasts treated with TCM w/o lipid displayed distinct transcriptomes compared with fibroblasts treated with YUMM1.7 TCM (Fig. 4 B). Of note, fibroblasts treated with lipid-containing TCM enriched gene sets linked with iCAF and IL-6–STAT3 signal pathway compared with fibroblasts treated with lipid-deprived TCM (Fig. 4, C and D). Moreover, we found that fibroblasts treated with lipid-deprived TCM reduced the expression of genes involved in glutamine synthesis pathway compared with fibroblasts exposed to lipid-containing TCM (Fig. 4 E). Similarly, IL-6 production was declined in fibroblasts treated with lipid-deprived TCM (Fig. 4 F). These results suggest that TCM can drive functional and metabolic reprogramming, including iCAF formation, IL-6, and increased glutamine synthesis pathway, in fibroblasts in a lipid-dependent manner.

PA-TLR4 signal drives IL-6 autocrine and iCAFs formation. (A) Bubble plots indicating lipid-related metabolism in myCAF and iCAF. (B) Bulk RNA-seq of NFs treated with TCM or TCM w/o. lipid. (n = 3 for each group) shown as principal component analysis (PCA) plot. (C and D) GSEA for iCAF signature (C) or IL-6/JAK/STAT3 signaling pathway (D) in NFs treated with TCM versus control. Significant NES > 1; q value <0.05. (E) qPCR analysis of expression of genes associated with glutamine synthesis pathway in NFs treated with TCM or TCM without lipid (TCM w/o lipid) for 24 h. (F) ELISA of IL-6 protein expression level. (G) Palmitate level quantified in medium conditioned by MEFs or Yumm1.7 tumor cells for 24 h. (H and I) NFs were treated with palmitate conjugated with BSA (200 μM) for 24 h. BSA alone was used as a control. qPCR analysis of expression of genes associated with glutamine synthesis pathway (H) and ELISA of IL-6 protein (I). (J) Transcription factor activity prediction from bulk RNA-seq data. (K) IL-6 protein level in supernatants from NFs treated with palmitate conjugated with BSA (200 μM) in the presence of NF-κB inhibitor PDTC for 24 h. BSA alone was used as a control. (K and L) NFs were treated with TCM or TCM w/o lipid or TCM w/o lipid supplemented with palmitate conjugated with BSA (200 μM) for 24 h. BSA alone was used as a control. qPCR analysis of expression of glutamine synthase (GS). Data are representative of at least two independent experiments with similar results (E, F, H, I, K, and L). All data are shown as mean ± SEM and were analyzed by one-way ANOVA with Tukey’s multiple comparison test (E, F, K, and L) or two-tailed, unpaired Student’s t test (G–I). ****P < 0.0001; ***P < 0.001; **P < 0.01; *P < 0.05; P > 0.05 not significant (ns).
PA-TLR4 signal drives IL-6 autocrine and iCAFs formation. (A) Bubble plots indicating lipid-related metabolism in myCAF and iCAF. (B) Bulk RNA-seq of NFs treated with TCM or TCM w/o. lipid. (n = 3 for each group) shown as principal component analysis (PCA) plot. (C and D) GSEA for iCAF signature (C) or IL-6/JAK/STAT3 signaling pathway (D) in NFs treated with TCM versus control. Significant NES > 1; q value <0.05. (E) qPCR analysis of expression of genes associated with glutamine synthesis pathway in NFs treated with TCM or TCM without lipid (TCM w/o lipid) for 24 h. (F) ELISA of IL-6 protein expression level. (G) Palmitate level quantified in medium conditioned by MEFs or Yumm1.7 tumor cells for 24 h. (H and I) NFs were treated with palmitate conjugated with BSA (200 μM) for 24 h. BSA alone was used as a control. qPCR analysis of expression of genes associated with glutamine synthesis pathway (H) and ELISA of IL-6 protein (I). (J) Transcription factor activity prediction from bulk RNA-seq data. (K) IL-6 protein level in supernatants from NFs treated with palmitate conjugated with BSA (200 μM) in the presence of NF-κB inhibitor PDTC for 24 h. BSA alone was used as a control. (K and L) NFs were treated with TCM or TCM w/o lipid or TCM w/o lipid supplemented with palmitate conjugated with BSA (200 μM) for 24 h. BSA alone was used as a control. qPCR analysis of expression of glutamine synthase (GS). Data are representative of at least two independent experiments with similar results (E, F, H, I, K, and L). All data are shown as mean ± SEM and were analyzed by one-way ANOVA with Tukey’s multiple comparison test (E, F, K, and L) or two-tailed, unpaired Student’s t test (G–I). ****P < 0.0001; ***P < 0.001; **P < 0.01; *P < 0.05; P > 0.05 not significant (ns).
Given that palmitic acid (PA) is one of the most abundant fatty acids in TIF (Xu et al., 2021; Altea-Manzano et al., 2023) and can suppress anti-tumor responses in multiple immune cells (Prendeville and Lynch, 2022; Michelet et al., 2018), we measured the palmitate levels in TCM compared with MEF-conditioned medium and found that it was significantly enriched in TCM (Fig. 4 G). We therefore tested if PA can promote glutamine synthesis pathway in fibroblasts. NFs were treated with either BSA as a control vehicle or BSA-conjugated PAs for 24 h. PA treatment increased the expression of genes involved in glutamine synthesis pathway and IL-6 production in fibroblasts compared with BSA-treated group (Fig. 4, H and I). Evaluating transcription factor activity from bulk RNA-seq data, we found that removing lipids from TCM also reduced the TCM-induced transcription factor activity of NF-κB and STAT3 (Fig. 4 J), suggesting that lipids are required for TCM-induced NF-κB (IL-6 expression) and STAT3 (IL-6 sensing), supporting autocrine IL-6 signaling. Of note, we found that the presence of NF-κB inhibitor, PDTC, reduced PA-induced IL-6 production (Fig. 4 K), indicating that PAs can reprogram functionality of fibroblasts by activating NF-κB pathway. Next, we explored whether supplementation of PAs was sufficient to restore the expression of genes related to glutamine synthesis pathway and IL-6 production in fibroblasts treated with lipid-deprived YUMM1.7 TCM. Indeed, the supplementation of PAs rescued the expression of genes involved in glutamine synthesis pathway and IL-6 production in fibroblasts treated with YUMM1.7 TCM w/o lipid (Fig. 4 L; and Fig. S5, F and G). Taken together, our findings suggest that PAs can be one of the major components released by tumor cells that control IL-6 production and glutamine synthesis activity in fibroblasts.
We next aimed to identify the sensor of PAs in fibroblasts. Since CD36, a lipid transporter for medium- and long-chained fatty acids and oxidized lipoproteins, has been reported to be highly expressed in numerous stromal cells in tumors, including fibroblasts, TAMs, regulatory T cells, and CD8+ T cells (Liao et al., 2022), we examined whether blocking CD36-mediated lipid uptake could abolish TCM-induced IL-6 production and GS mRNA expression. However, treatment with a neutralizing anti-CD36 monoclonal antibody to block lipid uptake failed to prevent TCM-triggered IL-6 and GS mRNA expression (Fig. S5, H and I). Intriguingly, PAs have been reported to be recognized by TLR2 and TLR4 (Miura et al., 2013; Sokolova et al., 2017), and TLR2/4 can activate the Syk–NF-κB signal axis (Miller et al., 2012; Dennehy et al., 2008). We therefore examined the contribution of TLR2 and TLR4 to sensing tumor cell–derived fibroblast reprogramming factors. Treatment of a TLR2 inhibitor failed to suppress elevated IL-6 and GS mRNA expression in fibroblasts treated with YUMM1.7 TCM (Fig. S5, J and K). However, we found that the TCM treatment significantly increased TLR4 expression in fibroblasts (Fig. 5 A), and TCM induced less IL-6 production in TLR4-deficient fibroblasts (TLR4KO) compared with WT fibroblasts (Fig. 5 B). In line with this, TCM treatment induced NF-κB activation in WT fibroblasts, but not in TLR4-deficient fibroblasts (Fig. 5 C). Moreover, we found that BSA-conjugated PA was less capable of stimulating IL-6 production (Fig. 5 D) as well as activating NF-κB (Fig. 5 E) in TLR4-deficient fibroblasts compared with WT fibroblasts. Altogether, our results identify tumor-derived lipids, in particular PAs, as a factor that can promote autocrine IL-6 signaling through a TLR4-Syk-NF-κB signal axis, which results in functional and metabolic reprogramming in CAFs. These findings further highlight a metabolic symbiosis among CAFs, TAMs, and tumor cells, in which tumor cells facilitate TAM pro-tumorigenic polarization by pushing CAFs to feed TAMs with glutamine.
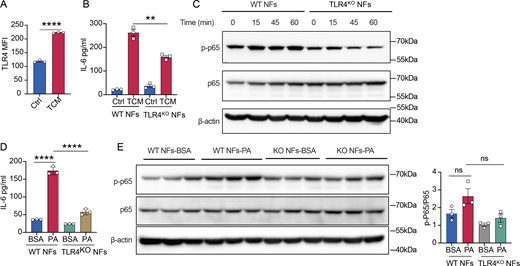
TCM regulated IL-6–mediated glutamine synthesis via TLR4/Syk/NF-κB pathway. (A) FACS analysis of TLR4 expression in NFs upon TCM treatment. (B) WT NFs or TLR4KO NFs were treated with TCM for 24 h. ELISA of IL-6 protein level was checked. (C) Western blots of NF-κB signal pathway activation in WT NFs or TLR4KO NFs upon TCM treatment at indicated different time points. (D) WT NFs or TLR4KO NFs were treated with palmitate conjugated with BSA (200 μM) for 24 h. BSA alone was used as a control. ELISA of IL-6 protein level was checked. (E) Western blots of NF-κB signal pathway activation in WT NFs or TLR4KO NFs upon palmitate treatment for 24 h (n = 3). Data are representative of at least two independent experiments with similar results (A–E). All data are shown as mean ± SEM and were analyzed by two-tailed, unpaired Student’s t test (A) or one-way ANOVA with Tukey’s multiple comparison test (B and D). ****P < 0.0001; ***P < 0.001, **P < 0.01; *P < 0.05; P > 0.05 not significant (ns). Source data are available for this figure: SourceData F5.
TCM regulated IL-6–mediated glutamine synthesis via TLR4/Syk/NF-κB pathway. (A) FACS analysis of TLR4 expression in NFs upon TCM treatment. (B) WT NFs or TLR4KO NFs were treated with TCM for 24 h. ELISA of IL-6 protein level was checked. (C) Western blots of NF-κB signal pathway activation in WT NFs or TLR4KO NFs upon TCM treatment at indicated different time points. (D) WT NFs or TLR4KO NFs were treated with palmitate conjugated with BSA (200 μM) for 24 h. BSA alone was used as a control. ELISA of IL-6 protein level was checked. (E) Western blots of NF-κB signal pathway activation in WT NFs or TLR4KO NFs upon palmitate treatment for 24 h (n = 3). Data are representative of at least two independent experiments with similar results (A–E). All data are shown as mean ± SEM and were analyzed by two-tailed, unpaired Student’s t test (A) or one-way ANOVA with Tukey’s multiple comparison test (B and D). ****P < 0.0001; ***P < 0.001, **P < 0.01; *P < 0.05; P > 0.05 not significant (ns). Source data are available for this figure: SourceData F5.
GS-expressing iCAF subsets co-localize with FOLR2+ macrophages in human breast cancer patients
To assess the human relevance of our findings, we looked into previously reported CAF clusters, embracing the CAF heterogeneity across cancer types (Lavie et al., 2022). We observed that GS was highly expressed in three iCAF clusters: the detoxification-associated iCAF cluster (Detox-iCAF), IFNγ-mediated response iCAF cluster (IFNγ-iCAF), and the IL-signaling pathway iCAF cluster (IL-iCAF) compared with the five myCAF clusters identified within FAP+ CAF population derived from breast cancer patients (Costa et al., 2018; Kieffer et al., 2020) (Fig. 6, A and B). Comparing the CAF subset gene signatures with our bulk RNA-seq data from TCM-treated NFs, we saw that untreated NFs comprise myCAF signatures (extracellular matrix-myCAF and TGFb-myCAF-like) without detectable iCAF signatures. This aligns with previous findings showing that 2D culture promote myCAF signature in NFs (Ohlund et al., 2017). However, TCM treatment significantly increased the proportion of Detox-iCAF in a lipid-dependent manner (Fig. S5 L). Interestingly, Detox-iCAF, as well as IL-iCAF and IFNγ-iCAF clusters, showed high expression of NF-κB transcription factor activity compared with myCAF clusters in the tumor (Fig. 6 C). Moreover, STAT3 activity was higher in the three iCAF clusters compared with myCAFs (Fig. S5 M), further supporting the mechanism delineated in our murine model. Lastly, we interrogated the correlation between iCAFs and TAMs in the tumor and found that Detox-iCAF and IFNγ-iCAF signatures correlate with FOLR2+ TAM signature in TCGA bulk RNA samples (Fig. 6 D). Using previously published Visium spatial transcriptomics data from 17 breast cancer samples (Croizer et al., 2024), we could moreover identify a co-localization between FOLR2+ TAMs and iCAFs in each section (Fig. 6 E), allowing for a metabolic crosstalk between GS-expressing CAFs and TAMs as shown in the murine model.

GS-expressing iCAF subsets co-localize with FOLR2 + macrophages in human breast cancer patients. (A) UMAP of 18,296 FAP+ CAFs from 7 breast cancer patients (Croizer et al., 2024) allowing for visualization of 8 CAF clusters, including 3 iCAFs clusters and 5 myCAF clusters. (B) UMAP showing GS gene expression in FAP+ CAF clusters. (C) Progeny pathway analysis in iCAF and myCAF subsets from scRNA-seq data. (D) Correlations of Detox-iCAF or IFNg-iCAF proportion and FOLR2+ macrophages in bulk RNA-seq data. (E) Correlation of number of Detox-iCAF or IFNg-iCAF and FOLR2+ macrophages per spot using spatial transcriptomics. P values from Pearson correlation test. (F) Graphical abstract demonstrating the hypothesis in this study on the triple cross talk between tumor cells, CAFs and macrophages.
GS-expressing iCAF subsets co-localize with FOLR2 + macrophages in human breast cancer patients. (A) UMAP of 18,296 FAP+ CAFs from 7 breast cancer patients (Croizer et al., 2024) allowing for visualization of 8 CAF clusters, including 3 iCAFs clusters and 5 myCAF clusters. (B) UMAP showing GS gene expression in FAP+ CAF clusters. (C) Progeny pathway analysis in iCAF and myCAF subsets from scRNA-seq data. (D) Correlations of Detox-iCAF or IFNg-iCAF proportion and FOLR2+ macrophages in bulk RNA-seq data. (E) Correlation of number of Detox-iCAF or IFNg-iCAF and FOLR2+ macrophages per spot using spatial transcriptomics. P values from Pearson correlation test. (F) Graphical abstract demonstrating the hypothesis in this study on the triple cross talk between tumor cells, CAFs and macrophages.
Collectively, these data support our mechanistic findings in murine fibroblasts, suggesting that tumor-derived lipids induce iCAF signatures, including NF-κB and STAT3 activity, as well as GS expression (Fig. 6 F). These iCAFs co-localize with TAMs, indicating that a tumor-iCAF-TAM metabolic crosstalk takes place in human BC patients as well. However, we have yet to explore if this is a preserved mechanism across tumor types.
Discussion
The TME is a dynamic milieu characterized by intricate cellular interactions and metabolic adaptations that influence tumor progression and immune evasion. Here, we revealed a previously unrecognized metabolic symbiosis among tumor cells, CAFs, and TAMs, wherein lipids regulate glutamine synthesis, which emerged as a key mediator of immunosuppression and tumor progression. This metabolic axis underscores the critical role of glutamine synthesis in CAFs in shaping the phenotype of TAMs and promoting tumor growth. Furthermore, our study elucidated the molecular mechanisms underlying the metabolic reprogramming of fibroblasts toward an iCAF phenotype in response to tumor cell–derived factors. Tumor cells induce IL-6 production and glutamine synthesis in fibroblasts by activating the Syk–NF-κB signaling axis. Notably, PA was identified as a key mediator driving autocrine IL-6 signaling and iCAF polarization through TLR4 signaling. Our findings not only reinforce our understanding of the molecular intricacies governing tumor progression but also provide novel insights into the reprogramming of the TME for therapeutic applications.
Previous studies have implicated CAFs in regulating macrophage recruitment and function, with a predominant focus on cytokines and chemokines. Moreover, cell–cell interactions in the TME have been evaluated by others using receptor-ligand expression patterns in the scRNA-seq level, which inferred that CAFs predominantly interact with TAMs (Mayer et al., 2023). However, the metabolic interplay between CAFs and TAMs, two pivotal stromal cell types within the TME, has been neglected and remained relatively unexplored until now, even though numerous studies have focused on the metabolic communication between tumor cells and CAFs or tumor cells and TAMs. Studies using glutaminase inhibitors, such as 6-diazo-5-oxo-L-norleucine (DON) and CB-839, have shown promise in suppressing tumor growth by targeting glutamine addiction in cancer cells and reeducating TAMs (Encarnación-Rosado et al., 2023; Oh et al., 2020). Interestingly, GS ablation in macrophages have shown to regulate metastasis but not primary tumor growth (Palmieri et al., 2017), which is in line with our findings that CAFs rather than macrophages support tumor growth by GS expression. Our study highlights that CAFs are highly proficient at synthesizing glutamine in the TME. In contrast to the focus on blocking glutamine utilization in cancer cells, inhibition of glutamine synthesis in CAFs emerges as a potential strategy to reprogram the immunosuppressive TME. Aligning with our findings, other research has underscored the crucial role of CAFs supplying tumor cells with glutamine to support their proliferation and survival. Combinational targeting of glutamine synthesis in CAFs and glutamine utilization in tumor cells remarkably abolished tumor progression in ovarian cancer (Yang et al., 2016), suggesting that CAF-derived glutamine also can be consumed by tumor cells—at least in the highly glutaminolytic cancer types such as ovarian cancer. In our model, however, GS expression by CAFs supported tumor growth in a TAM-dependent manner, suggesting that the metabolism of CAFs modulates the TME, supporting both tumor cells and surrounding immune cells depending on the tumor types. While our study provides novel insights into the metabolic interactions within the TME, the impact of CAF-mediated glutamine production on other immune cell populations, such as T cells and dendritic cells, remains unclear.
CAFs are highly heterogenous, and we found that the tumor-derived lipids could promote an iCAF signature with high production of IL-6. IL-6 is a pleiotropic cytokine upregulated in chronic inflammatory conditions such as cancer, yet IL-6 can also suppress immunity (Wu et al., 2025). Our findings suggest that autocrine IL-6 activates STAT3 activity in CAFs, which promote glutamine synthesis gene expression. Interestingly, ablation of IL-6 produced by CAFs has been shown to restore anti-tumor immunity in the TME and sensitivity to chemotherapies, which cannot be achieved by ablating IL-6 in other cellular sources (Kato et al., 2018; Cheteh et al., 2020). These findings highlight that IL-6 derived from CAFs in particular, supports tumor growth, and our findings suggest that IL-6 could support the tumor growth by driving metabolic CAF differentiation with increased glutamine synthesis pathway. This was further supported by our findings that iCAFs from human breast cancer express higher GS pathway compared with myCAFs. IL-6 moreover promotes pro-tumorigenic TAMs, which can further increase IL-6 production by TAMs, indicating that the CAF–TAM interaction can result in a viscous cycle supporting pro-tumorigenic phenotypes. Taken together, our data expand on the complexity of IL-6 signaling, proposing that IL-6 is a metabolic regulator of CAFs.
Our work highlights the therapeutic potential of targeting metabolic dependencies in stromal cells, particularly CAFs, as a promising avenue for future research. Strategies aimed at disrupting the communication network between tumor cells, CAFs, and TAMs could enhance anti-tumor immunity and improve cancer treatment outcomes. Moreover, our study raises the possibility that lipids, which accumulate in the TME, may be key drivers of metabolic crosstalk that shapes the immunosuppressive microenvironment. Lipid metabolism has been shown to drastically impact tumor development and progression (Li et al., 2023). Moreover, it was reported that enriched lipids in TME has suppressive effects on immune cell functions (Di Conza et al., 2021; Wang et al., 2020; Manzo et al., 2020; Xu et al., 2021; Ma et al., 2021). It has, for example, been shown that PA, a saturated fatty acid, can promote the production of IL-6, TNF-α, and IL-1β in macrophages, inducing an inflammatory response (Riera-Borrull et al., 2017). However, it has not been elucidated whether lipids have effects on CAFs. Interestingly, we found that tumor cell–derived PA modulates glutamine synthesis ability and functional alterations in fibroblasts. Our study suggests that PA acts on fibroblasts through a TLR4-mediated signal cascade. Despite that PA is generally believed to be a TLR agonist (Hotamisligil, 2017), a recent study has suggested that PA does not function as a TLR4 agonist, but TLR4-dependent priming is required for PA-mediated inflammatory response (Lancaster et al., 2018). A similar TLR4-dependent priming may be required for CAF polarization in response to TCM. In addition, there is growing evidence indicating fatty acid synthase (FASN) is overexpressed in different cancer types. FASN is a key enzyme mediating the synthesis of long-chain fatty acid, including palmitate. Inhibition of FASN strongly suppressed the tumor growth of melanoma (Carvalho et al., 2008) and breast cancer (Menendez et al., 2005). Thus, delineating the relationship between fatty acid metabolism in tumor cells and functional specialization of CAFs may lead to classification of distinct tumor subtypes that are sensitive to immunotherapies combined with inhibitors targeting lipid and glutamine metabolism. Moreover, this mechanism might be tumor-type specific, since glutamine metabolism can vary by tumor type. Further studies are therefore required to identify reliable biomarkers for targeting glutamine synthesis pathway.
In conclusion, our study sheds light on the intricate metabolic interactions within the TME and their profound impact on tumor immune evasion and progression. Moreover, our findings unveil the molecular processes guiding functional and metabolic reprogramming in CAFs that in turn support tumor progression and the establishment of an immunosuppressive TME. By uncovering these metabolic axes and signaling pathways, we provide a foundation for the development of innovative therapeutic strategies targeting the metabolic vulnerabilities of stromal cells to enhance anti-tumor immune responses and combat cancer progression.
Materials and methods
Mice
C57BL/6/J, FSP1-Cre (B6.C-Tg(S100a4-cre)1Egn/JhrsJ), LysM-Cre (B6.129p2-Lyz2tm1(cre)lfo/J), and TLRKO (B6(Cg)-Tlr4 tm1.2Karp/J) mice were purchased from the Jackson Laboratory. GSflox/flox mice were kindly provided by Prof. Massimiliano Mazzone at VIB-KU Leuven Center for Cancer Biology (Leuven, Belgium). To generate fibroblast-specific GS-knockout mice, GSflox/flox mice were crossed with FSP1cre mice. To generate macrophage-specific GS-knockout mice, GSflox/flox mice were crossed with LysMcre mice. mT/mG mice were kindly provided by Prof. Tatiana Petrova at University of Lausanne (Lausanne, Switzerland). BRafCA; Tyr-CreER; Ptenlox4–5 (Braf/Pten) mice were obtained from M. Bonsenburg at Yale University (New Haven, CT, USA). All the mice are housed and maintained, five mice per cage, in the animal facility of the University of Lausanne (Lausanne, Switzerland). All mouse experiments were performed following Swiss federal regulations and procedures ethically approved by the Animal Ethics Committee of Vaud, Switzerland.
Human samples and reporting guidelines
Human tissue samples from colon cancer patients were obtained from Lausanne University Hospital (CHUV). The samples were obtained between 2015 and 2020 with informed consent and approved by institutional review board of CHUV for PRE-IT 2016-02094 (material collection) and TRP_0001 2017-00359 (research purposes). TIF and paired serum obtained from seven patients with pathologically confirmed liver cancer (Table S1) were collected and processed in Taiwan in the group of Ying-Chun Shen. The study (201805001RINB) has been approved by the National Taiwan University Hospital Research Ethics Committee.
Reagents
R406 was purchased from Selleckchem. Ammonium PDTC was purchased from Sigma-Aldrich. BSA-palmitate saturated fatty acid was purchased from Cayman.
Cell cultures
The YUMM1.7 melanoma cell line was kindly provided by M. Bosenberg Yale School of Medicine (New Haven, CT, USA) as described previously (Meeth et al., 2016) and the MEF were provided by F. Martinon at University of Lausanne (Lausanne, Switzerland). Yumm1.7 and MEF were cultured in DMEM (Life Technologies) supplemented with 10% FBS (Gibco) and 1% penicillin–streptomycin (P/S, 100 U/ml; Thermo Fisher Scientific). NFs and CAFs were maintained in DMEM containing 10% FBS and 1% P/S. Cells were maintained at 37°C in a humidified incubator of 5% CO2. As for the co-culture of BMDMs with NFs or CAFs, we used a Transwell (Corning Incorporated) system. BMDMs (8 × 10⁵) were seeded in the lower chamber of 12-well plates, then NFs or CAFs (5 × 10⁴) were placed in the top champers with a 0.4-μm pore size (Corning Incorporated) under glutamine-deficient condition: glutamine- and glucose-free DMEM supplemented with dialyzed FBS (small molecule-deficient FBS) and glucose, as we reported before (Liu et al., 2017). After 48 h of co-culture, BMDMs were collected, and their phenotypes were determined.
Differentiation of BMDMs
To generate BMDMs, tibia and femur bones were isolated from 6- to 8-wk-old C57BL/6 mice, and bone marrow was flushed using PBS and cultured in 10-cm dishes with DMEM supplemented with 10% FBS, 1% P/S, and 20% L929 conditioned media for 7 days. On day 7, differentiated BMDMs were harvested and replated with complete DMEM medium (without L929 cell culture supernatant) for further experiments.
Tumor induction and tumor engraftment and treatment
For tumor induction of Braf/Pten melanomas, 3-wk-old Braf/Pten mice were treated with 4-hydroxytamoxifen (#6278; Sigma-Aldrich) on the skin surface to induce tumor formation. For tumor engraftment, 1 × 10⁵ YUMM1.7 tumor cells were inoculated subcutaneously in 50 μl volume of PBS into the flanks of 4–6-wk-old mice. For the co-injection of Yumm1.7 tumor cells and CAFs, 5 × 10⁴ YUMM1.7 tumor cells were co-injected subcutaneously with either 1 × 10⁵ Ctrl CAFs or 1 × 10⁵ GSKO CAFs in 50 μl volume of PBS into the right or left flank on GSf/f FSP1cre mice, respectively. Tumor growth was measured using calipers every 2–3 days after visible tumor emerged. Two weeks later, the mice were sacrificed, and the volume and weight of tumors were analyzed. Tumor volume = length × width2/2. For depleting macrophages, mice were treated with anti-CSF1R antibodies (4 mg/ml, clone AFS98; BioXCell) every 2 days intraperitoneally starting at the day of tumor injection.
Tumor dissociation
To prepare the single-cell suspensions, tumor tissues were minced and suspended in RPMI with 2% FBS, DNaseI (1 μg/ml; Sigma-Aldrich), and collagenase (1 mg/ml; Sigma-Aldrich), enzymatically digested for 45 min at 37°C with agitation. After digestion, cells were filtered through a 70-μm cell strainer and centrifuged at 1,500 rpm for 5 min at 4°C. After centrifugation, cells were washed with RPMI with 2% FBS and isolated. For CAFs sorting, the cells were proceeded for FACS staining. As for TAMs phenotyping determination, leukocytes enrichment was performed by density gradient centrifugation (800 g, 30 min) at 25°C with 40% and 80% percoll (GE Healthcare). After centrifugation, cells were washed with RPMI with 2% FBS and isolated.
Isolation of NFs
Primary NFs were isolated from skin fragments of newborn mice. Briefly, the skin was collected and washed with PBS after removing the fat. To separate the epidermis from the dermis, the skin was incubated with dispase (2.5 mg/ml) overnight at 4°C. After this, the dermis was cut into small pieces and digested in 3% collagenase prepared with DMEM at 37°C for 1 h. Then the digested samples were passed through 0.70-µM cell strainer and centrifuged at 1,000 rpm for 5 min. The obtained NFs were cultured and maintained in DMEM supplemented with 10% FBS and 1% P/S.
Isolation of CAFs
CAFs were isolated from Yumm1.7-GFP tumor-bearing mT/mG mice. Upon tumor digestion as described in “Tumor dissociation,” cells were stained for PE-Cy7-anti-CD45 (clone S18009F, 1:400), APC-anti-CD31 (clone 390, 1:100), and APC-anti-EpCAM (clone G8.8, 1:100) prior to FACS sorting. CAFs were defined as tdTomato+CD45−CD31− EpCAM−GFP−. Cell sorting was performed using a FACSAria III Cell Sorter (BD Biosciences). Sorted cells were cultured and confirmed by expression of PDPN and platelet-derived growth factor receptor (PDGFRα).
Immortalization of CAFs
Primary CAFs were immortalized by retroviral infection using an hTERT (pBABE-neo-hTERT) and SV40 large T antigen (pBABE-neo largeTcDNA, Addgene) plasmid. Retrovirus containing the pBABE-neo largeTcDNA plasmid was produced in phenix cells. Viral transduction in fibroblasts was performed. Cells were selected using 200 μg/ml G418 on consecutive days.
CRISPR/Cas9-mediated knockout of GS
GS-specific sgRNA and control sgRNA (sequences are shown in Table S5) were annealed and subcloned into the pMSCV-Cas9-2A-BFP vector, respectively. Retrovirus was produced in phoenix cells. CAF cell lines were cultured until reaching ∼70% confluence, DMEM medium containing retroviral particles was added to the cells with 8 μg/ml polybrene. The medium was changed at 24 h after infection, and the percentage of BFP+ cells was checked to determine the infection efficiency at 48 h after infection. All experimental procedures related to lentivirus were performed under biosafety level 2.
TCM preparation
YUMM1.7 TCM was obtained by seeding 2 × 10⁶ YUMM1.7 cells on a 10-cm dish with DMEM supplemented with 10% FBS for 24 h. Then, culture supernatant was collected and passed through 0.22-μM filters to remove debris and used as TCM. To generate TCM without lipids, the collected TCM, as described above, was treated with Cleanascite reagent (Biotech Support Group) according to the manufacturer’s instructions.
TIF and serum collection
TIF was collected by an established centrifugation method immediately after extirpation as previously described (Geeraerts et al., 2021). Briefly, tumor tissues were washed in PBS and dried on gauze to remove excess liquid after harvesting. Then tumor tissues were cut for one to two times and transferred into an Eppendorf tube with a 0.22-μm nylon mesh layer placed on top of it by centrifugation at 106 g for 10 min. The flow-through was collected as TIF after removing the nylon mesh layer. The matched blood samples from tumor-bearing mice were collected from the caudal vein in sodium citrate–containing Eppendorf tubes. Serum was immediately obtained by centrifugation at 1,000 g for 15 min at 4°C. Both TIF and serum were stored at −80°C for determining glutamine levels.
Metabolomics analysis
Serum (20 μl) and TIF (5 μl) samples were completed to 50 μl with 0.1% formic acid in water and then extracted with 250 μl of methanol containing isotopically labeled internal standards (ISs). Sample extracts were vortexed and centrifuged (15 min, 2,700 g at 4°C), and the resulting supernatant was collected and analyzed by LC-MS. Samples with <5 μl or with blood contamination were excluded. Sample extracts were analyzed by HILIC-HRMS on a Vanquish Horizon (Thermo Fisher Scientific) ultra-high performance liquid chromatography system coupled to Q Exactive Focus interfaced with the a HESI source in positive mode (Teav et al., 2019). Chromatographic separation was carried out using an Acquity BEH amide (1.7 μm, 100 × 2.1-mm I.D.) column (Waters). The mobile phase was composed of A = 20 mM ammonium formate and 0.1% formic acid in water and B = 0.1% formic acid in ACN. The gradient elution started at 95% B (0–2 min) decreasing to 65% B (2–14 min), reaching 50% B at 16 min and was followed by an isocratic step (16–18 min) before a 4 min after run for column re-equilibration. The flow rate was 400 μl/min, column temperature 25°C, and the sample injection volume was 2 μl. HESI source conditions operating in positive mode were set as follows: sheath gas flow at 60, aux gas flow rate at 20, sweep gas flow rate at 2, spray voltage at +3 kV, capillary temperature at 300°C, s-lens RF level at 60, and aux gas heater temperature at 300°C. Full scan HRMS acquisition mode (m/z 50−750) was used with the following MS acquisition parameters: resolution at 70,000 FWHM, 1 microscan, 1e6 AGC, and 100 ms as maximum inject time. Data were processed using Xcalibur (version 4.1; Thermo Fischer Scientific). For absolute quantification, calibration curves and the stable isotope-labeled ISs were used to determine the response factor. Linearity of the standard curves was evaluated for each metabolite using a nine-point range; in addition, peak area integration was manually curated and corrected where necessary. Concentrations of the compounds for which the ISs were available were corrected for the ratio of MS response (peak area) between the analyte and the ISs to account for matrix effects.
Palmitate quantification
Yumm1.7 or MEF-conditioned medium was prepared as described above, snap frozen, and analyzed by LC-MS as follows. LC-MS grade water, isopropanol, ethanol, acetic acid, and ammonium acetate were purchased from Biosolve Chimie, Sigma-Aldrich, and Merck. The analytical standards were obtained from Sigma-Aldrich and deuterated ISs from Larodan AG.
Calibration solutions and IS mixtures
The IS mixture of FFAs was prepared in ethanol. The concentrations in the highest-level calibrator spanned from 50 to 250 µM. The subsequent 10 points of the calibration curve were prepared by serial dilutions of this highest calibrator using ethanol. The stock IS mixture was prepared in ethanol with concentrations ranging from 50 to 250 µM, depending on the molecular species. Stock IS mixture (containing eight deuterated fatty acids) was diluted 1/500 times with isopropanol prior to the sample spike.
Sample and calibration curve preparation
For absolute quantification of FFAs, 25 μl of each media was extracted by the addition of 125 μl of isopropanol spiked with IS. Samples were then vortexed and centrifuged for 15 min at 15°C and 21,000 g. The resulting supernatants were transferred to LC-MS vials for injection. 10-point calibration curves were generated following the same procedure.
Liquid chromatography—high resolution mass spectrometry (Orbitrap IQ-X tribrid)
A Vanquish Horizon ultra-high performance liquid chromatography system coupled with the Orbitrap IQ-X Tribrid mass spectrometer (Thermo Fisher Scientific) was used for the quantification of a free fatty acid panel. The chromatographic separation was carried out on a Zorbax Eclipse Plus C18 (1.8 μm, 100 × 2.1-mm I.D. column) (Agilent Technologies). Mobile phase was composed of A = 60:40 (vol/vol) acetonitrile:water with 10 mM ammonium acetate and 0.1% acetic acid and B = 88:10:2 isopropanol:acetonitrile:water with 10 mM ammonium acetate and 0.1% acetic acid. The linear gradient elution from 15% to 30% B was applied in 2 min, then from 30% to 48% B in 0.5 min, from 48% to 72% B in 6 min, and from 72% to 99% B in 3 min, followed by 0.5 min of isocratic conditions and 3 min re-equilibration to the initial chromatographic conditions. The flow rate was 600 μl/min, column temperature 60°C, and sample injection volume 2 μl.
HESI source conditions operating in positive mode were set as follows: sheath gas flow at 60, aux gas flow rate at 20, sweep gas flow rate at 1, spray voltage at −3kV, capillary temperature at 300°C, s-lens RF level at 35%, and aux gas heater temperature at 300°C. Full scan HRMS acquisition mode (m/z 180−500) was used with the following MS acquisition parameters: mass resolving power at 60,000 FWHM, 1 µscan, 1e5 AGC, and 118 ms as maximum inject time.
RNA extraction, RT-PCR, and qPCR
Total RNAs were extracted using TRIzol reagent (Life Technologies), and their concentrations were determined by NanoDrop (Life Technologies). Complementary DNA was converted from RNA using PrimeScript RT Master Mix (Takara Bio) according to the manufacturer’s instructions. qPCR reactions were prepared in a 384-well plate by adding cDNA, gene-specific primers (primers are listed in Table S5 ), and Master Mix (TB Green Premix Ex Taq; Takara Bio) total in a volume of 10 μl. Quantitative real-time PCR was performed on a LightCycler 480 Instrument II machine (Roche Life Science). Relative expression was normalized by the expression of the internal control gene β-actin in each sample, and fold change analysis was used to evaluate differences in gene expression. Primers are listed in the following Table S5.
Flow cytometry analysis
Isolated cells were resuspended in FACS buffer (PBS supplemented with 0.1% sodium azide and 0.5% FBS, pH 7.4) and incubated with anti-mouse CD16/32 antibodies (catalog no. 101320; BioLegend) at 4°C for 10 min to block Fc receptors before surface maker staining. After washing, 1 × 10⁶ cells were stained with antibodies against surface markers for 30 min on ice. And intracellular staining was performed by using Transcription Factor Fixation/Permeabilization Concentrate and Diluent (catalog no. 00-5521-00; Thermo Fisher Scientific) according to the manufacturer’s instructions. The antibodies used for staining were as follows: BV711–anti-CD45 (clone 104, 1:100), PB–anti-CD3ε (clone 17A2, 1:100), APC-Cy7–anti-Ly6G (clone 1A8, 1:100), PE-Cy7–anti-CD11b (clone M1/70, 1:300), Percp-Cy5.5–anti-Ly6C (clone HK1.4, 1:2000), PE-eFluo610–anti-F4/80 (clone BM8, 1:200), PE–anti-PD-L1 (clone 10F.9G2, 1:100), FITC–anti-MHCII (I-A/I-E) (clone M5/114–152, 1:300), APC-anti-Arg 1 (clone A1exF5, 1:200), or PE-anti-CD163 (clone TNKUPJ, 1:200) and Live/Dead-BV510 (1:1,000). Flow cytometry was performed by using LSRII flow cytometer (BD Biosciences). Data were analyzed by using FlowJo software v.8.0.1.
Immunofluorescence staining
Paraffin embedded tissues from five colon cancer patients (CHUV) were analyzed to measure the abundance of fibroblasts and macrophages and distance between each subset of macrophages. Tissues were deparaffinized, rehydrated, and antigen retrieved in the antigen-retrieval solution (10 mM Tris base, 1 mM EDTA solution, and 0.05% Tween 20, pH 9.0). Antigen retrieval was followed by the incubation with blocking buffer (10% normal goat serum and 0.3% Triton X-100 in PBS) for 1 h at RT. PDPN (LS-B2956-50; LS Bio) and GLUL (GS) (80636; Cell Signaling) diluted in blocking buffer were incubated overnight at 4°C. Secondary antibodies conjugated with Alexa Fluor 405 and Alexa Fluor 594 were incubated at RT for 2 h. Sections were further incubated with anti-CD68 Alexa Fluor 488–conjugated antibody (ab277276; Abcam) and anti-CD163 Alexa Fluor 647–conjugated antibody (ab218294; Abcam) for 2 h, and staining procedure was followed by mounting with ProLong Gold Antifade mounting solution (P36930; Invitrogen). Images were randomly acquired using LSM880 confocal microscope imaging system (ZEISS) and subjected for quantification of the abundance of cells. M2 macrophages were defined as CD68+CD163+ population and M1 macrophages were defined as CD68+CD163− population. For distance measurement between macrophages and GS+ CAFs, surfacing and distance transformation tool on the plug-in of Imaris 3D software (Bitplane) was used. Statistical significance was determined using GraphPad Prism 8.
Western blot
Cell pellets were lysed using ice-cold RIPA buffer (50 mM Tris-HCl, pH 7.4, 150 mM NaCl, 1% NP-40, 0.5% sodium deoxycholate, 0.1% SDS, and 2 mM EDTA) supplemented with protease inhibitor (Roche) and sodium orthovanadate (phosphatase inhibitor). After being incubated on ice for 30 min, lysates were centrifuged at 4°C for 15 min at maximum speed. The concentrations of exacted proteins were determined by BCA protein assay kit (catalog no. 23225; Thermo Fisher Scientific) according to the manufacturer’s instructions. Then equal amounts of protein lysates were mixed with SDS sample buffer and denatured at 95°C and further subjected to SDS–PAGE for immunoblotting assay. Labeled proteins were visualized with SuperSignal West Femto Maximum Sensitivity Substrate (catalog no. 34095; Thermo Fisher Scientific) or SuperSignal West Pico Chemiluminescent substrate (catalog no. 34080; Thermo Fisher Scientific) with a digital imager. The following primary antibodies were used: anti-GLUL (GS) Rabbit mAb (1:1,000, catalog no. 80636S; Cell Signaling Technology), anti-STAT3 Mouse mAb (1:1,000, catalog no. 9139S; Cell Signaling Technology), Phospho-STAT3 (Y705) mAb (1:1,000, catalog no. 9145S; Cell Signaling Technology), Phospho–NF-κB p65 (Ser536) Rabbit mAb (1:1,000, catalog no. 3033S; Cell Signaling Technology), NF-κB p65 antibody (1:1,000, catalog no. sc-8008; Santa Cruz Biotech), monoclonal anti–β-actin (1:5,000, catalog no. A2228, Sigma-Aldrich), anti-mouse IgG HRP (1:10,000, catalog no. G-21040; Thermo Fisher Scientific), and anti-Rabbit IgG HRP (1:10,000, catalog no. G-21234; Thermo Fisher Scientific). The quantification of protein expression level was performed by using ImageJ software.
GS activity detection
The activity of GS was assessed by its γ-glutamyl transferase reaction, specifically measuring the production of γ-glutamylhydroxamate synthesized from glutamine and hydroxylamine (Peng et al., 2016). Briefly, TAMs and CAFs were lysed in lysis buffer (50 mM imidazole-HCl, pH 6.8) through freeze/thaw lysis procedure. Then the supernatants were collected and added into the reaction. The quantity of generated γ-glutamyl monohydroxamate was determined by a stop reaction, and the absorbance of γ-glutamylhydroxamate in the sample supernatant was measured at 560 nm.
IL-6 secretion
IL-6 levels in supernatant after treatment were measured by using commercial IL-6 ELISA kit (catalog no. 431301; BioLegend) according to the manufacture’s instruction. IL-6 levels in TCM were assessed using the LEGENDplex murine Th Cytokine panel 12-plex kit, following the manufacturer’s instructions. Samples were acquired on LSRII and analyzed with the LEGENDplex software from BioLegend.
Kinome profiling assay
Kinome profiling assay was carried out to determine the kinase activities in lysates from NFs treated with TCM for 3 h compared with untreated NFs. Phosphorylation activity of kinases is quantified by detecting phosphorylation of 140 phosphorylatable or 4 control immobilized peptides with fluorescently labeled antibodies using the PamStation 12. Serine/threonine kinase and protein tyrosine kinase microarrays needed for the analysis were bought from PamGene International BV. Sample extraction, array blocking, sample incubation, detection, and readout were performed in accordance with the manufacturer’s instructions. Bionavigator software (PamGene International BV) was used to quantitate the images of phosphorylated arrays.
RNA-seq and computational analysis
Total RNA was isolated using the RNeasy Plus Micro Kit (Qiagen) according to the manufacturer’s protocols. RNA-seq was performed by Illumina NovaSeq 6000. TrimGalore was used to trim reads based on sequencing quality. Using the Mus musculus GRCm38(mm10) genome version as the reference genome, we performed read alignment using STAR (v.2.7.9a). The summarizeOverlaps function from the GenomicAlignments package in R was used to generate read counts, and the DESeq2 software was used to analyze the read counts for differential expression. The statistics to characterize differential expression were false discovery rate-adjusted P values after Benjamini–Hochberg adjustment. Significantly differentially expressed genes are those whose P value is <0.05 after accounting for false discovery rate. All the differentially expressed genes are used for principal component analysis. All the annotated genes were used for GSEA (Subramanian et al., 2005). Signature genes are listed in Table S6. NF-κB and STAT3 transcription factor activity estimation was performed on bulk RNA-seq data from NFs treated with TCM or TCM w/o lipid by using the decoupleR package in R. Briefly, the transcription factor activity run with univariate linear model method, which considered downstream gene expression as the outcome of transcription activity.
scRNA-seq data processing
Murine melanoma single-cell transcriptomic data were retrieved from the Single-Cell Expression Atlas (https://www.ebi.ac.uk/gxa/sc/experiments/E-EHCA-2/results). This data included a count table for gene expression and the metadata for individual cells. The Seurat package (Hao et al., 2024) was employed for data normalization and scaling. Cell type annotations were adopted from the original study (Davidson et al., 2020). The average expression level of genes involved in the glutamine anabolic pathway was calculated to evaluate the pathway activity across different cell populations. The Mann–Whitney test was used to identify statistically significant differences in pathway activity between cell populations.
Data analysis of human breast cancer samples
scRNA-seq data of the FAP+ CAFs (CAF-S1) population were retrieved from the publicly available Breast Cancer Single Cell data (Kieffer et al., 2020). Data were analyzed using the Seurat package (v5.2.1) to detect GS (Glul) expression in established CAF subsets. To investigate signaling pathway activity, progeny analysis was performed to infer pathway enrichment scores for NF-κB, JAK/STAT, WNT, and TGFb signaling in iCAF clusters. Transcription factor activity of STAT3 was inferred using the DoRothEA regulon resource in combination with the VIPER algorithm, applied to the CAF clusters within the scRNA-seq dataset.
To evaluate the correlation of Detox-iCAF and IFNg-iCAF signatures with FOLR2+ TAMs, BayesPrism algorithm (Chu et al., 2022) was used to deconvolute transcriptomic data from the TCGA BRCA cohort using breast cancer cell atlas.
Deconvolution of Visium data from 17 spatial transcriptomic breast cancer sections were analyzed using the cell2location package version 0.167 (Kleshchevnikov et al., 2022) to detect co-localization of iCAF subsets and FOLR2+ TAMs.
To compare murine with human transcriptomes, bulk RNA-seq data from murine NFs treated with TCM (as described above) were deconvoluted using the BayesPrism algorithm and FAP+ CAFs scRNA-seq (Kieffer et al., 2020) serving as reference. Murine RNA-seq raw count data were converted to human gene symbols using one-to-one orthologues, excluding undetected genes, followed by DESeq2 normalization.
For bulk RNA-seq deconvolution, mitochondrial and ribosomal protein-coding genes were excluded due to too high signal. MALAT1 and genes from chrX and chrY were removed following indications from BayesPrism’s authors. Deconvolution was performed on remaining protein-coding genes.
Statistics
The data throughout were analyzed by using GraphPad Prism software version 8.0. And the data were presented as mean ± SEM as indicated. The significant difference was assessed by the Student’s t test. One-way ANOVA was used for comparisons of multiple groups. P values <0.05 were considered as statistically significant.
Online supplemental material
Fig. S1 shows the metabolomics data of TIF relevant for Fig. 1. Fig. S2 shows the transcriptional and protein expression data of glutamine synthesis genes relevant for Fig. 1. Fig. S3 shows the co-localization of TAMs and CAFs, including GS knockout validation relevant for Fig. 1. Fig. S4 shows the TAM gating strategy and depletion validation relevant for Fig. 1. Fig. S5 shows the iCAF signature genes and IL-6 blocking relevant for Fig. 2, palmitate-regulated glutamine synthesis genes relevant for Fig. 4, and analysis of RNA-seq data relevant for Fig. 6. Table S1 contains the liver cancer information relevant for Fig. S1. Table S2 contains the metabolomics data relevant for Fig. S1 C. Table S3 contains the metabolomics data relevant for Fig. S1 A. Table S4 contains the metabolomics data relevant for Fig. S1 B. Table S5 contains the primer list. Table S6 contains the GSEA genes for iCAF mCAF signatures.
Data availability
The data underlying Fig. S1, A–C are available in the published article and its online supplemental material. The data underlying Fig. 1 C and Fig. S2, C and D are openly available in the Single-Cell Expression Atlas at https://www.ebi.ac.uk/gxa/sc/experiments/E-EHCA-2/results. The data underlying Fig. 2, E and F and Fig. 4, B–D have been made publically available under GSE297727. The data underlying Fig. 2 G, Fig. 4 A, and Fig. S3 A are openly available in TCGA. The data underlying Fig. S2 A are openly available as GSE40595 and GSE35602. These data were derived from sources in the public domain https://www.ncbi.nlm.nih.gov. The data underlying Fig. 6, A–D and Fig. S5 I are openly available in the publically available Breast Cancer Single Cell data from Kieffer et al. (2020). The data underlying Fig. 6 E are openly available in the publically available Croizer et al. (2024). The rest of the data are available from the corresponding authors upon reasonable request.
Acknowledgments
The authors thank all the patients. We also thank Sarah-Maria Fendt and Giusy Di Conza for scientific discussion and advice.
This work was supported by grants from the Swiss National Science Foundation (310030_215126, 310030L_208130, TMCG-3_213736, IZLCZ0_206083, and CRSII5_205930), the Cancer Research Institute (Lloyd J. Old STAR award), Helmut Horten Stifung, and Melanoma Research Alliance Established Investigator Award. The model graph was created with https://BioRender.com.
Author contributions: X. Li: conceptualization, data curation, formal analysis, investigation, methodology, project administration, resources, supervision, validation, visualization, and writing—original draft, review, and editing. S.H. Møller: conceptualization, formal analysis, investigation, methodology, project administration, validation, visualization, and writing—original draft, review, and editing. J. Park: data curation. Y.-M. Chuang: data curation, formal analysis, and software. P.-C. Hsueh: formal analysis, investigation, and methodology. T.-H. Chang: investigation. K.-C. Kao: conceptualization, formal analysis, investigation, and methodology. H. Gallart-Ayala: methodology. Y.-H. Wang: investigation. J.-J. Peng: investigation. A. Bevilacqua: conceptualization, formal analysis, and investigation. Y.-R. Yu: investigation. Z. Li: investigation. Y. Kieffer: formal analysis and visualization. D. Peigney: formal analysis. H. Croizer: formal analysis, software, and visualization. Y. Xu: investigation. A. Zippelius: supervision. I.C. Lopez-Mejia: investigation and visualization. L. Fajas: formal analysis and resources. F. Mechta-Grigoriou: formal analysis. J. Ivanisevic: formal analysis, methodology, and supervision. Z. Xiao: formal analysis. M.-C. Ho: investigation and resources. Y.-C. Shen: resources. P.-C. Ho: conceptualization, funding acquisition, investigation, supervision, and writing—original draft, review, and editing.

