


BRAF mutations drive initiation and progression of various tumors. While BRAF inhibitors are effective in BRAF-mutant melanoma patients, intrinsic or acquired resistance to these therapies is common. Here, we identify non–receptor-type protein tyrosine phosphatase 23 (PTPN23) as an alternative effective target in BRAF-mutant cancer cells. Silencing PTPN23 selectively kills BRAF-mutant melanoma cells but not those with wild-type BRAF. Mechanistically, PTPN23, a catalytically inactive phosphatase, intriguingly induces WNK3-mediated phosphorylation of phosphoinositide 3-kinase class II alpha (PI3KC2α) at serine 329, enhancing its catalytic activity. This activation promotes production of PI(3,4)P2 and subsequent AKT2 activation at endosomes to support cell survival. Genetic or pharmacological targeting of the PTPN23-PI3KC2α-AKT2 signaling axis, alone or in combination with BRAF inhibitors, effectively inhibits the growth of BRAF-mutant melanoma and other cancers in vitro and in vivo. We also demonstrate that melanocyte-specific knockout of PTPN23 significantly inhibits BRAFV600E-driven melanomagenesis. Altogether, our findings demonstrate that targeting PTPN23/PI3KC2α offers a new and viable therapeutic strategy for BRAF-mutant cancers.
Introduction
The biological and clinical significance of oncogenic BRAF mutations is well established in a variety of cancers, such as melanoma, colorectal cancer (CRC), papillary thyroid cancer, and non–small-cell lung cancer (Davies et al., 2002). As the most prevalent BRAF mutation, BRAFV600E leads to a 480-fold increase in kinase activity (Wan et al., 2004), thus activating the downstream MAPK signaling pathway and promoting the proliferation and survival of cancer cells (Dankner et al., 2018). Currently, targeted therapies using small-molecule inhibitors such as vemurafenib (Vemu), dabrafenib (Dabr), and encorafenib have shown remarkable clinical benefits in treating BRAF-mutant melanoma (Dickson et al., 2015; Falchook et al., 2012; Flaherty et al., 2009). Despite the proven effectiveness of BRAF inhibitors (BRAFi), they do not elicit a response in ∼20% of melanoma patients harboring BRAF V600 mutations (Flaherty et al., 2010; Long et al., 2017). Intrinsic resistance is also observed in a significant proportion of patients with BRAF-mutant cancers in other sites, such as about 95% of CRC patients and roughly 70% of individuals with non–small-cell lung cancer and thyroid cancer with BRAF mutations (Brose et al., 2016; Kopetz et al., 2015; Planchard et al., 2016). Furthermore, the therapeutic benefits of BRAFi are generally limited to a duration of ∼6 to 7 mo due to the acquired drug resistance (Hauschild et al., 2012; Long et al., 2014). The acquired resistance can be ascribed to the recovery of the RAS-RAF-MAPK pathway or activation of other compensatory pathways including receptor tyrosine kinase–PI3K–AKT signaling via various mechanisms (Nazarian et al., 2010). Therefore, there is an urgent need to identify new therapeutic vulnerabilities in BRAF-mutant cancers to tackle the challenge of intrinsic and acquired resistance to BRAFi for effective long-term treatment strategies.
The protein tyrosine kinases and protein tyrosine phosphatases (PTPs) play critical roles in the protein phosphorylation state and signal transduction. Intracellular non–receptor-type PTPs (PTPNs), the largest class I cysteine PTP family, are essential for the regulation of a variety of cellular processes both physiologically and pathologically (Alonso et al., 2004). Recent studies have highlighted the critical roles of some PTPN members in tumor development. For example, inhibition of PTPN1 and PTPN2 significantly inhibits tumor growth by directly influencing tumor growth or bolstering T cell antitumor immunity (Baumgartner et al., 2023; Liang et al., 2023; Manguso et al., 2017). PTPN11, also named SHP2, contributes to tumor progression by activating RAS-MAPK signaling pathways (Mainardi et al., 2018; Ruess et al., 2018). In addition, drugs that target PTPN2/PTPN1 and SHP2, either as monotherapies or combined with other agents, have entered the clinical trial phase (LaMarche et al., 2020; Taylor et al., 2023; Wong et al., 2018). These findings underscore the importance of the PTPN family in tumor growth and development and their therapeutic potential for cancer intervention. However, whether there are any other PTPN members that might promote the growth of BRAF-mutant cancer remains unclear.
In this study, we set out to identify new therapeutic vulnerabilities in BRAF-mutant cancers. We discovered that PTPN23, a member of the PTPN family with no catalytic activity against generic phosphosubstrates, is crucial for the survival of BRAF-mutant cancer cells. Our findings also revealed that PTPN23 induces the activation of the PI3KC2α-AKT signaling pathway to promote cell survival. Importantly, targeting the PTPN23-PI3KC2α-AKT axis, either through genetic manipulation or through pharmacological approaches, not only suppresses tumor growth but also enhances sensitivity to BRAFi in cancers with BRAF mutations. Overall, our study presents a new promising avenue for treating BRAF-mutant cancers.
Results
Identification of PTPN23 as an essential gene for the survival of BRAF-mutant melanoma cells
To identify new therapeutic targets for BRAF-mutant melanoma, we conducted a genetic screening in the BRAFV600E-YUMM1.7 murine melanoma cells stably expressing Cas9. The YUMM1.7-Cas9 cells were transduced with a CRISPR deletion library focusing on drug targets, kinases, and phosphatases (Morgens et al., 2017). After selection for 6 days, we cultured the infected tumor cells for 14 days and collected the genomic DNA for next-generation sequencing (Fig. 1 A). We analyzed the library representation to identify significantly depleted genes targeted by sgRNAs with a specific emphasis on phosphatases and identified Ptpn23 as the most differentially dependent gene among the PTPN family (Fig. 1 B). It was noted that PTPN23 also ranked highly among essential survival genes in the genome-scale CRISPR/Cas9-knockout (GeCKO) screening in the human melanoma cell line A375 with BRAFV600E mutation, but not the human stem cell line HUES62 (Shalem et al., 2014). To verify the critical role of PTPN23 in the growth of BRAF-mutant melanoma cells, we utilized short hairpin RNA (shRNA) to suppress Ptpn23 expression in both YUMM1.7 cells, which harbor BRAFV600E mutation, and B16 cells harboring wild-type BRAF (BRAF WT). The colony formation assays revealed significant inhibition of cell growth only in the YUMM1.7 cells but not B16 cells (Fig. S1, A and B), underscoring the specificity of PTPN23’s role in BRAF-mutant contexts. Moreover, we developed doxycycline (dox)-inducible Ptpn23-knockdown YUMM1.7 cells and subsequently implanted these cells subcutaneously into C57BL/6J mice. The induction of Ptpn23 knockdown via dox treatment resulted in a significant decrease in both tumor volume and weight, highlighting the critical role of PTPN23 in sustaining BRAF-mutant tumor growth in vivo (Fig. S1, C–E).
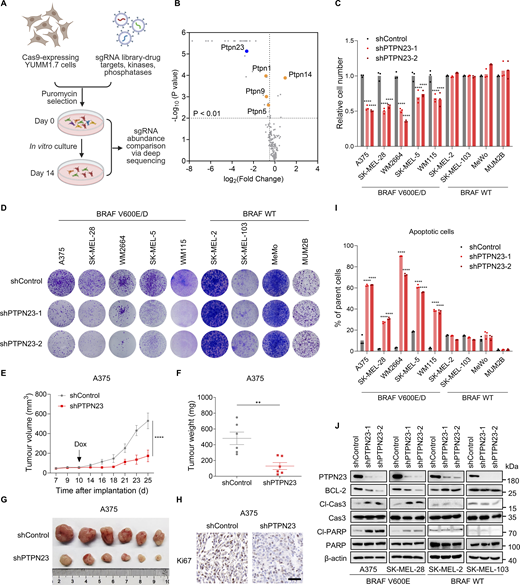
Identification of PTPN23 as an essential gene for the survival of BRAF-mutant melanoma cells. (A) Schematic representation of CRISPR screening to identify essential genes in BRAF-mutant YUMM1.7 melanoma cells. (B) Gene-level fold enrichment of sgRNAs targeting phosphatase genes (x axis) and one-sided P values (y axis). Dashed lines indicated significance (P < 0.01) and fold enrichment less than or equal to −0.5. Genes from the PTPN family were highlighted. (C) Relative cell number of BRAF-mutant and BRAF-WT melanoma cells transfected with control shRNA (shControl) or PTPN23-targeting shRNA (shPTPN23-1 and shPTPN23-2). Cell viability was measured by the CCK8 assay after 72 h (n = 3). Two-way ANOVA, Dunnett’s test. (D) Colony formation assay of melanoma cells stably expressing control shRNA (shControl) or PTPN23 shRNAs (shPTPN23-1 and shPTPN23-2). Colonies were stained with crystal violet after 14 days. (E and F) Tumor volume (E) and weight (F) of A375 xenografts in nude mice with dox-inducible PTPN23 or control shRNA. Mice were fed a dox-supplemented diet (400 ppm) starting 10 days after inoculation (n = 6 mice per group). Data represent the mean ± SEM. Two-way ANOVA, Bonferroni’s test (E) or unpaired t test (F). (G) Photograph of xenograft tumors from nude mice inoculated subcutaneously with indicated cells. (H) Ki67 staining showing the proliferation of A375 xenograft tumors with or without PTPN23 depletion. Scale bar, 50 μm. (I) Flow cytometric analysis of cell death in BRAF-mutant and BRAF-WT melanoma cells after PTPN23 depletion (n = 3). Two-way ANOVA, Dunnett’s test. (J) Immunoblot showing the expression levels of indicated proteins in A375, SK-MEL-28, SK-MEL-2, and SK-MEL-103 cells after PTPN23 depletion. ****P < 0.0001; **P < 0.01. Source data are available for this figure: SourceData F1.
Identification of PTPN23 as an essential gene for the survival of BRAF-mutant melanoma cells. (A) Schematic representation of CRISPR screening to identify essential genes in BRAF-mutant YUMM1.7 melanoma cells. (B) Gene-level fold enrichment of sgRNAs targeting phosphatase genes (x axis) and one-sided P values (y axis). Dashed lines indicated significance (P < 0.01) and fold enrichment less than or equal to −0.5. Genes from the PTPN family were highlighted. (C) Relative cell number of BRAF-mutant and BRAF-WT melanoma cells transfected with control shRNA (shControl) or PTPN23-targeting shRNA (shPTPN23-1 and shPTPN23-2). Cell viability was measured by the CCK8 assay after 72 h (n = 3). Two-way ANOVA, Dunnett’s test. (D) Colony formation assay of melanoma cells stably expressing control shRNA (shControl) or PTPN23 shRNAs (shPTPN23-1 and shPTPN23-2). Colonies were stained with crystal violet after 14 days. (E and F) Tumor volume (E) and weight (F) of A375 xenografts in nude mice with dox-inducible PTPN23 or control shRNA. Mice were fed a dox-supplemented diet (400 ppm) starting 10 days after inoculation (n = 6 mice per group). Data represent the mean ± SEM. Two-way ANOVA, Bonferroni’s test (E) or unpaired t test (F). (G) Photograph of xenograft tumors from nude mice inoculated subcutaneously with indicated cells. (H) Ki67 staining showing the proliferation of A375 xenograft tumors with or without PTPN23 depletion. Scale bar, 50 μm. (I) Flow cytometric analysis of cell death in BRAF-mutant and BRAF-WT melanoma cells after PTPN23 depletion (n = 3). Two-way ANOVA, Dunnett’s test. (J) Immunoblot showing the expression levels of indicated proteins in A375, SK-MEL-28, SK-MEL-2, and SK-MEL-103 cells after PTPN23 depletion. ****P < 0.0001; **P < 0.01. Source data are available for this figure: SourceData F1.
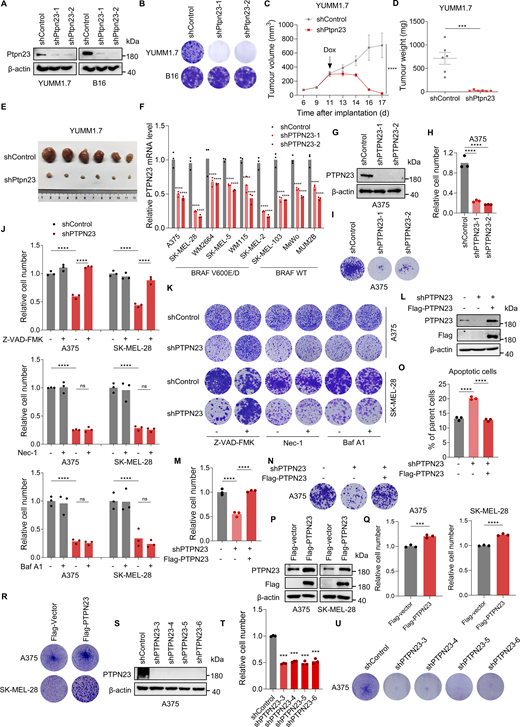
PTPN23 is essential for the survival of BRAF-mutant melanoma cells. (A) Immunoblot showing Ptpn23 protein levels in YUMM1.7 and B16 mouse melanoma cells. (B) Colony formation assay of YUMM1.7 and B16 cells with Ptpn23 knockdown. Colonies were stained with crystal violet after 14 days. (C and D) Volume (C) and weight (D) of YUMM1.7 tumors with dox-induced Ptpn23 depletion transplanted into C57BL/6 mice. Mice were treated with a dox-supplemented diet (400 ppm) per day starting 11 days after implantation (n = 6 mice per group). Data represent the mean ± SEM. Two-way ANOVA, Bonferroni’s test (C) or unpaired t test (D). (E) Representative images of YUMM1.7 tumors from the indicated groups (n = 6 mice per group). (F) RT–qPCR analysis of relative mRNA level following PTPN23 depletion (n = 3). Two-way ANOVA, Dunnett’s test. (G) Immunoblot confirming knockdown of PTPN23 induced by dox (2 μM) in dox-induced PTPN23-depleted A375 cells. (H) Relative cell number of dox-induced PTPN23-depleted A375 cells. Cell viability was measured by the CCK8 assay after 72 h (n = 3). One-way ANOVA, Dunnett’s test. (I) Colony formation assay of dox-induced PTPN23-depleted A375 cells. Colonies were stained with crystal violet after 14 days. (J) Relative cell number of dox-induced PTPN23-depleted A375 or SK-MEL-28 cells treated with Z-VAD-FMK (2 μM), Nec-1 (2 μM), or Baf A1 (2 nM). Cell viability was measured by the CCK8 assay after 72 h (n = 3). One-way ANOVA, Tukey’s test. (K) Colony formation assay of the indicated cells treated with Z-VAD-FMK (2 μM), Nec-1 (2 μM), or Baf A1 (2 nM). Colonies were stained with crystal violet after 14 days. (L) Immunoblot showing PTPN23 expression after PTPN23 depletion with or without exogenous Flag-PTPN23 overexpression. (M) Relative cell number of A375 cells after depletion of endogenous PTPN23 with or without the overexpression of exogenous Flag-PTPN23. Cell viability was measured by the CCK8 assay after 72 h (n = 3). One-way ANOVA, Tukey’s test. (N) Colony formation assay of the A375 cells depleted of endogenous PTPN23 with or without the overexpression of exogenous Flag-PTPN23. Colonies were stained with crystal violet after 14 days. (O) Flow cytometric analysis of cell death of A375 cells after depletion of endogenous PTPN23 with or without the overexpression of exogenous Flag-PTPN23 (n = 3). One-way ANOVA, Tukey’s test. (P) Immunoblot showing PTPN23 and Flag after Flag-vector or Flag-PTPN23 overexpression in A375 and SK-MEL-28 cells. (Q) Relative cell number of PTPN23-overexpressing A375 and SK-MEL-28 cells. Cell viability was measured by the CCK8 assay after 72 h (n = 3). Unpaired t test. (R) Colony formation assay of PTPN23-overexpressing A375 and SK-MEL-28 cells. Colonies were stained with crystal violet after 14 days. (S) Immunoblot showing knockdown of PTPN23 in A375 cells using four additional shRNA constructs. (T) Relative cell number of PTPN23-depleted A375 cells. Cell viability was measured by the CCK8 assay after 72 h (n = 3). One-way ANOVA, Dunnett’s test. (U) Colony formation assay of PTPN23-depleted A375 cells. Colonies were stained with crystal violet after 14 days. ****P < 0.0001; ***P < 0.001; P > 0.05; not significant (ns). Source data are available for this figure: SourceData FS1.
PTPN23 is essential for the survival of BRAF-mutant melanoma cells. (A) Immunoblot showing Ptpn23 protein levels in YUMM1.7 and B16 mouse melanoma cells. (B) Colony formation assay of YUMM1.7 and B16 cells with Ptpn23 knockdown. Colonies were stained with crystal violet after 14 days. (C and D) Volume (C) and weight (D) of YUMM1.7 tumors with dox-induced Ptpn23 depletion transplanted into C57BL/6 mice. Mice were treated with a dox-supplemented diet (400 ppm) per day starting 11 days after implantation (n = 6 mice per group). Data represent the mean ± SEM. Two-way ANOVA, Bonferroni’s test (C) or unpaired t test (D). (E) Representative images of YUMM1.7 tumors from the indicated groups (n = 6 mice per group). (F) RT–qPCR analysis of relative mRNA level following PTPN23 depletion (n = 3). Two-way ANOVA, Dunnett’s test. (G) Immunoblot confirming knockdown of PTPN23 induced by dox (2 μM) in dox-induced PTPN23-depleted A375 cells. (H) Relative cell number of dox-induced PTPN23-depleted A375 cells. Cell viability was measured by the CCK8 assay after 72 h (n = 3). One-way ANOVA, Dunnett’s test. (I) Colony formation assay of dox-induced PTPN23-depleted A375 cells. Colonies were stained with crystal violet after 14 days. (J) Relative cell number of dox-induced PTPN23-depleted A375 or SK-MEL-28 cells treated with Z-VAD-FMK (2 μM), Nec-1 (2 μM), or Baf A1 (2 nM). Cell viability was measured by the CCK8 assay after 72 h (n = 3). One-way ANOVA, Tukey’s test. (K) Colony formation assay of the indicated cells treated with Z-VAD-FMK (2 μM), Nec-1 (2 μM), or Baf A1 (2 nM). Colonies were stained with crystal violet after 14 days. (L) Immunoblot showing PTPN23 expression after PTPN23 depletion with or without exogenous Flag-PTPN23 overexpression. (M) Relative cell number of A375 cells after depletion of endogenous PTPN23 with or without the overexpression of exogenous Flag-PTPN23. Cell viability was measured by the CCK8 assay after 72 h (n = 3). One-way ANOVA, Tukey’s test. (N) Colony formation assay of the A375 cells depleted of endogenous PTPN23 with or without the overexpression of exogenous Flag-PTPN23. Colonies were stained with crystal violet after 14 days. (O) Flow cytometric analysis of cell death of A375 cells after depletion of endogenous PTPN23 with or without the overexpression of exogenous Flag-PTPN23 (n = 3). One-way ANOVA, Tukey’s test. (P) Immunoblot showing PTPN23 and Flag after Flag-vector or Flag-PTPN23 overexpression in A375 and SK-MEL-28 cells. (Q) Relative cell number of PTPN23-overexpressing A375 and SK-MEL-28 cells. Cell viability was measured by the CCK8 assay after 72 h (n = 3). Unpaired t test. (R) Colony formation assay of PTPN23-overexpressing A375 and SK-MEL-28 cells. Colonies were stained with crystal violet after 14 days. (S) Immunoblot showing knockdown of PTPN23 in A375 cells using four additional shRNA constructs. (T) Relative cell number of PTPN23-depleted A375 cells. Cell viability was measured by the CCK8 assay after 72 h (n = 3). One-way ANOVA, Dunnett’s test. (U) Colony formation assay of PTPN23-depleted A375 cells. Colonies were stained with crystal violet after 14 days. ****P < 0.0001; ***P < 0.001; P > 0.05; not significant (ns). Source data are available for this figure: SourceData FS1.
To further elucidate the role of PTPN23 in human melanoma, we assessed the impact of PTPN23 depletion on cell viability across a diverse panel of melanoma cell lines, including five melanoma cell lines harboring BRAF mutations (V600E or V600D: A375, SK-MEL-28, WM2664, SK-MEL-5, and WM115), three melanoma cell lines with BRAF WT (SK-MEL-2, SK-MEL-103, and MeWo), and one uveal melanoma cell line with BRAF WT (MUM2B). Our findings revealed that PTPN23 depletion markedly reduced the growth of all BRAF-mutant melanoma cell lines, while exerting minimal to no effect on those with BRAF WT (Fig. 1, C and D; and Fig. S1 F). We also constructed the dox-inducible PTPN23-knockdown A375 melanoma cells and confirmed that dox-induced PTPN23 silencing significantly inhibited the growth of A375 cells both in vitro and in xenograft tumors (Fig. 1, E–H and Fig. S1, G–I). To investigate whether PTPN23 is required for the survival of melanoma cells, we performed apoptosis assays by flow cytometry in melanoma cells with different BRAF mutation statuses. The results indicated that depleting PTPN23 significantly induced apoptosis in melanoma cells with BRAF mutations (Fig. 1 I). We also observed that PTPN23 depletion substantially induced cleavage of caspase-3 and PARP, and decreased BCL-2 protein levels in BRAF-mutant melanoma cells but not BRAF-WT melanoma cells (Fig. 1 J). To further determine that PTPN23 deficiency caused apoptosis in BRAF-mutant cancer cells, we treated dox-inducible PTPN23-knockdown A375 and SK-MEL-28 cells with Z-VAD-FMK (an apoptosis inhibitor), necrostatin-1 (a necrosis inhibitor), and bafilomycin A1 (an autophagy inhibitor) and performed cell viability and colony formation assays. It was shown that only Z-VAD-FMK rescued cell survival mediated by dox-induced PTPN23 silencing (Fig. S1, J and K). To address potential off-target effects from PTPN23 shRNA, we reintroduced shRNA-resistant Flag-tagged PTPN23 into PTPN23-depleted A375 cells. This re-expression of PTPN23 effectively countered the growth inhibition and apoptosis triggered by PTPN23 knockdown (Fig. S1, L–O). To investigate whether the overexpression of PTPN23 could directly influence the growth of BRAF-mutant melanoma cells, we transfected A375 and SK-MEL-28 cells with either an empty vector or Flag-PTPN23 and performed cell viability and colony formation assays. PTPN23 overexpression significantly promoted cell growth in both cell lines (Fig. S1, P–R). Furthermore, we knocked down PTPN23 with an additional four distinct shRNA constructs and we observed consistent results across all constructs, with PTPN23 knockdown markedly inhibiting cell growth in BRAF-mutant A375 cells (Fig. S1, S–U). Collectively, these data suggest that PTPN23 is essential for the cell survival of BRAF-mutant melanoma cells.
PTPN23 is associated with the PI3K-AKT signaling pathway
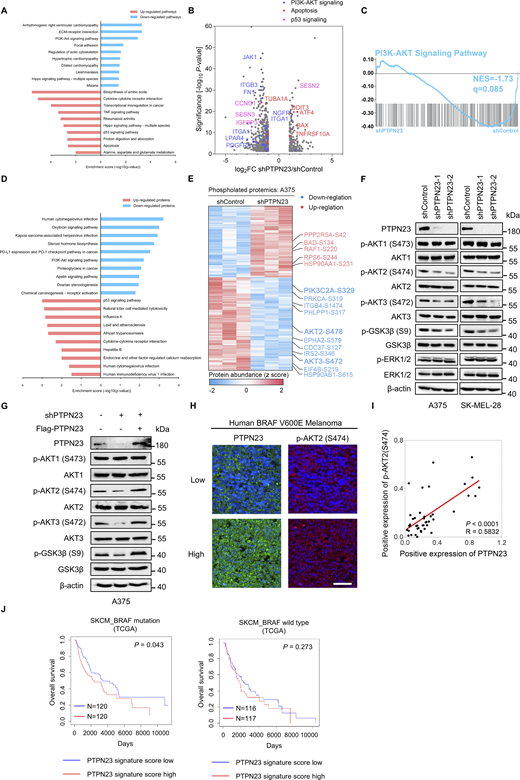
We next profiled the change of gene expression in A375 cells after PTPN23 knockdown to explore mechanisms by which PTPN23 regulates cell survival. RNA-sequencing (RNA-seq) analysis revealed that gene sets related to apoptosis, the p53 signaling pathway, and the TNF signaling pathway were significantly enriched among upregulated pathways in PTPN23-deficient A375 cells compared with control cells, and multiple genes related to the oncogenic PI3K-AKT signaling pathway were downregulated by PTPN23 depletion (Fig. 2, A and B). The gene set enrichment analysis (GSEA) also showed that PTPN23 depletion significantly inhibited the PI3K-AKT signaling pathway with an normalized enrichment score (NES) of −1.73 (Fig. 2 C). We further performed label-free proteomics analysis to elucidate the biological functions of PTPN23 in BRAF-mutant melanoma, and the KEGG enrichment results also indicated that the PI3K-AKT signaling pathway was downregulated and the p53 signaling pathway was upregulated, consistent with RNA-seq analysis (Fig. 2 D). These results suggest that PTPN23 may affect cell survival via the PI3K-AKT signaling pathway.
PTPN23 is associated with the PI3K-AKT signaling pathway. (A) Two-way bar chart showing KEGG enrichment analysis of differentially expressed genes identified by RNA-seq after PTPN23 depletion in A375 cells. Upregulated pathways are shown in red, and downregulated pathways in blue. The top 10 pathways are ranked by a normalized enrichment score. Analysis includes n = 3 biological replicates per group. P values were adjusted using the Benjamini and Hochberg approach, with significance thresholds set at P adj ≤0.05 and |log2(fold change)| ≥1 for differential expression. (B) Volcano plots displaying differentially expressed genes in the PI3K-AKT signaling (blue), apoptosis (red), and p53 signaling pathway (violet) after PTPN23 depletion in A375 cells identified by RNA-seq analysis. (C) GSEA of the PI3K-AKT signaling pathway in A375 cells with PTPN23 depletion compared with control cells. (D) Two-way bar chart of KEGG enrichment analysis based on differentially expressed proteins of A375 cells with PTPN23 depletion identified by proteomics. Upregulated proteins are shown in red, and downregulated proteins in blue. Analysis includes n = 3 biological replicates per group. (E) Heatmap of differentially phosphorylated proteins identified by phosphoproteomics after PTPN23 depletion in A375 cells. Upregulated proteins are shown in red, and downregulated proteins in blue. PI3KC2α, AKT2, and AKT3 were highlighted. n = 3 biological replicates per group. P values were adjusted using the Benjamini and Hochberg approach. P adj ≤0.05 and |log2(fold change)| ≥1 were set as the threshold for significantly differential expression. (F) Immunoblot showing phosphorylated and total proteins in A375 and SK-MEL-28 cells after PTPN23 depletion. (G) Immunoblot showing total and phosphorylation levels of indicated proteins in A375 cells after endogenous PTPN23 depletion, with or without Flag-PTPN23 overexpression. (H) mIHC analysis of 44 human melanoma samples with BRAFV600E mutation in a TMA was performed with the indicated antibodies. Representative images of staining are shown. Scale bar, 50 µm. (I) Spearman’s correlation analysis showing the relative expression of PTPN23 and p-AKT2 (S474) in the melanoma TMA samples. (J) Association between the PTPN23 signature score and overall survival in BRAF-mutant and BRAF-WT melanoma patients from TCGA dataset. The PTPN23 signature score was generated based on the top 100 upregulated and 100 downregulated genes from RNA-seq data of control and PTPN23-knockdown cells. Source data are available for this figure: SourceData F2.
PTPN23 is associated with the PI3K-AKT signaling pathway. (A) Two-way bar chart showing KEGG enrichment analysis of differentially expressed genes identified by RNA-seq after PTPN23 depletion in A375 cells. Upregulated pathways are shown in red, and downregulated pathways in blue. The top 10 pathways are ranked by a normalized enrichment score. Analysis includes n = 3 biological replicates per group. P values were adjusted using the Benjamini and Hochberg approach, with significance thresholds set at P adj ≤0.05 and |log2(fold change)| ≥1 for differential expression. (B) Volcano plots displaying differentially expressed genes in the PI3K-AKT signaling (blue), apoptosis (red), and p53 signaling pathway (violet) after PTPN23 depletion in A375 cells identified by RNA-seq analysis. (C) GSEA of the PI3K-AKT signaling pathway in A375 cells with PTPN23 depletion compared with control cells. (D) Two-way bar chart of KEGG enrichment analysis based on differentially expressed proteins of A375 cells with PTPN23 depletion identified by proteomics. Upregulated proteins are shown in red, and downregulated proteins in blue. Analysis includes n = 3 biological replicates per group. (E) Heatmap of differentially phosphorylated proteins identified by phosphoproteomics after PTPN23 depletion in A375 cells. Upregulated proteins are shown in red, and downregulated proteins in blue. PI3KC2α, AKT2, and AKT3 were highlighted. n = 3 biological replicates per group. P values were adjusted using the Benjamini and Hochberg approach. P adj ≤0.05 and |log2(fold change)| ≥1 were set as the threshold for significantly differential expression. (F) Immunoblot showing phosphorylated and total proteins in A375 and SK-MEL-28 cells after PTPN23 depletion. (G) Immunoblot showing total and phosphorylation levels of indicated proteins in A375 cells after endogenous PTPN23 depletion, with or without Flag-PTPN23 overexpression. (H) mIHC analysis of 44 human melanoma samples with BRAFV600E mutation in a TMA was performed with the indicated antibodies. Representative images of staining are shown. Scale bar, 50 µm. (I) Spearman’s correlation analysis showing the relative expression of PTPN23 and p-AKT2 (S474) in the melanoma TMA samples. (J) Association between the PTPN23 signature score and overall survival in BRAF-mutant and BRAF-WT melanoma patients from TCGA dataset. The PTPN23 signature score was generated based on the top 100 upregulated and 100 downregulated genes from RNA-seq data of control and PTPN23-knockdown cells. Source data are available for this figure: SourceData F2.
To examine this hypothesis, we performed phosphoproteomics analysis in PTPN23-deficient A375 melanoma cells, with a focus on members of the PI3K-AKT signaling pathway. We observed phosphorylation of multiple components of the PI3K-AKT signaling pathway was affected by PTPN23 downregulation. Particularly, the phosphorylation of phosphoinositide 3-kinase class II alpha (PI3KC2α) at serine 329 (S329), AKT2 at serine 478 (S478), and AKT3 at serine 472 (S472) was all significantly reduced (Fig. 2 E). Interestingly, we did not observe a significant change in phosphorylation of the well-studied class I phosphoinositide 3-kinase (PI3K) or AKT1. To verify these results, we examined the phosphorylation levels of PI3K-AKT signaling by immunoblotting. Consistently, silencing of PTPN23 inhibited phosphorylation of AKT2-S474 (which functions synergistically with AKT2-S478) (Humphrey et al., 2015; Liu et al., 2014), AKT3-S472, and their downstream GSK3β at serine 9, but has no little effect on AKT1 in BRAF-mutant A375 and SK-MEL-28 melanoma cells (Fig. 2 F). It was also noted that phosphorylation of ERK1/2 was not affected in any melanoma cells, suggesting PTPN23 is not involved in the regulation of the MAPK signaling pathway. Furthermore, the ectopic expression of shRNA-resistant Flag-tagged PTPN23 could rescue the inhibitory effects of PTPN23 depletion on phosphorylation of AKT2 and AKT3 in A375 cells (Fig. 2 G). To investigate the association between PTPN23 expression and AKT signaling in clinical samples, we conducted multiplex immunohistochemistry (mIHC) staining to analyze PTPN23 levels and the phosphorylation status of AKT2 at S474 with 44 human BRAF(V600E) mutant melanoma samples in a tissue microarray (TMA). Our analysis revealed a positive correlation between PTPN23 protein levels and the phosphorylation of AKT2 at S474 (Fig. 2, H and I). Altogether, these data substantiate that PTPN23 is associated with the PI3K-AKT signaling pathway in BRAF-mutant melanoma cells.
We also investigated the association between PTPN23 functions and survival of BRAF-mutant cancer patients. Using RNA-seq data from control and PTPN23-depleted A375 cells (Fig. 2 B), we defined a PTPN23 gene signature score based on the top 100 upregulated and 100 downregulated genes (Ito et al., 2023). Analysis of TCGA melanoma dataset revealed that a higher PTPN23 gene signature score correlates with shorter survival in BRAF-mutant melanoma patients, but not in BRAF-WT melanoma patients (Fig. 2 J). This suggests a crucial role of PTPN23 in the progression of BRAF-mutant cancers.
PTPN23 is required for PI3KC2α-mediated production of PI(3,4)P2 and AKT activation
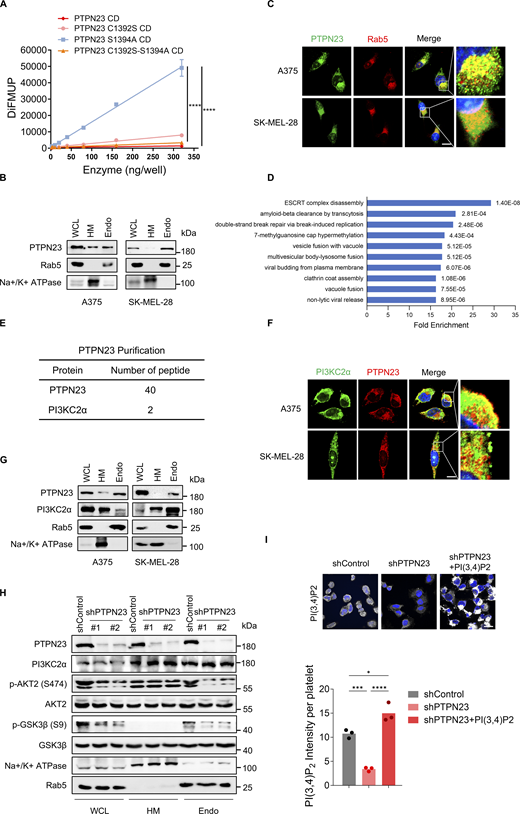
We next sought to explore the molecular mechanisms that account for the association between PTPN23 and the PI3K-AKT signaling pathway. PTPN23 is a member of the PTPN family, but it has been reported to be catalytically inactive against generic phosphosubstrates as PTPN23 displays multiple divergences from the conserved core catalytic motif (Gingras et al., 2009b). To verify the consequence of sequence variations on phosphatase activity, we expressed and purified the recombinant PTPN23 catalytic domain (CD) for in vitro phosphatase assays with 6,8-difluoro-4-methylumbelliferyl phosphate (DiFMUP) as the substrate. In agreement with previous studies, we did not detect phosphatase activity of the PTPN23 CD, while the mutant with serine 1394 mutated back to the alanine showed considerable activity, which would be impaired by the canonical inactivating mutation of the PTP catalytic site (C1392S) (Fig. S2 A). Thus, PTPN23 is a catalytically inactive phosphatase.
PTPN23 is required for PI3KC2α-mediated production of PI(3,4)P2 and AKT activation. (A) DiFMUP assay detecting phosphatase activity of the PTPN23 CD (Ile1211 to Val1450), along with C1392S, S1394A, and C1392S-S1394A mutants (n = 3). Two-way ANOVA, Tukey’s test. (B) Immunoblot showing protein levels of PTPN23 and Rab5 after cell fractionation in A375 and SK-MEL-28 cells. (C) Immunofluorescence showing the subcellular localization of PTPN23 and Rab5 in A375 and SK-MEL-28 cells. Scale bar, 20 μm. (D) Pathway enrichment analysis of PTPN23-interacting proteins identified by LC-MS/MS. (E) Peptide counts of PTPN23 and PI3KC2α from affinity mass spectrometry. (F) Immunofluorescence showing the subcellular localization of PTPN23 and PI3KC2α in A375 and SK-MEL-28 cells. Scale bar, 20 μm. (G) Immunoblot analysis of PTPN23 and PI3KC2α after cell fractionation in A375 and SK-MEL-28 cells. (H) Immunoblot showing total and phosphorylated proteins in cell fractionation from A375 cells after PTPN23 depletion. (I) Immunofluorescence and quantification of PI(3,4)P2 levels after PTPN23 depletion in A375 cells with or without exogenous soluble PI(3,4)P2 treatment (n = 3). Scale bar, 20 μm. One-way ANOVA, Tukey’s test. ****P < 0.0001; ***P < 0.001; *P < 0.05. WCL: whole-cell lysates; HM: heavy membrane; Endo: endosome. Source data are available for this figure: SourceData FS2.
PTPN23 is required for PI3KC2α-mediated production of PI(3,4)P2 and AKT activation. (A) DiFMUP assay detecting phosphatase activity of the PTPN23 CD (Ile1211 to Val1450), along with C1392S, S1394A, and C1392S-S1394A mutants (n = 3). Two-way ANOVA, Tukey’s test. (B) Immunoblot showing protein levels of PTPN23 and Rab5 after cell fractionation in A375 and SK-MEL-28 cells. (C) Immunofluorescence showing the subcellular localization of PTPN23 and Rab5 in A375 and SK-MEL-28 cells. Scale bar, 20 μm. (D) Pathway enrichment analysis of PTPN23-interacting proteins identified by LC-MS/MS. (E) Peptide counts of PTPN23 and PI3KC2α from affinity mass spectrometry. (F) Immunofluorescence showing the subcellular localization of PTPN23 and PI3KC2α in A375 and SK-MEL-28 cells. Scale bar, 20 μm. (G) Immunoblot analysis of PTPN23 and PI3KC2α after cell fractionation in A375 and SK-MEL-28 cells. (H) Immunoblot showing total and phosphorylated proteins in cell fractionation from A375 cells after PTPN23 depletion. (I) Immunofluorescence and quantification of PI(3,4)P2 levels after PTPN23 depletion in A375 cells with or without exogenous soluble PI(3,4)P2 treatment (n = 3). Scale bar, 20 μm. One-way ANOVA, Tukey’s test. ****P < 0.0001; ***P < 0.001; *P < 0.05. WCL: whole-cell lysates; HM: heavy membrane; Endo: endosome. Source data are available for this figure: SourceData FS2.
To illustrate the biological functions of PTPN23, we first explored the subcellular localization of PTPN23 in A375 melanoma cells. We observed that a large portion of PTPN23 was localized in the RAB5-positive early endosomal (EE) fraction (Fig. S2 B). The co-localization of PTPN23 with RAB5 in EE was also confirmed by immunofluorescence (Fig. S2 C). We then used affinity purification and mass spectrometry to analyze the proteins that interact with PTPN23. A total of 96 proteins with at least two unique peptides were identified. We performed Gene Ontology (GO) enrichment analysis of the biological processes in which PTPN23-interacting proteins are involved. In agreement with the role of PTPN23 as a highly conserved alternative component of the endosomal sorting complexes required for transport (ESCRT) pathway (Doyotte et al., 2008), we identified that PTPN23-interacting proteins are associated with ESCRT disassembly, multivesicular body–lysosome fusion, and vacuole fusion (Fig. S2 D). These confirmed PTPN23 is an important component of the ESCRT pathway and mainly localized at endosomes.
Among the PTPN23-interacting proteins, we identified PI3KC2α (Fig. S2 E), whose phosphorylation at S329 was significantly reduced in PTPN23-deficient A375 cells as revealed by the phosphoproteomics analysis (Fig. 2 E). The interaction between PTPN23 and PI3KC2α was also identified in the BioGRID database (Kazan et al., 2021). Given the association between PTPN23 and PI3K-AKT signaling, we determined whether PTPN23 interacts with PI3KC2α and modulates its phosphorylation and catalytic activity. When ectopically co-expressed in A375 and SK-MEL-28 cells, PTPN23 co-immunoprecipitated with PI3KC2α reciprocally (Fig. 3 A). We validated the interaction at the endogenous level in both cell lines (Fig. 3 B). These results indicated that PTPN23 interacts with PI3KC2α. In addition, PTPN23 and PI3KC2α had a clear co-localization and could be detected at the endosome (Fig. S2, F and G). To confirm that PTPN23 knockdown decreased phosphorylation of PI3KC2α at S329, phosphorylated serine, phosphorylated threonine, and phosphorylated tyrosine in PI3KC2α were detected in cellular lysates collected from control or PTPN23-depleted A375 cells after PI3KC2α immunoprecipitation. Serine, but not threonine or tyrosine phosphorylation of PI3KC2α, was substantially decreased by PTPN23 silencing without affecting the protein levels of PI3KC2α (Fig. 3 C). We also investigated whether PI3KC2α phosphorylation at S329 affected its activity to produce PI(3,4)P2. shRNA-resistant HA-tagged PI3KC2α WT, S329A, or S329D mutants were expressed in A375 cells. We found that PI(3,4)P2 production was significantly increased by PI3KC2α WT and the phosphomimetic S329D mutant, but impaired by the phosphorylation-defective PI3KC2α S329A mutant (Fig. 3 D). These findings collectively indicate that PTPN23 plays a crucial role in regulating the phosphorylation of PI3KC2α at S329 and its catalytic activity in PI(3,4)P2 production.
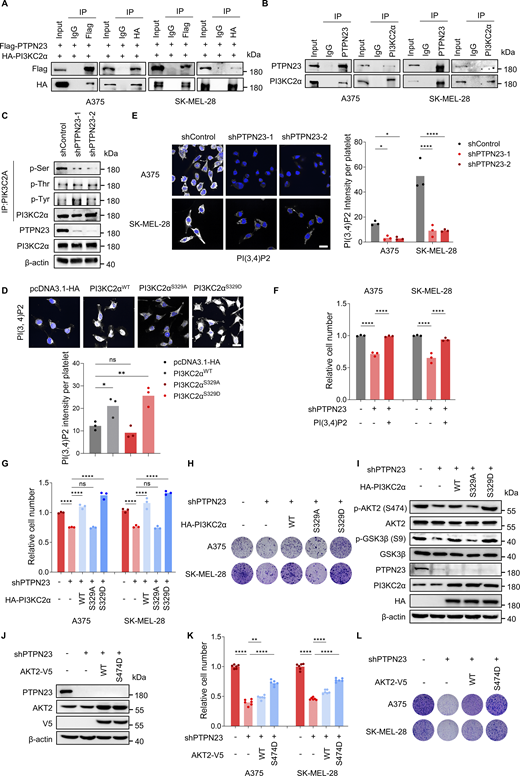
PTPN23 is required for PI3KC2α-mediated production of PI(3,4)P2 and AKT activation. (A) Interaction between exogenous HA-PI3KC2α and Flag-PTPN23 was detected by immunoprecipitation in A375 and SK-MEL-28 cells. (B) Endogenous PI3KC2α and PTPN23 interaction was detected by immunoprecipitation in A375 and SK-MEL-28 cells. (C) Immunoblot showing the phosphorylation of serine, threonine, and tyrosine residues of PI3KC2α after PTPN23 depletion in A375 cells. (D) Immunofluorescence showing the level of PI(3,4)P2 in A375 cells with pcDNA3.1-HA, PI3KC2αWT, PI3KC2αS329A, and PI3KC2αS329D overexpression. Quantification of PI(3,4)P2 signal intensity was obtained from three independent images (per group). Scale bar, 20 μm. One-way ANOVA, Dunnett’s test. (E) Immunofluorescence showing the level of PI(3,4)P2 after PTPN23 depletion in A375 and SK-MEL-28. Quantification of PI(3,4)P2 signal intensity was obtained from three independent images (per group). Scale bar, 20 μm. Two-way ANOVA, Dunnett’s test. (F) Relative cell number of A375 cells after PTPN23 depletion with or without exogenous soluble PI(3,4)P2 treatment, measured by the CCK8 assay after 72 h (n = 3). One-way ANOVA, Bonferroni’s test. (G) Relative cell number of PTPN23-depleted A375 cells overexpressing PI3KC2α WT, S329A, or S329D, measured by the CCK8 assay after 72 h (n = 3). One-way ANOVA, Bonferroni’s test. (H) Colony formation assay of PTPN23-depleted A375 cells overexpressing PI3KC2α WT, S329A, or S329D. Colonies were stained with crystal violet after 14 days. (I) Immunoblot analysis of indicated proteins in A375 cells after endogenous PTPN23 depletion with or without the overexpression of HA-PI3KC2α WT, S329A, and S329D. (J) Immunoblot showing protein expression in A375 cells after PTPN23 depletion with the overexpression of AKT2 WT or S474D mutant. (K) Relative cell number of PTPN23-depleted A375 cells with the overexpression of AKT2 WT and S474D. Cell viability was measured by the CCK8 assay after 72 h (n = 3). One-way ANOVA, Bonferroni’s test. (L) Colony formation assay of PTPN23-depleted A375 cells with the overexpression of AKT2 WT or S474D mutant. Colonies were stained with crystal violet after 14 days. ****P < 0.0001; **P < 0.01; *P < 0.05; P > 0.05; not significant (ns). Source data are available for this figure: SourceData F3.
PTPN23 is required for PI3KC2α-mediated production of PI(3,4)P2 and AKT activation. (A) Interaction between exogenous HA-PI3KC2α and Flag-PTPN23 was detected by immunoprecipitation in A375 and SK-MEL-28 cells. (B) Endogenous PI3KC2α and PTPN23 interaction was detected by immunoprecipitation in A375 and SK-MEL-28 cells. (C) Immunoblot showing the phosphorylation of serine, threonine, and tyrosine residues of PI3KC2α after PTPN23 depletion in A375 cells. (D) Immunofluorescence showing the level of PI(3,4)P2 in A375 cells with pcDNA3.1-HA, PI3KC2αWT, PI3KC2αS329A, and PI3KC2αS329D overexpression. Quantification of PI(3,4)P2 signal intensity was obtained from three independent images (per group). Scale bar, 20 μm. One-way ANOVA, Dunnett’s test. (E) Immunofluorescence showing the level of PI(3,4)P2 after PTPN23 depletion in A375 and SK-MEL-28. Quantification of PI(3,4)P2 signal intensity was obtained from three independent images (per group). Scale bar, 20 μm. Two-way ANOVA, Dunnett’s test. (F) Relative cell number of A375 cells after PTPN23 depletion with or without exogenous soluble PI(3,4)P2 treatment, measured by the CCK8 assay after 72 h (n = 3). One-way ANOVA, Bonferroni’s test. (G) Relative cell number of PTPN23-depleted A375 cells overexpressing PI3KC2α WT, S329A, or S329D, measured by the CCK8 assay after 72 h (n = 3). One-way ANOVA, Bonferroni’s test. (H) Colony formation assay of PTPN23-depleted A375 cells overexpressing PI3KC2α WT, S329A, or S329D. Colonies were stained with crystal violet after 14 days. (I) Immunoblot analysis of indicated proteins in A375 cells after endogenous PTPN23 depletion with or without the overexpression of HA-PI3KC2α WT, S329A, and S329D. (J) Immunoblot showing protein expression in A375 cells after PTPN23 depletion with the overexpression of AKT2 WT or S474D mutant. (K) Relative cell number of PTPN23-depleted A375 cells with the overexpression of AKT2 WT and S474D. Cell viability was measured by the CCK8 assay after 72 h (n = 3). One-way ANOVA, Bonferroni’s test. (L) Colony formation assay of PTPN23-depleted A375 cells with the overexpression of AKT2 WT or S474D mutant. Colonies were stained with crystal violet after 14 days. ****P < 0.0001; **P < 0.01; *P < 0.05; P > 0.05; not significant (ns). Source data are available for this figure: SourceData F3.
Corroborating the essential role of PTPN23 in sustaining the catalytic activity of PI3KC2α, our experiments revealed that PTPN23 depletion substantially reduced PI(3,4)P2 levels in A375 and SK-MEL-28 (Fig. 3 E), as well as the phosphorylation of downstream AKT2 and GSK3β, specifically within endosomal compartments (Fig. S2 H). These findings align with prior research, indicating that PI(3,4)P2 production is a crucial facilitator of AKT2 activation at EE (Li Chew et al., 2015). We next assessed whether manipulation of the cellular PI(3,4)P2 content could affect the growth of BRAF-mutant melanoma cells. We observed an acute increase of PI(3,4)P2 intensities in melanoma cells depleted of PTPN23 after exogenous treatment of soluble PI(3,4)P2, which dramatically restored cell viability of PTPN23-depleted A375 and SK-MEL-28 cells (Fig. 3 F and Fig. S2 I).
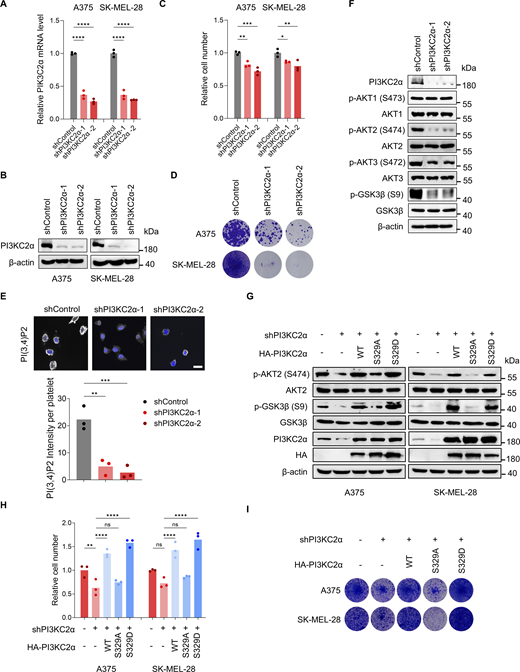
We then investigated whether PTPN23-dependent AKT signaling and cell survival were mediated by PI3KC2α. We first examined the potential role of PI3KC2α in BRAF-mutant melanoma cells. Similar to PTPN23, the knockdown of PI3KC2α strongly inhibited cell growth as detected by cell viability and colony formation assays (Fig. S3, A–D). PI3KC2α depletion also reduced the production of PI(3,4)P2 and phosphorylation of AKT2, AKT3, and GSK3β, but not AKT1 (Fig. S3, E and F). We also found that the overexpression of PI3KC2α WT or phosphomimetic PI3KC2α S329D rescued inhibitory effects of PI3KC2α depletion on AKT signaling and cell viability, but not the phosphorylation-defective PI3KC2α S329A (Fig. S3, G–I). To further validate the role of PI3KC2α as a mediator of PTPN23-dependent vulnerability in BRAF-mutant melanoma cells, we knocked down PTPN23 and ectopically expressed HA-tagged PI3KC2α WT, S329A, or S329D mutants. We found that PI3KC2α WT and S329D, but not S329A, rescued the phosphorylation of AKT2 and GSK3β, as well as the cell viability inhibited by PTPN23 silencing (Fig. 3, G–I). To confirm whether PTPN23 regulates cell survival through AKT2 signaling, we generated the constitutively active AKT2 mutant (S474D) to further explore the role of AKT2 activation in PTPN23-silenced BRAF-mutant cells. Our results demonstrate that the introduction of the active AKT2 mutant significantly rescued the growth inhibition observed following PTPN23 depletion (Fig. 3, J–L). Collectively, these data substantiate our hypothesis that PTPN23 is required for the phosphorylation of PI3KC2α at S329 and PI(3,4)P2 production, thereby facilitating AKT2 activation and cell survival in BRAF-mutant melanoma.
PI3KC2α is required for the growth of BRAF-mutant melanoma cells. (A and B) RT–qPCR (A) and immunoblot (B) detecting mRNA and protein levels of PI3KC2α after knockdown in A375 and SK-MEL-28 cells, respectively. One-way ANOVA, Bonferroni’s test. (C) Relative cell number of A375 and SK-MEL-28 cells after PI3KC2α knockdown. Cell viability was measured by the CCK8 assay after 72 h (n = 3). One-way ANOVA, Bonferroni’s test. (D) Colony formation assay of A375 and SK-MEL-28 cells with PI3KC2α knockdown. Colonies were stained with crystal violet after 14 days. (E) Immunofluorescence of PI(3,4)P2 after PI3KC2α knockdown in A375 cells (n = 3). Scale bar, 20 μm. One-way ANOVA, Dunnett’s test. (F) Immunoblot of indicated proteins in A375 cells after PI3KC2α knockdown. (G) Immunoblot of indicated proteins after endogenous PI3KC2α knockdown with or without the overexpression of HA-PI3KC2α WT, S329A, or S329D mutant in A375 and SK-MEL-28 cells. (H) Relative cell number of A375 and SK-MEL-28 cells after endogenous PI3KC2α knockdown with or without the overexpression of HA-PI3KC2α WT, S329A, or S329D mutant. Cell viability was measured by the CCK8 assay after 72 h (n = 3). One-way ANOVA, Bonferroni’s test. (I) Colony formation assay of A375 and SK-MEL-28 cells depleted of endogenous PI3KC2α with or without the overexpression of HA-PI3KC2α WT, S329A, or S329D. Colonies were stained with crystal violet after 14 days. ****P < 0.0001; ***P < 0.001; **P < 0.01; *P < 0.05; P > 0.05; not significant (ns). Source data are available for this figure: SourceData FS3.
PI3KC2α is required for the growth of BRAF-mutant melanoma cells. (A and B) RT–qPCR (A) and immunoblot (B) detecting mRNA and protein levels of PI3KC2α after knockdown in A375 and SK-MEL-28 cells, respectively. One-way ANOVA, Bonferroni’s test. (C) Relative cell number of A375 and SK-MEL-28 cells after PI3KC2α knockdown. Cell viability was measured by the CCK8 assay after 72 h (n = 3). One-way ANOVA, Bonferroni’s test. (D) Colony formation assay of A375 and SK-MEL-28 cells with PI3KC2α knockdown. Colonies were stained with crystal violet after 14 days. (E) Immunofluorescence of PI(3,4)P2 after PI3KC2α knockdown in A375 cells (n = 3). Scale bar, 20 μm. One-way ANOVA, Dunnett’s test. (F) Immunoblot of indicated proteins in A375 cells after PI3KC2α knockdown. (G) Immunoblot of indicated proteins after endogenous PI3KC2α knockdown with or without the overexpression of HA-PI3KC2α WT, S329A, or S329D mutant in A375 and SK-MEL-28 cells. (H) Relative cell number of A375 and SK-MEL-28 cells after endogenous PI3KC2α knockdown with or without the overexpression of HA-PI3KC2α WT, S329A, or S329D mutant. Cell viability was measured by the CCK8 assay after 72 h (n = 3). One-way ANOVA, Bonferroni’s test. (I) Colony formation assay of A375 and SK-MEL-28 cells depleted of endogenous PI3KC2α with or without the overexpression of HA-PI3KC2α WT, S329A, or S329D. Colonies were stained with crystal violet after 14 days. ****P < 0.0001; ***P < 0.001; **P < 0.01; *P < 0.05; P > 0.05; not significant (ns). Source data are available for this figure: SourceData FS3.
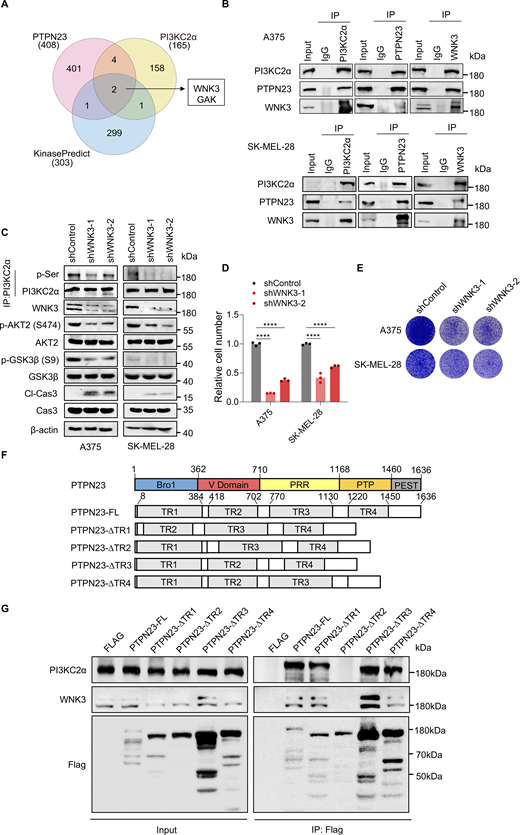
It is unlikely that PTPN23 directly phosphorylates PI3KC2α at S329. Instead, it may facilitate the binding of PI3KC2α to the related kinases or protect it from dephosphorylation. To determine how PTPN23 regulates phosphorylation of PI3KC2α, we first used the PhosphoSite Kinase Library (Johnson et al., 2023) to predict the putative kinases that phosphorylate the peptide flanking PI3KC2α S329 (NGKSLSVATVTR) and the HitPredict database to identify PI3KC2α-interacting proteins (Patil et al., 2011) and intersected the lists with interacting proteins of PTPN23. We found two overlapped kinases, WNK3 and GAK, and focused on WNK3 as it ranked much higher and was reported to regulate cell survival in a caspase-3–dependent pathway (Veríssimo et al., 2006) (Fig. 4 A). Co-immunoprecipitation verified the interaction among endogenous PTPN23, PI3KC2α, and WNK3 in A375 and SK-MEL-28 cells (Fig. 4 B). Besides, the interaction between WNK3 and PI3KC2α was also identified in the previous study (Buljan et al., 2020). Accordingly, silencing of WNK3 by shRNA resulted in a reduction of phosphorylation of PI3KC2α at serine residues and phosphorylation of AKT2 and the downstream GSK3β, as well as the induction of caspase-3 cleavage (Fig. 4 C). Moreover, we found that WNK3 depletion reduced cell viability of A375 and SK-MEL-28 cells (Fig. 4, D and E). These results indicate that PTPN23 may regulate the phosphorylation of PI3KC2α via WNK3 to affect BRAF-mutant melanoma cell survival.
PTPN23 facilitates phosphorylation of PI3KC2α by WNK3. (A) Venn diagram showing the overlap of kinases identified through mass spectrometry of PTPN23-interacting proteins, PI3KC2α-interacting proteins (from the HitPredict database), and predicted kinases from the KinasePredict database. (B) Immunoprecipitation and immunoblot analyses showing the interaction among endogenous PTPN23, PI3KC2α, and WNK3 in A375 and SK-MEL-28 cells. (C) Immunoblot showing the expression of indicated proteins after WNK3 knockdown in A375 and SK-MEL-28 cells. (D) Relative cell number of WNK3-depleted A375 and SK-MEL-28 cells. Cell viability was measured by the CCK8 assay after 72 h (n = 3). Two-way ANOVA, Dunnett’s test. (E) Colony formation assay of WNK3-depleted A375 and SK-MEL-28 cells. Colonies were stained with crystal violet after 14 days. (F) Schematic illustration of the strategy used to generate different truncated mutants of the PTPN23 protein. (G) Immunoprecipitation and immunoblot analyses showing the levels of PI3KC2α and WNK3 interacting with indicated PTPN23-truncated mutants. ****P < 0.0001. Source data are available for this figure: SourceData F4.
PTPN23 facilitates phosphorylation of PI3KC2α by WNK3. (A) Venn diagram showing the overlap of kinases identified through mass spectrometry of PTPN23-interacting proteins, PI3KC2α-interacting proteins (from the HitPredict database), and predicted kinases from the KinasePredict database. (B) Immunoprecipitation and immunoblot analyses showing the interaction among endogenous PTPN23, PI3KC2α, and WNK3 in A375 and SK-MEL-28 cells. (C) Immunoblot showing the expression of indicated proteins after WNK3 knockdown in A375 and SK-MEL-28 cells. (D) Relative cell number of WNK3-depleted A375 and SK-MEL-28 cells. Cell viability was measured by the CCK8 assay after 72 h (n = 3). Two-way ANOVA, Dunnett’s test. (E) Colony formation assay of WNK3-depleted A375 and SK-MEL-28 cells. Colonies were stained with crystal violet after 14 days. (F) Schematic illustration of the strategy used to generate different truncated mutants of the PTPN23 protein. (G) Immunoprecipitation and immunoblot analyses showing the levels of PI3KC2α and WNK3 interacting with indicated PTPN23-truncated mutants. ****P < 0.0001. Source data are available for this figure: SourceData F4.
We sought to determine which specific region of PTPN23 facilitates its interaction with WNK3 and PI3KC2α. PTPN23 is a complex, multidomain protein that includes an N-terminal Bro1 domain known to bind the ESCRT-0 subunit STAM2 and the ESCRT-III subunit CHMP4B, a V domain that associates with the ESCRT-I subunit UBAP1, a proline-rich region offering binding sites for the ESCRT-I subunit TSG101, and a PTP-like domain (Gahloth et al., 2017). To identify the domain responsible for the interaction with WNK3 and PI3KC2α, we engineered Flag-tagged PTPN23 constructs lacking significant portions of each domain (Fig. 4 F). Our experiments revealed that the deletion of the V domain disrupted the interaction of PTPN23 with either WNK3 or PI3KC2α (Fig. 4 G), indicating V domain as essential for mediating these interactions.
PTPN23 silencing sensitizes BRAFV600E melanoma cells to BRAFi
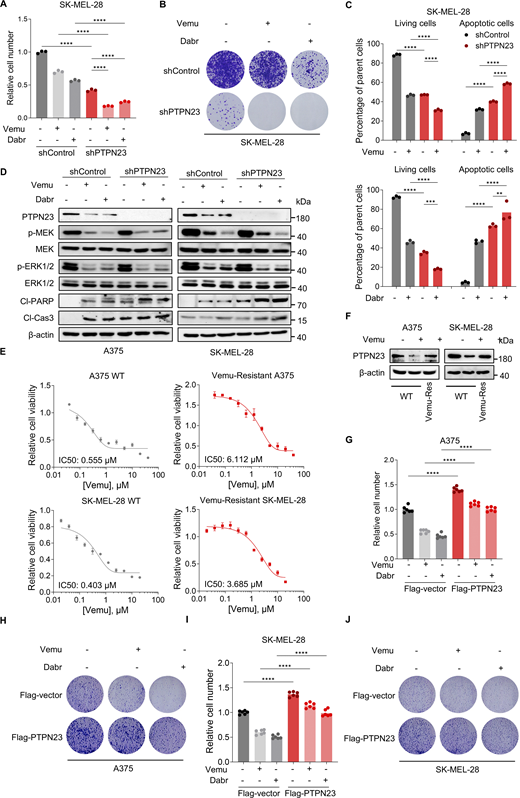
We next asked whether PTPN23 affects the response sensitivity to BRAFV600E-specific inhibitors. Cell viability was measured in control or PTPN23-depleted A375 cells treated with BRAFi Vemu or Dabr for three days. The greatest increases in cell growth inhibition of A375 and SK-MEL-28 cells were observed when the BRAFi were combined with dox-induced PTPN23 depletion in cell viability and colony formation assays (Fig. 5, A and B; and Fig. S4, A and B). The impact on cell survival of combining dox-induced PTPN23 depletion with BRAF-specific inhibitors was also demonstrated by the flow cytometry–based apoptosis assay (Fig. 5 C and Fig. S4 C). The synergistic effects of co-targeting PTPN23 and BRAF in BRAF-mutant melanoma were also assayed with cell line–derived xenograft assays. The combination of PTPN23 depletion and Vemu resulted in significantly improved tumor growth inhibition as compared to PTPN23 depletion or Vemu treatment alone (Fig. 5, D–G). Markedly, in the absence of PTPN23, treatment with Vemu or Dabr more effectively induced cleavage of PARP and caspase-3 (Fig. S4 D). Interestingly, treatment with BRAFi also reduced the protein levels of PTPN23 (Fig. S4 D). These findings indicate that PTPN23 depletion increases the response sensitivity to BRAFV600E inhibitors.

PTPN23 silencing sensitizes BRAF V600E melanoma cells to BRAFi . (A) Relative cell number of dox-induced PTPN23-depleted A375 cells treated with or without 2 μM Vemu or 2 μM Dabr. Cell viability was measured by the CCK8 assay after 72 h (n = 3). One-way ANOVA, Bonferroni’s test. (B) Colony formation assay of the cells described in A treated with or without 2 μM Vemu or 2 μM Dabr. Colonies were stained with crystal violet after 14 days. (C) Flow cytometric analysis of living and apoptotic cells of dox-induced PTPN23-depleted A375 cells treated with or without Vemu or Dabr (n = 3). One-way ANOVA, Bonferroni’s test. (D and E) Tumor volume (D) and weight (E) of A375 xenografts in nude mice with indicated treatments. Mice were given a dox-supplemented diet (400 ppm) or daily gavage administration of Vemu (20 mg/kg) starting 10 days after implantation (n = 6 mice per group). Data represent the mean ± SEM. Two-way ANOVA, Bonferroni’s test (D) or one-way ANOVA, Bonferroni’s test (E). (F) Photograph of xenograft tumors from nude mice inoculated with A375 cells from the indicated groups (n = 6 mice per group). (G) Ki67 staining showing proliferation of A375 xenograft tumors with PTPN23 depletion or Vemu treatment. Scale bar, 50 μm. (H) Relative cell number of Vemu-Res A375 and SK-MEL-28 cells with or without PTPN23 depletion. Cell viability was measured by the CCK8 assay after 72 h (n = 3). Unpaired t test. (I) Colony formation assay of Vemu-Res A375 and SK-MEL-28 cells with or without PTPN23 depletion. Colonies were stained with crystal violet after 14 days. ****P < 0.0001; ***P < 0.001; **P < 0.01; *P < 0.05; P > 0.05; not significant (ns).
PTPN23 silencing sensitizes BRAF V600E melanoma cells to BRAFi . (A) Relative cell number of dox-induced PTPN23-depleted A375 cells treated with or without 2 μM Vemu or 2 μM Dabr. Cell viability was measured by the CCK8 assay after 72 h (n = 3). One-way ANOVA, Bonferroni’s test. (B) Colony formation assay of the cells described in A treated with or without 2 μM Vemu or 2 μM Dabr. Colonies were stained with crystal violet after 14 days. (C) Flow cytometric analysis of living and apoptotic cells of dox-induced PTPN23-depleted A375 cells treated with or without Vemu or Dabr (n = 3). One-way ANOVA, Bonferroni’s test. (D and E) Tumor volume (D) and weight (E) of A375 xenografts in nude mice with indicated treatments. Mice were given a dox-supplemented diet (400 ppm) or daily gavage administration of Vemu (20 mg/kg) starting 10 days after implantation (n = 6 mice per group). Data represent the mean ± SEM. Two-way ANOVA, Bonferroni’s test (D) or one-way ANOVA, Bonferroni’s test (E). (F) Photograph of xenograft tumors from nude mice inoculated with A375 cells from the indicated groups (n = 6 mice per group). (G) Ki67 staining showing proliferation of A375 xenograft tumors with PTPN23 depletion or Vemu treatment. Scale bar, 50 μm. (H) Relative cell number of Vemu-Res A375 and SK-MEL-28 cells with or without PTPN23 depletion. Cell viability was measured by the CCK8 assay after 72 h (n = 3). Unpaired t test. (I) Colony formation assay of Vemu-Res A375 and SK-MEL-28 cells with or without PTPN23 depletion. Colonies were stained with crystal violet after 14 days. ****P < 0.0001; ***P < 0.001; **P < 0.01; *P < 0.05; P > 0.05; not significant (ns).
PTPN23 silencing sensitizes BRAFV600Emelanoma cells to BRAFi. (A) Relative cell number of SK-MEL-28 cells with or without PTPN23 depletion treated with DMSO, Vemu (2 μM), or Dabr (2 μM. Cell viability was measured by the CCK8 assay after 72 h (n = 3). One-way ANOVA, Bonferroni’s test. (B) Colony formation assay of the indicated cells treated with DMSO, Vemu (2 μM), or Dabr (2 μM). Colonies were stained with crystal violet after 14 days. (C) Flow cytometric analysis of living and apoptotic cells of SK-MEL-28 cells treated with or without Vemu (2 μM) or Dabr (2 μM) after dox-induced PTPN23 depletion (n = 3). One-way ANOVA, Bonferroni’s test. (D) Immunoblot of indicated proteins in dox-induced PTPN23-depleted A375 or SK-MEL-28 cells treated with Vemu (2 μM) or Dabr (2 μM). (E) Relative cell number of parental or Vemu-Res A375 and SK-MEL-28 cells treated with Vemu (2 μM). Cell viability was measured by the CCK8 assay after 72 h (n = 3). Data represent the mean ± SEM. (F) Immunoblot of PTPN23 in parental or Vemu-Res A375 and SK-MEL-28 cells treated with or without Vemu. (G) Relative cell number of PTPN23-overexpressing A375 cells treated with DMSO, Vemu (2 μM), or Dabr (2 μM). Cell viability was measured by the CCK8 assay after 72 h (n = 3). One-way ANOVA, Bonferroni’s test. (H) Colony formation assay of the indicated A375 cells treated with DMSO, Vemu (2 μM), or Dabr (2 μM) starting from 2,000 cells. Colonies were stained with crystal violet after 14 days. (I) Relative cell number of PTPN23-overexpressing SK-MEL-28 cells treated with DMSO, Vemu (2 μM), or Dabr (2 μM). Cell viability was measured by the CCK8 assay after 72 h (n = 3). One-way ANOVA, Bonferroni’s test. (J) Colony formation assay of the indicated SK-MEL-28 cells treated with DMSO, Vemu (2 μM), or Dabr (2 μM). Colonies were stained with crystal violet after 14 days. ****P < 0.0001; ***P < 0.001; **P < 0.01. Source data are available for this figure: SourceData FS4.
PTPN23 silencing sensitizes BRAFV600Emelanoma cells to BRAFi. (A) Relative cell number of SK-MEL-28 cells with or without PTPN23 depletion treated with DMSO, Vemu (2 μM), or Dabr (2 μM. Cell viability was measured by the CCK8 assay after 72 h (n = 3). One-way ANOVA, Bonferroni’s test. (B) Colony formation assay of the indicated cells treated with DMSO, Vemu (2 μM), or Dabr (2 μM). Colonies were stained with crystal violet after 14 days. (C) Flow cytometric analysis of living and apoptotic cells of SK-MEL-28 cells treated with or without Vemu (2 μM) or Dabr (2 μM) after dox-induced PTPN23 depletion (n = 3). One-way ANOVA, Bonferroni’s test. (D) Immunoblot of indicated proteins in dox-induced PTPN23-depleted A375 or SK-MEL-28 cells treated with Vemu (2 μM) or Dabr (2 μM). (E) Relative cell number of parental or Vemu-Res A375 and SK-MEL-28 cells treated with Vemu (2 μM). Cell viability was measured by the CCK8 assay after 72 h (n = 3). Data represent the mean ± SEM. (F) Immunoblot of PTPN23 in parental or Vemu-Res A375 and SK-MEL-28 cells treated with or without Vemu. (G) Relative cell number of PTPN23-overexpressing A375 cells treated with DMSO, Vemu (2 μM), or Dabr (2 μM). Cell viability was measured by the CCK8 assay after 72 h (n = 3). One-way ANOVA, Bonferroni’s test. (H) Colony formation assay of the indicated A375 cells treated with DMSO, Vemu (2 μM), or Dabr (2 μM) starting from 2,000 cells. Colonies were stained with crystal violet after 14 days. (I) Relative cell number of PTPN23-overexpressing SK-MEL-28 cells treated with DMSO, Vemu (2 μM), or Dabr (2 μM). Cell viability was measured by the CCK8 assay after 72 h (n = 3). One-way ANOVA, Bonferroni’s test. (J) Colony formation assay of the indicated SK-MEL-28 cells treated with DMSO, Vemu (2 μM), or Dabr (2 μM). Colonies were stained with crystal violet after 14 days. ****P < 0.0001; ***P < 0.001; **P < 0.01. Source data are available for this figure: SourceData FS4.
We further explored the therapeutic potential of targeting PTPN23 in melanoma cells resistant to BRAFi. We developed Vemu-resistant (Vemu-Res) A375 and SK-MEL-28 cell lines through prolonged exposure to gradually increasing concentrations of Vemu, ultimately selecting for drug-resistant clones capable of proliferating in the presence of Vemu (2 μM in A375 or 1 μM in SK-MEL-28) (Fig. S4 E). Remarkably, we found that PTPN23 depletion significantly inhibited the growth of these Vemu-Res A375 and SK-MEL-28 cells (Fig. 5, H and I). Additionally, we compared PTPN23 protein levels in both parental and Vemu-Res variants of the A375 and SK-MEL-28 cell lines. While Vemu treatment substantially reduced PTPN23 expression in parental cells, its protein levels in the resistant cells remained unchanged by Vemu (Fig. S4 F). To further explore the potential role of PTPN23 in BRAF-mutant cancer treated with BRAFi, we assessed the impact of PTPN23 overexpression on the sensitivity of BRAF-mutant cells to BRAFi. We observed that PTPN23 overexpression reduced cell sensitivity to BRAFi (Fig. S4, G–J). These findings suggest that PTPN23 is a potential target for melanoma cells resistant to BRAFi.
PTPN23 is a therapeutic vulnerability of other BRAF-mutant cancers
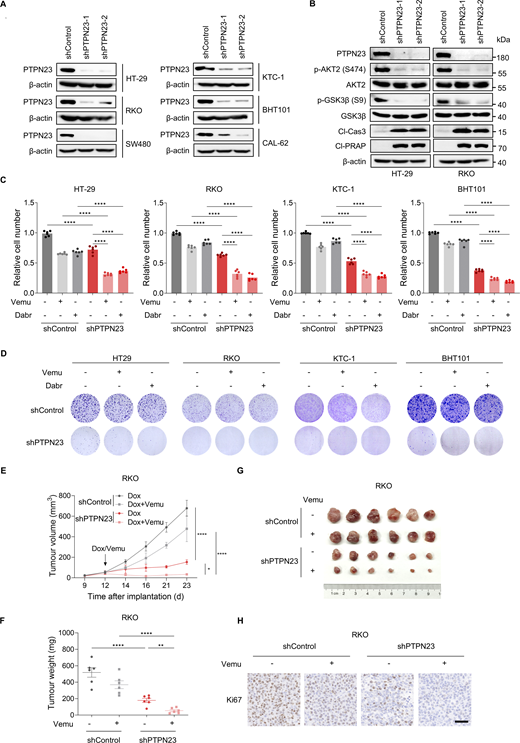
In addition to melanoma, BRAF mutations also occur in about 10% of CRC and 45% of papillary thyroid cancers and are often associated with poor prognosis (Morton et al., 2021). Inhibitors selective for BRAFV600E elicit only poor response rates in BRAF-mutant colorectal and thyroid cancers as single agents (Brose et al., 2016; Kopetz et al., 2015). To explore the potential role of PTPN23 in BRAF-mutant cancers, we analyzed PTPN23 levels using the UCSC Xena database, which includes data from 10,327 cancer samples, with 772 samples specifically from BRAF-mutant cancer patients. Our analysis revealed that PTPN23 expression is significantly higher in BRAF-mutant cancers compared with BRAF-WT cancers (Fig. 6 A). To confirm whether PTPN23 affects cell viability in BRAF-mutant cancers, we knocked down PTPN23 with shRNA in colorectal and thyroid cancer cell lines harboring WT or mutated BRAF (Fig. S5 A). Similar to melanoma, PTPN23 knockdown significantly impaired cell proliferation in BRAF-mutant CRC cells (HT-29 and RKO) and thyroid cancer cells (KTC-1 and BHT101) but had minimal effects in BRAF-WT CRC cells (SW480) and thyroid cancer cells (CAL-62) (Fig. 6, B and C). Immunoblotting results revealed that PTPN23 depletion inhibited phosphorylation of AKT2 and GSK3β, and increased cleavage of caspase-3 and PARP (Fig. S5 B). The inhibitory effects of PTPN23 silencing in vivo were also confirmed in the xenograft tumor assays with BRAF-mutant RKO cells (Fig. 6, D–G). To investigate the response of patient-derived BRAF-mutant CRC organoids to PTPN23 targeting, we analyzed their growth and apoptosis following PTPN23 knockdown. Organoids harboring the BRAFV600E mutation were transduced with the PTPN23-specific shRNA lentivirus, and subsequent changes in their growth and apoptosis were assessed. We observed significant growth suppression and induction of apoptosis in the BRAFV600E organoids following PTPN23 knockdown (Fig. 6, H–J). These findings demonstrate that PTPN23 plays a crucial role in sustaining growth and inhibiting apoptosis in BRAF-mutant tumors.

PTPN23 is a therapeutic vulnerability of other BRAF-mutant cancers. (A) Violin plot showing PTPN23 expression levels in BRAF-WT and BRAF-mutant cancer patients, based on data from the UCSC Xena database with MuTect2 Variant Aggregation and Masking. The dataset includes 10,327 cancer samples, of which 772 samples are from BRAF-mutant patients. Unpaired t test. (B) Relative cell number of HT-29, RKO, SW480, KTC-1, BHT101, and CAL-62 cells transfected with control shRNA (shControl) or PTPN23 shRNA (shPTPN23-1 and shPTPN23-2). Cell viability was measured by the CCK8 assay after 72 h (n = 6). Two-way ANOVA, Dunnett’s test. (C) Colony formation assay of the cells described in B. Colonies were stained with crystal violet after 14 days. (D and E) Tumor volume (D) and weight (E) of RKO xenografts in nude mice with dox-induced PTPN23 depletion. Mice were treated with a dox-supplemented diet (400 ppm) starting 11 days after implantation (n = 6 mice per group). Data represent the mean ± SEM. Two-way ANOVA, Bonferroni’s test (D) or unpaired t test (E). (F) Photograph of xenograft tumors from nude mice inoculated with RKO cells with dox-induced PTPN23 depletion (n = 6 mice per group). (G) Ki67 staining showing the proliferation of RKO xenograft tumors with PTPN23 depletion. Scale bar, 50 μm. (H and I) Representative images (H) and quantitative analysis (I) of growth in BRAFV600E colon tumor organoids with or without PTPN23 depletion (n = 3). Scale bar, 100 μm. One-way ANOVA, Dunnett’s test. (J) Apoptosis in colon tumor organoids with or without PTPN23 depletion, monitored by caspase-3/7 apoptosis assay in a live-cell analysis system (n = 2). Data represent the mean ± SEM. Two-way ANOVA, Bonferroni’s test. ****P < 0.0001; **P < 0.01; P > 0.05; not significant (ns).
PTPN23 is a therapeutic vulnerability of other BRAF-mutant cancers. (A) Violin plot showing PTPN23 expression levels in BRAF-WT and BRAF-mutant cancer patients, based on data from the UCSC Xena database with MuTect2 Variant Aggregation and Masking. The dataset includes 10,327 cancer samples, of which 772 samples are from BRAF-mutant patients. Unpaired t test. (B) Relative cell number of HT-29, RKO, SW480, KTC-1, BHT101, and CAL-62 cells transfected with control shRNA (shControl) or PTPN23 shRNA (shPTPN23-1 and shPTPN23-2). Cell viability was measured by the CCK8 assay after 72 h (n = 6). Two-way ANOVA, Dunnett’s test. (C) Colony formation assay of the cells described in B. Colonies were stained with crystal violet after 14 days. (D and E) Tumor volume (D) and weight (E) of RKO xenografts in nude mice with dox-induced PTPN23 depletion. Mice were treated with a dox-supplemented diet (400 ppm) starting 11 days after implantation (n = 6 mice per group). Data represent the mean ± SEM. Two-way ANOVA, Bonferroni’s test (D) or unpaired t test (E). (F) Photograph of xenograft tumors from nude mice inoculated with RKO cells with dox-induced PTPN23 depletion (n = 6 mice per group). (G) Ki67 staining showing the proliferation of RKO xenograft tumors with PTPN23 depletion. Scale bar, 50 μm. (H and I) Representative images (H) and quantitative analysis (I) of growth in BRAFV600E colon tumor organoids with or without PTPN23 depletion (n = 3). Scale bar, 100 μm. One-way ANOVA, Dunnett’s test. (J) Apoptosis in colon tumor organoids with or without PTPN23 depletion, monitored by caspase-3/7 apoptosis assay in a live-cell analysis system (n = 2). Data represent the mean ± SEM. Two-way ANOVA, Bonferroni’s test. ****P < 0.0001; **P < 0.01; P > 0.05; not significant (ns).
PTPN23 is a therapeutic vulnerability of other BRAF-mutant cancers. (A) Immunoblot of indicated proteins after dox-induced PTPN23 knockdown in HT-29, RKO, SW480, KTC-1, BHT101, and CAL-62 cells. (B) Immunoblot of indicated proteins in HT-29 and RKO cells with dox-induced knockdown of PTPN23. (C) Relative cell number of PTPN23-depleted cells treated with DMSO, Vemu (2 μM), or Dabr (2 μM). Cell viability was measured by the CCK8 assay after 72 h (n = 6). One-way ANOVA, Bonferroni’s test. (D) Colony formation assay of PTPN23-depleted cells treated with DMSO, Vemu (2 μM), or Dabr (2 μM). Colonies were stained with crystal violet after 14 days. (E and F) Tumor volume (E) and weight (F) of RKO xenografts in nude mice. RKO cells expressing dox-inducible shRNA targeting PTPN23 or control shRNA were subcutaneously inoculated. Mice were given a dox-supplemented diet (400 ppm) or gavage administration of Vemu (20 mg/kg) per day starting 12 days after implantation (n = 6 mice per group). Data represent the mean ± SEM. Two-way ANOVA, Bonferroni’s test (E) or one-way ANOVA, Bonferroni’s test (F). (G) Photograph of xenograft tumors from nude mice inoculated with RKO cells with or without PTPN23 knockdown and Vemu treatment. (H) Ki67 staining showing the proliferation of PTPN23-depleted RKO xenograft tumors with or without Vemu treatment. Scale bar, 50 μm. ****P < 0.0001; **P < 0.01. Source data are available for this figure: SourceData FS5.
PTPN23 is a therapeutic vulnerability of other BRAF-mutant cancers. (A) Immunoblot of indicated proteins after dox-induced PTPN23 knockdown in HT-29, RKO, SW480, KTC-1, BHT101, and CAL-62 cells. (B) Immunoblot of indicated proteins in HT-29 and RKO cells with dox-induced knockdown of PTPN23. (C) Relative cell number of PTPN23-depleted cells treated with DMSO, Vemu (2 μM), or Dabr (2 μM). Cell viability was measured by the CCK8 assay after 72 h (n = 6). One-way ANOVA, Bonferroni’s test. (D) Colony formation assay of PTPN23-depleted cells treated with DMSO, Vemu (2 μM), or Dabr (2 μM). Colonies were stained with crystal violet after 14 days. (E and F) Tumor volume (E) and weight (F) of RKO xenografts in nude mice. RKO cells expressing dox-inducible shRNA targeting PTPN23 or control shRNA were subcutaneously inoculated. Mice were given a dox-supplemented diet (400 ppm) or gavage administration of Vemu (20 mg/kg) per day starting 12 days after implantation (n = 6 mice per group). Data represent the mean ± SEM. Two-way ANOVA, Bonferroni’s test (E) or one-way ANOVA, Bonferroni’s test (F). (G) Photograph of xenograft tumors from nude mice inoculated with RKO cells with or without PTPN23 knockdown and Vemu treatment. (H) Ki67 staining showing the proliferation of PTPN23-depleted RKO xenograft tumors with or without Vemu treatment. Scale bar, 50 μm. ****P < 0.0001; **P < 0.01. Source data are available for this figure: SourceData FS5.
Subsequently, we investigated whether PTPN23 downregulation enhanced the inhibitory effect of BRAFi in colorectal and thyroid cancer cells. Consistently, cell growth was significantly inhibited when the BRAFi were combined with dox-induced PTPN23 depletion in cell viability, colony formation, and xenograft tumor assays (Fig. S5, C–H). Collectively, these data indicate that PTPN23 silencing, alone or in combination with BRAFi, effectively inhibits the growth of BRAF-mutant cancer.
Pharmacological targeting of PI3KC2α inhibits the growth of BRAF-mutant cancer
To further explore the therapeutic potential of targeting PI3KC2α-AKT signaling for treatment of BRAF-mutant cancers, we exploited the specific inhibitors of PI3KC2α and AKT2 to investigate their effects on cell growth. PITCOIN1 was recently developed as a potent and highly selective small-molecule inhibitor of PI3KC2α catalytic activity (Lo et al., 2023), confirmed by the reduction of fluorescence intensity of PI(3,4)P2 following PITCOIN1 treatment in A375 and SK-MEL-28 cells (Fig. 7, A and B). Despite previous reports of negligible cytotoxicity in cell lines with BRAF WT (HeLa, Cos7, HEK293, HepG2) at concentrations up to 100 µM, we observed a marked decrease in cell viability in BRAF-mutant A375 and SK-MEL-28 melanoma cells, an effect not seen in SK-MEL-2 and SK-MEL-103 cells with BRAF WT (Fig. 7, C and D). Next, we determined whether the treatment effects of PITCOIN1 are mediated by inhibiting PI3KC2α-AKT signaling. Similar to the silencing of PTPN23 or PI3KC2α, treatment with PITCOIN1 inhibited phosphorylation of AKT2 and GSK3β and induced cleavage of PARP and caspase-3 (Fig. 7 E). Xenograft tumor assays further demonstrated the efficacy of PITCOIN1 in suppressing BRAF-mutant A375 tumor growth and survival (Fig. 7, F–I). We also observed the inhibitory effects of PITCOIN1 on BRAF-mutant HT-29 and RKO colon cancer cells (Fig. 7 J). To examine the response of patient-derived BRAF-mutant CRC organoids to PITCOIN1 treatment, the organoids were treated with either PITCOIN1 or DMSO and the effects on growth and apoptosis were subsequently measured. PITCOIN1 treatment effectively inhibited organoid growth and induced apoptosis (Fig. 7, K–M). These observations suggest a potential antitumor role of PITCOIN1 in BRAF-mutant cancers. We also evaluated the therapeutic potential of PITCOIN1 in BRAFi-resistant melanoma cells. PITCOIN1 significantly inhibited the growth of Vemu-Res A375 and SK-MEL-28 cells (Fig. 8, A and B). Cell-derived xenograft assays showed that treating with PITCOIN1 inhibited the tumor growth of Vemu-Res A375 and induced apoptosis (Fig. 8, C–F). These results suggest that the PI3KC2α inhibitor effectively suppresses the growth of BRAF-mutant cancers.
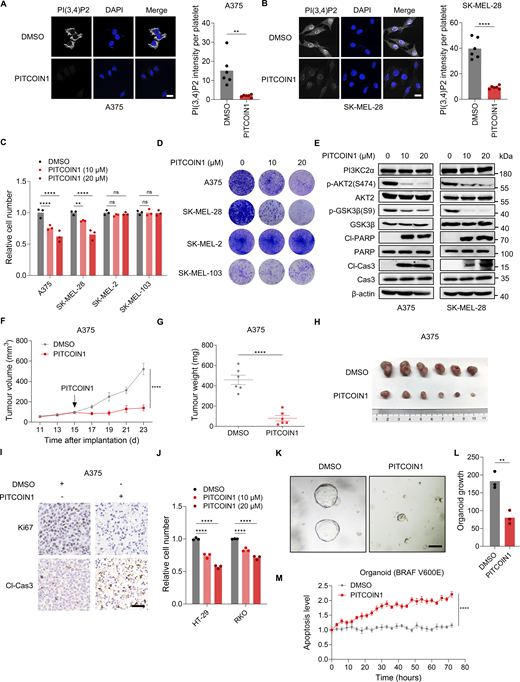
Pharmacological targeting of PI3KC2α inhibits the growth of BRAF-mutant cancers. (A and B) Immunofluorescence images (A) and quantitative analysis (B) showing PI(3,4)P2 levels after PITCOIN1 treatment (20 μM) in A375 and SK-MEL-28 cells (n = 6). Scale bar, 20 μm. Unpaired t test. (C) Relative cell number of A375, SK-MEL-28, SK-MEL-2, and SK-MEL-103 cells treated with DMSO or 10 or 20 μM PITCOIN1. Cell viability was measured by the CellTiter-Glo assay after 72 h (n = 3). Two-way ANOVA, Dunnett’s test. (D) Colony formation assay of the indicated cells after treatment with DMSO or 10 or 20 μM PITCOIN1. Colonies were stained with crystal violet after 14 days. (E) Immunoblot of indicated proteins in A375 and SK-MEL-28 cells treated with DMSO or 10 or 20 μM PITCOIN1. (F and G) Tumor volume (F) and weight (G) of A375 xenografts in nude mice. Mice were treated with gavage administration of PITCOIN1 (10 mg/kg) per day starting at day 15 (n = 6 mice per group). Data represent the mean ± SEM. Two-way ANOVA, Bonferroni’s test (F) or unpaired t test (G). (H) Photographs of A375 xenograft tumors treated with DMSO or PITCOIN1. (I) Ki67 and cleaved caspase-3 staining of A375 xenograft tumors treated with DMSO or PITCOIN1. Scale bar, 50 μm. (J) Relative cell number of HT-29 and RKO cells treated with DMSO or 10 or 20 μM PITCOIN1. Cell viability was measured by the CellTiter-Glo assay after 72 h (n = 3). Two-way ANOVA, Dunnett’s test. (K and L) Representative images (K) and quantitative analysis (L) of growth of BRAFV600E colon tumor organoids treated with DMSO or 20 μM PITCOIN1 (n = 3). Scale bar, 100 μm. Unpaired t test (L). (M) Apoptosis monitoring in colon tumor organoids treated with DMSO or 20 μM PITCOIN1, assessed using a caspase-3/7 apoptosis assay in a live-cell analysis system (n = 2). Data represent the mean ± SEM. Two-way ANOVA, Bonferroni’s test. ****P < 0.0001; **P < 0.01; P > 0.05; not significant (ns). Source data are available for this figure: SourceData F7.
Pharmacological targeting of PI3KC2α inhibits the growth of BRAF-mutant cancers. (A and B) Immunofluorescence images (A) and quantitative analysis (B) showing PI(3,4)P2 levels after PITCOIN1 treatment (20 μM) in A375 and SK-MEL-28 cells (n = 6). Scale bar, 20 μm. Unpaired t test. (C) Relative cell number of A375, SK-MEL-28, SK-MEL-2, and SK-MEL-103 cells treated with DMSO or 10 or 20 μM PITCOIN1. Cell viability was measured by the CellTiter-Glo assay after 72 h (n = 3). Two-way ANOVA, Dunnett’s test. (D) Colony formation assay of the indicated cells after treatment with DMSO or 10 or 20 μM PITCOIN1. Colonies were stained with crystal violet after 14 days. (E) Immunoblot of indicated proteins in A375 and SK-MEL-28 cells treated with DMSO or 10 or 20 μM PITCOIN1. (F and G) Tumor volume (F) and weight (G) of A375 xenografts in nude mice. Mice were treated with gavage administration of PITCOIN1 (10 mg/kg) per day starting at day 15 (n = 6 mice per group). Data represent the mean ± SEM. Two-way ANOVA, Bonferroni’s test (F) or unpaired t test (G). (H) Photographs of A375 xenograft tumors treated with DMSO or PITCOIN1. (I) Ki67 and cleaved caspase-3 staining of A375 xenograft tumors treated with DMSO or PITCOIN1. Scale bar, 50 μm. (J) Relative cell number of HT-29 and RKO cells treated with DMSO or 10 or 20 μM PITCOIN1. Cell viability was measured by the CellTiter-Glo assay after 72 h (n = 3). Two-way ANOVA, Dunnett’s test. (K and L) Representative images (K) and quantitative analysis (L) of growth of BRAFV600E colon tumor organoids treated with DMSO or 20 μM PITCOIN1 (n = 3). Scale bar, 100 μm. Unpaired t test (L). (M) Apoptosis monitoring in colon tumor organoids treated with DMSO or 20 μM PITCOIN1, assessed using a caspase-3/7 apoptosis assay in a live-cell analysis system (n = 2). Data represent the mean ± SEM. Two-way ANOVA, Bonferroni’s test. ****P < 0.0001; **P < 0.01; P > 0.05; not significant (ns). Source data are available for this figure: SourceData F7.

Pharmacological targeting of PI3KC2α inhibits the growth of BRAFi-resistant cancers. (A) Relative cell number of Vemu-Res A375 and SK-MEL-28 cells treated with DMSO or PITCOIN1. Cell viability was measured by the CellTiter-Glo assay after 72 h (n = 3). One-way ANOVA, Dunnett’s test. (B) Colony formation assay of the indicated cells after treatment with DMSO or PITCOIN1. Colonies were stained with crystal violet after 14 days. (C and D) Volume (C) and weight (D) of Vemu-Res A375 tumors in nude mice treated with gavage administration of PITCOIN1 (10 mg/kg) per day starting at day 10 (n = 6 mice per group). Data represent the mean ± SEM. Two-way ANOVA, Bonferroni’s test (C) or unpaired t test (D). (E) Photograph of Vemu-Res A375 tumors from nude mice treated with DMSO or PITCOIN1. (F) Ki67 or cleaved caspase-3 staining of Vemu-Res A375 xenograft tumors treated with DMSO or PITCOIN1 (10 mg/kg). Scale bar, 50 μm. ****P < 0.0001; **P < 0.01; *P < 0.05.
Pharmacological targeting of PI3KC2α inhibits the growth of BRAFi-resistant cancers. (A) Relative cell number of Vemu-Res A375 and SK-MEL-28 cells treated with DMSO or PITCOIN1. Cell viability was measured by the CellTiter-Glo assay after 72 h (n = 3). One-way ANOVA, Dunnett’s test. (B) Colony formation assay of the indicated cells after treatment with DMSO or PITCOIN1. Colonies were stained with crystal violet after 14 days. (C and D) Volume (C) and weight (D) of Vemu-Res A375 tumors in nude mice treated with gavage administration of PITCOIN1 (10 mg/kg) per day starting at day 10 (n = 6 mice per group). Data represent the mean ± SEM. Two-way ANOVA, Bonferroni’s test (C) or unpaired t test (D). (E) Photograph of Vemu-Res A375 tumors from nude mice treated with DMSO or PITCOIN1. (F) Ki67 or cleaved caspase-3 staining of Vemu-Res A375 xenograft tumors treated with DMSO or PITCOIN1 (10 mg/kg). Scale bar, 50 μm. ****P < 0.0001; **P < 0.01; *P < 0.05.
We further explored the therapeutic potential of targeting AKT2 in BRAF-mutant cancers with the selective AKT2 inhibitor CCT128930 (Yap et al., 2011). Our findings revealed that CCT128930 markedly suppressed the proliferation of various BRAF-mutant cancer cell lines, including A375, SK-MEL-28, WM2664, SK-MEL-5, HT-29, RKO, KTC-1, and BHT101. In contrast, BRAF-WT cancer cell lines (SK-MEL-2, SK-MEL-103, MUM2B, and MeWo) were barely affected (Fig. 9 A). Interestingly, at high concentrations, CCT128930 also reduced the viability of SK-MEL-2 cells, suggesting potential off-target effects (Yap et al., 2011). Treatment with CCT128930 effectively diminished phosphorylation of GSK3β, decreased BCL-2 expression and induced cleavage of caspase-3, without altering ERK1/2 phosphorylation (Fig. 9 B). This indicates that CCT128930 exerts its antiproliferative effects primarily through the AKT signaling pathway. In addition, we investigated the effects of CCT128930 in Vemu-Res melanoma cells. Notably, targeting AKT2 with CCT128930 inhibited the growth of Vemu-Res melanoma cells both in vitro and in xenograft models (Fig. 9, C–H). Collectively, these data demonstrate that pharmacological targeting of the PI3KC2α-AKT signaling axis provides a potential therapeutic strategy for treatment of BRAF-mutant cancers.
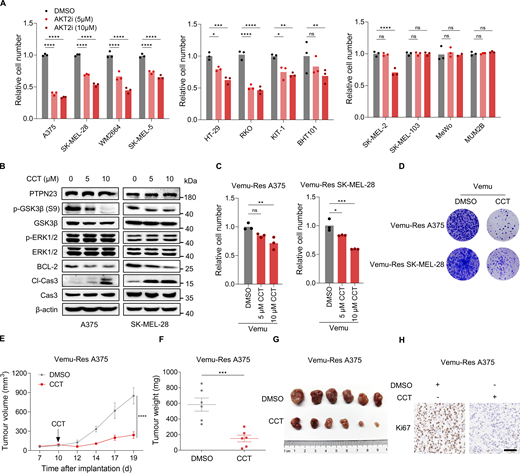
Pharmacological targeting of AKT2 inhibits the growth of BRAF-mutant cancers. (A) Relative cell number of BRAF-mutant cancer cells (A375, SK-MEL-28, WM2664, and SK-MEL-5 melanoma cells, HT-29 and RKO CRC cells, and KTC-1 and BHT101 thyroid cancer cells) and BRAF-WT melanoma cells (SK-MEL-2, SK-MEL-103, MeWo, and MUM2B) treated with DMSO or 5 or 10 μM CCT128930 (CCT) for 72 h. Cell viability was measured by the CCK8 assay after 72 h (n = 3). Two-way ANOVA, Dunnett’s test. (B) Immunoblot showing indicated protein levels in A375 and SK-MEL-28 cells treated with DMSO or 5 or 10 μM CCT128930 (CCT). (C) Relative cell number of Vemu-Res A375 and SK-MEL-28 cells treated with DMSO or 5 or 10 μM CCT128930 (CCT). Cell viability was measured by the CCK8 assay after 72 h (n = 3). One-way ANOVA, Dunnett’s test. (D) Colony formation assay of the indicated cells after treatment with DMSO or CCT. Colonies were stained with crystal violet after 14 days. (E and F) Volume (E) and weight (F) of Vemu-Res A375 tumors in nude mice treated with an intraperitoneal injection of CCT128930 (CCT) (15 mg/kg) five times per week starting at day 10 (n = 6 mice per group). Data represent the mean ± SEM. Two-way ANOVA, Bonferroni’s test (E) or unpaired t test (F). (G) Photograph of Vemu-Res A375 tumors from nude mice treated with DMSO or CCT128930 (CCT). (H) Ki67 staining of Vemu-Res A375 xenograft tumors treated with DMSO or CCT128930 (CCT) (15 mg/kg). Scale bar, 50 μm. ****P < 0.0001; ***P < 0.001; **P < 0.01; *P < 0.05; P > 0.05; not significant (ns). Source data are available for this figure: SourceData F9.
Pharmacological targeting of AKT2 inhibits the growth of BRAF-mutant cancers. (A) Relative cell number of BRAF-mutant cancer cells (A375, SK-MEL-28, WM2664, and SK-MEL-5 melanoma cells, HT-29 and RKO CRC cells, and KTC-1 and BHT101 thyroid cancer cells) and BRAF-WT melanoma cells (SK-MEL-2, SK-MEL-103, MeWo, and MUM2B) treated with DMSO or 5 or 10 μM CCT128930 (CCT) for 72 h. Cell viability was measured by the CCK8 assay after 72 h (n = 3). Two-way ANOVA, Dunnett’s test. (B) Immunoblot showing indicated protein levels in A375 and SK-MEL-28 cells treated with DMSO or 5 or 10 μM CCT128930 (CCT). (C) Relative cell number of Vemu-Res A375 and SK-MEL-28 cells treated with DMSO or 5 or 10 μM CCT128930 (CCT). Cell viability was measured by the CCK8 assay after 72 h (n = 3). One-way ANOVA, Dunnett’s test. (D) Colony formation assay of the indicated cells after treatment with DMSO or CCT. Colonies were stained with crystal violet after 14 days. (E and F) Volume (E) and weight (F) of Vemu-Res A375 tumors in nude mice treated with an intraperitoneal injection of CCT128930 (CCT) (15 mg/kg) five times per week starting at day 10 (n = 6 mice per group). Data represent the mean ± SEM. Two-way ANOVA, Bonferroni’s test (E) or unpaired t test (F). (G) Photograph of Vemu-Res A375 tumors from nude mice treated with DMSO or CCT128930 (CCT). (H) Ki67 staining of Vemu-Res A375 xenograft tumors treated with DMSO or CCT128930 (CCT) (15 mg/kg). Scale bar, 50 μm. ****P < 0.0001; ***P < 0.001; **P < 0.01; *P < 0.05; P > 0.05; not significant (ns). Source data are available for this figure: SourceData F9.
PTPN23 knockout inhibits BRAFV600E-driven melanomagenesis in vivo
To better understand the role of PTPN23 in oncogenic BRAF-dependent melanoma in vivo, we generated conditional PTPN23-knockout C57BL/6J mice (Ptpn23LoxP/LoxP). Given that Ptpn23 homozygous gene deletion in mice resulted in embryonic lethality (Gingras et al., 2009a), a LoxP-flanked mouse Ptpn23 gene of exons 3–4 was subcloned into a CRISPR/Cas9-mediated homologous recombination vector targeting the Ptpn23 gene locus and injected into single-cell embryos of C57BL/6J mice (Fig. 10 A). The Ptpn23LoxP/LoxP C57BL/6J mice were born at the expected Mendelian frequency and developed normally. To spatiotemporally control Ptpn23 gene deletion, Ptpn23LoxP/LoxP mice were intercrossed with the Tyr-CreERT2 mice that express a CreERT2 fusion recombinase directed by the melanocyte-specific tyrosinase promoter/enhancer to achieve Tyr-CreERT2; Ptpn23LoxP/LoxP mice. The melanocyte-specific knockout of Ptpn23 was induced with tamoxifen injection, and Ptpn23 deletion efficacy was confirmed by immunoblotting (Fig. 10 B). Neither melanocytic hyperplasia nor pigmentation abnormality was observed in Tyr-CreERT2; Ptpn23−/− mice.
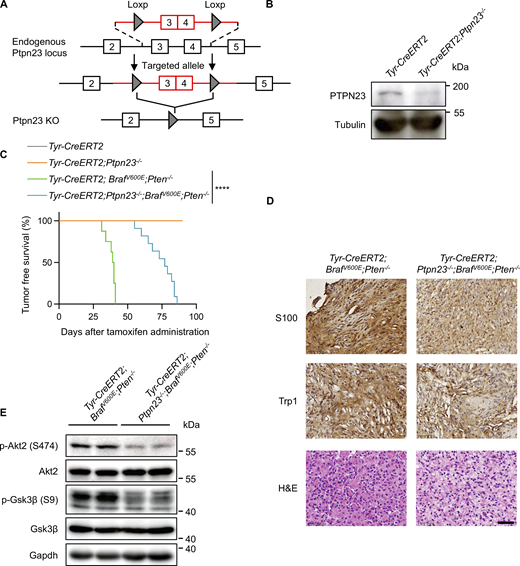
PTPN23 knockout inhibits BRAFV600E-driven melanomagenesis in vivo. (A) Schematic illustrating the generation of Ptpn23LoxP/LoxP knock-in allele. (B) Immunoblot showing protein levels of Ptpn23 in mouse primary melanocytes isolated from Tyr-CreERT2 or Tyr-CreERT2; Ptpn23LoxP/LoxP mice treated with tamoxifen. (C) Melanoma-free survival. Tyr-CreERT2 (n = 14), Tyr-CreERT2; Ptpn23−/− (n = 12). Tyr-CreERT2; BrafV600E; Pten−/− (n = 8) and Tyr-CreERT2; BrafV600E; Pten−/−; Ptpn23−/− (n = 11) mice were administrated with an intraperitoneal injection of tamoxifen, and the development of melanoma was observed for up to 90 days. Statistical analysis was conducted using log-rank (Mantel–Cox) and two-sided Gehan–Breslow–Wilcoxon tests. ****P < 0.0001. (D) Representative hematoxylin and eosin staining and IHC staining with antibodies against S100 and Trp1 of melanoma tissue sections from Tyr-CreERT2; BrafV600E; Pten−/− and Tyr-CreERT2; BrafV600E; Pten−/−; Ptpn23−/− mice. Scale bar, 50 μm. (E) Immunoblot analysis showing indicated protein levels of melanoma tissues from Tyr-CreERT2; BrafV600E; Pten−/− and Tyr-CreERT2; BrafV600E; Pten−/−; Ptpn23−/− mice. Source data are available for this figure: SourceData F10.
PTPN23 knockout inhibits BRAFV600E-driven melanomagenesis in vivo. (A) Schematic illustrating the generation of Ptpn23LoxP/LoxP knock-in allele. (B) Immunoblot showing protein levels of Ptpn23 in mouse primary melanocytes isolated from Tyr-CreERT2 or Tyr-CreERT2; Ptpn23LoxP/LoxP mice treated with tamoxifen. (C) Melanoma-free survival. Tyr-CreERT2 (n = 14), Tyr-CreERT2; Ptpn23−/− (n = 12). Tyr-CreERT2; BrafV600E; Pten−/− (n = 8) and Tyr-CreERT2; BrafV600E; Pten−/−; Ptpn23−/− (n = 11) mice were administrated with an intraperitoneal injection of tamoxifen, and the development of melanoma was observed for up to 90 days. Statistical analysis was conducted using log-rank (Mantel–Cox) and two-sided Gehan–Breslow–Wilcoxon tests. ****P < 0.0001. (D) Representative hematoxylin and eosin staining and IHC staining with antibodies against S100 and Trp1 of melanoma tissue sections from Tyr-CreERT2; BrafV600E; Pten−/− and Tyr-CreERT2; BrafV600E; Pten−/−; Ptpn23−/− mice. Scale bar, 50 μm. (E) Immunoblot analysis showing indicated protein levels of melanoma tissues from Tyr-CreERT2; BrafV600E; Pten−/− and Tyr-CreERT2; BrafV600E; Pten−/−; Ptpn23−/− mice. Source data are available for this figure: SourceData F10.
To determine whether loss of Ptpn23 affects melanomagenesis in the presence of oncogenic BrafV600E and Ptennull mutation, Tyr-CreERT2; Ptpn23LoxP/LoxP mice were crossed with BrafV600E; PtenLoxP/LoxP mice to generate Tyr-CreERT2; BrafV600E; PtenLoxP/LoxP; Ptpn23LoxP/LoxP mice. The BRAFV600E expression, PTEN deletion, and Ptpn23 deletion in melanocytes were induced by tamoxifen administration. Specifically, Tyr-CreERT2; BrafV600E; Pten−/− mice developed melanoma between 31 and 41 days after the tamoxifen injection, while Tyr-CreERT2; BrafV600E; Pten−/−; Ptpn23−/− mice developed melanoma between 55 and 86 days, suggesting the melanomagenesis was substantially delayed by Ptpn23 knockout in melanocytes (Fig. 10 C). Additionally, we assayed the melanoma samples in both groups of Tyr-CreERT2; BrafV600E; Pten−/− mice and Tyr-CreERT2; BrafV600E; Pten−/−; Ptpn23−/− mice and observed similar melanoma morphological and histologic features (Fig. 10 D). However, the immunoblotting results exhibited a decreased phosphorylation of AKT2 and GSK3β in melanoma of Tyr-CreERT2; BrafV600E; Pten−/−; Ptpn23−/− mice (Fig. 10 E). Taken together, these results reveal that the knockout of Ptpn23 inhibits BRAFV600E-driven melanomagenesis in vivo.
Discussion
Despite the recent successful development of BRAFV600E-specific inhibitors and their impressive response rates in BRAFV600E melanoma, a consistently effective targeted treatment strategy for the majority of patients with BRAF-mutant cancers remains a critical challenge, mainly due to unresponsiveness and drug resistance to BRAFi arising from different mechanisms. Thus, we endeavored to uncover new vulnerabilities that can serve as alternatives or complements to BRAFi. We performed a high-throughput CRISPR screening and identified PTPN23 as an essential gene in BRAF-mutant melanoma cells. In agreement with our results, an analysis of previous screening studies also revealed that PTPN23 ranks highly and is the highest-ranking member of the PTPN family in the GeCKO screening in the human melanoma cell line A375 with BRAFV600E mutation, but not the human stem cell line HUES62 with BRAF WT (Shalem et al., 2014). We discovered that PTPN23 is critical for the survival of BRAF-mutant cancer cells in vitro and in vivo. Our findings were recapitulated across multiple cell lines, cancer types, and mouse models, and specific to those with oncogenic BRAF mutations but not BRAF WT. Transcriptomics and proteomics analyses identified that PTPN23 is associated with PI3K-AKT signaling involving PI3KC2α and AKT2, but not class I PI3K or AKT1. Mechanically, PTPN23 acts as a scaffold protein and contributes to phosphorylation and activation of PI3KC2α by WNK3, which promotes the production of PI(3,4)P2 for subsequent AKT2 activation to support cell survival. Genetic or pharmacological targeting of the PTPN23-PI3KC2α-AKT axis, either alone or in combination with BRAFi, resulted in effective tumor growth suppression of BRAF-mutant melanoma and other cancers both in vitro and in tumor xenograft models. We also constructed the melanocyte-specific PTPN23-knockout mouse model and demonstrated that PTPN23 deletion significantly suppressed BRAFV600E-driven melanomagenesis in mouse melanoma models. Our study uncovers the unanticipated dependence of BRAF-mutant cancers on PTPN23-PI3KC2α-AKT signaling, providing strategies to tackle the challenge of unresponsiveness and drug resistance to BRAFi.
PTPN23 is a highly conserved alternative component of the ESCRT pathway pivotal for membrane protein trafficking (Doyotte et al., 2008). PTPN23 functions as a scaffold for recruiting several ESCRT components, including the ESCRT-0 subunit STAM2, ESCRT-I subunits UBAP1 and TSG101, and ESCRT-III subunit CHMP4B (Wang et al., 2023). Recent studies indicate that PTPN23 promotes multivesicular body sorting and lysosomal degradation of several oncogenic receptors, such as EGFR, PDGFR, and integrins, and elicits tumor-suppressive activities (Ma et al., 2015; Manteghi et al., 2016; Singh et al., 2023). It was also reported that loss of PTPN23 promotes RAS-driven lung tumorigenesis (Seong et al., 2023, Preprint). In contrast, our current study provides evidence that PTPN23 activates PI3KC2α signaling and promotes cell survival and tumor initiation, specifically in the context of BRAF-mutant cancers. We also confirmed that PTPN23 is a catalytically inactive tyrosine phosphatase (Gingras et al., 2009b) and intriguingly enhances the phosphorylation level of PI3KC2α at S329 by WNK3 to activate the downstream AKT2 signaling pathway and support cell survival. Likewise, it was recently reported that PTPN23 regulates the survival motor neuron complex localization by protecting its phosphorylation state (Husedzinovic et al., 2015). These findings not only underscore the multifaceted roles of PTPN23 in cancer biology but also raise questions about its context-dependent nature, warranting further investigation to elucidate the underlying mechanisms and therapeutic implications.
PI3Ks are a family of lipid enzymes that phosphorylate phosphatidylinositols (PIPs) on the plasma membrane and intracellular compartments, which can act as second messengers to activate numerous signaling pathways critical for cell survival, proliferation, and metabolism (Burke et al., 2023). While a considerable volume of research has been dedicated to investigating the class I PI3Ks, emerging data suggest that the class II PI3Ks, including PI3KC2α, PI3KC2β, and PI3KC2γ isoforms, offer unique and significant contributions to the dynamic landscape of cell biology and diseases. PI3KC2α regulates clathrin-mediated endocytic vesicle formation, recycling of receptors including VEGF and TGF-β and cytokinesis (Aki et al., 2015; Gaidarov et al., 2001; Gulluni et al., 2021; Posor et al., 2013; Yoshioka et al., 2012). It was reported that PI3KC2α produces PI(3,4)P2 in the EE to specifically activate AKT2 in thyroid cancer (Li Chew et al., 2015) and facilitates mitotic spindle assembly and genomic stability in breast cancer (Gulluni et al., 2017; Rodgers et al., 2021), implicating the important roles of PI3KC2α in cancer. Recent studies revealed that PI3KC2β-mediated synthesis of PI(3,4)P2 at late endosomes negatively regulates mTORC1 activity (Marat et al., 2017) and PI3KC2γ localizes on EE to promote PI(3,4)P2 accumulation and selectively support sustained AKT2 activation downstream of insulin signaling in the liver (Braccini et al., 2015). In line with the involvement of a spatially restricted subcellular compartmentalization for signal transduction, our study revealed that PTPN23 localizes to the endosomes and maintains the phosphorylation of PI3KC2α at S329, which is required for the catalytic activity of PI3KC2α for PI(3,4)P2 production and subsequent selective activation of AKT2 in endosomes. Interestingly, AKT1 is also detected at the endosomes (Goto-Silva et al., 2019), but its phosphorylation does not appear to be regulated by PTPN23 and PI3KC2α. The exact mechanism underlying the selective regulation of AKT2 signaling by the PTPN23-PI3KC2α axis remains to be studied.
Taken together, our results demonstrate that PTPN23 is specifically required for the survival of BRAF-mutant cancer cells through promoting selective activation of the PI3KC2α-AKT signaling pathway. Targeting the PTPN23-PI3KC2α-AKT axis, either through genetic depletion or through pharmacological intervention, strongly suppresses the growth of BRAF-mutant cancers and stimulates the sensitivity to BRAFi. Therefore, this work offers a new therapeutic strategy to combat BRAF-mutant cancers.
Materials and methods
Cell lines and reagents
The cell lines YUMM1.7, B16, A375, SK-MEL-28, SK-MEL-5, SK-MEL-2, MeWo, HT-29, RKO, SW480, and HEK293T were obtained from the ATCC. WM115, WM2664, and MUM2B were obtained from iCELL Biotechnology. BHT101, KTC-1, and CAL-62 were obtained from Meisen CTCC. SK-MEL-103 was kindly shared by Dr. Jun Wan in Shenzhen PKU-HKUST Medical Centre (Shenzhen, China). A375, WM2664, SK-MEL-5, SK-MEL-2, SK-MEL-103, MeWo, SW480, BHT101, KTC-1, and HEK293T cell lines were cultured in DMEM (C11995500BT; Thermo Fisher Scientific) supplemented with 10% fetal bovine serum (FBS) (10099141C; Gibco) and 1% penicillin–streptomycin (P/S) (15140148; Gibco). B16, SK-MEL-28, MUM2B, HT-29, RKO, and CAL-62 cell lines were maintained in RPMI 1640 medium (C11875500BT; Thermo Fisher Scientific) supplemented with 10% FBS and 1% P/S. YUMM1.7 was cultured in DMEM/F-12 (11330057; Gibco) supplemented with 10% FBS, 1% MEM Non-Essential Amino Acids Solution (11140050; Gibco), and 1% P/S. All cell lines were authenticated by short tandem repeat genotyping and routinely tested for Mycoplasma contamination.
The following reagents were used for cell culture experiments: Z-VAD-FMK (S7023; Selleck), necrostatin-1 (S8037; Selleck), bafilomycin A1 (54645S; CST), Vemu (S1267; Selleck), Dabr (S2807; Selleck), CCT128930 (S2635; Selleck), and dox hyclate (D111943; Aladdin). PITCOIN1 was synthesized as previously reported (Lo et al., 2023).
DNA constructs
To downregulate PTPN23 in human and mouse cell lines, we used TetON-pLKO.1 shRNA lentiviral vectors (Guangzhou IGE Biotechnology) with the following sequences: shPTPN23-1, 5′-GCTCTTTGCTATTGAAATA-3′; shPTPN23-2, 5′-GGTCCTTACACTACATCAT-3′; shPtpn23-1, 5′-GCTGCAGTGTTCTTCGAAA-3′; shPtpn23-2, 5′-AGTTTGTCCTGAAGAATTA-3′.
To downregulate the indicated genes in human cell lines, we used pLKO.1 shRNA lentiviral vectors (Guangzhou IGE Biotechnology) with the following sequences: shPI3KC2α-1, 5′-AAGTGACTGACAATCAGAG-3′; shPI3KC2α-2, 5′-GACAGAACTTATAAAGTTA-3′; shWNK3-1, 5′-CAGAGTAGATGGTGATAAA-3′; shWNK3-2, 5′-GCTGGATACTCTTCTTTAA-3′; shPTPN23-3, 5′-GTCAGGTTCTGCTCCTTTA-3′; shPTPN23-4, 5′-CAGTGGGCACAGTCTCTTA-3′; shPTPN23-5, 5′-AGAAATGGGAGTAAGAGAC-3′; shPTPN23-6, 5′-TATTTCAATAGCAAAGAGC-3′.
For overexpression, Flag-PTPN23 and AKT2-V5 lentiviral plasmids were purchased from VectorBuilder (vector IDs: VB211222-1226tfv and VB240811-1137nxs) and HA-PI3KC2α was obtained from the Public Protein/Plasmid Library (PPL02255-2a).
To generate the active or inactive mutations of PTPN23, PI3KC2α, or AKT2, we used KOD-Plus-Mutagenesis Kit (SMK-101; TOYOBO) with the following primers: PTPN23-C1392S, 5′-CACAGCAGCTCTGGTGTGGGCCGCAC-3′ and 5′-CACAATGATGGGCGTGTGCAGCGGCC-3′; PTPN23-S1394A, 5′-GGCCCACACCAGCGCTGCAGTGCAC-3′ and 5′-GTGCACTGCAGCGCTGGTGTGGGCC-3′; PTPN23-C1392S-S1394A, 5′-CGGCCCACACCAGCGCTGCTGTGCACAATGATG-3′ and 5′-CATCATTGTGCACAGCAGCGCTGGTGTGGGCCG-3′; PI3KC2α-S329A, 5′-GCAACTGTTACAAGAAGCCAGTC-3′ and 5′-CACAGCAAGGGATTTTCCATTCACC-3′; PI3KC2α-S329D, 5′-CTTGTAACAGTTGCCACATCAAGGGATTTTCCATTCACCTTTCTTTCAA-3′ and 5′-CACATCAAGGGATTTTCCATTCACC-3′; and AKT2-S474D, 5′-CCACTTCCCCCAGTTCGACTACTCGGCCAGCATC-3′ and 5′-GATGCTGGCCGAGTAGTCGAACTGGGGGAAGTGG-3′.
Cell transfection and infection
Cells were seeded in 6-well plates and incubated overnight at 37°C with 5% CO2. The plates were then added with the premixed plasmid and Lipofectamine 2000 reagent for 6 h. For lentiviral production, HEK293T cells were transfected with target plasmids along with the lentiviral packaging plasmid psPAX2 and envelope plasmid pMD2.G using polyethylenimine as the transfection reagent. The viral supernatant was collected and used to transduce cells supplemented with 2.5 μg/ml polybrene. Infected cells were selected in 2 μg/ml puromycin. For the dox-induced TetON-PTPN23-knockdown system, cells were treated with 2 μM dox.
CRISPR screening
YUMM1.7 cells were transfected with Cas9-Blast (52962; Addgene) and then selected with 10 µg/ml blasticidin (3513-03-9; Selleck Chemicals) to establish a BRAF-mutant YUMM1.7-Cas9 stable cell line. Mouse CRISPR Deletion Library-drug targets, kinases, and phosphatases (1000000122; Addgene) was delivered to YUMM1.7-Cas9 cells via lentiviral infection with a multiplicity of infection of 0.3. After 24 h of transfection, the cells were subjected to selection with 3 μg/ml of puromycin (CAS 58-58-2; TargetMol) for 6 days. Cells were allocated into the control group, which were collected on day 0, and the experimental group, which were cultured for an additional 14 days before collection. The cells from each group were harvested at a library coverage of 1,000×, and three replicates were performed for each group. Genomic DNA was prepared using Blood & Cell Culture DNA Mini Kit (13362; QIAGEN). PCR was used to amplify the gRNA region, and sequencing to determine gRNA abundance was performed on Illumina NovaSeq 6000. Significantly enriched or depleted gRNAs from any comparison of conditions were identified using the MAGeCK algorithm.
Animal models
The conditional Ptpn23-knockout mouse model was generated by Shanghai Model Organisms. A homologous recombinant vector (donor vector) was constructed by in-fusion cloning, which contained a 3-kb 5′ homology arm, a 1.1-kb floxed region with exons 3–4 of Ptpn23, and a 3-kb 3′ homology arm. Cas9 mRNA, gRNA, and donor vector were microinjected into the fertilized eggs of C57BL/6J mice. Positive F1 generation mice were obtained by mating the positive F0 generation mice identified by PCR amplification and sequencing.
B6.129P2(Cg)-Braftm1Mmcm/J (Strain No. 017837) mice were purchased from the Jackson Laboratory, C57BL/6J-Ptenem1(flox)Cya mice (Strain No. S-CKO-04509) were purchased from Cyagen Biosciences, and H11-Tyr-CreERT2 mice (Strain No. T052715) were purchased from GemPharmatech. Genotypes were determined by PCR and gel electrophoresis. All mice were maintained on a C57BL/6J congenic background. All mouse experiments were performed under the Animal Research Ethics Committee–approved animal protocols at Shenzhen Bay Laboratory (AEYCQ202101) and Sun Yat-sen University (SYSU-IACUC-2023-001240).
Xenograft mouse models
To establish the xenograft model, 8–10-wk-old BALB/c nude mice (Guangdong Medical Laboratory Animal Center, Guangzhou, China) were subcutaneously inoculated in the right flank with 3 × 10⁶ cells suspended in 50% standard Matrigel (354234; Corning). Once tumors were palpable (∼100 mm3), mice were randomly assigned into control and experiment groups for treatment. The tumor size was recorded three times per week, and the volume was calculated by the following formula: 0.5 × length × width2. The administration was performed as follows: dox, daily feeding (400 ppm, dissolved in drinking water); Vemu, daily gavage administration (20 mg/kg, containing 4% DMSO, 30% PEG300, 5% Tween-80, and 61% ddH2O); PITCOIN1, daily gavage administration (10 mg/kg, containing 10% DMSO, 40% PEG300, 5% Tween-80, and 45% ddH2O); CCT128930, intraperitoneal injection five times per week (15 mg/kg, containing 5% DMSO, 40% PEG300, 5% Tween-80, and 50% ddH2O). At the endpoint, mice were euthanized with CO2 and tumors were excised for measurement of weight and further immunostaining analysis.
Cell viability assay
Cell viability was assayed using the Cell Counting Kit-8 (CCK8) assay (C0043; Beyotime) or CellTiter-Glo Luminescent Cell Viability Assay (G7572; Promega) according to the manufacturer’s instructions. In brief, 4,000 cells per well were seeded in the 96-well culture plates and incubated at 37°C under indicated treatment conditions. After 72 h, cells were treated with 100 μl/well CCK8 reagent for 1 h or 100 μl/well CellTiter-Glo reagent for 10 min. Absorbance at 450 nm (for CCK8) or luminescence (for CellTiter-Glo) was measured using a GloMax luminometer (Promega).
Colony formation assay
Cells with indicated treatments were seeded at a density of 4,000 cells per well in a 6-well plate (in triplicate) and then cultured for 14 days. Colonies were visualized by fixing the cells in 100% methanol and staining with crystal violet solution (C0121; Beyotime) for 20 min. After drying, images were captured using a scanner.
Cell apoptosis analysis
The cells were digested with 0.25% trypsin and resuspended in binding buffer after being washed twice with 4°C PBS. Then, the cells were stained with the Annexin V-APC/7-AAD apoptosis kit (AP105; Multi Sciences) and the percentage of the Annexin V-APC–positive dead cell population was analyzed using CytoFLEX LX Flow Cytometer (Beckman Coulter).
Organoid growth and apoptosis assay
Tumor organoid experiments were performed by AimingMed with the Ethics Committee–approved protocol (#COBD-000609). Specifically, the CRC tissue was cut into 0.5- to 1-mm3 small pieces in advanced DMEM/F12 and digested using the tumor organoid dissociation kit (100-050; AimingMed) for 40 min. Samples were collected and passed through a 100-μm cell strainer. Cell suspensions were mixed with Matrigel (354230; BD Biosciences), then plated in preheated 24-well plates with CRC organoid culture medium (100-067; AimingMed). For organoid transfection, the PTPN23 or control shRNA lentiviruses were mixed with the single-cell suspension in organoid culture in the presence of polybrene (8 µg/ml), which were then plated on solidified Matrigel for incubation at 37°C overnight. The medium containing dead cells and viruses was removed, followed by overlaying Matrigel and organoid culture medium on the top of the infected cells for 3D organoid culture at 37°C. For the inhibitor treatment, PITCOIN1 was added into the cell suspensions mixed with Matrigel, then plated in preheated 24-well plates with CRC organoid culture medium. The organoid growth was recorded by microscopy, and the number of organoids (>30 μm) was counted. For the apoptosis assay, CRC organoids were premixed with caspase-3/7 Dye (4440; Sartorius) and then plated into Incucyte Live-Cell Analysis System (4647; Sartorius) to monitor apoptosis at indicated times.
RNA-seq analysis
Total RNA was prepared utilizing NEBNext Ultra RNA Library Prep Kit for Illumina. The library was qualified by the Bioanalyzer 2100 system (Agilent Technologies) and was sequenced on NovaSeq 6000 (Illumina). The end reading of 150-bp pairing was generated. Differential expression analysis was conducted with the DESeq2 R package (v1.20.0), with P values adjusted for false discovery rate using the Benjamini–Hochberg method. Significantly differentially expressed genes were identified based on adjusted P value <0.05 and |log2(fold change)| >1. KEGG pathway enrichment analysis of differentially expressed genes was performed using the clusterProfiler R package (v3.8.1). GSEA for pathway genes was conducted with BROAD Institute’s GSEA software, using normalized gene counts as input (https://www.gsea-msigdb.org/gsea/index.jsp).
Proteomics and phosphoproteomics analysis
A375 cells stably expressing control shRNA or PTPN23 shRNA were lysed with 8 M urea lysis buffer with 1% protease inhibitor cocktail and sonicated three times on ice using a high-intensity ultrasonic processor (Scientz). The debris was removed by centrifugation at 12,000 g at 4°C for 10 min. The supernatant was collected, and the protein concentration was determined with Enhanced BCA Protein Assay Kit (P0009; Beyotime). The protein solution was reduced with 5 mM dithiothreitol (DTT) for 30 min at 56°C and alkylated with 11 mM iodoacetamide for 15 min at room temperature in darkness. The protein sample was then diluted by adding 100 mM triethylammonium bicarbonate buffer to urea concentration <2 M. Next, trypsin was added at a 1:50 trypsin-to-protein mass ratio for the first digestion overnight and a 1:100 trypsin-to-protein mass ratio for the second 4-h digestion. Finally, the peptides were desalted by a C18 SPE column. For biomaterial-based phosphorylation enrichment, peptide mixtures were first incubated with IMAC microsphere suspension (2749381; J&K Scientific) with vibration in loading buffer (50% acetonitrile/0.5% acetic acid). To remove the nonspecifically adsorbed peptides, the IMAC microspheres were washed with 50% acetonitrile/0.5% acetic acid and 30% acetonitrile/0.1% trifluoroacetic acid sequentially. To elute the enriched phosphopeptides, the elution buffer containing 10% NH4OH was added and the enriched phosphopeptides were eluted with vibration. The supernatant containing phosphopeptides was collected.
The peptides were dissolved in solvent (0.1% formic acid, 2% acetonitrile/in water) and separated on a nanoElute UHPLC system (Bruker Daltonics). The peptides were subjected to a capillary source followed by the timsTOF Pro (Bruker Daltonics) mass spectrometry. Resulting MS/MS data were processed using the MaxQuant search engine (v.1.6.15.0). We annotate protein pathways based on the KEGG pathway database (https://www.genome.jp/kegg/pathway.html) and identify proteins through BLAST comparison (blastp, E value <0.0001). Fisher’s exact test was used to analyze the significance of functional enrichment of differentially expressed proteins. Functional terms with fold enrichment >1.5 and P value <0.05 were considered as significant.
Mass spectrometry analysis of PTPN23-interacting proteins
For identification of PTPN23-interacting proteins, whole-cell lysates were prepared following the overexpression of a Flag empty vector or Flag-tagged PTPN23. The protein complexes were isolated using Pierce DYKDDDDK Magnetic Agarose (A36798; Thermo Fisher Scientific). Subsequently, proteins were eluted using an elution buffer at pH 2.8 and the eluates were then treated with 10–25 mM tris(2-carboxyethyl)phosphine at 37°C for 60 min for reduction, followed by alkylation with 20 mM iodoacetamide at room temperature in the dark for 30 min. The reduced and alkylated protein mixtures were digested overnight with sequencing-grade trypsin (V5113; Promega) at a protease-to-protein ratio of 1:30 (wt/wt) at 37°C. The resulting peptides were analyzed using Q Exactive Plus Hybrid Quadrupole Orbitrap Mass Spectrometer (Thermo Fisher Scientific). Protein identification was performed by searching the fragment ion spectra against a UniProtKB protein database using Proteome Discoverer 2.5 software (Thermo Fisher Scientific). GO enrichment analysis was performed by the GO database online (https://geneontology.org/).
Phosphatase activity assay
The phosphatase activities of PTPN23 CDs were measured using DiFMUP (D6567; Thermo Fisher Scientific) as a fluorogenic substrate. Initially, a 10 mM stock solution of DiFMUP was prepared in dimethylformamide (20673; Thermo Fisher Scientific). This stock was subsequently diluted to a working solution of 200 μM using 3 M sodium acetate buffer (pH 5.5, AM9740; Thermo Fisher Scientific). For the assays, 50 μl of the 200 μM working solution was dispensed into each well of a black 96-well microplate with indicated recombinant PTPN23 CDs. The enzymatic reaction was monitored by measuring the fluorescence of the hydrolysis product with excitation and emission maxima at ∼358 and 450 nm, respectively. The fluorescence intensity was measured using BioTek Synergy H1 Multi-Mode Microplate Reader (Agilent Technologies) and quantified.
Intracellular delivery of PI(3,4)P2
Exogenous PI(3,4)P2 (850153P; Avanti) was dissolved in water and incubated with an equal molar concentration of unlabeled Shuttle PIP Carrier 2 (P-9C2; Echelon) for 10 min at room temperature. Then, the cells were treated with the PI(3,4)P2-PIP Carrier 2 mix at the 10 μM final concentration in media at 37°C for 60 min.
Cell fractionation
Cell fraction was performed with Minute Endosome Isolation and Cell Fractionation Kit (ED-028; Invent) according to the manufacturer’s instructions. In brief, cells were washed twice with cold PBS and the pellet was resuspended in 500 μl buffer A. After incubating on ice for 10 min, the cell suspension was transferred to the filter cartridge and centrifuged at 16,000 g for 30 s. The pellet was resuspended and centrifuged at 700 g for 3 min. The supernatant was collected and centrifuged at 4°C for 60 min at 16,000 g (heavy membrane). Next, the supernatant was mixed with buffer B and incubated at 4°C overnight. After centrifuging at 10,000 g for 30 min at 4°C, the pellet containing isolated endosomes was collected.
Immunofluorescence microscopy
Cells grown on sterile coverslips in a 6-well plate were washed once with 1× PBS, fixed with 4% paraformaldehyde (PFA) for 20 min, and then permeabilized with confining liquid (1× PBS containing 4% goat serum, 0.4% Triton X-100, and 1% BSA) for 1 h at room temperature. After permeabilizing and blocking, the cells were incubated with the primary antibody overnight at 4°C, followed by incubation with the corresponding secondary antibody for 1 h at room temperature. Nuclei were labeled with 0.15 µg/ml DAPI staining solution (D9542; Sigma-Aldrich). Finally, the coverslips were mounted onto a clean glass microscope slide using Mowiol 4-88 (81381; Sigma-Aldrich) mounting medium. Fluorescence images were obtained on Dragonfly Confocal Microscopy System (Andor, Oxford Instruments). Primary antibodies were PTPN23 rabbit pAb (PA5-100047; Thermo Fisher Scientific), purified anti-PtdIns(3,4)P2 mouse IgG (Z-P034B; Echelon), HD-PTP/PTPN23 mouse mAb (sc-398711; Santa Cruz), PI3KC2α rabbit pAb (22028-1-AP; Proteintech), and Rab5 rabbit mAb (3547S; CST). Secondary antibodies were Alexa Fluor 488 anti-mouse IgG (H+L) (4408S; CST), Alexa Fluor 555 anti-mouse IgG (H+L) (4409S; CST), Alexa Fluor 488 anti-rabbit IgG (H+L) (4412S; CST), and Alexa Fluor 555 anti-rabbit IgG (H+L) (4413S; CST).
Immunohistochemistry (IHC)
IHC staining was conducted using Mouse and Rabbit Specific HRP/DAB Detection IHC Kit (ab64264; Abcam) according to the manufacturer’s instructions. In brief, fresh tissue samples were fixed with 4% PFA overnight and dehydrated by HistoCore PELORIS 3 Premium Tissue Processing System (Leica Biosystems). The samples were then embedded in paraffin using HistoCore Arcadia Embedding Center (Leica Biosystems), and the embedded tissue was sectioned into 5-μm-thick slices using HistoCore NANOCUT R (Leica Biosystems). The tissue sections were then deparaffinized, rehydrated, boiled in citrate buffer for 20 min to retrieve antigens, permeabilized, and blocked. After that, the sections were incubated with anti-Ki67 rabbit pAb (GB111499-100; Servicebio) or anti–cleaved caspase-3 rabbit pAb (GB11532-100; Servicebio) at 4°C overnight. After incubation for 10 min with biotinylated secondary antibody and 10 min with HRP-labeled streptavidin, the protein signal was visualized using a DAB detection mixture. Nuclei were counterstained with hematoxylin (H3136; Merck). Images were taken at 60× magnification using VS200 Research Slide Scanner (Olympus).
Co-immunoprecipitation
Cells treated with indicated conditions were lysed with NP-40 buffer (P0013F; Beyotime) supplemented with complete EDTA-free protease inhibitor cocktail (B14001; Selleck) and phosphatase inhibitor cocktail (B15001; Selleck). Protein lysates were cleared by centrifugation at 12,000 g for 20 min at 4°C. The supernatant was then incubated overnight at 4°C with gentle rotation with one of the following: anti-DYKDDDDK Magnetic Agarose (A36798; Thermo Fisher Scientific), anti-HA Magnetic Beads (88836; Thermo Fisher Scientific), or antibodies for HD-PTP/PTPN23 (sc-398711; Santa Cruz), PI3KC2α (22028-1-AP; Proteintech), and WNK3 (A15507; Abclonal), coupled with Protein A/G Magnetic Beads (88802; Thermo Fisher Scientific). After incubation, the beads were washed three times with Tris-buffered saline containing 0.05% Tween-20. The proteins were boiled in 1 × loading buffer (125 mM Tris–HCl, pH 6.8, 0.02 g/ml SDS, 10% glycerol, 15.5 mg/ml DTT, and 0.03 mg/ml bromophenol blue) and analyzed by immunoblotting. Control antibodies included rabbit IgG (AC005; Abclonal) and mouse IgG (AC011; Abclonal).
Immunoblotting
Whole-cell lysates were prepared in RIPA lysis buffer (50 mM Tris, 1% NP-40, 0.5% sodium deoxycholate, and 0.1% SDS) supplemented with complete EDTA-free protease inhibitor cocktail (B14001; Selleck) and phosphatase inhibitor cocktail (B15001; Selleck). Samples were boiled at 100°C and centrifuged. Protein concentration was measured with Enhanced BCA Protein Assay Kit (P0009; Beyotime). Subsequently, 30–50 μg of protein was resolved by SDS–PAGE and transferred to 0.45-μm PVDF membranes (Merck). Membranes were blocked in Tris-buffered saline plus 0.1% Tween-20 containing 5% nonfat powdered milk for 2 h at room temperature followed by overnight incubation with primary antibody at 4°C. Proteins were incubated with HRP-conjugated secondary antibodies for 2 h at room temperature. HRP was activated with Clarity Western ECL Substrate (1705061; Bio-Rad) and visualized with ChemiDoc MP Imaging System (Bio-Rad). Primary antibodies were β-actin (4970S; CST and 66009-1-Ig; Proteintech), GAPDH (2118S; CST), Flag (F1804; Sigma-Aldrich), HA (2367S; CST), HD-PTP/PTPN23 (sc-398711; Santa Cruz), PI3KC2α (22028-1-AP; Proteintech), WNK3 (A15507; Abclonal), Akt1 (2938S; CST), p-Akt1 (Ser473) (9018S; CST), Akt2 (3063S; CST), p-Akt2 (Ser474) (8599S; CST), Akt3 (14982S; CST), p-AKT3 (S472) (YB-5209R; Yb Science), GSK-3β (12456S; CST), p-GSK3β (Ser9) (5558S; CST), MEK1/2 (4694S; CST), p-MEK1/2 (Ser217/221) (9154S; CST), Erk1/2 (4695S; CST), p-Erk1/2 (Thr202/Tyr204) (4370S; CST), caspase-3 (9662S; CST), cleaved caspase-3 (9661S; CST), PARP (9532S; CST), cleaved PARP (Asp214) (5625S; CST), BCL2 (12789-1-AP; Proteintech), Rab5 (3547S; CST), Na+/K+ ATPase α-1 (14418-1-AP; Proteintech), p-Ser (sc-81514; Santa Cruz), p-Thr (sc-5267; Santa Cruz), and p-Tyr (sc-7020; Santa Cruz). Secondary antibodies were HRP anti-mouse (7076S; CST) and HRP anti-rabbit (7074S; CST).
Real-time quantitative PCR (qPCR)
Total RNA was extracted using GeneJET RNA Purification Kit (K0732; Thermo Fisher Scientific) from cells after indicated treatments. cDNAs were synthesized by RevertAid First Strand cDNA Synthesis Kit (K1622; Thermo Fisher Scientific). qPCR was performed on QuantStudio 5 Real-Time PCR System (Thermo Fisher Scientific) with 2× SYBR Green qPCR Master Mix (B21203; Selleck) according to the manufacturer’s instructions. β-Actin was used as the internal control. The relative expression of indicated genes was calculated by the ∆∆CT method. Primer sequences for qPCR were hPTPN23, 5′-GCATGAAGGTCTCCTGTACCC-3′ and 5′-TGTAGTAATCTACCACCTGTGC-3′; hACTB, 5′-ACAGAGCCTCGCCTTTGCC-3′ and 5′-GAGGATGCCTCTCTTGCTCTG-3′; hPI3KC2α, 5′-AAATGGGACCAGTAGTTTGCC-3′ and 5′-GGGTTTGTGCGGTGATTGGTA-3′; hWNK3, 5′-TGTTGAAATGACGGAAGATGACA-3′ and 5′-TCTGCCACTAGGAGAAGTAGC-3′; mActb, 5′-GGCTGTATTCCCCTCCATCG-3′ and 5′-CCAGTTGGTAACAATGCCATGT-3′; and mPtpn23, 5′-TGCGGCTAATTGAACAGGACC-3′ and 5′-CGGTTCTTCAGGGAGTAGCA-3′.
Multiplex immunofluorescence (mIF) staining
The melanoma TMA was obtained from Shanghai Outdo Biotech Co., Ltd. mIF staining was performed using Opal 6-Plex Detection Kit (NEL811001KT; Akoya Biosciences). Briefly, the TMA slide was deparaffinized with xylene, rehydrated through a graded ethanol series, and subjected to high-pressure antigen retrieval for 30 min using Opal-AR6 Buffer. Following a 10-min room temperature block with 1× Antibody Diluent/Block, the staining procedure was carried out in a serial three-step process. Each cycle involved staining with primary and secondary antibodies, detection with Opal reactive fluorophores, and subsequent microwave treatment to remove primary and secondary antibodies while preserving the Opal signal within the slide. Successive rounds of staining were completed using different primary and secondary antibodies and distinct Opal fluorophores to prevent cross-reactivity. Primary antibodies included anti-BRAF V600E (1:100) (MA5-24661; Thermo Fisher Scientific), anti-PTPN23 (1:100) (sc-398711; Santa Cruz), and anti-p-AKT2 (S474) (1:100) (8599S; CST), paired with an HRP-conjugated secondary antibody. The corresponding Opal fluorophores were BRAF V600E (Opal 570), PTPN23 (Opal 520), and p-AKT2 (S474) (Opal 620). DAPI was used as a counterstain for cell nuclei. Imaging of the four-color Opal-stained slide was performed using Akoya Biosciences PhenoCycler-Fusion (Akoya Biosciences), and spectral unmixing was applied to differentiate the four fluorescent signals. Quantitative analysis of fluorescence intensity was conducted using QuPath software.
Analysis of clinical dataset
The PTPN23 signature was defined by selecting the top 100 upregulated and top 100 downregulated genes from the RNA-seq experiment conducted on control and PTPN23-knockdown A375 cells, using log fold change as weights for normalization. PTPN23 signature scores were then calculated as the weighted average expression of these signature genes. To assess clinical relevance, we examined the association between the PTPN23 signature score and melanoma patient survival in TCGA dataset. The Kaplan–Meier survival curves were generated, and their differences were examined using a log-rank test.
Expression data (FPKM) and mutation data (MuTect2 Variant Aggregation and Masking) for pan-cancer samples were downloaded from the UCSC Xena database (https://xena.ucsc.edu). A total of 10,327 cancer patients were included in the analysis, with BRAF mutation status (mutant or WT) determined from the pan-cancer mutation data, identifying 772 patients with BRAF mutations. An unpaired t test was applied to evaluate differences in PTPN23 expression between WT and mutant BRAF groups.
Statistics and reproducibility
No statistical method was used to predetermine the sample size. No samples were excluded from the analysis. The experiments were not randomized, and investigators were not blinded to the conditions of the experiments. All data represent the mean ± SEM from at least two independent experiments, and statistical analyses using experimental data were performed with GraphPad Prism 10.1.2 software. Differences were considered statistically significant when the P value was <0.05, and otherwise not significant (ns).
Online supplemental material
Fig. S1 shows PTPN23 is essential for the survival of BRAF-mutant melanoma cells in vivo or in vitro. Fig. S2 shows PTPN23 is required for PI3KC2α-mediated production of PI(3,4)P2 and AKT activation. Fig. S3 shows PI3KC2α is required for the growth of BRAF-mutant melanoma cells. Fig. S4 shows PTPN23 silencing sensitizes BRAFV600E melanoma cells to BRAFi. Fig. S5 shows PTPN23 is a therapeutic vulnerability of other BRAF-mutant cancers.
Data availability
RNA-seq data presented in this study were deposited into Genome Sequence Archive for Human (https://ngdc.cncb.ac.cn/gsa-human) under the accession no. HRA007212. MS data, proteomics, and phosphoproteomics related to this study are available at the ProteomeXchange Consortium via the PRIDE partner repository with dataset identifiers PXD051577, PXD051603, and PXD051604. All other data that support the findings of this study can be made available from the corresponding author upon request. Source data are provided in this paper.
Acknowledgments
The authors are grateful to the Biochemical Analysis Core, Multi-omics Mass Spectrometry Core, Bio-Imaging Core, and Animal Laboratory Center of Shenzhen Bay Laboratory for help with technical assistance.
This work was supported by the National Key R&D Program of China (2022YFA0912600), Shenzhen Medical Research Fund (B2302018), National Natural Science Foundation of China (32100579, 82341011, 82373179, and 82303061), and the Major Program (S201101004) and Open Fund Program (SZBL2021080601004) of Shenzhen Bay Laboratory.
Author contributions: Y. He: conceptualization, data curation, formal analysis, investigation, methodology, project administration, resources, validation, visualization, and writing—original draft, review, and editing. W. Li: data curation, formal analysis, and investigation. M. Zhang: data curation, formal analysis, software, visualization, and writing—review and editing. H. Wang: methodology and resources. P. Lin: data curation and formal analysis. Y. Yu: investigation. B. Huang: investigation and methodology. M. Hao: investigation and methodology. J. He: formal analysis. W. Kong: investigation and methodology. D. Luo: investigation and methodology. T. Xu: investigation. J. Wang: data curation. Y. Huang: investigation and methodology. Q. Zhao: investigation. Y. Liu: investigation. J. Zhang: methodology, software, validation, visualization, and writing—original draft. Y. Nian: resource. L. Zhang: formal analysis, funding acquisition, and writing—review and editing. B. Zhu: conceptualization, funding acquisition, resources, and writing—original draft, review, and editing. C. Yin: conceptualization, data curation, formal analysis, funding acquisition, investigation, methodology, project administration, resources, supervision, and writing—original draft, review, and editing.

