


Plasmacytoid DCs (pDCs) infiltrate the skin, chronically produce type I interferon (IFN-I), and promote skin lesions and fibrosis in autoimmune patients. However, what controls their activation in the skin is unknown. Here, we report that increased stiffness inhibits the production of IFN-I by pDCs. Mechanistically, mechanosensing activates stress pathways including NRF2, which induces the pentose phosphate pathway and reduces pyruvate levels, a product necessary for pDC responses. Modulating NRF2 activity in vivo controlled the pDC response, leading to resolution or chronic induction of IFN-I in the skin. In systemic sclerosis (SSc) patients, although NRF2 was induced in skin-infiltrating pDCs, as compared with blood pDCs, the IFN response was maintained. We observed that CXCL4, a profibrotic chemokine elevated in fibrotic skin, was able to overcome stiffness-mediated IFN-I inhibition, allowing chronic IFN-I responses by pDCs in the skin. Hence, these data identify a novel regulatory mechanism exerted by the skin microenvironment and identify points of dysregulation of this mechanism in patients with skin inflammation and fibrosis.

Introduction
The presence of a so-called “IFN signature,” one of the most robust and prevalent patterns of pathological gene expression in multiple autoimmune diseases, has been observed in the skin and blood of patients with skin lesions or skin fibrosis (Crow et al., 2019; Wenzel and Tüting, 2008). The cellular origin and signaling pathways leading to this chronic IFN-I response are not fully defined, and it is likely that the pathways and cells involved may differ in different disease contexts or model tested, e.g., UV-induced inflammation likely involves cGAS/STING signaling (Skopelja-Gardner et al., 2020), while skin injury triggers the recruitment in the skin and activation of plasmacytoid DCs (pDCs) (Barrat and Su, 2019; Gregorio et al., 2010; Guiducci et al., 2010; Reizis, 2019). Although distinct IFN-inducing pathways may play a role at different stages of the disease, overall, it is clear that difficulties in controlling immune responses to nucleic acids (NA), with a key role for pDCs, likely contribute to the presence of interferon-stimulated genes (ISGs) in the skin of autoimmune patients (Ah Kioon et al., 2024; Barrat et al., 2016; Barrat and Su, 2019; Reizis, 2019). Indeed, the role of pDCs in promoting skin lesions and skin fibrosis has been supported in various mouse models (Ah Kioon et al., 2018; Gerber et al., 2013; Gregorio et al., 2010; Guiducci et al., 2010; Ross et al., 2021), and our description that pDCs infiltrate the skin of patients with systemic sclerosis (SSc) (Ah Kioon et al., 2018) was recently confirmed in a large single cell study in SSc patients (Gur et al., 2022). Strikingly, the depletion/inhibition of pDCs in patients with systemic lupus erythematosus (SLE) and cutaneous LE (CLE) led to reduced expression of ISGs in the skin associated with amelioration of skin lesions (Furie et al., 2019, 2022; Karnell et al., 2021; Werth et al., 2022). These data obtained with two different drugs targeting pDCs directly link IFN-I produced by pDCs and the occurrence of skin lesions in patients with SLE/CLE.
However, a key challenge has been to understand what controls the chronic activation of pDCs once they infiltrate the skin of patients and how their production of IFN-I can impact the response by other infiltrating immune cells. It is clear that cells infiltrating the skin experience significant stiffness, particularly in fibrotic skin. The measurement of tissue stiffness is quite challenging due to the imprecisions of the methods used, but also because there is a gradient that can be difficult to fully appreciate. The stiffness in the dermis from healthy skin was shown to range from 0.1 to 10 kPa, depending on the body area, dermal layer, hydration, and age of the donor (Achterberg et al., 2014). In mouse skin, it is estimated at about 2 kPa, which is in the same range and can rise to >30 kPa in fibrotic skin (Lagares et al., 2017). In humans, during fibrosis, the stiffness is also increased, and work using skin sampled from fingers, forearms, and abdomen from 37 patients with SSc showed that the stiffness in patients’ forearm is about 50 kPa, while it is even higher in the fingers (Yang et al., 2018). In contrast, cells in circulation experience little stiffness, about 0.01 kPa (Vennemann et al., 2007). Furthermore, not only do factors such as stiffness vary between organs, but the forces experienced by cells also vary according to the inflammatory status within tissues (Clark et al., 1996; Harn et al., 2019) or in the process of wound healing (Goffin et al., 2006). Inflammatory mediators such as nucleic acids, cytokines, and chemokines, including CXCL4 or CXCL10 (Di Domizio et al., 2020; Du et al., 2022), are also present in the skin, and we recently described that these chemokines can modulate the cellular response by pDCs to NA sensing (Du et al., 2022). In particular, CXCL4 is present at high concentrations in blood and at sites of tissue injury and inflammation (up to 10 µg/ml in SSc) (Affandi et al., 2022; Ah Kioon et al., 2018; Lande et al., 2019; van Bon et al., 2014; Volkmann et al., 2016). CXCL4 also has a strong profibrotic function in vitro and in vivo (Affandi et al., 2022; Erdem et al., 2007; Nguyen et al., 2019; Silva-Cardoso et al., 2017; 2020a; 2020b; Trocmé et al., 2009; Yamamoto et al., 2002) and is produced by pDCs in patients with SSc (Ah Kioon et al., 2018; van Bon et al., 2014). Finally, pDCs from patients with autoimmune and fibrotic diseases are intrinsically different from healthy donors (HDs) and may respond differently to these changes in environment (Du et al., 2025; Nehar-Belaid et al., 2020).
The effective coordination of various biological and mechanical signals provided by the extracellular matrix (ECM) is essential for cellular functions in tissues (Martino et al., 2018). The mechanical properties of the ECM, such as stiffness, can induce signals, a process known as mechanosensing, that activate cellular pathways and profoundly influence their function (Du et al., 2023; Martino et al., 2018; Wagh et al., 2021). The significance of mechanical stimuli has long been recognized in developmental biology and in organ systems subjected to mechanical stress (e.g., cardiovascular and skeletal systems) (Du et al., 2023). In pathological conditions like atherosclerosis, fibrosis, and the peritumoral environment, alterations in tissue mechanics trigger substantial changes at the cellular level, impacting mechanotransduction components such as adhesion molecules, ion channels, cytoskeletal proteins, and associated signaling pathways (Du et al., 2023; Glitsch, 2019; Martino et al., 2018). How the tissue-scale biophysical cues conferred by skin stiffness on pDCs influence responses remains unclear.
In our study, we demonstrate the surprising role of skin stiffness in suppressing the production of IFN-I by human pDCs. We show that this effect is mediated by activation of the transcription factor (TF) NRF2, leading to the induction of the pentose phosphate pathway (PPP) and subsequent reduction in pyruvate levels in pDCs. Using a model of skin injury, we report that the IFN-I response by the pDCs infiltrating the skin is modulated by NRF2 and that CXCL4 can override the inhibitory effect of stiffness on pDCs and allow a shift from skin resolution to chronic inflammation. Finally, this lack of NRF2-mediated inhibition of the IFN-I response by skin-infiltrating pDCs was observed in patients with SSc. Overall, our findings unveil the mechanism of stiffness-mediated mechanosensing in pDCs and how this is dysregulated in the skin of patients with SSc.
Results and discussion
Stiffness-mediated mechanosensing inhibits IFN-I response by pDCs to TLR7 and TLR9 signaling
To mimic degrees of stiffness experienced by cells infiltrating healthy or fibrotic skin, we used hydrogel substrates with a wide range of stiffness (ranging from 0.2 to 50 kPa) that were coated with type I collagen (Lagares et al., 2017), which is known to be excessively deposited during skin fibrosis (Ghosh and Vaughan, 2012). We have selected 50 kPa to mimic fibrotic skin, a condition that has been used in several other studies to study fibrotic tissues like the skin or other organs (Discher et al., 2005; He et al., 2024; Lagares et al., 2017; Shi et al., 2013).
We observed that changes in stiffness, comparing 0.2 kPa and 50 kPa, had a strong impact on the transcriptional landscape of human pDCs (Fig. 1 A). Our transcriptomic analysis revealed a notable impact of stiffness on pDCs with the induction of genes associated with inflammation such as TNF and NF-kB signaling, p53, or UV responses (Fig. 1 B), but also with genes associated with cell movement function (Fig. 1 C), such as CXCL2, CXCL3, FLOT2, ARHGDIA, and ABI3, being induced in pDCs under high stiffness (Fig. 1 D). Besides this, we also noted in our transcriptomic analysis that stiffness induced pathways not only related to Rho family GTPase, integrin and cytokine signaling, and actin cytoskeleton signaling but also stress-related pathways such as NRF2-mediated oxidative stress pathway (Fig. S1 A). As chronic pDC-induced IFN-I has been associated with skin fibrosis, we hypothesized that increased stiffness would promote sustained IFN-I response by pDCs. Surprisingly, increasing stiffness led to reduced IFN-α production by TLR9- or TLR7-activated pDCs, both at the protein and mRNA levels (Fig. 1, E and F; and Fig. S1 B). We also observed a similar effect on IL6 (Fig. S1 C). High stiffness also inhibited IFN-α expression in TLR9-activated pDCs at early time points, suggesting that the impact of high stiffness on IFN-α secretion is not due to a cumulative effect (Fig. S1 D), while we observed no impact on pDC viability (Fig. S1, E and F). To further understand the robustness of this inhibition, we used the TLR9 agonist (a CpG-C) at increased concentration (ninefold higher) with a similar effect of high stiffness (Fig. S1 G). The dimer form of integrin-β1, along with other integrin subunits, interacts with type I collagen (Emsley et al., 2000). We observed that integrin-β1 was expressed on pDCs (Fig. S1 H) and that blocking integrin-β1 with a neutralizing antibody was able to rescue IFN-α production by pDCs on high stiffness substrates (Fig. 1 G), while an agonist for the integrin-β1 receptor (pyrintegrin) (Lin et al., 2023; Mao et al., 2023) inhibited IFN-α production by TLR9 activation (Fig. 1 H), demonstrating that the sensing of collagen coated on these hydrogels by integrin-β1 plays a role in this effect. Mechanosensing is a well-documented phenomenon in developmental biology and organ systems (Du et al., 2023) influencing cellular functions, including cell migration and adhesion in mammary epithelial cells (Dupont et al., 2011). It has previously been observed that the extracellular matrix, highly abundant in fibrotic skin, can initiate mechanosensing through integrin-β1 (Emsley et al., 2000). Hence, our results highlight the inhibitory impact of mechanical signals on pDC function and raise new questions as to the mechanism associated with this inhibition and, importantly, how these observations fit with the known chronic activation of pDCs in the skin of patients with autoimmune diseases.

Increasing stiffness inhibits IFN-I response in pDCs via integrin-β1. (A–D) Purified pDCs from HDs (n = 4) were cultured either at 0.2 or 50 kPa for 5 h and analyzed by RNA-seq. (A) PCA plot of RNA-seq analysis. (B) Heatmap of all differentially regulated genes by stiffness, followed by pathways analysis using hallmark genes analysis for cluster 1. (C) Canonical functional activation bar chart as identified by QIAGEN IPA, showing the top 11 that were differentially regulated by stiffness in human pDCs. (D) Volcano plot comparing gene expression in pDCs at 0.2 or 50 kPa. Colors on the graph indicate differentially expressed genes, and the genes involved in cell migration are indicated. (E and F) Purified pDCs from HDs (n = 5–10; three to five independent experiments) were cultured with media alone or at different stiffness (as indicated) alone or either with the TLR9 agonist (C274 at 0.075 μM) or the TLR7 agonist (influenza virus, VR-95 at 0.5 pfu/cell). Supernatants were collected after 15 h and IFN-α secretion quantified by ELISA. (G) Purified pDCs from HDs (n = 9; five independent experiments) were first incubated in media alone or with a neutralizing antibody against integrin-β1 (20 μg/ml) for 1 h, then cultured at 50 kPa stiffness alone or with a TLR9 agonist (C274 at 0.075 μM). Supernatants were collected after 15 h and IFN-α secretion quantified by ELISA. (H) Purified pDCs from HDs (n = 4; three independent experiments) were cultured in media alone or with an integrin-β1 agonist (pyrintegrin: 0.5 or 1 μM) for 1 h, followed by incubation with the TLR9 agonist (C274 at 0.075 μM) for 5 h. RNA was collected and analyzed for IFNA2 expression. Individual donors are indicated; all results are represented as mean ± SEM, and statistical significance was evaluated using Mann–Whitney U test or one-way ANOVA, Tukey’s multiple comparisons test. *P < 0.05; **P < 0.01; ***P < 0.001.
Increasing stiffness inhibits IFN-I response in pDCs via integrin-β1. (A–D) Purified pDCs from HDs (n = 4) were cultured either at 0.2 or 50 kPa for 5 h and analyzed by RNA-seq. (A) PCA plot of RNA-seq analysis. (B) Heatmap of all differentially regulated genes by stiffness, followed by pathways analysis using hallmark genes analysis for cluster 1. (C) Canonical functional activation bar chart as identified by QIAGEN IPA, showing the top 11 that were differentially regulated by stiffness in human pDCs. (D) Volcano plot comparing gene expression in pDCs at 0.2 or 50 kPa. Colors on the graph indicate differentially expressed genes, and the genes involved in cell migration are indicated. (E and F) Purified pDCs from HDs (n = 5–10; three to five independent experiments) were cultured with media alone or at different stiffness (as indicated) alone or either with the TLR9 agonist (C274 at 0.075 μM) or the TLR7 agonist (influenza virus, VR-95 at 0.5 pfu/cell). Supernatants were collected after 15 h and IFN-α secretion quantified by ELISA. (G) Purified pDCs from HDs (n = 9; five independent experiments) were first incubated in media alone or with a neutralizing antibody against integrin-β1 (20 μg/ml) for 1 h, then cultured at 50 kPa stiffness alone or with a TLR9 agonist (C274 at 0.075 μM). Supernatants were collected after 15 h and IFN-α secretion quantified by ELISA. (H) Purified pDCs from HDs (n = 4; three independent experiments) were cultured in media alone or with an integrin-β1 agonist (pyrintegrin: 0.5 or 1 μM) for 1 h, followed by incubation with the TLR9 agonist (C274 at 0.075 μM) for 5 h. RNA was collected and analyzed for IFNA2 expression. Individual donors are indicated; all results are represented as mean ± SEM, and statistical significance was evaluated using Mann–Whitney U test or one-way ANOVA, Tukey’s multiple comparisons test. *P < 0.05; **P < 0.01; ***P < 0.001.

Mechanosensing inhibits pDCs response without impacting cellular viability and without the involvement of the Hippo pathway. (A) Purified pDCs from HDs (n = 4) were cultured either at 0.2 or 50 kPa for 5 h and analyzed by RNA-seq. All modulated pathways were identified using QIAGEN IPA as indicated by the arrows. (B and C) Purified pDCs from HDs (n = 6; four independent experiments) were cultured in media alone or at increasing stiffness, followed by incubation with the TLR9 agonist (C274 at 0.075 μM). (B) Expression level of IFNA2 was analyzed by Q-PCR at 5 h. (C) After 15 h of culture, IL6 secretion was analyzed by ELISA. (D) Purified pDCs from HDs (n = 5; three independent experiments) were cultured at a stiffness of 0 or 50 kPa, followed by incubation with the TLR9 agonist (C274 at 0.075 μM) for 3, 6 and 9 h. Gene expression level of IFNA2 was analyzed by Q-PCR. (E and F) Purified pDCs from HDs (n = 3; three independent experiments) were cultured at a stiffness of 0 or 50 kPa, followed by incubation with the TLR9 agonist (C274 at 0.075 μM) for 6 h. Percentage of (E) cell viability or (F) of apoptotic cells (Annexin V+) was assessed by flow cytometry. (G) Purified pDCs from HDs (n = 4; three independent experiments) were cultured at a stiffness of 0 or 50 kPa, followed by incubation with the TLR9 agonist (C274 at either 75 or 675 nM) for 15 h. IFNα secretion was analyzed by ELISA. (H and I) RNA-seq of pDCs from HDs (Chaudhary et al., 2022) was reanalyzed for the expression of (H) integrin genes and (I) genes related to Hippo pathway and represented in CPM (count per million). (J) Purified pDCs from HDs (n = 4; three independent experiments) were cultured at a stiffness of 0 or 50 kPa, followed by incubation with the TLR9 agonist (C274 at 0.075 μM) alone or with super TDU-131 (100 ng/ml) (YAP inhibitor) for 15 h. IFNα secretion was analyzed by ELISA. (K) Purified pDCs from HDs were cultured at either low stiffness (0.2 kPa) or high stiffness (50 kPa) for 6 h and analyzed by RNA-seq. Differentially regulated transcriptional factors were analyzed by QIAGEN IPA and upregulated and downregulated TFs are indicated in red and blue, respectively. Individual donors are indicated; all results are represented as mean ± SEM; and statistical significance was evaluated using Mann–Whitney U test or one-way ANOVA, Tukey’s multiple comparisons test. **P < 0.01.
Mechanosensing inhibits pDCs response without impacting cellular viability and without the involvement of the Hippo pathway. (A) Purified pDCs from HDs (n = 4) were cultured either at 0.2 or 50 kPa for 5 h and analyzed by RNA-seq. All modulated pathways were identified using QIAGEN IPA as indicated by the arrows. (B and C) Purified pDCs from HDs (n = 6; four independent experiments) were cultured in media alone or at increasing stiffness, followed by incubation with the TLR9 agonist (C274 at 0.075 μM). (B) Expression level of IFNA2 was analyzed by Q-PCR at 5 h. (C) After 15 h of culture, IL6 secretion was analyzed by ELISA. (D) Purified pDCs from HDs (n = 5; three independent experiments) were cultured at a stiffness of 0 or 50 kPa, followed by incubation with the TLR9 agonist (C274 at 0.075 μM) for 3, 6 and 9 h. Gene expression level of IFNA2 was analyzed by Q-PCR. (E and F) Purified pDCs from HDs (n = 3; three independent experiments) were cultured at a stiffness of 0 or 50 kPa, followed by incubation with the TLR9 agonist (C274 at 0.075 μM) for 6 h. Percentage of (E) cell viability or (F) of apoptotic cells (Annexin V+) was assessed by flow cytometry. (G) Purified pDCs from HDs (n = 4; three independent experiments) were cultured at a stiffness of 0 or 50 kPa, followed by incubation with the TLR9 agonist (C274 at either 75 or 675 nM) for 15 h. IFNα secretion was analyzed by ELISA. (H and I) RNA-seq of pDCs from HDs (Chaudhary et al., 2022) was reanalyzed for the expression of (H) integrin genes and (I) genes related to Hippo pathway and represented in CPM (count per million). (J) Purified pDCs from HDs (n = 4; three independent experiments) were cultured at a stiffness of 0 or 50 kPa, followed by incubation with the TLR9 agonist (C274 at 0.075 μM) alone or with super TDU-131 (100 ng/ml) (YAP inhibitor) for 15 h. IFNα secretion was analyzed by ELISA. (K) Purified pDCs from HDs were cultured at either low stiffness (0.2 kPa) or high stiffness (50 kPa) for 6 h and analyzed by RNA-seq. Differentially regulated transcriptional factors were analyzed by QIAGEN IPA and upregulated and downregulated TFs are indicated in red and blue, respectively. Individual donors are indicated; all results are represented as mean ± SEM; and statistical significance was evaluated using Mann–Whitney U test or one-way ANOVA, Tukey’s multiple comparisons test. **P < 0.01.
Skin stiffness inhibits ΙFN-I production via transcriptional activation of NRF2
Despite pDCs expressing classical mechanotransduction-associated genes, including genes involved in cell movement, in response to a stiff microenvironment, our analysis unveiled a notable absence of key genes involved in the Hippo pathway such as TEAD1/2/3/4 and the YAP1 binding factor, while LATS1, LATS2, and TAZ were weakly expressed in human pDCs (Fig. S1 I), suggesting that this classical pathway may not operate in pDCs. To further support this finding, we tested this functionally using SuperTDU-131, a peptide that prevents YAP1 binding to TEADs and inactivates their transcriptional activity (Jiao et al., 2017), and observed that blocking YAP1 did not rescue IFN-α production in pDCs at high stiffness (Fig S1 J). These data suggest that stiffness-induced signals pDCs without the involvement of the YAP1/TEADs pathway. To characterize the mechanism at play, we then incubated pDCs with a TLR9 agonist under low (0.2 kPa) or high (50 kPa) stiffness conditions and performed an unbiased transcriptomic analysis using RNA sequencing (RNA-seq). The principal component analysis (PCA) revealed a clear segregation of the two sets of conditions (Fig. 2 A) associated with substantial downregulation of various IFN-I and IFN-III genes (Fig. 2 B). Other genes were also differentially expressed in pDCs at high stiffness (Table S2), but it appears that high stiffness highly impacted IFN-I transcripts and ISGs. We then focused on the regulation of TFs, and in line with our transcriptional data on IFN-I, there was a strong downregulation of IRF7 in TLR9-activated pDCs experiencing a stiff microenvironment (Fig. 2 C). Strikingly, we observed a significant activation of multiple stress-associated TFs along with NFE2L2 (NF-E2-related factor 2), also known as NRF2, being the highest induced gene under these conditions (Fig. 2 C). Furthermore, NRF2 was also induced by high stiffness, independently of TLR9 signaling (Fig. S1 K). Additional stress-associated TFs were induced, such as ATF4 and XBP1 (Fig. 2 C and Fig. S1 K), which we recently showed to control pDC responses (Chaudhary et al., 2022), although TLR9 signaling seemed to trump the induction of sXBP1 (Fig. S2, B and C). We also performed unbiased pathways analysis on this transcriptomic data and similarly observed inhibition in pathways related to IFN-I response and signaling, such as interferon signaling, role of RIG1-like receptors in antiviral innate immunity and activation of IRF by cytosolic pattern recognition receptors, but we also noted the activation of pathways related to inositol phosphate such as phosphatidylinositol-3-phosphate degradation and of inositol phosphate compounds (Fig. S2 A). Of note, we also observed activation of pathways to death receptor and apoptosis signaling (Fig. S2 A) but our flow analysis for cell viability and Annexin V+ demonstrated that high stiffness does not induce cell death in pDCs (Fig. S1, E and F). Finally, looking at differentially expressed genes, our analysis revealed genes associated with various pathways, including the induction of genes associated with cell migration (CXCL2 and CXCL3), oxidative stress response (NQO1, HMOX1, and SQSTM1), and the PPP (TKT) (Fig. 2 D).
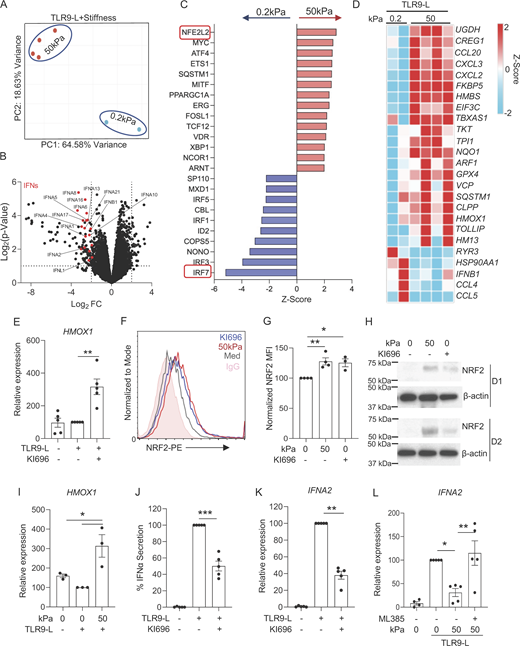
Skin stiffness inhibits ΙFN-I induction via NRF2 activation. (A–D) Purified pDCs from HDs (n = 2–4) were cultured at different stiffnesses (low stiffness: 0.2 kPa and high stiffness: 50 kPa) in the presence of a TLR9 agonist (C274 at 0.075 μM) for 5 h and analyzed by RNA-seq. (A) PCA plot of RNA-seq analysis. (B) Volcano plot showing type I IFN genes. (C) All differential regulated genes were analyzed for transcriptional factors that are either activated or inhibited by stiffness in TLR9-activated pDCs and were identified using QIAGEN IPA. Upregulated and downregulated TFs are indicated in red and blue, respectively. (D) Heatmaps of the genes that are transcriptionally regulated by the transcriptional factor NFE2L2 (NRF2) in Fig. 2 C. (E) Purified pDCs from HDs (n = 5; three independent experiments) were cultured either in media alone or with the NRF2 activator (KI696-5 μM) for 1 h, followed by incubation with the TLR9 agonist (C274-0.075 μM) for 5 h. HMOX1 (marker gene induced by NRF2 activation) gene expression was analyzed by Q-PCR. (F–H) pDCs (n = 4; three to four independent experiments) were cultured at a stiffness of 0 or 50 kPa alone or with the NRF2 activator (KI696-5 μM) for 5 h. (F and G) NRF2 protein levels were assessed by flow cytometry. (H) NRF2 protein levels were assessed by western blot at a similar time point. (I) Purified pDCs from HDs (n = 3; three independent experiments) were cultured at a stiffness of 0 or 50 kPa for 1 h, followed by incubation with the TLR9 agonist (C274-0.075 μM) for 5 h. HMOX1 gene expression was analyzed by Q-PCR. (J and K) Purified pDCs from HDs (n = 5; three independent experiments) were cultured in media alone or with the NRF2 activator (KI696-5 μM) for 1 h, followed by incubation with the TLR9 agonist (C274-0.075 μM). (J) Supernatant were collected after 15 h and IFNα secretion was analyzed by ELISA. (K) RNA was collected after 5 h, and IFNA2 gene expression was analyzed by Q-PCR. (L) Purified pDCs from HDs (n = 5; three independent experiments) were first cultured for 1 h either in media alone or with the NRF2 inhibitor (ML385-2 μM), then cultured at a stiffness of 0 or 50 kPa for another 1 h, followed by incubation with the TLR9 agonist (C274 at 0.075 μM) for 5 h. IFNA2 gene expression was analyzed by Q-PCR. Individual donors are indicated; all results are represented as mean ± SEM; and statistical significance was evaluated using Mann–Whitney U test or one-way ANOVA, Tukey’s multiple comparisons test. *P < 0.05; **P < 0.01; ***P < 0.001. Source data are available for this figure: SourceData F2.
Skin stiffness inhibits ΙFN-I induction via NRF2 activation. (A–D) Purified pDCs from HDs (n = 2–4) were cultured at different stiffnesses (low stiffness: 0.2 kPa and high stiffness: 50 kPa) in the presence of a TLR9 agonist (C274 at 0.075 μM) for 5 h and analyzed by RNA-seq. (A) PCA plot of RNA-seq analysis. (B) Volcano plot showing type I IFN genes. (C) All differential regulated genes were analyzed for transcriptional factors that are either activated or inhibited by stiffness in TLR9-activated pDCs and were identified using QIAGEN IPA. Upregulated and downregulated TFs are indicated in red and blue, respectively. (D) Heatmaps of the genes that are transcriptionally regulated by the transcriptional factor NFE2L2 (NRF2) in Fig. 2 C. (E) Purified pDCs from HDs (n = 5; three independent experiments) were cultured either in media alone or with the NRF2 activator (KI696-5 μM) for 1 h, followed by incubation with the TLR9 agonist (C274-0.075 μM) for 5 h. HMOX1 (marker gene induced by NRF2 activation) gene expression was analyzed by Q-PCR. (F–H) pDCs (n = 4; three to four independent experiments) were cultured at a stiffness of 0 or 50 kPa alone or with the NRF2 activator (KI696-5 μM) for 5 h. (F and G) NRF2 protein levels were assessed by flow cytometry. (H) NRF2 protein levels were assessed by western blot at a similar time point. (I) Purified pDCs from HDs (n = 3; three independent experiments) were cultured at a stiffness of 0 or 50 kPa for 1 h, followed by incubation with the TLR9 agonist (C274-0.075 μM) for 5 h. HMOX1 gene expression was analyzed by Q-PCR. (J and K) Purified pDCs from HDs (n = 5; three independent experiments) were cultured in media alone or with the NRF2 activator (KI696-5 μM) for 1 h, followed by incubation with the TLR9 agonist (C274-0.075 μM). (J) Supernatant were collected after 15 h and IFNα secretion was analyzed by ELISA. (K) RNA was collected after 5 h, and IFNA2 gene expression was analyzed by Q-PCR. (L) Purified pDCs from HDs (n = 5; three independent experiments) were first cultured for 1 h either in media alone or with the NRF2 inhibitor (ML385-2 μM), then cultured at a stiffness of 0 or 50 kPa for another 1 h, followed by incubation with the TLR9 agonist (C274 at 0.075 μM) for 5 h. IFNA2 gene expression was analyzed by Q-PCR. Individual donors are indicated; all results are represented as mean ± SEM; and statistical significance was evaluated using Mann–Whitney U test or one-way ANOVA, Tukey’s multiple comparisons test. *P < 0.05; **P < 0.01; ***P < 0.001. Source data are available for this figure: SourceData F2.

Stiffness induces stress-associated TF s and inhibits ΙFN-I induction in pDCs via the modulation of the glycolysis pathways. (A) Purified pDCs from HDs (n = 2–4) were cultured at different stiffness (low stiffness: 0.2 kPa and high stiffness: 50 kPa) in the presence of a TLR9 agonist (C274 at 0.075 μM) for 5 h and analyzed by RNA-seq. All modulated pathways were identified using QIAGEN IPA. (B) Purified pDCs from HDs (n = 7; three independent experiments) were cultured at a stiffness of 0, 0.2, 2, and 50 kPa, and gene expression level of XBP1 splicing was analyzed by Q-PCR. (C) Purified pDCs from HDs were cultured at a stiffness of 0, 0.2, and 50 kPa, followed by incubation with the TLR9 agonist (C274 at 0.075 μM). The gene expression level of XBP1 splicing was analyzed by Q-PCR. (D) pDCs (n = 4; three independent experiments) were cultured at a stiffness of 0 or 50 kPa alone or with the NRF2 activator (KI696-5 μM) for 5 h. NRF2 protein levels were assessed by western blot at a 5 h time point. ImageJ was used to quantify the intensity of the band in the western blots and changes in the ratio between NRF2 and β-actin levels as compared to medium alone (normalized as 1) are indicated. (E and F) Purified pDCs from HDs (n = 3–4; three independent experiments) were cultured in media alone or with the NRF2 activator (KI696 at 5 μM) for 1 h, followed by incubation with the TLR9 agonist (C274 at 0.075 μM) for 15 h. (E) IL6 secretion was analyzed by ELISA. (F) Cell viability was assessed by flow cytometry after 6 h of culture with the TLR9 agonist alone or with KI696. (G–K) Purified pDCs from HDs (n = 4–8; four independent experiments) were cultured in media alone or with the NRF2 activator (4-octyl itaconate [4-OI]-100 μM) for 1 h, followed by incubation with the TLR9 agonist (C274 at 0.075 μM). (G) Cell viability was assessed by flow cytometry. (H and I) After 5 h of culture, gene expression levels of (H) HMOX1 and (I) IFNA2 were analyzed by Q-PCR. (J and K) After 15 h of culture, (J) IFNα and (K) IL6 secretion were quantified by ELISA. (L) Purified pDCs from HDs (n = 2–4) were cultured in media alone or with the NRF2 activator (KI696) for 1 h, followed by the TLR9 agonist (C274 at 0.075 μM) for 5 h and analyzed by RNA-seq. All modulated pathways were identified using QIAGEN IPA. Upregulated and downregulated pathways are indicated in red and blue, respectively, and the size represented the significance of the pathways. (M) Graphical representation of the interconnection of glycolysis with PPP. (N) Purified pDCs from HDs (n = 4; three independent experiments) were cultured either with media alone or with KI696 for 4 h. Intracellular ATP was quantified according to the manufacturer’s protocol and normalized to medium. (O) Purified pDCs from HDs (n = 6; three independent experiments) were cultured in media alone or with the NRF2 activator (KI696) alone or with sodium pyruvate (10 mM) for 1 h, followed by incubation with the TLR9 agonist for 5 h and gene expression level of IL6 was analyzed by Q-PCR. (P) Purified pDCs from HDs (n = 2–3; two to three independent experiments) were transfected with CRISPR-Cas9 complex targeting either G6PD or TKT on exon 2 and exon 3 respectively using Lipofectamine CRISPRMAX reagent and cultured with IL3 (20 ng/ml) for 72 h. Gene expression level of TKT and G6PD was analyzed by Q-PCR. Individual donors are indicated; all results are represented as mean ± SEM; and statistical significance was evaluated using Mann–Whitney U test or one-way ANOVA, Tukey’s multiple comparisons test. *P < 0.05; **P < 0.01; ***P < 0.001.
Stiffness induces stress-associated TF s and inhibits ΙFN-I induction in pDCs via the modulation of the glycolysis pathways. (A) Purified pDCs from HDs (n = 2–4) were cultured at different stiffness (low stiffness: 0.2 kPa and high stiffness: 50 kPa) in the presence of a TLR9 agonist (C274 at 0.075 μM) for 5 h and analyzed by RNA-seq. All modulated pathways were identified using QIAGEN IPA. (B) Purified pDCs from HDs (n = 7; three independent experiments) were cultured at a stiffness of 0, 0.2, 2, and 50 kPa, and gene expression level of XBP1 splicing was analyzed by Q-PCR. (C) Purified pDCs from HDs were cultured at a stiffness of 0, 0.2, and 50 kPa, followed by incubation with the TLR9 agonist (C274 at 0.075 μM). The gene expression level of XBP1 splicing was analyzed by Q-PCR. (D) pDCs (n = 4; three independent experiments) were cultured at a stiffness of 0 or 50 kPa alone or with the NRF2 activator (KI696-5 μM) for 5 h. NRF2 protein levels were assessed by western blot at a 5 h time point. ImageJ was used to quantify the intensity of the band in the western blots and changes in the ratio between NRF2 and β-actin levels as compared to medium alone (normalized as 1) are indicated. (E and F) Purified pDCs from HDs (n = 3–4; three independent experiments) were cultured in media alone or with the NRF2 activator (KI696 at 5 μM) for 1 h, followed by incubation with the TLR9 agonist (C274 at 0.075 μM) for 15 h. (E) IL6 secretion was analyzed by ELISA. (F) Cell viability was assessed by flow cytometry after 6 h of culture with the TLR9 agonist alone or with KI696. (G–K) Purified pDCs from HDs (n = 4–8; four independent experiments) were cultured in media alone or with the NRF2 activator (4-octyl itaconate [4-OI]-100 μM) for 1 h, followed by incubation with the TLR9 agonist (C274 at 0.075 μM). (G) Cell viability was assessed by flow cytometry. (H and I) After 5 h of culture, gene expression levels of (H) HMOX1 and (I) IFNA2 were analyzed by Q-PCR. (J and K) After 15 h of culture, (J) IFNα and (K) IL6 secretion were quantified by ELISA. (L) Purified pDCs from HDs (n = 2–4) were cultured in media alone or with the NRF2 activator (KI696) for 1 h, followed by the TLR9 agonist (C274 at 0.075 μM) for 5 h and analyzed by RNA-seq. All modulated pathways were identified using QIAGEN IPA. Upregulated and downregulated pathways are indicated in red and blue, respectively, and the size represented the significance of the pathways. (M) Graphical representation of the interconnection of glycolysis with PPP. (N) Purified pDCs from HDs (n = 4; three independent experiments) were cultured either with media alone or with KI696 for 4 h. Intracellular ATP was quantified according to the manufacturer’s protocol and normalized to medium. (O) Purified pDCs from HDs (n = 6; three independent experiments) were cultured in media alone or with the NRF2 activator (KI696) alone or with sodium pyruvate (10 mM) for 1 h, followed by incubation with the TLR9 agonist for 5 h and gene expression level of IL6 was analyzed by Q-PCR. (P) Purified pDCs from HDs (n = 2–3; two to three independent experiments) were transfected with CRISPR-Cas9 complex targeting either G6PD or TKT on exon 2 and exon 3 respectively using Lipofectamine CRISPRMAX reagent and cultured with IL3 (20 ng/ml) for 72 h. Gene expression level of TKT and G6PD was analyzed by Q-PCR. Individual donors are indicated; all results are represented as mean ± SEM; and statistical significance was evaluated using Mann–Whitney U test or one-way ANOVA, Tukey’s multiple comparisons test. *P < 0.05; **P < 0.01; ***P < 0.001.
NRF2 is a member of the Cap’n’collar TF family and is responsible for regulating oxidative stress responses (Ma, 2013). In the normal homeostatic state, NRF2 undergoes ubiquitination mediated by the KEAP1 protein, thus reducing NRF2 protein levels. However, when activated, ubiquitination is temporarily halted, resulting in increased NRF2 levels and transcriptional activity (Baird and Yamamoto, 2020; Ma, 2013). We used a specific activator of NRF2, called KI696 (Davies et al., 2016), which we confirmed could induce the expression of the classical NRF2-dependent gene HMOX1 (Ma, 2013) in pDCs (Fig. 2 E). Measuring NRF2 at the protein level is a good surrogate to predict nuclear translocation (Mills et al., 2018) and we used both intracellular flow cytometry as well as western blot to quantify NRF2 in pDCs upon high stiffness. We observed that NRF2 is induced by KI696, as observed by flow (Fig. 2, F and G) or by western blot (Fig. 2 H and Fig. S2 D), and this increase was also observed in pDCs under high stiffness (Fig. 2, F–H and Fig. S2 D). Consistent with these observations, high stiffness also induced the expression of HMOX1 in pDCs (Fig. 2 I).
To determine the functional consequence of NRF2 activation, cells were activated with a TLR9 agonist in the presence of KI696. We observed that the activation of NRF2 significantly inhibited expression and secretion of IFN-α in TLR9-activated pDCs (Fig. 2, J and K) along with IL6 secretion (Fig. S2 E), again without affecting cell viability (Fig. S2 F). We confirmed this latter observation using a second NRF2 activator, 4-octyl itaconate (Mills et al., 2018), which had a similar effect on the induction of HMOX1 and inhibition of IFN-α and IL-6 without impacting cell viability (Fig. S2, G–K). Upon activation, NRF2 undergoes nuclear translocation, where it forms a complex with the s-Maf protein, enabling its binding to gene promoters to initiate transcription (Baird and Yamamoto, 2020; Ma, 2013). To demonstrate the direct role of NRF2 in mediating stiffness-induced signaling, we employed an inhibitor (ML385) specifically designed to prevent the binding of s-Maf with NRF2 (Singh et al., 2016). We observed that blocking NRF2 activation in pDCs under high-stiffness conditions rescued the expression of IFNA2 (Fig. 2 L). These findings indicate that mechanosensing in pDCs promotes transcriptional activity of NRF2, which serves as a key regulator of TLR7/9 signaling and IFN-I production in pDCs.
High stiffness induces the PPP, which reduces pyruvate levels that are needed for IFN-I response in pDCs
To investigate how transcriptional activation of NRF2 inhibits IFN-I, we conducted a transcriptomic analysis of pDCs incubated with KI696 (Fig. 3 A) using two complementary approaches. First, we performed gene set enrichment analysis to evaluate the enrichment of IFN-I and NRF2 pathways and our analysis revealed significant enrichment of hallmark IFN-I–related genes in pDCs activated with TLR9-L, whereas co-treatment with TLR9-L and KI696 resulted in reduced enrichment of these genes (Fig. 3 B). In contrast, NRF2 hallmark genes were significantly upregulated in pDCs co-treated with TLR9-L and KI696 compared with TLR9-L alone (Fig. 3 B). In addition to this targeted analysis, we conducted an unbiased pathway analysis using all differentially expressed genes and our analysis pointed to the potential involvement of the PPP in cells incubated with KI696, whereas this pathway is not induced when pDCs are activated by TLR9 signaling alone (Fig. 3 C and Fig. S2 L). Hence, we observed the induction of genes involved in PPP pathways such as glucose 6 phosphate dehydrogenase (G6PD), transketolase (TKT), phosphogluconate dehydrogenase (PGD), and transaldolase 1 (TALDO1) (Fig. 3 D). We also noted that pathways such as RIG1-like receptors in antiviral innate immunity that involve IFN-I were induced by the TLR9 signaling but inhibited by the KI696 treatments (Fig. 3 C and Fig. S2 L). The PPP is interconnected with glycolysis through two key enzymes: G6PD acting on glucose 6-phosphate (G6P) and TKT acting on fructose 6-phosphate and glyceraldehyde 3-phposphate (Patra and Hay, 2014; Stincone et al., 2015) (Fig. S2 M). G6PD is the rate-limiting enzyme of PPP that breaks down glucose to generate ribulose 5-phosphate, a precursor of DNA, RNA, and ATP, with the concomitant generation of NADPH molecules (Gomez-Manzo et al., 2016). Consequently, we examined the expression of G6PD and TKT under increasing stiffness and confirmed their induction in pDCs experiencing elevated stiffness, regardless of TLR9 activation (Fig. 3 E). To better understand the impact of NRF2 on pDCs and to gain deeper insights into the link between the activation of NRF2 and transcriptional regulation of the PPP, we conducted a CUT&RUN assay to examine the binding of NRF2 to the promoter of the genes involved in this pathway. Human pDCs were incubated with CpG (TLR9-L) or with KI696 alone or in combination, and we observed clear segregation between the groups by PCA analysis (Fig. 3 F). We observed that TLR9 signaling significantly increased NRF2 binding at 4,144 (2,440 + 1,704) genomic regions, while co-treatment with TLR9-L and KI696 led to an increase at 4,445 (2,440 + 2,005) genomic regions (Fig. 3 G). Indeed, we used an UpSet plot analysis to compare these significantly differential peaks between TLR9-L and TLR9-L + KI696 stimulation and found that 2,440 genomic regions are shared between the two conditions (Fig. 3 G, labeled G1). In contrast, 2,005 genomic regions were uniquely induced by TLR9-L + KI696 (Fig. 3 G, labeled G2), while 1,704 regions were specific to TLR9-L alone (Fig. 3 G, labeled G3). Peak intensity was quantified using deepTools and visualized with a heatmap (Fig. 3 H), revealing that the G1 peaks are shared and exhibit similar intensity across conditions. To further understand the TFs regulating G1 peaks, we performed de novo motif analysis using HOMER, which identified NRF2 as the most significantly enriched motif under G1 peaks, as expected (Fig. 3 I). Interestingly, we also found enrichment of IRF, PU.1, and NF-κB motifs under G1 peaks, suggesting a potential cooperative interaction between these TFs in regulating these regions (Fig. 3 I). This finding implies that NRF2 may work in concert with other key regulators to modulate gene expression in response to TLR9-L and KI696 stimulation. Finally, representative gene tracks showing enhanced NRF2 binding in the TLR9-L + KI696 condition relative to TLR9-L were observed for HMOX1 and PPP genes such as G6PD and TKT (Fig. 3 J).

NRF2 inhibits IFN-I response in pDCs by activating the PPP . (A–D) Purified pDCs from HDs (n = 3) were cultured in media alone or with the NRF2 activator (KI696) for 1 h, followed by the TLR9 agonist (C274 at 0.075 μM) for 5 h and analyzed by RNA-seq. (A) PCA plot of RNA-seq analysis. (B) All differentially expressed genes identified by RNA-seq were analyzed for pathway analysis using gene set enrichment analysis. NES, normalized enrichment score. (C) IPA identified pathways that were significantly activated or inhibited by the NRF2 activator (KI696) in TLR9-activated pDCs, and upregulated and downregulated pathways are indicated in red and blue, respectively. (D) Heatmaps showing the genes that are involved in the PPP. (E) Purified pDCs from HDs (n = 4; three independent experiments) were cultured at a stiffness of 0 or 50 kPa for 1 h, followed by incubation with the TLR9 agonist (C274 at 0.075 μM) for 5 h. TKT and G6PD gene expressions were analyzed by Q-PCR. (F–J) Purified pDCs from HDs (n = 3) were cultured in media alone or with the NRF2 activator (KI696) for 1 h, followed by incubation with the TLR9 agonist (C274-0.075 μM) for 5 h. Cells were collected for CUT&RUN assay. Analysis of NRF2 CUT and RUN data obtained using pDCs from three independent donors and treated as indicated above. (F) PCA plot of NRF2 data for media, TLR9-L, KI696, and TLR9-L + KI696 treatment of primary human pDCs. (G) UpSet plot showing the overlap between differentially upregulated peaks induced by TLR9-L and TLR9-L + KI696 compared to resting media-treated pDCs. (H) Heatmap of the NRF2 normalized signal density surrounding peaks identified in Fig. 3 G and plotted under the indicated conditions. Results are presented in reads per kilobase per million mapped reads (RPKM) values within a range of ±3.0 kb around peak centers. (I) De novo motif analysis results using HOMER of NRF2 binding peaks that are shared by TLR9-L, and TLR9-L + KI696. (J) A representative IGV gene track is shown, illustrating treatment-induced NRF2 binding at the HMOX1, G6PD, and TKT loci. (K) Purified pDCs from HDs (n = 5; three independent experiments) were cultured in media alone or with the NRF2 activator (KI696) alone or with sodium pyruvate (10 mM) for 1 h, followed by incubation with the TLR9 agonist for 5 h. IFNA2 gene expression was analyzed by Q-PCR. (L) Purified pDCs from HDs (n = 4–5; three independent experiments) were transfected with CRISPR-Cas9 complex targeting for G6PD and TKT on exon 2 and exon 3 respectively using Lipofectamine CRISPRMAX reagent and cultured with IL3 (20 ng/ml) for 72 h. Cultured pDCs were treated alone or with the NRF2 activator (KI696) for 1 h, followed by incubation with the TLR9 agonist (C274-0.3 μM) for 5 h. IFNA2 gene expression was analyzed by Q-PCR. Individual donors are indicated; all results are represented as mean ± SEM; and statistical significance was evaluated using Mann-Whitney U test or one-way ANOVA, Tukey’s multiple comparisons test. *P < 0.05; ***P < 0.001.
NRF2 inhibits IFN-I response in pDCs by activating the PPP . (A–D) Purified pDCs from HDs (n = 3) were cultured in media alone or with the NRF2 activator (KI696) for 1 h, followed by the TLR9 agonist (C274 at 0.075 μM) for 5 h and analyzed by RNA-seq. (A) PCA plot of RNA-seq analysis. (B) All differentially expressed genes identified by RNA-seq were analyzed for pathway analysis using gene set enrichment analysis. NES, normalized enrichment score. (C) IPA identified pathways that were significantly activated or inhibited by the NRF2 activator (KI696) in TLR9-activated pDCs, and upregulated and downregulated pathways are indicated in red and blue, respectively. (D) Heatmaps showing the genes that are involved in the PPP. (E) Purified pDCs from HDs (n = 4; three independent experiments) were cultured at a stiffness of 0 or 50 kPa for 1 h, followed by incubation with the TLR9 agonist (C274 at 0.075 μM) for 5 h. TKT and G6PD gene expressions were analyzed by Q-PCR. (F–J) Purified pDCs from HDs (n = 3) were cultured in media alone or with the NRF2 activator (KI696) for 1 h, followed by incubation with the TLR9 agonist (C274-0.075 μM) for 5 h. Cells were collected for CUT&RUN assay. Analysis of NRF2 CUT and RUN data obtained using pDCs from three independent donors and treated as indicated above. (F) PCA plot of NRF2 data for media, TLR9-L, KI696, and TLR9-L + KI696 treatment of primary human pDCs. (G) UpSet plot showing the overlap between differentially upregulated peaks induced by TLR9-L and TLR9-L + KI696 compared to resting media-treated pDCs. (H) Heatmap of the NRF2 normalized signal density surrounding peaks identified in Fig. 3 G and plotted under the indicated conditions. Results are presented in reads per kilobase per million mapped reads (RPKM) values within a range of ±3.0 kb around peak centers. (I) De novo motif analysis results using HOMER of NRF2 binding peaks that are shared by TLR9-L, and TLR9-L + KI696. (J) A representative IGV gene track is shown, illustrating treatment-induced NRF2 binding at the HMOX1, G6PD, and TKT loci. (K) Purified pDCs from HDs (n = 5; three independent experiments) were cultured in media alone or with the NRF2 activator (KI696) alone or with sodium pyruvate (10 mM) for 1 h, followed by incubation with the TLR9 agonist for 5 h. IFNA2 gene expression was analyzed by Q-PCR. (L) Purified pDCs from HDs (n = 4–5; three independent experiments) were transfected with CRISPR-Cas9 complex targeting for G6PD and TKT on exon 2 and exon 3 respectively using Lipofectamine CRISPRMAX reagent and cultured with IL3 (20 ng/ml) for 72 h. Cultured pDCs were treated alone or with the NRF2 activator (KI696) for 1 h, followed by incubation with the TLR9 agonist (C274-0.3 μM) for 5 h. IFNA2 gene expression was analyzed by Q-PCR. Individual donors are indicated; all results are represented as mean ± SEM; and statistical significance was evaluated using Mann-Whitney U test or one-way ANOVA, Tukey’s multiple comparisons test. *P < 0.05; ***P < 0.001.
The activation of the PPP can divert glycolysis away from pyruvate synthesis, and we recently reported that pyruvate and the subsequent production of ATP are crucial for an optimal IFN-I response in pDCs (Chaudhary et al., 2022). Indeed, we observed that ATP levels were reduced in pDCs treated with KI696 (Fig. S2 N), and supplementing exogenous pyruvate could restore IFNA and IL6 expression in TLR9-activated pDCs in the presence of the activator of NRF2 (Fig. 3 K and Fig. S2 O). Using the CRISPR-Cas9 technique to knock down either G6PD or TKT, we observed that even the partial reduction in the expression of either of these genes (Fig. S2 P) prevented the inhibition of IFNA expression by KI696 in TLR9-stimulated pDCs (Fig. 3 L). Although some evidence has pointed to NRF2’s role in activating the PPP (Baardman et al., 2018; Ding et al., 2021), the link between mechanosensing, NRF2, and the PPP was unexpected. These new findings, combined with our recent description that the engagement of the TCA cycle is critical for optimal pDC function (Chaudhary et al., 2022), point to immunometabolism as a key regulator of pDC function, with defects being associated with disease. Similarly, these data also suggest that stress signals that induce key TFs such as XBP-1 or NRF2 are potent regulators of metabolic functions in pDCs with defects that are associated with the chronic activation of these cells. Similar mechanisms could be explored in other cell types, such as myeloid cells, where the effect of mechanosensing could be different, and other disease contexts. Hence, these results indicate that mechanosensing-driven activation of NRF2 induces PPP-related genes which can modulate the metabolic response in pDCs, which is necessary for optimal IFN-α responses in TLR9-activated pDCs.
Skin stiffness induces NRF2 activation in skin-infiltrating pDCs, which inhibits their IFN-I response
To determine the relevance of these findings in vivo, we employed a mild skin injury inflammatory model by tape stripping, which we and others have shown is associated with the induction of an IFN-I response due to the activation of pDCs in the skin (Ah Kioon et al., 2021; Du et al., 2022; Gregorio et al., 2010; Guiducci et al., 2010). Similar to previous findings, this acute model of skin injury induced a peak of inflammation at day 1, with significant infiltration of CD45+ cells in the skin, followed by resolution and tissue repair by day 5 (Fig. 4 A) (Ah Kioon et al., 2021; Du et al., 2022; Gregorio et al., 2010; Guiducci et al., 2010). Consistent with this, the expression of ISGs, like ISG15, ISG20, MX1, and IRF7, followed a similar pattern in the inflamed skin (Fig. 4 B). We then focused on pDCs and observed a similar increase in pDC infiltration into the skin by tape stripping on day 1, which at day 5 appeared reduced (Fig. 4 C), while as reported, no pDCs can be detected in naïve skin. Hence this model allows the rapid infiltration of pDCs in the skin in a controlled manner, which changes the stiffness upon pDCs from 0.01 kPa (blood) to about 2 kPa (skin), a 200-fold increase. Considering that pDCs are known to detect skin injuries and induce ISG expression (Gregorio et al., 2010; Guiducci et al., 2010; Ross et al., 2021), we FACS-sorted pDCs from the blood and skin at the early and late time points after injury. First, we observed that, in line with our data in total skin (Fig. 4 B), the expression of ISGs by the pDCs themselves was consistent with a significant induction in skin-infiltrating pDCs at day 1 and resolution at day 5 (Fig. 4 D). Strikingly, we observed that NRF2 was induced in the pDCs that infiltrate the skin of the mice, as compared to blood, and that its expression did not decrease at day 5 (Fig. 4 E).

Skin stiffness activates NRF2 to inhibit IFN responses and promotes inflammation resolution following mild skin injury using the tape-stripping model. (A–E) 8–10-wk-old C57BL/6 mice (n = 4–14 mice per group; three independent experiments) were either shaved only or tape stripped (TAPE). Blood and skin biopsies were collected on day 1 (D1) and day 5 after tape stripping. (A) CD45+ cell infiltration in inflamed skin was analyzed by flow cytometry. (B) ISGs such as IRF7, MX1, ISG20, and ISG15 gene expressions were analyzed by Q-PCR. (C) pDCs infiltration in inflamed skin was analyzed by flow cytometry. (D and E) pDCs (CD45+CD11b−Ly6G−CD317+) were sorted from the blood and inflamed skin of TAPE mice. (D) MX1 and ISG15 and (E) NRF2 gene expression were analyzed by Q-PCR. (F–H) 8–10-wk-old C57BL/6 mice or NRF2-KO mice (n = 4–7 mice per group; three independent experiments) were either shaved only or tape stripped (TAPE). Blood and skin biopsies were collected on day 5 after tape stripping. pDCs were sorted from the blood and the inflamed skin of TAPE mice and gene expression level of (F) HMOX1 (NRF2 regulated genes), (G) ISG15 and MX1, and (H) G6PD was quantified by Q-PCR. (I) 8–10 wk old C57BL/6 mice (n = 5 per group) were either shaved only or tape stripped (TAPE) and injected i.p. with either vehicle or KI696. Blood and skin biopsies were collected on day 1 after tape stripping. pDCs (CD45+CD11b−Ly6G−CD317+) were sorted from the skin of TAPE mice treated with either vehicle or KI696 and gene expression levels of ISGs such as MX1, ISG15, and ADAR were analyzed by Q-PCR. (J) pDC depletion was achieved in 9–16-wk-old BDCA2-DTR mice (pDC-dep) (n = 3–5 mice per group; two independent experiments) by i.p. injection of diphtheria toxin at day −3 and day −1 before tape stripping. pDC-dep mice and their WT C57BL/6 littermate mice were either shaved only or tape stripped (TAPE) and injected i.p. with either vehicle or KI696. Skin biopsies were collected on day 1 after tape stripping. Gene expression levels of IFNB1, IFNA2, IFNA4, and IFNA9 were analyzed in the skin by Q-PCR. (K and L) 8–10-wk-old C57BL/6 mice (n = 6–11 mice per group) were either shaved only or tape-stripped (TAPE) and injected i.p. with either vehicle or KI696. Skin biopsies were collected on day 1 after tape stripping. Representative images of H&E-stained skin sections at original magnification 10×. The presence of inflammation spreading in the dermis or adipose tissue is indicated by blue arrows or by the black dotted line for a large band of infiltrating cells. Ulcerations are represented by a square bracket for large areas of disepithelization or by a black arrow for microregions of epidermal loss. The length of the scale bars corresponds to 100 µm. (L) Average histology parameters scored from zero to three in 4–5 skin sections of naive (black), tape + vehicle (green), or tape + KI696 (red) for ulcer score (middle panel), for the degree of inflammation (right panel) and for total score (represented as the average sum of the two histology parameters). Individual mice from three different experiments are indicated; all results are represented as mean ± SEM; and statistical significance was evaluated using Mann–Whitney U test or one-way ANOVA, Tukey’s multiple comparisons test. *P < 0.05; **P < 0.01; ***P < 0.001.
Skin stiffness activates NRF2 to inhibit IFN responses and promotes inflammation resolution following mild skin injury using the tape-stripping model. (A–E) 8–10-wk-old C57BL/6 mice (n = 4–14 mice per group; three independent experiments) were either shaved only or tape stripped (TAPE). Blood and skin biopsies were collected on day 1 (D1) and day 5 after tape stripping. (A) CD45+ cell infiltration in inflamed skin was analyzed by flow cytometry. (B) ISGs such as IRF7, MX1, ISG20, and ISG15 gene expressions were analyzed by Q-PCR. (C) pDCs infiltration in inflamed skin was analyzed by flow cytometry. (D and E) pDCs (CD45+CD11b−Ly6G−CD317+) were sorted from the blood and inflamed skin of TAPE mice. (D) MX1 and ISG15 and (E) NRF2 gene expression were analyzed by Q-PCR. (F–H) 8–10-wk-old C57BL/6 mice or NRF2-KO mice (n = 4–7 mice per group; three independent experiments) were either shaved only or tape stripped (TAPE). Blood and skin biopsies were collected on day 5 after tape stripping. pDCs were sorted from the blood and the inflamed skin of TAPE mice and gene expression level of (F) HMOX1 (NRF2 regulated genes), (G) ISG15 and MX1, and (H) G6PD was quantified by Q-PCR. (I) 8–10 wk old C57BL/6 mice (n = 5 per group) were either shaved only or tape stripped (TAPE) and injected i.p. with either vehicle or KI696. Blood and skin biopsies were collected on day 1 after tape stripping. pDCs (CD45+CD11b−Ly6G−CD317+) were sorted from the skin of TAPE mice treated with either vehicle or KI696 and gene expression levels of ISGs such as MX1, ISG15, and ADAR were analyzed by Q-PCR. (J) pDC depletion was achieved in 9–16-wk-old BDCA2-DTR mice (pDC-dep) (n = 3–5 mice per group; two independent experiments) by i.p. injection of diphtheria toxin at day −3 and day −1 before tape stripping. pDC-dep mice and their WT C57BL/6 littermate mice were either shaved only or tape stripped (TAPE) and injected i.p. with either vehicle or KI696. Skin biopsies were collected on day 1 after tape stripping. Gene expression levels of IFNB1, IFNA2, IFNA4, and IFNA9 were analyzed in the skin by Q-PCR. (K and L) 8–10-wk-old C57BL/6 mice (n = 6–11 mice per group) were either shaved only or tape-stripped (TAPE) and injected i.p. with either vehicle or KI696. Skin biopsies were collected on day 1 after tape stripping. Representative images of H&E-stained skin sections at original magnification 10×. The presence of inflammation spreading in the dermis or adipose tissue is indicated by blue arrows or by the black dotted line for a large band of infiltrating cells. Ulcerations are represented by a square bracket for large areas of disepithelization or by a black arrow for microregions of epidermal loss. The length of the scale bars corresponds to 100 µm. (L) Average histology parameters scored from zero to three in 4–5 skin sections of naive (black), tape + vehicle (green), or tape + KI696 (red) for ulcer score (middle panel), for the degree of inflammation (right panel) and for total score (represented as the average sum of the two histology parameters). Individual mice from three different experiments are indicated; all results are represented as mean ± SEM; and statistical significance was evaluated using Mann–Whitney U test or one-way ANOVA, Tukey’s multiple comparisons test. *P < 0.05; **P < 0.01; ***P < 0.001.
To determine the link between NRF2 activation and the downregulation of ISG expression in the skin at the later time point after injury, we performed tape stripping using mice lacking NRF2 (NRF2-KO) and evaluated the inflammatory response at day 5. Although we could not delete NRF2 specifically in pDCs, we used total knockout mice but did evaluate the effect specifically on pDCs by sorting the cells from the skin of the mice. Although there was little to no difference in the number of pDCs infiltrating the skin in NRF2-KO mice as compared with wild-type (WT) mice (Fig. S3 A), we observed that the expression of the NRF2-dependent gene HMOX1 was significantly downregulated in sorted pDCs from the skin in the NRF2-KO mice (Fig. 4 F). This demonstrated the engagement of NRF2 in pDCs once they infiltrate the skin. The absence of NRF2 led to the increased expression of the IFN-regulated genes ISG15 and MX1 in sorted pDCs (Fig. 4 G), which was associated with the reduction of expression of G6PD in the skin-infiltrating pDCs (Fig. 4 H), suggesting the potential involvement of the PPP by NRF2 in pDCs once in the skin. The impact of NRF2 deletion was also evident in total skin with an increase in the number of neutrophils that infiltrate the skin of the NRF2-KO mice at day 5 as compared with WT mice (Fig. S3, B and C). The expression of ISGs was increased in the skin of NRF2-KO mice (Fig. S3 D), while we noted little to no change in the expression of non-ISGs genes such as IL1B (Fig. S3 E). These findings highlight that the activation of NRF2 in pDCs is associated with the inhibition of ISGs in vivo.

Skin stiffness activates NRF2 to inhibit IFN responses and promotes inflammation resolution following mild skin injury using the tape-stripping model. (A–E) 8–10-wk-old C57BL/6 mice or NRF2-KO mice (n = 4–10 mice per group; three to four independent experiments) were either shaved only or tape-stripped (TAPE). Blood and skin biopsies were collected on day 5 (D5) after tape stripping. (A) pDCs infiltration in inflamed skin was analyzed by flow cytometry. (B and C) Neutrophil infiltration in inflamed skin of (B) TAPE C57BL/6 mice on day 1 and day 5 and (C) WT or NRF2-KO TAPE mice on day 5 were analyzed by flow cytometry. (D and E) Gene expression levels of (D) MX1 and ISG15 and (E) non-ISGs inflammatory genes such as IL1B were analyzed by Q-PCR. (F–I) 8–10-wk-old C57BL/6 mice (n = 4–15 mice per group; three independent experiments) were either shaved only or tape-stripped (TAPE) and injected i.p. with either vehicle or KI696. Blood and skin biopsies were collected on day 1 after tape stripping. (F) CD45+ cell infiltration in inflamed skin was analyzed by flow cytometry. (G) pDCs infiltration in skin was analyzed by flow cytometry. (H) pDCs (CD45+CD11b−Ly6G−CD317+) were sorted from the skin of TAPE mice treated with either vehicle or KI696 and gene expression levels of HMOX1 were analyzed by Q-PCR. (I) Gene expression levels of IRF7, MX1, ISG20, ISG15, and OAS2 were analyzed in the skin by Q-PCR. (J) pDC depletion was achieved in 9–16-wk-old BDCA2-DTR mice (pDC-dep) (n = 3 mice per group; two independent experiments) by i.p. injection of diphtheria toxin on day −3 and day −1 before tape stripping. Spleens of BDCA2-DTR and C57BL/6 WT mice were harvested one day after tape stripping and the presence of pDCs (CD45+B220+SiglecH+CD317+) cells was analyzed by flow cytometry. (K) 8–12-wk-old C57BL/6 or NRF2-KO mice (n = 3–13 mice per group; three independent experiments) were either shaved only or tape stripped (TAPE) and injected i.p. with either vehicle or KI696. Skin biopsies were collected on day 1 after tape stripping. Gene expression levels of ISG20, ISG15, IRF7, and MX1 were analyzed in the skin by Q-PCR. (L and M) 8–10-wk-old C57BL/6 mice (n = 6–10 mice per group; three independent experiments) were either shaved only or tape stripped (TAPE) and injected i.p. with either vehicle or KI696. Blood and skin biopsies were collected on day 1 after tape stripping. (L) Neutrophils infiltration in inflamed skin of TAPE mice injected with either vehicle or KI696 was analyzed by flow cytometry. (M) Gene expression levels of IL1B, TNFA, and IL6 were analyzed in the skin by Q-PCR. Individual mice from three different experiments are indicated; all results are represented as mean ± SEM; and statistical significance was evaluated using Mann-Whitney U test or one-way ANOVA, Tukey’s multiple comparisons test. *P < 0.05; **P < 0.01; ***P < 0.001.
Skin stiffness activates NRF2 to inhibit IFN responses and promotes inflammation resolution following mild skin injury using the tape-stripping model. (A–E) 8–10-wk-old C57BL/6 mice or NRF2-KO mice (n = 4–10 mice per group; three to four independent experiments) were either shaved only or tape-stripped (TAPE). Blood and skin biopsies were collected on day 5 (D5) after tape stripping. (A) pDCs infiltration in inflamed skin was analyzed by flow cytometry. (B and C) Neutrophil infiltration in inflamed skin of (B) TAPE C57BL/6 mice on day 1 and day 5 and (C) WT or NRF2-KO TAPE mice on day 5 were analyzed by flow cytometry. (D and E) Gene expression levels of (D) MX1 and ISG15 and (E) non-ISGs inflammatory genes such as IL1B were analyzed by Q-PCR. (F–I) 8–10-wk-old C57BL/6 mice (n = 4–15 mice per group; three independent experiments) were either shaved only or tape-stripped (TAPE) and injected i.p. with either vehicle or KI696. Blood and skin biopsies were collected on day 1 after tape stripping. (F) CD45+ cell infiltration in inflamed skin was analyzed by flow cytometry. (G) pDCs infiltration in skin was analyzed by flow cytometry. (H) pDCs (CD45+CD11b−Ly6G−CD317+) were sorted from the skin of TAPE mice treated with either vehicle or KI696 and gene expression levels of HMOX1 were analyzed by Q-PCR. (I) Gene expression levels of IRF7, MX1, ISG20, ISG15, and OAS2 were analyzed in the skin by Q-PCR. (J) pDC depletion was achieved in 9–16-wk-old BDCA2-DTR mice (pDC-dep) (n = 3 mice per group; two independent experiments) by i.p. injection of diphtheria toxin on day −3 and day −1 before tape stripping. Spleens of BDCA2-DTR and C57BL/6 WT mice were harvested one day after tape stripping and the presence of pDCs (CD45+B220+SiglecH+CD317+) cells was analyzed by flow cytometry. (K) 8–12-wk-old C57BL/6 or NRF2-KO mice (n = 3–13 mice per group; three independent experiments) were either shaved only or tape stripped (TAPE) and injected i.p. with either vehicle or KI696. Skin biopsies were collected on day 1 after tape stripping. Gene expression levels of ISG20, ISG15, IRF7, and MX1 were analyzed in the skin by Q-PCR. (L and M) 8–10-wk-old C57BL/6 mice (n = 6–10 mice per group; three independent experiments) were either shaved only or tape stripped (TAPE) and injected i.p. with either vehicle or KI696. Blood and skin biopsies were collected on day 1 after tape stripping. (L) Neutrophils infiltration in inflamed skin of TAPE mice injected with either vehicle or KI696 was analyzed by flow cytometry. (M) Gene expression levels of IL1B, TNFA, and IL6 were analyzed in the skin by Q-PCR. Individual mice from three different experiments are indicated; all results are represented as mean ± SEM; and statistical significance was evaluated using Mann-Whitney U test or one-way ANOVA, Tukey’s multiple comparisons test. *P < 0.05; **P < 0.01; ***P < 0.001.
We have observed that the modulation of NRF2 using the activator KI696 effectively inhibited IFN-I production in pDCs (Fig. 2, J and K). Hence, WT mice were given either a vehicle or KI696 via intraperitoneal injection using a previously described dose (Davies et al., 2016) to determine the effect of NRF2 activation in vivo during skin injury by tape stripping. Activating NRF2 had a significant effect on the inflammatory response in the skin since we observed a decrease in the infiltration of CD45+ cells and of pDCs into the skin at day 1 following tape stripping (Fig. S3, F and G). To determine the effect on pDCs, we FACS-sorted the pDCs from the skin and observed that KI696 induced some HMOX1 expression in the skin-infiltrating pDCs (Fig. S3 H). The activation of NRF2 in vivo led to reduced ISGs in purified pDCs (Fig. 4 I) as well as in total skin (Fig. S3 I). Although we and others have described that in the absence of pDCs, the IFN-I response in the skin following tape-stripping is significantly reduced (Gregorio et al., 2010; Guiducci et al., 2010), we used systemic treatment with KI696, which may impact other cells than pDCs. Hence, the impact of KI696 was evaluated in mice where pDCs were depleted by injecting diphtheria toxin toxin into CLEC4C-DTR transgenic mice before tape stripping (Ah Kioon et al., 2018; Rowland et al., 2014). As expected, the depletion of pDCs (Fig. S3 J) led to reduced expression levels of IFNB1 as well as IFNA genes (Fig. 4 J). Interestingly, the treatment of mice with KI696 also significantly reduced the expression of these IFN-I genes, with no added effect when pDC-depleted mice received KI696 (Fig. 4 J). Of note, in these experiments, we quantified the expression levels of IFN-I transcripts, not ISGs, so we could determine the effect on the primary response and not on the IFN-induced response. In addition, we confirmed the specificity of the KI696 treatment as there was no effect by KI696 when we used NRF2-deficient mice (Fig. S3 K). Taken altogether, these data confirm that (1) pDCs are indeed the primary source of IFN-I following tape stripping, (2) the specificity of KI696 for NRF2 in vivo, and (3) that the effect of KI696 on the IFN-I response following tape stripping is dominantly through the inhibition of pDCs. Additionally, we noted a reduction in neutrophil infiltration (Fig. S3 L) and decreased levels of inflammatory cytokines such as IL6, IL1B, and TNFA in the inflamed skin (Fig. S3 M). Using previously described methods to determine ulceration and inflammation score in the skin (Ah Kioon et al., 2018, 2021; Guiducci et al., 2010), we observed that the activation of NRF2 had an impact on the skin at the histological level with reduction in ulceration and inflammation in the KI696-treated mice (Fig. 4, K and L).
Because pDCs are essential for the initial response to pathogens and can quickly infiltrate organs, such as the skin, a key question has been to define how to turn off these cells after the initial burst of IFN-I. Our data indicate that the sensing of the tissue microenvironment, particularly the cell membrane signals provided by tissue stiffness, is a critical element and that the normal process of inhibiting pDCs activation following an inflammatory insult is essential for wound healing. Hence, these data support a key role for NRF2 in regulating the IFN-I response in the skin and support the use of an NRF2 activator to prevent or resolve skin lesions.
In addition to mechanosensing, the injury model of the skin also induces an inflammatory response that is independent of pDCs (Gregorio et al., 2010; Guiducci et al., 2010), and these signals likely influenced the final response of the NRF2 activator in the skin. Untangling the various triggers will help decipher the precise interaction between inflammation and mechanosensing in the skin-infiltrating pDCs.
Dysregulated NRF2-mediated pDC response in the skin of SSc patients exacerbates the IFN-I response, contributing to fibrosis
To determine the role of NRF2 in controlling the pDC response in the skin in the human setting and to understand why ISGs are chronically expressed in the skin of autoimmune patients, we conducted a reanalysis of published sc-RNA-seq data performed on the blood and skin of healthy donors (n = 56) and SSc patients (n = 97) (Gur et al., 2022). In this work, the authors reported the presence of pDCs in the skin of patients but not HDs (Gur et al., 2022), supporting our previous findings (Ah Kioon et al., 2018). First, similar to our observation ex vivo (Fig. S1 I), we observed the absence of expression of YAP1 and TEAD1/2/3/4 in the pDCs that infiltrated the skin of SSc patients (Fig. 5 A). Next, we assessed the impact of stiffness in pDCs from the blood and skin of SSc by performing a differential gene expression analysis and focused on TFs. We observed the activation of NRF2 in the skin-infiltrating pDCs, as compared with the blood of these patients (Fig. 5 B), confirming the induction of NRF2 in skin-infiltrating pDCs. As previously reported by us and others, no pDCs were identified in healthy skin, so it was impossible to compare the expression levels of NRF2 in pDCs in the skin between SSc and HDs. A striking observation was the presence of IRF7 activation in these skin-infiltrating pDCs (Fig. 5 B), suggesting that, in contrast to our observation in vitro using cells from HDs or in vivo in normal mice, the activation of NRF2 is uncoupled from the inhibition of IFN-I in pDCs infiltrating the skin of SSc patients. Indeed, we separated pDCs with high versus low expression of NRF2 (Fig. 5 C) and observed no difference in the expression of ISGs between each group (Fig. 5 D). This demonstrates that the inhibition of the IFN-I response by NRF2 in pDCs observed in normal settings does not occur in patients.

CXCL4 counters the NRF2-driven inhibition of pDCs and NRF2 cannot prevent IFN-I in patients with SSc. (A–D) sc-RNA-seq of SSc patients from the published paper (Gur et al., 2022) were reanalyzed. (A) Expression of genes of the Hippo pathway in pDCs from the blood or the skin of 56 healthy donors and 97 SSc patients. (B) Differentially regulated transcriptional factors in skin-infiltrating pDCs as analyzed by QIAGEN IPA. Upregulated and downregulated genes are identified in red and blue, respectively. (C) Expression level of NFE2L2 (low versus high) in pDCs from the blood or the skin of SSc patients. (D) Expression of ISGs in pDCs with high or low expression of NFE2L2 from the skin of SSc patients. (E) Purified pDCs from HDs (n = 5; four independent experiments) were cultured at a stiffness of 0 or 50 kPa for 1 h, followed by incubation with the TLR9 agonist (C274 at 0.075 μM) alone or with CXCL4 (0.3, 1, and 3 μg/ml) for 15 h. IFNα secretion was analyzed by ELISA. (F) Purified pDCs from HDs (n = 5; four independent experiments) were cultured in media alone or with the NRF2 activator (KI696) for 1 h, followed by incubation with the TLR9 agonist (C274 at 0.075 μM) alone or with CXCL4 (3 μg/ml) for 15 h. IFNα secretion was analyzed by ELISA. (G) 8–10-wk-old C57BL/6 mice (n = 5–8 mice per group; four independent experiments) were either shaved only or tape stripped (TAPE) and injected i.p. with either vehicle or KI696 along with intradermal injection of murine CXCL4 (2 µg per mice). Blood and skin biopsies were collected on day 1 after tape stripping. Gene expression levels of IRF7, MX1, ISG20, and ISG15 were analyzed by Q-PCR. Individual donors or mice are indicated; all results are represented as mean ± SEM; and statistical significance was evaluated using Mann–Whitney U test. *P < 0.05; **P < 0.01; ***P < 0.001.
CXCL4 counters the NRF2-driven inhibition of pDCs and NRF2 cannot prevent IFN-I in patients with SSc. (A–D) sc-RNA-seq of SSc patients from the published paper (Gur et al., 2022) were reanalyzed. (A) Expression of genes of the Hippo pathway in pDCs from the blood or the skin of 56 healthy donors and 97 SSc patients. (B) Differentially regulated transcriptional factors in skin-infiltrating pDCs as analyzed by QIAGEN IPA. Upregulated and downregulated genes are identified in red and blue, respectively. (C) Expression level of NFE2L2 (low versus high) in pDCs from the blood or the skin of SSc patients. (D) Expression of ISGs in pDCs with high or low expression of NFE2L2 from the skin of SSc patients. (E) Purified pDCs from HDs (n = 5; four independent experiments) were cultured at a stiffness of 0 or 50 kPa for 1 h, followed by incubation with the TLR9 agonist (C274 at 0.075 μM) alone or with CXCL4 (0.3, 1, and 3 μg/ml) for 15 h. IFNα secretion was analyzed by ELISA. (F) Purified pDCs from HDs (n = 5; four independent experiments) were cultured in media alone or with the NRF2 activator (KI696) for 1 h, followed by incubation with the TLR9 agonist (C274 at 0.075 μM) alone or with CXCL4 (3 μg/ml) for 15 h. IFNα secretion was analyzed by ELISA. (G) 8–10-wk-old C57BL/6 mice (n = 5–8 mice per group; four independent experiments) were either shaved only or tape stripped (TAPE) and injected i.p. with either vehicle or KI696 along with intradermal injection of murine CXCL4 (2 µg per mice). Blood and skin biopsies were collected on day 1 after tape stripping. Gene expression levels of IRF7, MX1, ISG20, and ISG15 were analyzed by Q-PCR. Individual donors or mice are indicated; all results are represented as mean ± SEM; and statistical significance was evaluated using Mann–Whitney U test. *P < 0.05; **P < 0.01; ***P < 0.001.
We and others have reported that pDCs from patients with SSc exhibit sustained activation, resulting in continuous secretion of CXCL4 and promotion of IFN-α production (Ah Kioon et al., 2018; Du et al., 2022; Lande et al., 2019; van Bon et al., 2014). The role of CXCL4, which is elevated in patients with SSc (van Bon et al., 2014; Volkmann et al., 2016), in promoting pDC activation has been well documented, and we have shown that CXCL4 can be induced in inflamed and fibrotic skin leading to increased IFN-I by skin-infiltrating pDCs (Ah Kioon et al., 2018; Du et al., 2022). Hence, we tested whether CXCL4 could hinder the regulatory effect of stiffness-induced NRF2 in pDCs. Strikingly, we observed that the addition of CXCL4 could overcome the inhibitory effect of high stiffness on IFN-α production by pDCs (Fig. 5 E). This effect was also observed when cells were incubated with KI696 to provoke NRF2-mediated inhibition (Fig. 5 F). These findings demonstrate that CXCL4 can overcome the inhibitory effects of stiffness and NRF2 activation in pDC. To experimentally validate these findings in vivo, we administered CXCL4 to the inflamed skin of tape-stripped mice along with an NRF2 activator KI696. As previously observed, tape stripping induced ISGs in the skin of the mice, and we observed that the induction of the ISGs was inhibited by KI696 (Fig. 5 G). The addition of CXCL4 reverted this inhibition, with the engagement of NRF2 no longer leading to the inhibition of IFN-I in the skin (Fig. 5 G).
In summary, these data suggest that in patients with autoimmune diseases, the presence in the skin of CXCL4 and likely of other inflammatory chemokines overcomes this normal wound healing process to allow the chronic activation of the pDCs and establishment of fibrosis.
Concluding remarks
Data presented not only in preclinical models but also from human clinical trials have pointed to the role of pDCs as an important player in driving the chronic IFN-I response in the skin (Ah Kioon et al., 2018; Furie et al., 2019, 2022; Gerber et al., 2013; Gregorio et al., 2010; Guiducci et al., 2010; Karnell et al., 2021; Ross et al., 2021; Werth et al., 2022). As pDCs and the IFN-I they produce in response to nucleic acid sensing by TLRs also participate in wound healing (Gregorio et al., 2010), the challenge is to understand the regulation of pDCs once they reach the skin, a microenvironment with substantially higher stiffness than blood. Effective wound healing entails a period of acute inflammation that is then suppressed, with the resolution of inflammation allowing for the formation of new connective tissue and repair. Mechanisms documented to resolve the inflammatory phase of wound repair include efferocytosis, to clear cell debris, and inhibitory cytokines, such as IL-10 (Soliman and Barreda, 2022). The mechanosensing-induced NRF2-dependent pathway we described represents an additional and novel mechanism for the resolution of cutaneous inflammation.
In this study, we demonstrated that mechanosensing-induced signaling has a dramatic effect on the pDC response to TLR7 or TLR9 signaling by inducing a set of stress-associated TFs, particularly NRF2, leading to the inhibition of the IFN-I response. Interestingly, in addition to the reported role of NRF2 in controlling fibrosis (Kavian et al., 2018), it was shown that α-SMA+ myofibroblasts have reduced expression of NRF2 in SSc patients (Wei et al., 2017), although the role of NRF2 in fibroblasts might differ to what we observed in pDCs. We demonstrated that the engagement of NRF2 triggers the PPP, which dysregulates the metabolic cascade required for the optimal activation of pDCs. Whether the NRF2–IRF7 axis may be at play in other cell types is unclear and should be evaluated in further studies. In patients with SSc, pDCs have an activated status and exposure to the profibrotic cytokine CXCL4, and these cells are no longer responsive to mechanosensing, leading to the sustained activation of IFN-I and failure to resolve inflammatory lesions.
Overall, our data report a novel mechanosensing pathway contributing to the resolution of inflammatory processes in the skin and identify the key mediators as well as soluble factors that control whether the pDC production of IFN-I is well-regulated or sustained. These observations suggest opportunities to accelerate wound healing as well as strategies to limit the chronic inflammatory and fibrotic processes in patients with autoimmune skin diseases.
Materials and methods
Mice
All animal procedures were performed in accordance with the regulations of the Institutional Animal Care and Use Committee of the Hospital for Special Surgery and Weill Cornell Medical College. NRF2 KO-deficient mice (B6.129X1-Nfe2l2tm1Ywk/J) were purchased from Jackson Laboratory.
Purification and culture of pDCs from HDs and patients
Enriched leukocytes were obtained from the New York Blood Center (Long Island City, NY, USA) under internal Institutional Review Board of the Hospital for Special Surgery–approved protocols, and all experiments were approved by the Institutional Biosafety Committee (IBC #: 19-0231) from Weill Cornell Medicine. Peripheral blood mononuclear cells (PBMCs) were prepared using the Ficoll–Paque density gradient and pDCs were isolated using BDCA4+ positive selection (130-090-532; Miltenyi Biotec) as previously described (Guiducci et al., 2006). pDCs were cultured at 40,000 cells (for HDs) or at 10,000–20,000 cells (for patients with SSc and SLE) per well in a 96-U-bottom plate and incubated at 37°C, 5% CO2, and 95% humidity. For TLR7 and TLR9 activation assays, pDCs were stimulated with either heat-inactivated H1N1 VR-95 influenza A virus (ATCC) at a concentration of 2 MOI/cells or with CpG C274 at 0.075 μM (Guiducci et al., 2006), respectively. In some culture conditions, cells were cultured with ML385 (HY-100525; Medchemexpress), KI696 (HY-101140; Medchemexpress), 4-octyl itaconate (HY-112675; Medchemexpress), human integrin-β1/CD29 antibody (MAB17781; R&D), sodium pyruvate (8636; Sigma-Aldrich), human CXCL4 (SRP3142; Sigma-Aldrich), murine CXCL4 (250-39; Prepotech), pyrintegrin (HY-13306; Medchemexpress), and SuperTDU-131 (HY-P1728; Medchemexpress). 96-cell culture plates with various stiffness ranging from 0.2 to 50 kPa were purchased from Matrigen (Catalog No: SW96-HTS-COL-PK).
Flow cytometry and cell sorting
For surface staining or cell sorting, cells were stained with human FcR blocker (130-059-901; Miltenyi Biotec) or mouse CD16/32 (101302; Biolegend) with surface marker antibodies: mice CD45 (103106; Biolegend), mice CD11b (101216; Biolegend), mice Ly6G (560599; BD Bioscience), and mice CD317 (11-3172-82; eBioscience) in 1:100 dilution in FACS buffer for 30 min at 4°C. For intracellular staining, cultured pDCs were collected, washed in PBS, and fixed with fixation and permeabilization kit (00-5123-43; eBioscience) for 30 min at room temperature. Fixed pDCs were permeabilized with 0.05% digitonin in FACS buffer for 20 min at room temperature and stained with NRF2 antibody (CST:14409S; 1:50) for 1 h at room temperature. Cells were washed with FACS buffer and acquired by a fluorescence-activated cell sorter. For cell viability, cultured pDCs were washed in PBS and resuspended in FACS buffer with DAPI or propidium iodide (V13243B; Invitrogen) to be acquired by a fluorescence-activated cell sorter. For apoptotic cells, pDCs were stained with Annexin V (640917; Biolegend) in the Annexin staining buffer (422201; Biolegend) after the cell culture, as per the manufacturer’s protocol. Cells were washed with FACS buffer and acquired by a fluorescence-activated cell sorter. The data was analyzed using FlowJo analysis software.
RNA extraction and RT-PCR
pDCs from the cell culture, cell sorting, or total skin (Ah Kioon et al., 2018) were lysed for total RNA extraction using the Qiagen RNeasy Plus Mini Kit. The quantity of RNA was measured by Nanodrop, and a high-capacity cDNA Reverse Transcription kit (4368813; Thermo Fisher Scientific) was used to generate cDNA. qPCR reactions were performed. Gene expression levels were calculated based on relative threshold cycle (Ct) values as described (Barrat et al., 2005). This was done using the formula relative Ct = 1,000 × 1.8 (HSK−GENE), where HSK is the mean CT of duplicate housekeeping gene runs (Ubiquitin), GENE is the mean CT of duplicate runs of the gene of interest, and 1,000 is arbitrarily chosen as a factor to bring all values above 0. Primers are given in Table S1.
RNA-seq and analysis
Total RNA was extracted from cells using the Qiagen RNeasy Plus Mini Kit. All samples were examined for RNA quality by Agilent Bioanalyzer 2100. Illumina libraries were constructed using an NEB low-input library preparation kit. Multiplexed libraries were generated and pooled at equimolar concentration, and pair-end reads were sequenced on an Illumina NOVASeq 6000 in the Weill Cornell Epigenomics Core Facility at the depth of 21–37 million fragments per sample. Sequencing quality was measured with fastp (Chen et al., 2018). Reads mapped in genes were counted against the human genome (hg38) with STAR aligner and Gencode v21. Differential gene expression analysis was performed in R (R Core Team, 2020) using the edgeR package (Gu et al., 2016; Robinson et al., 2010). Genes with low expression levels (<3 cpm) were filtered from all downstream analyses. The Benjamini–Hochberg false discovery rate procedure was used to calculate the false discovery rate. Genes with P value <0.05 and log2 (fold-change) >1 were considered significant. Heatmaps were generated by Morpheus packages. Pathways analysis for differentially regulated genes was performed in Qiagen Ingenuity Pathway analysis (IPA) and z-scores or P value were plotted in Prism 9 where z-score ≤2 represents inhibition and z-score ≥2 represents activation.
CUT&RUN sequencing and analysis
CUT&RUN sequencing library preparation was performed as per the protocol (14-1048). Briefly, 2.5 × 10⁵ purified pDCs were cultured in 96-well U-bottom plates and left unstimulated or were cultured with KI696 for 1 h, followed by TLR9-ligand treatment for 5 h. Cells were harvested immediately for CUT&RUN sequencing library construction. For the CUT&RUN assay, we followed the manufacturer’s protocol using a CUT&RUN kit (EpiCypher catalog No: 14-1048) and NRF2 antibody (PA5-27882; Invitrogen). To create DNA libraries, we utilized fragmented DNA obtained from the CUT&RUN assay and processed it with the NEBNext Ultra II DNA Library Prep Kit for Illumina (New England Biolabs), adhering to the manufacturer’s instructions. Finally, the samples were sequenced using a pair-end 50-bp sequencing in Illumina NOVASeq 6000 platform and analyzed using CUT&RUNTools 2.0 (Yu et al., 2022). Briefly, the sequenced reads were aligned to the human genome (hg38) using bowtie2 (Langmead and Salzberg, 2012), and normalized coverage bigwig files relative to the sequencing depth were generated using BAMscale (Pongor et al., 2020). IGV browser from Broad Institute is used to visualize the normalized bigwig files (Robinson et al., 2011). Peak calling was conducted using MACS2 with the following parameters: “macs2 callpeak -t replicate1 replicate2 replicate3 -g hs -f BAMPE -q 0.01 --scale-to small --nomodel --keep-dup all.” A master consensus peak set was generated by merging the resulting peak files for each treatment condition, followed by merging peaks within 50 bp of each other. Quantification of peaks to compare global Cut and Run signal changes in the BAM files was conducted using the NCBI/BAMscale program. Raw count matrices were obtained utilizing the BAMscale program. Subsequent analysis utilized the HSS Genomic Core’s reproducible analysis pipeline for peak filtering, annotation relative to genomic features, differential peak analysis, and enrichment of signal around specific motifs using HOMER.
Single-cell RNA-seq (scRNA-seq) analysis
The original scRNA-seq data of each sample from GSE195452 (Gur et al., 2022) were combined and batch-corrected by Harmony (Korsunsky et al., 2019) and analyzed in SeuratV4 (Hao et al., 2021). The cell assignment and patient information were based on the metadata uploaded by the authors (Gur et al., 2022). pDC clusters were the combination of the original pDC and pDC_CXCR4 clusters. ISGs expression was calculated by AddModuleScore function by combining the expression of type I IFN stimulated genes (extracted from the Reactome database interferon alpha/beta signaling pathway). The comparison of pDC numbers in HD and SSc patients. The differentially expressed genes between skin and blood of SSc patients were calculated by FindMakers function with the logfc.threshold = 0.25, min.pct = 0.25. Differentially expressed genes between skin and blood of SSc patients were analyzed for transcriptional factor using Qiagen IPA and z-scores were plotted in Prism 9 where z-score ≤2 represents inhibition and z-score ≥2 represents activation. Violin plot showing the NFE2L2 expression in blood and skin tissues of pDC cells.
Chemokine and cytokine measurement
Secreted cytokines such as IFN-α (3425-1H-20; Mabtech) and IL-6 (3460-1H-20; Mabtech) were quantified in the supernatant of pDC cultures using ELISA according to the manufacturer’s protocol.
Western blotting
Cells were lysed in cold lysis buffer (50 mM Tris- HCl pH 7.4, 150 mM NaCl, 1 mM EDTA, 1% [vol/vol] Triton X-100, 2 mM Na3VO4, 1x phosSTOP EASYPACK, 1 mM Pefabloc, and 1× EDTA-free complete protease inhibitor cocktail [Roche]), and incubated for 30 min on ice. Then, cell debris was pelleted at 13,000 rpm at 4°C for 10 min. The soluble protein fraction was mixed with 4× Laemmli Sample buffer (Cat. #1610747; BIO-RAD) and 2-mercroptoehanol (Sigma-Aldrich). Samples for western blotting were subjected to electrophoresis on 4–12% Bis-Tris gels (Invitrogen). Proteins were transferred to polyvinylidene difluoride membrane. Membranes were blocked in 5% (wt/vol) bovine serum albumin in TBS (20 mm Tris, 50 mm NaCl, pH 8.0) with 0.1% (vol/vol) Tween-20 (TBST) at room temperature for at least 1 h with shaking at 60 rpm. Membranes were then incubated with primary antibody for NRF2 (12721; CST) at 4°C overnight with shaking at 60 rpm. Membranes were washed three times in TBST, then probed with anti-rabbit IgG secondary antibodies conjugated to horseradish peroxidase (cat: NA9310V and NA9340V; GE Healthcare) diluted in TBST at room temperature for 1 h with shaking at 60 rpm. Next, membranes were washed three times in TBST at room temperature with shaking at 60 rpm. Antibody binding was detected using enhanced chemiluminescent substrates for horseradish peroxidase (ECL western blotting reagents (cat: NEL105001EA; PerkinElmer), according to the manufacturer’s instructions, and visualized using premium autoradiography film (cat: E3018; Thomas Scientific).
ATP detection
ATP determination kit (A22066; Sigma-Aldrich) was used in pDC extracts as per the manufacturer’s protocol.
Gene editing in human pDCs
Human pDCs isolated from PBMCs were transfected by adding 150 nM sgRNA-CAS9 ribonucleoprotein complexes to 8 × 10⁴ cells in suspension using the Lipofectamine CRISPRMAX reagent (13778075; Thermo Fisher Scientific) and cultured in media with IL3 for the pDCs survival. All materials for sgRNA–Cas9 complex generation were purchased from Integrated DNA Technologies and prepared as instructed. 80 h after transfection, genetic ablation of target genes was assessed via quantitative RT-PCR. The 20-nucleotide CRISPR-RNA (crRNA) targeting human G6PD (Homo sapiens chromosome 22, GRCh38.p12, NC_001360016) is directed at the genomic sequence 5′-ACGGGCATAGCCCACGATGAAGG-3′, and human TKT (Homo sapiens chromosome 22, GRCh38.p12, NM_001064.4) is directed at the genomic sequence 5′-GACCGGGTGCCCGTCCAAGTCGG-3′ (the three additional nucleotides highlighted in bold represent the protospacer adjacent motif [PAM]). This target sequence corresponds to exon 1 of the human G6PD transcript and exon 3 of the human TKT transcript and was manually chosen by identifying a 20-base pair fragment immediately upstream of the highlighted PAM (Lee et al., 2014). The most likely on- and off-target effects of the manually selected CRISPR sequence were then analyzed using the Broad Institute’s Genetic Perturbation Platform (https://portals.broadinstitute.org/gpp/public/analysis-tools/%20sgrna-design). To validate the genomic editing capacity of the crRNA, quantitative RT-PCR was performed on total RNA isolated from cells transfected with sgRNA-Cas9 complexes containing the G6PD or TKT crRNA as described above. The primers for evaluating deletion efficacy are listed in Table S1.
Tape-stripping mice model
Tape stripping was performed after shaving the dorsal area (3 × 3 cm) and stripping the skin with 10 successive freshly cut 2–3-cm pieces of 3-M duct tape on the back of mice, as we have previously described (Ah Kioon et al., 2021; Du et al., 2022; Gregorio et al., 2010; Guiducci et al., 2010). PBMC were collected from blood, followed by RBC lysis. PBMC from naïve mice was used as a control. Skin biopsy was collected at the tape stripping site after 1 and 5 days for total skin RNA isolation, histology, flow cytometer, and cell sorting. Shaved mice were used as a control for the total skin RNA isolation. Cell suspensions were prepared by mincing skin, followed by digestion with a collagenase (SCR103; concentration:12.5 mg/ml; Sigma-Aldrich) and liberase TM (05401119001; concentration:100 μg/ml; Roche) diluted in 1 ml DMEM for 1.5 h at 37°C. The remaining tissue was filtered through a 70-μm strainer (VWR) followed by a 40-μm strainer. Cellular skin infiltrates were characterized by flow cytometry. pDCs were sorted and RNA was extracted. The following markers were used to identify pDCs (CD45hiCD11b−Ly6G−CD317+) and neutrophils (CD45hiCD11b+Ly6G+). For NRF2 activation, 50 μl of vehicle (5% DMSO, 40% PEG300, 5% Tween-80, and 50% PBS) or KI696 (30 mg/kg) was administered by i.p. injection 1 h before tape stripping. Murine CXCL4 (2 μg per mice) was administered by intradermal injection within 1 h of tape stripping. For pDC depletion: BDCA2-DTR transgenic mice (Rowland et al., 2014) were injected i.p. with 400 ng of diphtheria toxin at day −3 and day −1 before tape stripping. As a control, the C57BL/6 WT mice were also injected with diphtheria toxin. The depletion efficiency was confirmed by flow cytometry analysis of pDCs (CD45+ B220+SiglecH+CD317+) in the spleen.
Histological analysis of skin inflammation and tissue pathology
The biopsy specimens were fixed in formalin and embedded in paraffin. Sections were stained with hematoxylin-eosin. Multiple skin sections were evaluated in a blinded fashion. The following histological features: (1) dermal/adipose tissue inflammation and (2) ulceration were assessed and scored 0 when absent. Inflammation was given score 1 when inflammatory cells gathered in small groups within the dermis or the adipose tissue; score 2 was assigned to a band-like inflammation structure along the dermal–adipose tissue interface with scattering through the adipose tissue; and score 3 corresponded to a thick band of inflammatory cells within the dermis and/or in the adipose tissue. Ulceration was scored 1 when few areas of partial loss of epidermal layers were observed, scored 2 when moderate areas of the whole epidermis were missing, leading to exposure of the dermis, and scored 3 for large areas of partial or total loss of epidermis layers. The individual parameters were scored separately and summed to a total disease score. Images were captured at 10× using a Nikon Eclipse microscope coupled to a Nikon camera.
Statistical analysis
All statistical analyses were performed using GraphPad Prism 9 software. Comparisons between two groups were assessed using unpaired or paired (for matched comparisons) two-tailed Student’s t test or non-parametric Mann–Whitney U-test, or one-way ANOVA with Turkey’s correction, wherever applicable. Each dot indicates an individual donor or mice. Data are presented as mean ± SEM. P values of <0.05 were considered to be statistically significant.
Online supplemental material
Fig. S1 shows that mechanosensing inhibits pDCs response without impacting cellular viability and without the involvement of the Hippo pathway. It also describes the pathways induced by mechanosensing in pDCs by analyzing RNA-seq data with IPA. Fig. S2 describes the stress-associated TFs induced by mechanosensing and the involvement of the glycolysis pathways. It also shows the quantification of NRF2 protein levels and the production of IFN-I or other cytokines and the quantification of gene expression after CRISPR-Cas deletion in pDCs. Fig. S3 shows the effect of modulating NRF2, by depletion or activation, on the inflammatory response to mild skin injury. Table S1 shows the list of primers. Table S2 shows genes regulated by high stiffness in pDCs.
Data availability
The data underlying Fig. 5, A–D are openly available for download in the NCBI Gene Expression Omnibus (GEO) with accession number GEO: GSE195452 (Gur et al., 2022). The bulk RNA-seq data assessing the transcriptional effect of high stiffness and the NRF2 activator KI696 in pDCs and the Cut&Run data associated with NRF2 binding are available in the Gene Expression Omnibus database (accession number GSE282652 and GSE282697, respectively).
Acknowledgments
We thank the Weill Cornell Epigenomics Core Facility as well as David Oliver for helping with the genomic analysis.
This work was supported by the National Institutes of Health grant 1R01AI132447 (F.J. Barrat) and the Scleroderma Research Foundation (F.J. Barrat).
Author contributions: V. Chaudhary: Conceptualization, Data curation, Formal analysis, Investigation, Methodology, Project administration, Resources, Supervision, Validation, Visualization, Writing - original draft, Writing - review & editing, B. Mishra: Data curation, Formal analysis, Investigation, Methodology, Software, Visualization, Writing - review & editing, M.D. Ah Kioon: Investigation, Methodology, Writing - review & editing, Y. Du: Data curation, Software, L.B. Ivashkiv: Supervision, Writing - review & editing, M.K. Crow: Conceptualization, Resources, Writing - review & editing, F.J. Barrat: Conceptualization, Project administration, Resources, Supervision, Validation, Visualization, Writing - original draft, Writing - review & editing.

