


Nuclear factor Foxp3 determines regulatory T (Treg) cell fate and function via mechanisms that remain unclear. Here, we investigate the nature of Foxp3-mediated gene regulation in suppressing autoimmunity and antitumor immune response. Contrasting with previous models, we find that Foxp3–chromatin binding is regulated by Treg activation states, tumor microenvironment, and antigen and cytokine stimulations. Proteomics studies uncover dynamic proteins within Foxp3 proximity upon TCR or IL-2 receptor signaling in vitro, reflecting intricate interactions among Foxp3, signal transducers, and chromatin. Pharmacological inhibition and genetic knockdown experiments indicate that NFAT and AP-1 protein Batf are required for enhanced Foxp3–chromatin binding in activated Treg cells and tumor-infiltrating Treg cells to modulate target gene expression. Furthermore, mutations at the Foxp3 DNA-binding domain destabilize the Foxp3–chromatin association. These representative settings delineate context-dependent Foxp3–chromatin interaction, suggesting that Foxp3 associates with chromatin by hijacking DNA-binding proteins resulting from Treg activation or differentiation, which is stabilized by direct Foxp3–DNA binding, to dynamically regulate Treg cell function according to immunological contexts.

Introduction
Regulatory T (Treg) cells are a subtype of CD4 T cells that actively suppress autoreactive T cells and maintain immune homeostasis, the disruption of which underlies a spectrum of pathological conditions, including autoimmunity, tumor immune evasion, metabolic dysregulation, and tissue degeneration (Sakaguchi et al., 2020). Treg-lineage specification and immune regulatory function rely on forkhead box protein P3 (Foxp3), whose restricted expression in Treg cells is induced during differentiation by several signaling pathways, including those of T cell antigen receptor (TCR), interleukin-2 (IL-2), transforming growth factor β (TGF-β), and retinoic acid (Dikiy and Rudensky, 2023; Sakaguchi et al., 2020). Upon lineage commitment, Foxp3 transcription is stably maintained in the absence of induction cues mainly via Foxp3 enhancer CNS0 and CNS2 that act in a partially redundant manner (Li et al., 2021; Yue et al., 2016, 2019; Zong et al., 2021). Loss of Foxp3 leads to early-onset, lethal, systemic inflammation in mice (Brunkow et al., 2001; Fontenot et al., 2003), and mutations in human FOXP3 gene result in autoimmune IPEX syndrome (immune dysregulation, polyendocrinopathy, enteropathy, and X-linked) (Sakaguchi et al., 2020).
The indispensable role of Foxp3 raises a basic question about how Foxp3 confers Treg suppressive function at the transcriptional level (Rudensky, 2011). Several approaches have been taken to address this question. First, gene expression profiling of conventional T (Tcon) cells and Treg cells with or without Foxp3 ablation revealed Foxp3-dependent gene expression governing Treg cell fitness and suppressive function (Fontenot et al., 2005). Second, a survey of Foxp3-binding sites via chromatin immunoprecipitation (ChIP) in combination with Foxp3-dependent gene expression uncovered the genes likely directly controlled by Foxp3 (Fontenot et al., 2005; Marson et al., 2007; Samstein et al., 2012; Zheng et al., 2007). Third, Foxp3-interacting proteins identified by candidate-based approaches in Treg cells or by proteomics studies of purified Foxp3 complex in T cell lines suggest that Foxp3 executes its regulatory function via associated proteins (Kwon et al., 2017; Rudra et al., 2012). Although these findings significantly improved our fundamental understanding of how Foxp3 determines Treg cell identify and immunological function, the underlying biochemical nature is still elusive, as the precise activity modes of Foxp3 under different immunological conditions are unknown where Treg cells exhibit tunable function (Panduro et al., 2016; Togashi et al., 2019).
Foxp3 is widely considered a transcription factor with DNA-binding capability (Golson and Kaestner, 2016). Previous studies showed that Foxp3–chromatin binding and gene regulation appear to be static and that Foxp3 protein is constantly supplied through sustained transcription and translation (Dikiy and Rudensky, 2023; Sakaguchi et al., 2020). Foxp3 may constitutively bind to DNA to confer a rigid Treg cell fate and immune-suppressive function. This model raises a question of how factors known to modulate Treg’s immune-suppressive function (Dikiy and Rudensky, 2023) regulate the expression of Foxp3 target genes. Static Foxp3–chromatin binding and gene regulation may function at the basal layer, which is overlaid with the factors resulting from cell activation status or environmental cues, such as Nfatc2, Foxp1, Runx1, and Gata3 that bind to Foxp3 (Rudra et al., 2012). These two layers of regulators might antagonize, synergize, or act independently to control target genes’ expression. However, the dual DNA-binding capabilities of Foxp3 and its associated proteins raise a question of how the target specificity of Foxp3 complexes is determined.
Alternatively, Foxp3–chromatin binding could be context-dependent and regulated by environmental cues or cell differentiation states. This possibility has not been tested due to technical constraints. In this scenario, Foxp3–chromatin binding could be largely mediated by associated DNA-binding proteins that are downstream of signaling pathways or resulting from Treg activation or differentiation status. As a result, Foxp3 may modulate target genes’ expression by hijacking these induced DNA-binding proteins without significantly relying on its own DNA-binding capability. Alternatively, Foxp3 and these nuclear proteins may both contribute to DNA-binding affinity and/or target specificity. Nonetheless, these mechanisms would enable Foxp3 to regulate Treg cell function via context-specific chromatin binding.
Here, we tested these possibilities and delineated the Foxp3 activity modes in representative settings, producing mechanistic insights into the nature of Foxp3-dependent gene regulation. We found that Foxp3 mainly acts like a transcriptional cofactor, binding to chromatin by hijacking DNA-binding proteins derived from cell activation status or induced by environmental cues. This feature enables Foxp3 to “sense” the immunological contexts and dynamically tune Treg cell function.
Results
Remodeling of Foxp3–chromatin binding during Treg cell activation
Because antibody-based profiling of Foxp3–chromatin binding by ChIP sequencing (ChIP-seq) could generate artifacts, we took advantage of published Foxp3gfp knock-in mice that express a GFP–Foxp3 fusion protein (Fontenot et al., 2005). We reason that antibodies against exogenous GFP would not be affected by Foxp3-interacting proteins (Fig. S1 A). Indeed, signals generated by anti-GFP antibodies correlate well with GFP fluorescence assessed by flow cytometry (Fig. S1 B). We compared GFP antibodies with commercially available Foxp3 antibodies and identified a monoclonal antibody (clone FJK-16s) with comparable performance (Fig. S1 B). We then conducted CUT&Tag-seq or CUT&RUN-seq without crosslinking (Kaya-Okur et al., 2019; Meers et al., 2019) to assess the fidelity in probing Foxp3–chromatin binding in resting Treg cells (rTreg; CD44loCD62Lhi) and activated Treg cells (aTreg; CD44hiCD62Llo) isolated from lymphoid organs (Fig. 1 A). The signals generated by FJK-16s monoclonal antibody and GFP antibodies are closely related when the biological replicates of each group are compared, such as the Il10 locus (Fig. S1, C and D), indicating high efficiency and fidelity in profiling Foxp3–chromatin binding, so we chose FJK-16s for further CUT&Tag-seq or CUT&RUN-seq experiments.
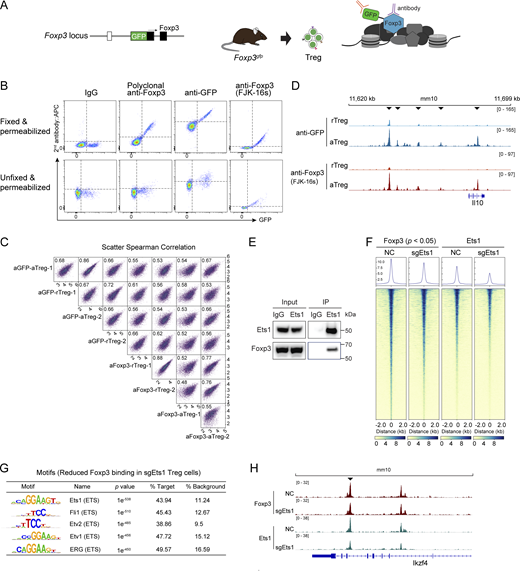
Assessment of Foxp3 and GFP antibodies for cellular staining and CUT&RUN-seq. (A) Schematic binding of Foxp3 and GFP antibodies in Treg cells isolated from Foxp3gfp knock-in mice expressing an N-terminal GFP:Foxp3 fusion protein. (B) Comparison of Foxp3 and GFP antibodies with flow cytometric staining of Treg cells isolated from Foxp3gfp mice. Cells were permeabilized with or without fixation before antibody staining. Data represent more than three experiments. (C) Cross-comparison of the CUT&RUN-seq results generated with rTreg and aTreg cells from Foxp3gfp mice and with anti-GFP and anti-Foxp3 (FJK-16s) antibodies. Two replicates per condition are shown. (D) Foxp3 peaks at the Il10 locus in rTreg and aTreg cells revealed by CUT&RUN-seq using anti-GFP and anti-Foxp3 (FJK-16s) antibodies as described above. Arrowheads indicate increased Foxp3 binding in aTreg cells. Data represent two replicates. (E) Co-immunoprecipitation of Ets1 and Foxp3 in in vitro induced Treg cells. (F) A heatmap showing Foxp3 and Ets1 binding in Treg cells after CRISPR deletion of Ets1. NC, non-targeting negative control sgRNA. (G) DNA sequence motifs for transcription factors enriched at the regions with reduced Foxp3 binding (P < 0.05) after Ets1 CRISPR knockout (sgEts1) in Treg cells. (H) Foxp3 and Ets1 peaks at the Ikzf4 locus in Treg cells that received retroviral sgEts1 or sgNC. Data are representative of two replicates. Source data are available for this figure: SourceData FS1.
Assessment of Foxp3 and GFP antibodies for cellular staining and CUT&RUN-seq. (A) Schematic binding of Foxp3 and GFP antibodies in Treg cells isolated from Foxp3gfp knock-in mice expressing an N-terminal GFP:Foxp3 fusion protein. (B) Comparison of Foxp3 and GFP antibodies with flow cytometric staining of Treg cells isolated from Foxp3gfp mice. Cells were permeabilized with or without fixation before antibody staining. Data represent more than three experiments. (C) Cross-comparison of the CUT&RUN-seq results generated with rTreg and aTreg cells from Foxp3gfp mice and with anti-GFP and anti-Foxp3 (FJK-16s) antibodies. Two replicates per condition are shown. (D) Foxp3 peaks at the Il10 locus in rTreg and aTreg cells revealed by CUT&RUN-seq using anti-GFP and anti-Foxp3 (FJK-16s) antibodies as described above. Arrowheads indicate increased Foxp3 binding in aTreg cells. Data represent two replicates. (E) Co-immunoprecipitation of Ets1 and Foxp3 in in vitro induced Treg cells. (F) A heatmap showing Foxp3 and Ets1 binding in Treg cells after CRISPR deletion of Ets1. NC, non-targeting negative control sgRNA. (G) DNA sequence motifs for transcription factors enriched at the regions with reduced Foxp3 binding (P < 0.05) after Ets1 CRISPR knockout (sgEts1) in Treg cells. (H) Foxp3 and Ets1 peaks at the Ikzf4 locus in Treg cells that received retroviral sgEts1 or sgNC. Data are representative of two replicates. Source data are available for this figure: SourceData FS1.

Characterization of Foxp3 chromatin-binding modes during Treg cell activation. (A) rTreg (CD44loCD62Lhi) and aTreg (CD44hiCD62Llo) cells were sorted to examine Foxp3–chromatin binding with CUT&RUN-seq or CUT&Tag-seq. Treg cells were gated to show CD44 and CD62L expression as well as Foxp3 protein levels after sorting. (B) A heatmap of Foxp3 CUT&RUN-seq showing three types of differential Foxp3 binding in aTreg and rTreg cells: increased (Up; P < 0.05, FC ≥ 2), constitutive (Cons; P > 0.5, 0.95 < FC < 1.05), and decreased (Down; P < 0.05, FC ≤ −2). Peak intensities were merged from two biological replicates. (C) Genomic distribution of Foxp3 peaks. Dis, distal regions (50 kb 5′ upstream or 3′ downstream); TES, transcription end sites. (D) Numbers of genes (with examples) associated with constitutive, increased (Up), and decreased (Down) Foxp3 binding in aTreg versus rTreg cells. These genes are defined by the nearest Foxp3 peaks to their transcription start sites. (E) Cross-comparison of gene expression (mRNA) and Foxp3–chromatin binding in aTreg and rTreg cells. Genes with significant changes (FC ≥ 2, FDR < 0.05) of both expression and Foxp3 binding are highlighted. Data were derived from two replicates per condition. (F) Distributions of Foxp3-binding modes (Up, Cons, Down, Other undetermined, and No binding) linked to differentially expressed genes (DEGs) in aTreg and rTreg cells defined in E. (G–I) Distribution of DEGs in aTreg and rTreg cells linked to Foxp3-binding modes: Cons (G), Up (H), and Down (I). For simplicity, only Treg-specific genes (i.e., P < 0.05 and |log2FC| > 0.58 between rTreg versus Tn cells or between aTreg versus Te cells) related to different Foxp3-binding modes are shown.
Characterization of Foxp3 chromatin-binding modes during Treg cell activation. (A) rTreg (CD44loCD62Lhi) and aTreg (CD44hiCD62Llo) cells were sorted to examine Foxp3–chromatin binding with CUT&RUN-seq or CUT&Tag-seq. Treg cells were gated to show CD44 and CD62L expression as well as Foxp3 protein levels after sorting. (B) A heatmap of Foxp3 CUT&RUN-seq showing three types of differential Foxp3 binding in aTreg and rTreg cells: increased (Up; P < 0.05, FC ≥ 2), constitutive (Cons; P > 0.5, 0.95 < FC < 1.05), and decreased (Down; P < 0.05, FC ≤ −2). Peak intensities were merged from two biological replicates. (C) Genomic distribution of Foxp3 peaks. Dis, distal regions (50 kb 5′ upstream or 3′ downstream); TES, transcription end sites. (D) Numbers of genes (with examples) associated with constitutive, increased (Up), and decreased (Down) Foxp3 binding in aTreg versus rTreg cells. These genes are defined by the nearest Foxp3 peaks to their transcription start sites. (E) Cross-comparison of gene expression (mRNA) and Foxp3–chromatin binding in aTreg and rTreg cells. Genes with significant changes (FC ≥ 2, FDR < 0.05) of both expression and Foxp3 binding are highlighted. Data were derived from two replicates per condition. (F) Distributions of Foxp3-binding modes (Up, Cons, Down, Other undetermined, and No binding) linked to differentially expressed genes (DEGs) in aTreg and rTreg cells defined in E. (G–I) Distribution of DEGs in aTreg and rTreg cells linked to Foxp3-binding modes: Cons (G), Up (H), and Down (I). For simplicity, only Treg-specific genes (i.e., P < 0.05 and |log2FC| > 0.58 between rTreg versus Tn cells or between aTreg versus Te cells) related to different Foxp3-binding modes are shown.
In vivo activation of Treg cells from rTreg to aTreg cells is accompanied by elevated immune-suppressive function. Knowing the features of Foxp3–chromatin binding and transcriptional regulation in these cells would help reveal how Treg cell function is regulated by Foxp3 during Treg cell activation. We, therefore, compared Foxp3–chromatin binding in rTreg and aTreg cells sorted from lymphoid organs of wild-type (WT) Foxp3gfp-DTR reporter mice (Kim et al., 2007). Among reproducible Foxp3 peaks, stringent categorization uncovered three distinct modules between aTreg and rTreg cells (Fig. 1 B): 2,784 peaks of constitutive (Cons) Foxp3 binding (P > 0.5 and 0.95 ≤ fold change [FC] ≤ 1.05), 2,594 peaks with increased (Up) Foxp3 binding in aTreg cells (P < 0.05 and FC ≥ 2), and 2,460 peaks with decreased (Down) Foxp3 binding in aTreg cells (P < 0.05, FC ≤ −2). Because Foxp3 protein levels remain relatively constant (Fig. 1 A), increased or decreased Foxp3 binding indicates dynamic Foxp3–chromatin interactions upon Treg activation in vivo.
Interestingly, 58.6% of constitutive and <23% of dynamic Foxp3 peaks are at promoter regions (Fig. 1 C), suggesting that Foxp3 acts on gene promoters mainly through static binding, whereas its association with distal elements (such as enhancers) is preferentially subjected to dynamic regulation during Treg cell activation. Most genes are linked to one Foxp3-binding mode (Fig. 1 D and Table S1). For example, Ikzf4 and Il10 are respectively linked with constitutive and increased Foxp3 binding in aTreg cells. More than 962 genes are linked to two or three Foxp3-binding modes (e.g., Ikzf2, Irf4, and Satb1), suggesting combinatorial regulation. Because anti-GFP and anti-Foxp3 monoclonal antibodies revealed nearly identical Foxp3-binding patterns in rTreg and aTreg cells (Fig. S1, C and D), we conclude that distinct Foxp3-binding modes uncovered in this experiment are not artifacts, instead reflecting a key feature of Foxp3-dependent gene regulation and excluding the model of static Foxp3–chromatin binding.
To begin understanding the functions of these Foxp3-binding modes, we compared them with differential gene expression patterns revealed by RNA sequencing (RNA-seq) (Fig. 1 E). A significant fraction of gene expression changes appear to be closely linked to Foxp3-binding modes. For example, 27% of upregulated genes in aTreg cells are related to increased Foxp3 binding and 27% of downregulated genes are linked to decreased Foxp3 binding (Fig. 1 F). Notably, although this categorization was based on stringent cutoff values (FC ≥ 2 and false discovery rate [FDR] < 0.05), leaving 34–55% of genes with unclassified Foxp3-binding modes (“Other” in Fig. 1 F), our overall conclusion still held true even when loose cutoff values were applied (not shown). Conversely, among Treg-specific genes (i.e., genes that are differentially expressed between rTreg and CD4 naïve T [Tn] cells or between aTreg and CD4 effector T [Te] cells), constitutive Foxp3 binding at 47% of 204 genes showed comparable expression between aTreg and rTreg cells, 70% of 323 genes were upregulated and linked to increased Foxp3 binding, and decreased Foxp3 binding at 40% of 234 genes were downregulated in aTreg cells (Fig. 1, G–I; and Table S1).
The overall relationship of Foxp3–chromatin binding to differential gene expression (Fig. 1 E) suggests that dynamic Foxp3–chromatin interaction at least partially controls gene expression in aTreg cells. The target specificity of Foxp3 binding appears to be determined by cellular contexts, which understates the contribution of direct Foxp3–DNA interaction shown by in vitro assays (Leng et al., 2022; Wu et al., 2006; Zhang et al., 2023).
Constant Foxp3–chromatin binding regulates the basal function of Treg cells
To understand how Foxp3-binding modes lead to differential gene expression, we first examined the genes linked to constitutive Foxp3 binding and compared the expression in aTreg and rTreg cells (“No change” in Fig. 1 G). We compared CD4 Tn, Te, rTreg, and aTreg cells: in comparison with Tcon cells, Treg cells contain two major categories of genes that are upregulated (e.g., Ppp1r3f, Kdm6b, Ikzf4, and Lrrc32) or downregulated (e.g., Lrrc1 and Hdac5), regardless of their activation status (Fig. 2 A). This result suggests that constitutive Foxp3 binding respectively promotes or suppresses gene expression in dominant-positive or -negative ways.
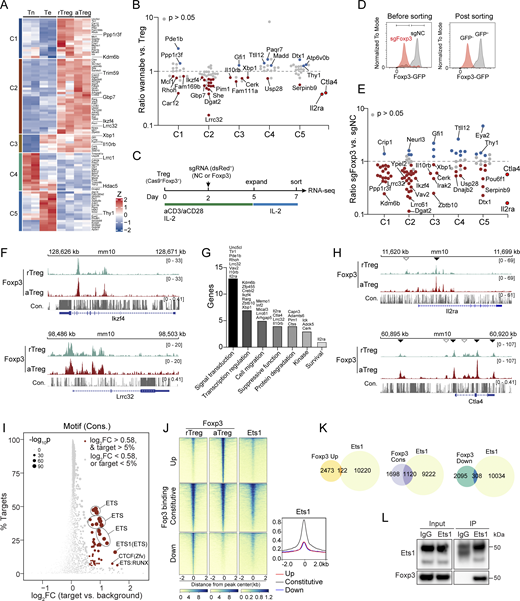
Constitutive Foxp3–chromatin binding regulates the basal function of Treg cells. (A) Expression patterns of genes with comparable expression levels in aTreg and rTreg cells defined in Fig. 1 G. Z scores of two biological replicates across samples are shown. (B) Ratios of gene expression levels of indicated clusters in published “wannabe” Treg cells and WT Treg cells isolated from heterozygous female mice (van der Veeken et al., 2020). Genes whose expression significantly changed (P ≤ 0.05) in wannabe Treg cells are highlighted: red, decreased; blue, increased. Ctla4 and Il2ra serve as controls. (C) Schematic of Foxp3 CRISPR deletion in nTreg cells. Treg cells were sorted from Foxp3gfpRosaCas9 mice. Cells were harvested on day 7 for RNA-seq. (D) Foxp3 expression in Treg cells transduced with negative control (NC) or Foxp3 sgRNAs. Data represent more than three experiments. (E) Ratios of gene expression of indicated clusters in sgFoxp3- and sgNC-transduced Treg cells. Genes whose expression significantly changed (P ≤ 0.05) are highlighted. Data were derived from two replicates per condition. Ctla4 and Il2ra are controls. (F) Foxp3 peaks at the Ikzf4 and Lrrc32 loci in rTreg and aTreg cells. Con., DNA sequence conservation in placental mammals. Data are representative of two replicates. (G) Functional annotation of selected genes (clusters C1–C3) linked to constitutive Foxp3 binding. (H) Foxp3 peaks at the Il2ra and Ctla4 loci. Empty arrowheads indicate constitutive Foxp3 binding, and filled arrowheads indicate increased Foxp3 binding in aTreg versus rTreg cells. Data are representative of two replicates. (I) DNA sequence motifs of transcription factors enriched at constitutive Foxp3-binding sites. (J and K) Comparison of Foxp3 and Ets1 peaks. Ets1 ChIP-seq data in bulk Treg cells are from Samstein et al. (2012). (L) Coimmunoprecipitation of Ets1 and Foxp3 in nTreg cells expanded in vitro for 7 days. Note: IgG and Ets1 bands partially overlap. Source data are available for this figure: SourceData F2.
Constitutive Foxp3–chromatin binding regulates the basal function of Treg cells. (A) Expression patterns of genes with comparable expression levels in aTreg and rTreg cells defined in Fig. 1 G. Z scores of two biological replicates across samples are shown. (B) Ratios of gene expression levels of indicated clusters in published “wannabe” Treg cells and WT Treg cells isolated from heterozygous female mice (van der Veeken et al., 2020). Genes whose expression significantly changed (P ≤ 0.05) in wannabe Treg cells are highlighted: red, decreased; blue, increased. Ctla4 and Il2ra serve as controls. (C) Schematic of Foxp3 CRISPR deletion in nTreg cells. Treg cells were sorted from Foxp3gfpRosaCas9 mice. Cells were harvested on day 7 for RNA-seq. (D) Foxp3 expression in Treg cells transduced with negative control (NC) or Foxp3 sgRNAs. Data represent more than three experiments. (E) Ratios of gene expression of indicated clusters in sgFoxp3- and sgNC-transduced Treg cells. Genes whose expression significantly changed (P ≤ 0.05) are highlighted. Data were derived from two replicates per condition. Ctla4 and Il2ra are controls. (F) Foxp3 peaks at the Ikzf4 and Lrrc32 loci in rTreg and aTreg cells. Con., DNA sequence conservation in placental mammals. Data are representative of two replicates. (G) Functional annotation of selected genes (clusters C1–C3) linked to constitutive Foxp3 binding. (H) Foxp3 peaks at the Il2ra and Ctla4 loci. Empty arrowheads indicate constitutive Foxp3 binding, and filled arrowheads indicate increased Foxp3 binding in aTreg versus rTreg cells. Data are representative of two replicates. (I) DNA sequence motifs of transcription factors enriched at constitutive Foxp3-binding sites. (J and K) Comparison of Foxp3 and Ets1 peaks. Ets1 ChIP-seq data in bulk Treg cells are from Samstein et al. (2012). (L) Coimmunoprecipitation of Ets1 and Foxp3 in nTreg cells expanded in vitro for 7 days. Note: IgG and Ets1 bands partially overlap. Source data are available for this figure: SourceData F2.
To determine the requirement for Foxp3 in the differential expression of these genes, we reanalyzed published data of WT Treg and “wannabe” Treg cells (i.e., Foxp3GFPKO reporter-positive but without functional Foxp3 protein) isolated from heterozygous Foxp3GFPKO/+ female mice whose autoimmune inflammation was fully suppressed by WT Treg cells (van der Veeken et al., 2020). We noticed a significantly altered gene expression in wannabe Treg cells, consistent with the known function of Foxp3 as demonstrated by diminished expression of the bona fide Foxp3 targets Il2ra and Ctla4 (Fig. 2 B). Notably, wannabe Treg cells exhibit significantly reduced fitness (Gavin et al., 2007), thus undergoing constant selection in vivo that could skew TCR and IL-2 signaling required for Treg cell survival. Therefore, differential gene expression in wannabe and WT Treg cells might not precisely reflect the role of Foxp3.
We then performed CRISPR deletion of Foxp3 in ex vivo isolated Treg cells from RosaCas9Foxp3gfp mice that constitutively express Cas9 protein to examine acute effects in the absence of in vivo selection (Fig. 2, C and D). This resulted in a profound downregulation and upregulation of gene expression (Fig. 2 E), further supporting the requirement for Foxp3 in constantly enhancing or repressing gene expression via constitutive chromatin binding in aTreg and rTreg cells (Fig. 2 F).
Genes linked to constitutive Foxp3–chromatin binding cover broad molecular and cellular functions, including signal transduction (e.g., Il2ra, Lrrc32, Vav2, and Pde1b), epigenetic and transcriptional regulation (e.g., Kdm6b, Ikzf4, and Xbp1), and immune suppression (e.g., Ctla4 and Il2ra; Fig. 2 G). Many genes, such as Il2ra and Ctla4, bear both constitutive and increased Foxp3–chromatin binding in aTreg versus rTreg cells (Fig. 2 H), suggesting functionally distinct enhancers targeted by Foxp3 before and after activation. DNA sequence motif analysis revealed significantly enriched ETS family proteins in regions bearing constitutive Foxp3 binding (Fig. 2 I), consistent with reported Ets1 ChIP-seq results in Treg cells (Samstein et al., 2012) showing elevated Ets1 peaks correlated with constitutive Foxp3 binding (Fig. 2, J and K). Foxp3 coprecipitated with Ets1 in both natural Treg (nTreg) and induced Treg cells (Fig. 2 L and Fig. S1 E), and CRISPR deletion of Ets1 in Treg cells led to reduced Foxp3–chromatin binding (Fig. S1, F–H), suggesting that constitutive Foxp3–chromatin binding in aTreg and rTreg cells is facilitated or mediated by ETS proteins, which are highly expressed in T cells (Mouly et al., 2010; Muthusamy et al., 1995), to control Treg cells’ basal functions.
Dynamic Foxp3–chromatin binding regulates tunable gene expression
Next, we evaluated the function of dynamic Foxp3–chromatin binding in aTreg and rTreg cells (Fig. 1, H and I). Increased Foxp3 binding is correlated with a marked upregulation of genes with crucial roles in aTreg cell function (e.g., Il10, Klrg1, Ctla4, Tigit, Batf, and Areg; Fig. 3 A, clusters C3, C4, and C5). It is also linked to a moderate increase of gene expression in clusters C1 and C2 between aTreg and rTreg cells. In Treg and Tcon cells, increased Foxp3–chromatin binding appears to primarily modulate the magnitude of gene expression in response to activation signals both positively and negatively (clusters C3–C5 and C1, respectively) to control cell proliferation, migration, adhesion, and immune-suppressive function (Fig. 3 B).

Dynamic Foxp3 binding regulates tunable gene expression in aTreg cells. (A) Expression patterns of genes that are upregulated and linked to increased Foxp3–chromatin binding in aTreg versus rTreg cells are defined in Fig. 1 H. (B) Functional annotation of genes in clusters C3–C5. Neg, negative. Proc, process. (C) Ratios of gene expression levels in resting and activated wannabe Treg and WT Treg cells (van der Veeken et al., 2020). (D) Schematic procedures of Foxp3 CRISPR deletion and restimulation of Treg cells by anti-CD3 and anti-CD28 antibodies. Treg cells were sorted from Foxp3gfpRosaCas9 mice. (E) Ratios of gene expression levels in Cas9-expressing Treg cells that received retroviral sgFoxp3 and sgNC with or without TCR/costimulation. Data are averages of two replicates. (F) Normalized expression levels of Klrg1, Tnfrsf8, and Tnfrsf9 in rTreg cells, aTreg cells, and activated and resting wannabe Treg cells (van der Veeken et al., 2020). CPM, count per million. Unpaired, two-tailed t tests; ***P < 0.001, ****P < 0.0001. n = 3 replicates. (G) Expression levels of indicated genes in sgNC- and sgFoxp3-transduced Treg cells with or without TCR restimulation. n = 2 replicates. (H) Cross-comparison of Treg and Tcon cells for genes that are downregulated and linked to decreased Foxp3–chromatin binding in aTreg cells versus rTreg cells defined in Fig. 1 I. (I) Foxp3 binding at the Gata1 locus in rTreg and aTreg cells. Data are representative of two replicates. Filled arrowhead indicates decreased Foxp3 binding in aTreg cells. (J) Comparison of Foxp3–chromatin binding and ATAC-seq in rTreg and aTreg cells. Data were derived from two replicates; P values represent unpaired, two-sample Wilcoxon tests.
Dynamic Foxp3 binding regulates tunable gene expression in aTreg cells. (A) Expression patterns of genes that are upregulated and linked to increased Foxp3–chromatin binding in aTreg versus rTreg cells are defined in Fig. 1 H. (B) Functional annotation of genes in clusters C3–C5. Neg, negative. Proc, process. (C) Ratios of gene expression levels in resting and activated wannabe Treg and WT Treg cells (van der Veeken et al., 2020). (D) Schematic procedures of Foxp3 CRISPR deletion and restimulation of Treg cells by anti-CD3 and anti-CD28 antibodies. Treg cells were sorted from Foxp3gfpRosaCas9 mice. (E) Ratios of gene expression levels in Cas9-expressing Treg cells that received retroviral sgFoxp3 and sgNC with or without TCR/costimulation. Data are averages of two replicates. (F) Normalized expression levels of Klrg1, Tnfrsf8, and Tnfrsf9 in rTreg cells, aTreg cells, and activated and resting wannabe Treg cells (van der Veeken et al., 2020). CPM, count per million. Unpaired, two-tailed t tests; ***P < 0.001, ****P < 0.0001. n = 3 replicates. (G) Expression levels of indicated genes in sgNC- and sgFoxp3-transduced Treg cells with or without TCR restimulation. n = 2 replicates. (H) Cross-comparison of Treg and Tcon cells for genes that are downregulated and linked to decreased Foxp3–chromatin binding in aTreg cells versus rTreg cells defined in Fig. 1 I. (I) Foxp3 binding at the Gata1 locus in rTreg and aTreg cells. Data are representative of two replicates. Filled arrowhead indicates decreased Foxp3 binding in aTreg cells. (J) Comparison of Foxp3–chromatin binding and ATAC-seq in rTreg and aTreg cells. Data were derived from two replicates; P values represent unpaired, two-sample Wilcoxon tests.
We then assessed the requirement for Foxp3 in differential gene expression by re-examining published data of resting and activated wannabe Treg and WT Treg cells (van der Veeken et al., 2020) (Fig. 3 C). We deleted Foxp3 by CRISPR in WT Treg cells followed by a 3-h mock treatment or TCR stimulation and costimulation (Fig. 3, D and E). Despite considerable differences in these two settings, Foxp3 deficiency resulted in consistently reduced expression of a significant fraction of the genes in all clusters, especially those contributing to elevated Treg function upon activation. For example, in vivo activation and in vitro TCR/costimulation upregulated Ctla4, Klrg1, Tnfrsf9, and Il10 expression, which was diminished upon Foxp3 ablation (Fig. 3, F and G).
Decreased Foxp3–chromatin binding is often linked to the downregulation of genes such as Gata1 and Il2ra in aTreg cells compared with rTreg cells (Fig. 1 I; and Fig. 3, H and I). These genes belong to two categories: higher expression (clusters D1–D3) and lower expression (clusters D4 and D5) in rTreg cells than in Tn and Te cells, suggesting positive and negative roles of Foxp3–chromatin binding, respectively. Foxp3 ablation in wannabe Treg cells or upon CRISPR deletion helped distinguish the overall function of Foxp3 (Fig. S2, A and B). For example, Foxp3 deficiency resulted in the downregulation of Gata1 and upregulation of Pde3b (Fig. S2 C), consistent with their relative expression levels in rTreg and aTreg cells (Fig. 3 H).

Assessment of the role of dynamic Foxp3–chromatin binding in regulating gene expression. (A) Ratios of gene expression levels (assessed by RNA-seq) in resting and activated wannabe and Treg cells (van der Veeken et al., 2020) for gene clusters defined in (Fig. 3 H). Genes whose expression was significantly changed in wannabe Treg cells are highlighted (red, decreased; blue, increased). (B) Ratios of gene expression levels in Treg cells with or without Foxp3 CRISPR deletion for gene clusters defined in (Fig. 3 H). Treg cells were treated with or without TCR agonists for 3 h before RNA-seq. Genes whose expression significantly changed after Foxp3 deletion are highlighted. Data are averages of two replicates. (C) Comparison of the expression levels of Gata1 and Pde3b in rTreg, aTreg, and resting and activated wannabe Treg cells (rWannabe and aWannabe). CPM, count per million. (D and E) DNA sequence motifs for transcription factors enriched at regions with increased (D) or decreased (E) Foxp3 binding in aTreg versus rTreg cells. (F and G) Comparison of Foxp3 binding and chromatin accessibility (ATAC-seq) in aTreg and rTreg cells. Data were merged from two replicates.
Assessment of the role of dynamic Foxp3–chromatin binding in regulating gene expression. (A) Ratios of gene expression levels (assessed by RNA-seq) in resting and activated wannabe and Treg cells (van der Veeken et al., 2020) for gene clusters defined in (Fig. 3 H). Genes whose expression was significantly changed in wannabe Treg cells are highlighted (red, decreased; blue, increased). (B) Ratios of gene expression levels in Treg cells with or without Foxp3 CRISPR deletion for gene clusters defined in (Fig. 3 H). Treg cells were treated with or without TCR agonists for 3 h before RNA-seq. Genes whose expression significantly changed after Foxp3 deletion are highlighted. Data are averages of two replicates. (C) Comparison of the expression levels of Gata1 and Pde3b in rTreg, aTreg, and resting and activated wannabe Treg cells (rWannabe and aWannabe). CPM, count per million. (D and E) DNA sequence motifs for transcription factors enriched at regions with increased (D) or decreased (E) Foxp3 binding in aTreg versus rTreg cells. (F and G) Comparison of Foxp3 binding and chromatin accessibility (ATAC-seq) in aTreg and rTreg cells. Data were merged from two replicates.
Regions bearing increased Foxp3 binding in aTreg cells are enriched with DNA sequence motifs for AP-1 family proteins (e.g., Batf and JunB), whereas those with reduced Foxp3 binding are linked to ETS motifs (Fig. S2, D and E), suggesting that Foxp3 recruitment and displacement are controlled by distinct DNA-binding proteins. Foxp3-binding modes in aTreg and rTreg cells are also correlated with the changes of chromatin accessibility assessed by assay for transposase-accessible chromatin by sequencing (ATAC-seq) (Buenrostro et al., 2015) (Fig. 3 J; and Fig. S2, F and G), suggesting that both chromatin architecture and Foxp3 binding are remodeled during Treg activation, probably by common regulators.
IL-2 and TCR signaling direct Foxp3–chromatin binding
We then tested whether environmental cues regulate Foxp3–chromatin binding. Because TCR and IL-2 receptor signaling are essential for Treg cell survival, activation, differentiation, and immune suppression (Chinen et al., 2016; Levine et al., 2014; Schmidt et al., 2015), we examined the effects of acute TCR or IL-2 stimulation on Foxp3–chromatin binding by treating rTreg cells sorted from Foxp3gfp-DTR reporter mice with recombinant IL-2 or plate-bound anti-CD3 and anti-CD28 antibodies for 3 h before performing Foxp3 CUT&RUN-seq (Fig. 4 A).

Acute IL-2 and TCR signaling induces dynamic Foxp3–chromatin binding. (A) Schematic procedures for IL-2 and TCR stimulations of ex vivo isolated Treg cells. The rTreg cells were FACS-sorted from lymphoid organs of Foxp3gfp-DTR mice and stimulated with plate-bound anti-CD3 and anti-CD28 antibodies (1 µg/ml each) or recombinant IL-2 (500 U/ml) for 3 h before Foxp3 CUT&RUN-seq. Flow cytometry plot is reused (Fig. 1 A). (B) Principal component analysis (PCA) of Foxp3 CUT&RUN-seq results. n = 2 replicates. (C and D) Changes in Foxp3–chromatin binding in rTreg cells after 3 h of TCR (C) or IL-2 (D) stimulation. Increased (Up) and decreased (Down) Foxp3 binding is defined by P < 0.05, FC ≥ 2; and constitutive (Cons.) Foxp3 binding, by P > 0.5, 0.95 < FC < 1.05. (E and F) Comparison of the peaks (E) and linked genes (F) of different Foxp3–chromatin binding modes in aTreg (versus rTreg) and rTreg cells after IL-2 or TCR stimulation. (G–I) Representative Foxp3 peaks at the Il10 and Ctla4 (G), Il1rl1 (H), and Bcl2 (I) loci. Arrowheads indicate sites with increased Foxp3 binding in aTreg versus rTreg cells or in rTreg cells after IL-2 or TCR stimulation. Data represent two replicates. (J and K) DNA sequence motifs for transcription factors enriched at regions with increased Foxp3 binding in rTreg cells upon TCR (J) or IL-2 (K) stimulation.
Acute IL-2 and TCR signaling induces dynamic Foxp3–chromatin binding. (A) Schematic procedures for IL-2 and TCR stimulations of ex vivo isolated Treg cells. The rTreg cells were FACS-sorted from lymphoid organs of Foxp3gfp-DTR mice and stimulated with plate-bound anti-CD3 and anti-CD28 antibodies (1 µg/ml each) or recombinant IL-2 (500 U/ml) for 3 h before Foxp3 CUT&RUN-seq. Flow cytometry plot is reused (Fig. 1 A). (B) Principal component analysis (PCA) of Foxp3 CUT&RUN-seq results. n = 2 replicates. (C and D) Changes in Foxp3–chromatin binding in rTreg cells after 3 h of TCR (C) or IL-2 (D) stimulation. Increased (Up) and decreased (Down) Foxp3 binding is defined by P < 0.05, FC ≥ 2; and constitutive (Cons.) Foxp3 binding, by P > 0.5, 0.95 < FC < 1.05. (E and F) Comparison of the peaks (E) and linked genes (F) of different Foxp3–chromatin binding modes in aTreg (versus rTreg) and rTreg cells after IL-2 or TCR stimulation. (G–I) Representative Foxp3 peaks at the Il10 and Ctla4 (G), Il1rl1 (H), and Bcl2 (I) loci. Arrowheads indicate sites with increased Foxp3 binding in aTreg versus rTreg cells or in rTreg cells after IL-2 or TCR stimulation. Data represent two replicates. (J and K) DNA sequence motifs for transcription factors enriched at regions with increased Foxp3 binding in rTreg cells upon TCR (J) or IL-2 (K) stimulation.
Overall, IL-2 and TCR/co-receptor stimulations induced distinct Foxp3-binding profiles, as assessed by principal component analysis (Fig. 4 B). Similar to Foxp3-binding modes in aTreg and rTreg cells (Fig. 1 B), these stimulations also induced distinct patterns of Foxp3–chromatin binding (Fig. 4, C and D). To determine the extent to which Foxp3–chromatin binding is specific to individual contexts, we cross-compared three categories of Foxp3-binding sites. Remarkably, nearly all sites with increased or constitutive Foxp3 binding were specific to experimental conditions (Fig. 4 E). In contrast, significantly more sites with decreased Foxp3 binding were common in Treg cells upon IL-2 and TCR/co-receptor stimulations but distinct from those between aTreg and rTreg cells. These results were slightly shifted when related genes were compared (Fig. 4 F) because a gene may contain several Foxp3-binding sites. For example, Foxp3 binding at a few sites in the Il10 and Ctla4 loci is enhanced upon TCR/costimulation, akin to aTreg cells (Fig. 4 G); increased Foxp3 binding at Il1rl1 is induced by IL-2 signaling but not by TCR signaling (Fig. 4 H); and Foxp3 binding at Bcl2 is elevated by both IL-2 and TCR/costimulations (Fig. 4 I).
Regions with increased Foxp3 binding upon TCR/costimulation are enriched with the DNA sequence motifs for AP-1 proteins (Fig. 4 J) that are downstream of TCR signaling (Gaud et al., 2018). Likewise, those with increased Foxp3 binding after IL-2 stimulation are enriched with STAT5 motifs, a major downstream signal transducer and transcriptional activator (Lin and Leonard, 2000) (Fig. 4 K). The results from these representative settings depict a model in which Foxp3–chromatin binding is at least partially determined by the DNA-binding proteins induced by environmental cues or during cell activation or differentiation.
Tumor environment enhances Treg cell function by targeting Foxp3–chromatin binding
Tumor-infiltrating Treg (tuTreg) cells suppress antitumor immunity (Togashi et al., 2019), offering an exceptional setting to interrogate Foxp3–chromatin interaction and tunable Treg cell function. By assessing CD44 and Klrg1 expression, we confirmed that tuTreg cells in MC38 colon adenocarcinoma are significantly more activated than their counterparts in the spleen and draining lymph nodes (Fig. 5, A–C). If tumor microenvironment (TME) and lymphoid organs enhance Treg cells’ function through the same pathways, then Foxp3–chromatin binding in these two conditions would vary only in quantity (e.g., intensity of Foxp3 binding) but not quality (e.g., genomic regions and target genes). Alternatively, the TME may also present stimuli (including antigens, growth factors, cytokines, hypoxia, and nutritional deprivation) (Anderson and Simon, 2020) that are substantially distinct from those of lymphoid organs, increasing Treg cells’ suppressive function by regulating Foxp3 binding at distinct regions.

Tumor microenvironment remodels Foxp3–chromatin binding linked to enhanced Treg suppressive function. (A–C) CD44 and Klrg1 expression in Treg and Tcon cells isolated from spleen, MC38 tumor, and tumor-draining lymph nodes (dLN). n = 5. Data represent more than three experiments. Paired, two-tailed t tests; **P < 0.01. tuTreg cells were used for CUT&RUN-seq. (D) Regions with increased Foxp3 binding in aTreg versus rTreg cells from lymphoid organs and in tuTreg versus aTreg cells from lymphoid organs. Unique 1: increased Foxp3 binding in aTreg versus rTreg cells (P < 0.05, FC ≥ 2) but not in tuTreg versus aTreg cells; unique 2: increased Foxp3 binding in tuTreg versus aTreg cells (P < 0.05, FC ≥ 2) but not in aTreg versus rTreg cells; overlap: increased Foxp3 binding in both aTreg versus rTreg cells and in tuTreg versus aTreg cells. Two replicates were merged for analysis. (E) Regions with decreased Foxp3 binding. Unique 1: reduced Foxp3 binding in aTreg versus rTreg cells (P < 0.05, FC ≤ −2) but not in tuTreg versus aTreg cells; unique 2: reduced Foxp3 binding in tuTreg versus aTreg cells (P < 0.05, FC ≤ −2) but not in aTreg versus rTreg cells; overlap: reduced Foxp3 binding in both aTreg versus rTreg cells and in tuTreg versus aTreg cells. Differences between tuTreg and aTreg cells in unique 1 group are not statistically significant. (F and G) Peaks (F) and genes (G) linked to increased (Up) and decreased (Down) Foxp3 binding in aTreg versus rTreg cells and in tuTreg versus aTreg cells. Representative genes are shown. (H and I) Foxp3 peaks at the Klrg1 (H) and Runx2 (I) loci. Arrowheads indicate sites with increased Foxp3 binding in tuTreg cells. Data are representative of two replicates. (J) Comparison of genes linked to increased Foxp3 binding in aTreg versus rTreg, tuTreg versus aTreg, and rTreg cells after TCR stimulation in vitro. (K) DNA sequence motifs for transcription factors enriched at regions with increased Foxp3 binding in the overlap and unique groups defined in D. (L) DNA sequence motifs for transcription factors enriched at regions with decreased Foxp3 binding in aTreg versus rTreg cells and in tuTreg versus aTreg cells, respectively defined as unique 1 and unique 2 groups in E. (M) Percentages of canonical forkhead motif (FKHM) or TnG repeats enriched at Foxp3-binding sites defined in D compared with other regions (background).
Tumor microenvironment remodels Foxp3–chromatin binding linked to enhanced Treg suppressive function. (A–C) CD44 and Klrg1 expression in Treg and Tcon cells isolated from spleen, MC38 tumor, and tumor-draining lymph nodes (dLN). n = 5. Data represent more than three experiments. Paired, two-tailed t tests; **P < 0.01. tuTreg cells were used for CUT&RUN-seq. (D) Regions with increased Foxp3 binding in aTreg versus rTreg cells from lymphoid organs and in tuTreg versus aTreg cells from lymphoid organs. Unique 1: increased Foxp3 binding in aTreg versus rTreg cells (P < 0.05, FC ≥ 2) but not in tuTreg versus aTreg cells; unique 2: increased Foxp3 binding in tuTreg versus aTreg cells (P < 0.05, FC ≥ 2) but not in aTreg versus rTreg cells; overlap: increased Foxp3 binding in both aTreg versus rTreg cells and in tuTreg versus aTreg cells. Two replicates were merged for analysis. (E) Regions with decreased Foxp3 binding. Unique 1: reduced Foxp3 binding in aTreg versus rTreg cells (P < 0.05, FC ≤ −2) but not in tuTreg versus aTreg cells; unique 2: reduced Foxp3 binding in tuTreg versus aTreg cells (P < 0.05, FC ≤ −2) but not in aTreg versus rTreg cells; overlap: reduced Foxp3 binding in both aTreg versus rTreg cells and in tuTreg versus aTreg cells. Differences between tuTreg and aTreg cells in unique 1 group are not statistically significant. (F and G) Peaks (F) and genes (G) linked to increased (Up) and decreased (Down) Foxp3 binding in aTreg versus rTreg cells and in tuTreg versus aTreg cells. Representative genes are shown. (H and I) Foxp3 peaks at the Klrg1 (H) and Runx2 (I) loci. Arrowheads indicate sites with increased Foxp3 binding in tuTreg cells. Data are representative of two replicates. (J) Comparison of genes linked to increased Foxp3 binding in aTreg versus rTreg, tuTreg versus aTreg, and rTreg cells after TCR stimulation in vitro. (K) DNA sequence motifs for transcription factors enriched at regions with increased Foxp3 binding in the overlap and unique groups defined in D. (L) DNA sequence motifs for transcription factors enriched at regions with decreased Foxp3 binding in aTreg versus rTreg cells and in tuTreg versus aTreg cells, respectively defined as unique 1 and unique 2 groups in E. (M) Percentages of canonical forkhead motif (FKHM) or TnG repeats enriched at Foxp3-binding sites defined in D compared with other regions (background).
To distinguish these possibilities, we cross-compared Foxp3–chromatin binding in tuTreg, rTreg, and aTreg cells (the latter two samples were from lymphoid organs of healthy mice). Despite a minor, global reduction of Foxp3 CUT&RUN-seq reads in tuTreg cells, probably due to harsh conditions during tuTreg isolation and sorting, we observed that unique Foxp3-binding peaks increased or decreased in tuTreg cells (Fig. 5, D and E). We then tested whether changed Foxp3 binding in tuTreg versus aTreg cells follows the same trends as those between aTreg and rTreg cells, a sign of quantitative differences in Foxp3 binding. Cross-comparisons revealed that more than half of the dynamic Foxp3-binding peaks in either aTreg versus rTreg cells but not in tuTreg versus aTreg cells (“Unique 1” in Fig. 5, D and E) or in tuTreg versus aTreg cells but not in aTreg versus rTreg cells (“Unique 2” in Fig. 5, D and E) do not overlap (Fig. 5 F). Likewise, most genes linked to dynamic Foxp3-binding are also unique in these two comparison groups (Fig. 5 G). Fewer than 20% of regions show the same trends of increased or decreased Foxp3 binding in aTreg-rTreg and tuTreg-aTreg cells (“Overlap” in Fig. 5, D and E). These qualitative and quantitative differences suggest that the TME and lymphoid organs regulate dynamic Foxp3–chromatin interaction largely via distinct pathways or mediators. This special feature of the TME may significantly enhance tuTreg cells’ suppressive function and tumor immune evasion by targeting Foxp3–chromatin association, such as by markedly increasing Foxp3 binding at Klrg1 and Runx2 in tuTreg but not in aTreg or rTreg cells (Fig. 5, H and I).
Because TCR signaling is required for Treg cell activation and suppressive function, we then asked to what extent dynamic Foxp3–chromatin binding in tuTreg and aTreg cells can be modeled in vitro by acute TCR stimulation. To this end, we compared the regions with increased Foxp3-binding in aTreg versus those in rTreg, those in tuTreg versus those in aTreg, and those in rTreg cells upon 3-h TCR/costimulation (Fig. 4 A). Surprisingly, most were specific to individual experimental settings (Fig. 5 J), suggesting that acute TCR signaling only contributes a minor part to increased Foxp3 binding in aTreg versus rTreg or in tuTreg versus aTreg cells.
DNA sequence motifs enriched at these dynamic Foxp3 peaks are highly consistent: increased Foxp3 binding is frequently linked to AP-1 family proteins and decreased Foxp3 binding is linked to ETS proteins (Fig. 4 J; and Fig. 5, K and L). Dynamic Foxp3–chromatin interaction appears to be independent of the forkhead consensus motif (FKHM) or TnG repeats—which bind to Foxp3 in vitro—(Dai et al., 2021; Zhang et al., 2023) present at similar frequencies in Foxp3 peaks and other genomic regions (Fig. 5 M). Because various pathways act on the AP-1 complex (Atsaves et al., 2019; Müller et al., 1997), our results suggest that AP-1 proteins serve as a major landing pad for Foxp3 to enhance Treg suppressive function. The target specificity of Foxp3 binding in different settings may be determined by the composition of AP-1 complex or other DNA-binding proteins associated with Foxp3.
Direct Foxp3–DNA binding stabilizes Foxp3–chromatin interaction
To determine the role of direct Foxp3–DNA interaction, we generated MBP-tagged recombinant WT and mutant Foxp3 proteins lacking the N-terminal proline-rich region (ΔN) as reported (Zhang et al., 2023) by replacing DNA-interacting N383, R386, H387, and/or S390 with alanine or by deleting the α-helix embedded into the major groove of DNA (Fig. 6 A). Whereas WT Foxp3ΔN complexed with FKHM and (T3G)6 DNA probes in gel electrophoretic mobility shift assays (EMSA), Foxp3ΔN DNA-binding mutants M2, M4, and ΔHelix markedly reduced DNA binding (Fig. 6, B and C). When the point mutations were introduced to full-length Foxp3 and transduced into neutrally activated CD4 Tn cells, they led to a moderate reduction of Foxp3 protein (Fig. 6, D and E). However, when protein levels were comparable, WT and mutant Foxp3 proteins caused similar upregulation of CD25 and CTLA-4 (Fig. 6, F–I).
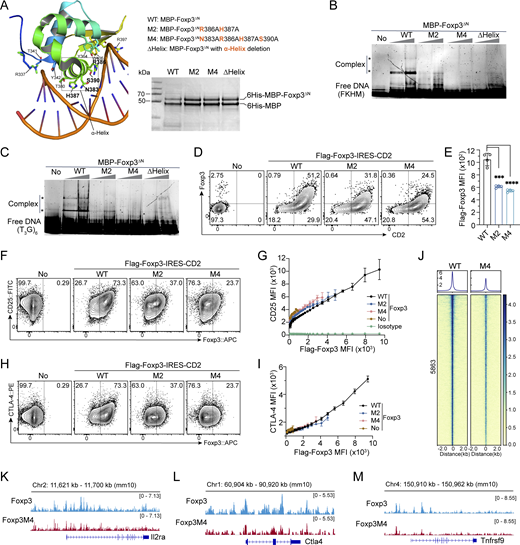
A role of direct Foxp3-DNA binding in Foxp3–chromatin interaction. (A) Magnified structure of Foxp3ΔN-DNA complex (PDB: 7TDX) highlighting the amino acid residues interacting with DNA. Mutations in Foxp3 M2, M4, and Δα-Helix are shown. Purified recombinant proteins were resolved by SDS-PAGE and visualized by Coomassie staining. (B and C) EMSA of recombinant Foxp3ΔN proteins (0.4 and 0.8 µM) after incubation with DNA probes (0.4 µM) of inverted-repeat FKHM (B) or (T3G)6 (C). Gel was visualized by SYBR Gold nucleic acid stain. *, DNA-BMP-Foxp3ΔN complexes. (D) Representative plots showing CD2 and Foxp3 expression in activated CD4 Tn (Th0) cells transduced with full-length WT and mutant Flag-Foxp3-IRES-CD2 retrovirus. (E) Foxp3 expression levels of Foxp3+ cells described in D. n = 4 technical replicates. Data represent more than two experiments. Unpaired, two-tailed t tests; ***P < 0.001, ****P < 0.0001. (F and G) Comparison of CD25 and Foxp3 expression in Th0 cells transduced with full-length WT and mutant Flag-Foxp3-IRES-CD2 retrovirus. Anti-Flag antibody was used to assess Foxp3 expression. No, no transduction. Isotype, FITC-isotype antibody. n = 4 technical replicates. (H and I) Relationship between CTLA-4 and Foxp3 expression in Th0 cells expressing full-length WT and mutant Flag-Foxp3-IRES-CD2. n = 4 technical replicates. (J) Comparison of Foxp3 binding by CUT&RUN-seq in Th0 cells expressing full-length WT or M4 mutant Flag-Foxp3. Two replicates were merged for analysis. (K–M) Foxp3 peaks at the Il2ra (K), Ctla4 (L), and Tnfrsf9 (M) loci in Th0 cells expressing full-length WT or M4 mutant Flag-Foxp3. Data represent one of two replicates. Source data are available for this figure: SourceData F6.
A role of direct Foxp3-DNA binding in Foxp3–chromatin interaction. (A) Magnified structure of Foxp3ΔN-DNA complex (PDB: 7TDX) highlighting the amino acid residues interacting with DNA. Mutations in Foxp3 M2, M4, and Δα-Helix are shown. Purified recombinant proteins were resolved by SDS-PAGE and visualized by Coomassie staining. (B and C) EMSA of recombinant Foxp3ΔN proteins (0.4 and 0.8 µM) after incubation with DNA probes (0.4 µM) of inverted-repeat FKHM (B) or (T3G)6 (C). Gel was visualized by SYBR Gold nucleic acid stain. *, DNA-BMP-Foxp3ΔN complexes. (D) Representative plots showing CD2 and Foxp3 expression in activated CD4 Tn (Th0) cells transduced with full-length WT and mutant Flag-Foxp3-IRES-CD2 retrovirus. (E) Foxp3 expression levels of Foxp3+ cells described in D. n = 4 technical replicates. Data represent more than two experiments. Unpaired, two-tailed t tests; ***P < 0.001, ****P < 0.0001. (F and G) Comparison of CD25 and Foxp3 expression in Th0 cells transduced with full-length WT and mutant Flag-Foxp3-IRES-CD2 retrovirus. Anti-Flag antibody was used to assess Foxp3 expression. No, no transduction. Isotype, FITC-isotype antibody. n = 4 technical replicates. (H and I) Relationship between CTLA-4 and Foxp3 expression in Th0 cells expressing full-length WT and mutant Flag-Foxp3-IRES-CD2. n = 4 technical replicates. (J) Comparison of Foxp3 binding by CUT&RUN-seq in Th0 cells expressing full-length WT or M4 mutant Flag-Foxp3. Two replicates were merged for analysis. (K–M) Foxp3 peaks at the Il2ra (K), Ctla4 (L), and Tnfrsf9 (M) loci in Th0 cells expressing full-length WT or M4 mutant Flag-Foxp3. Data represent one of two replicates. Source data are available for this figure: SourceData F6.
Given equivalent CD2 protein levels mediated by the same polycistronic mRNAs linked to Foxp3 by an internal ribosome entry site (IRES) (Fig. 6 D), Foxp3–DNA interaction could be required for stable Foxp3–chromatin binding. To test this notion, we performed Flag-Foxp3 CUT&RUN-seq with transduced CD4 T cells, revealing reduced chromatin binding of mutant Foxp3 M4 (Fig. 6, J–M). Altogether, these results suggest that direct Foxp3–DNA binding stabilizes Foxp3–chromatin complex whose target specificity appears to be determined by other DNA-binding proteins.
Proximity proteomics uncovers proteins adjacent to Foxp3
We then explored the composition of the Foxp3 complex in the native state without relying on classical protein purification of the Foxp3 complex that disrupts transient and weak interactions. To this end, we projected the spatial information (PSI) of Foxp3 onto its adjacent proteins via peroxidase-mediated proximity protein biotinylation (Bar et al., 2018; Chen et al., 2018; Lam et al., 2015; Wang et al., 1999), which facilitates stringent purification of labeled proteins (Fig. 7 A). Briefly, we first fixed Treg cells to crosslink interacting proteins and then stained endogenous Foxp3 with primary antibodies followed by horseradish peroxidase (HRP)–conjugated secondary antibodies.

Proximity biotinylation captures the proteins near Foxp3. (A) Schematic of the PSI of Foxp3 by proximity ligation via biotin-phenoxyl radicals. 1° Ab, primary antibody; 2° Ab, secondary antibodies; BP, biotin-phenol; HRP, horseradish peroxidase; SA, streptavidin. (B) Assessment of the specificity of Foxp3 PSI with Th0 and iTreg cells. CD4 Tn cells from Foxp3gfp mice were used to generate Th0 or iTreg cells. After PSI reaction, cells were stained with SA-AlexaFluor-568. Numbers show median fluorescence intensities (MFIs) of GFP or SA in Th0 and iTreg cells. Th0 cells, CD4 Tn cells activated by TCR agonists and IL-2 in vitro. (C) Immunofluorescence images of Treg cells from Foxp3gfp mice treated with Foxp3-PSI and subsequently stained for SA-AlexaFluor-568, GFP-booster-FITC, and Lamin-AlexaFluor-647. (D) 37,333 accessible regions (ATAC-seq) in Treg cells are cross-compared with Foxp3 PSI-ChIP, traditional (tra) Foxp3-, H3K27ac-, H3K4me3-, and H3K27me3-ChIP peaks. Traditional Foxp3, H3K27ac, H3K4me3, and H2K27me3 ChIP-seq data are from Kitagawa et al. (2017). (E) Comparison of accessible chromatin regions (ATAC-seq peaks) in iTreg and nTreg cells. (F) Comparison of the peak sizes of Foxp3 PSI-ChIP, traditional Foxp3-ChIP, H3K27ac-ChIP, and ATAC-seq. Numbers show mean fragment lengths. Data were derived from two replicates. (G) PCA of Foxp3 PSI and histone H3 PSI TMT MS results. PC1 and PC2, respectively, account for 48.9% and 27.7% of the total variations. AU, arbitrary units. (H) Fractions of proteins identified by Foxp3 or H3 PSI MS among the genes expressed in ASC-treated iTreg cells, estimated by RNA-seq (RPKM ≥ 1.0). (I) Enriched proteins identified by Foxp3-PSI in iTreg versus Th0 cells and Foxp3-PSI versus H3-PSI in iTreg cells. Blue, Foxp3 known interactors. q, FDR-adjusted P value. Histone H3 PSI was used to assess the diffusion of BP radicals. Data were derived from two replicates. (J) Comparison of proteins revealed by Foxp3-PSI versus H3-PSI MS and published Foxp3 interactors (Rudra et al., 2012).
Proximity biotinylation captures the proteins near Foxp3. (A) Schematic of the PSI of Foxp3 by proximity ligation via biotin-phenoxyl radicals. 1° Ab, primary antibody; 2° Ab, secondary antibodies; BP, biotin-phenol; HRP, horseradish peroxidase; SA, streptavidin. (B) Assessment of the specificity of Foxp3 PSI with Th0 and iTreg cells. CD4 Tn cells from Foxp3gfp mice were used to generate Th0 or iTreg cells. After PSI reaction, cells were stained with SA-AlexaFluor-568. Numbers show median fluorescence intensities (MFIs) of GFP or SA in Th0 and iTreg cells. Th0 cells, CD4 Tn cells activated by TCR agonists and IL-2 in vitro. (C) Immunofluorescence images of Treg cells from Foxp3gfp mice treated with Foxp3-PSI and subsequently stained for SA-AlexaFluor-568, GFP-booster-FITC, and Lamin-AlexaFluor-647. (D) 37,333 accessible regions (ATAC-seq) in Treg cells are cross-compared with Foxp3 PSI-ChIP, traditional (tra) Foxp3-, H3K27ac-, H3K4me3-, and H3K27me3-ChIP peaks. Traditional Foxp3, H3K27ac, H3K4me3, and H2K27me3 ChIP-seq data are from Kitagawa et al. (2017). (E) Comparison of accessible chromatin regions (ATAC-seq peaks) in iTreg and nTreg cells. (F) Comparison of the peak sizes of Foxp3 PSI-ChIP, traditional Foxp3-ChIP, H3K27ac-ChIP, and ATAC-seq. Numbers show mean fragment lengths. Data were derived from two replicates. (G) PCA of Foxp3 PSI and histone H3 PSI TMT MS results. PC1 and PC2, respectively, account for 48.9% and 27.7% of the total variations. AU, arbitrary units. (H) Fractions of proteins identified by Foxp3 or H3 PSI MS among the genes expressed in ASC-treated iTreg cells, estimated by RNA-seq (RPKM ≥ 1.0). (I) Enriched proteins identified by Foxp3-PSI in iTreg versus Th0 cells and Foxp3-PSI versus H3-PSI in iTreg cells. Blue, Foxp3 known interactors. q, FDR-adjusted P value. Histone H3 PSI was used to assess the diffusion of BP radicals. Data were derived from two replicates. (J) Comparison of proteins revealed by Foxp3-PSI versus H3-PSI MS and published Foxp3 interactors (Rudra et al., 2012).
To readily obtain large numbers of Foxp3-expressing cells, we induced Treg cells (iTreg cells) from CD4 Tn cells isolated from Foxp3gfp mice (Fontenot et al., 2005). The iTreg cells developed in the presence of ascorbic acid (ASC) stably express Foxp3, akin to Treg cells isolated ex vivo (Li et al., 2021; Yue et al., 2016). We performed Foxp3 PSI reaction with iTreg cells or neutrally activated CD4 Tn (Th0) cells and compared the signal intensities of GFP and biotinylated proteins with flow cytometry (Fig. 7 B), revealing a high correlation (R2 = 0.77). At the subcellular level, biotinylated proteins colocalized with GFP-Foxp3 (Fig. 7 C).
To further test the fidelity, we enriched biotinylated chromatin using the ChIP-seq method. The genome-wide distribution of Foxp3 PSI ChIP-seq peaks was comparable with that of Foxp3 traditional ChIP-seq peaks performed with ex vivo isolated nTreg cells and was associated with open chromatin, H3K4me3, or H3K27ac but not with H3K27me3 (Fig. 7 D). Besides, similar chromatin accessibility indicates close relevance of iTreg and nTreg cells (Fig. 7 E). Foxp3 PSI ChIP peaks appear to be two to three nucleosomes (200 bp each) wider than traditional ChIP-seq peaks (Fig. 7 F), probably because of diffused BP radicals and/or DNA looping. Using histone H3, a constituent of nucleosomes, as a reference to estimate the range of BP diffusion, we performed Foxp3 and H3 PSI in iTreg and Th0 cells and purified biotinylated proteins after reverse crosslinking. Tandem mass tag (TMT)–based mass spectrometry (MS) unambiguously identified 4,845 proteins, and Foxp3 PSI and H3 PSI samples were readily distinguishable by principal component analysis (Fig. 7 G).
Independently of protein levels, 1,493 proteins were highly enriched by Foxp3 PSI relative to H3 PSI, accounting for ∼27.9% of the total 5,348 nuclear proteins, consistent with the proteins enriched by Foxp3 PSI in iTreg versus Th0 cells (Fig. 7, H and I; and Fig. S3 A). The 157 (43.5%) of 361 proteins known to interact with Foxp3 (e.g., Ash2l, Chd4, and Foxp1) (Kwon et al., 2017; Rudra et al., 2012) are ranked at the top (Fig. 7, I and J). These proteins play diverse roles, including chromatin modification and remodeling, DNA topology and methylation, transcriptional regulation, and RNA splicing and exportation (Fig. S3 B and Table S2).

Functional annotation of proteins determined by Foxp3 PSI MS. (A) Proteins differentially enriched by Foxp3 versus histone H3 PSI MS are independent of their expression levels profiled by whole-cell TMT MS. Data were derived from two to three replicates per condition. (B) Gene Ontology terms of the proteins enriched by Foxp3 and histone H3 PSI MS. (C and D) Identification of the regulators of Foxp3, CTLA-4, and CD25 expression from the proteins identified by Foxp3 PSI MS using CRISPR screening. CD4 Tn cells isolated from Foxp3gfpRosaCas9 mice were induced to iTreg cells by TCR agonists, IL-2, and TGF-β in the presence of ASC. A retroviral sgRNA library targeting 1,493 genes enriched by Foxp3 PSI MS was transduced into iTreg cells on day 3. 5 days later, cells expressing high or low levels of Foxp3, CTLA-4, or CD25 were FACS-sorted to compare sgRNA representation with high-throughput sequencing. (E–G) Cross-comparison of the regulators of Foxp3 versus CD25 expression (E) or CD25 versus CTLA-4 expression (F). Overlaps of regulators are shown (G; FDR < 0.05). Data are derived from three replicates. (H and I) Validation of top candidate regulators of Foxp3 (H) and CD25 (I) expression in Cas9-expressing iTreg cells transduced with individual sgRNAs. CD4 Tn cells isolated from Foxp3gfpRosaCas9 mice were cultured in Treg-induction media. Cells were transduced with retroviral sgRNAs at day 1 and analyzed at day 5. Data show triplicates and means ± SDs and represent two experiments. Two-tailed, unpaired t tests; ns, no significance; **P < 0. 01, ***P < 0.001, ****P < 0.0001.
Functional annotation of proteins determined by Foxp3 PSI MS. (A) Proteins differentially enriched by Foxp3 versus histone H3 PSI MS are independent of their expression levels profiled by whole-cell TMT MS. Data were derived from two to three replicates per condition. (B) Gene Ontology terms of the proteins enriched by Foxp3 and histone H3 PSI MS. (C and D) Identification of the regulators of Foxp3, CTLA-4, and CD25 expression from the proteins identified by Foxp3 PSI MS using CRISPR screening. CD4 Tn cells isolated from Foxp3gfpRosaCas9 mice were induced to iTreg cells by TCR agonists, IL-2, and TGF-β in the presence of ASC. A retroviral sgRNA library targeting 1,493 genes enriched by Foxp3 PSI MS was transduced into iTreg cells on day 3. 5 days later, cells expressing high or low levels of Foxp3, CTLA-4, or CD25 were FACS-sorted to compare sgRNA representation with high-throughput sequencing. (E–G) Cross-comparison of the regulators of Foxp3 versus CD25 expression (E) or CD25 versus CTLA-4 expression (F). Overlaps of regulators are shown (G; FDR < 0.05). Data are derived from three replicates. (H and I) Validation of top candidate regulators of Foxp3 (H) and CD25 (I) expression in Cas9-expressing iTreg cells transduced with individual sgRNAs. CD4 Tn cells isolated from Foxp3gfpRosaCas9 mice were cultured in Treg-induction media. Cells were transduced with retroviral sgRNAs at day 1 and analyzed at day 5. Data show triplicates and means ± SDs and represent two experiments. Two-tailed, unpaired t tests; ns, no significance; **P < 0. 01, ***P < 0.001, ****P < 0.0001.
Proteins identified by Foxp3 PSI MS were accumulated from all Foxp3 complexes, but individual Foxp3 targets may be regulated by only certain factors. To test this notion, we used a custom sgRNA library to perform CRISPR screening (Table S3) and examined the expression of three target genes, i.e., Foxp3, Ctla4, and Il2ra (Fig. S3, C and D). We identified common and unique regulators of individual targets (Fig. S3, E–G; and Table S4). We then verified the roles of Cbfb, Tada1, Foxo1, Med12, and Ikzf1 in Foxp3 and CD25 expression in iTreg cells by performing individual CRISPR deletion (Fig. S3, H and I). Thus, proximity proteomics can reveal proteins adjacent to Foxp3 in the native state in situ.
IL-2 and TCR signaling induce dynamic proteins close to Foxp3
Proximity proteomics offers a simple method to uncover the potential dynamic protein components of Foxp3 complexes in different settings (Fig. 8 A). To test this notion, we purified biotinylated proteins for TMT MS from iTreg cells treated with or without recombinant IL-2 or TCR agonists followed by Foxp3 PSI reaction (Fig. 8 B).
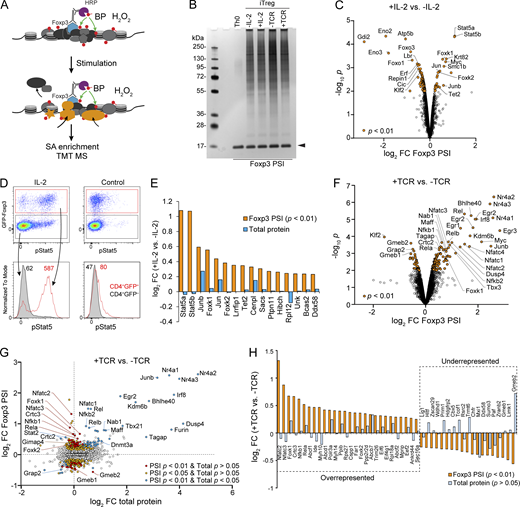
Dynamic proteins near Foxp3 upon IL-2 and TCR signaling. (A) Schematic of dynamic proteins near Foxp3 uncovered by Foxp3 PSI coupled with TMT-based MS. (B) Proteins enriched by SA beads in iTreg cells after IL-2 or TCR stimulation and Foxp3 PSI were resolved by SDS-PAGE followed by silver staining. Arrowhead indicates released SA. (C) Differentially represented proteins revealed by Foxp3 PSI MS after 30 min of IL-2 stimulation. Data were derived from three biological replicates. (D) Phospho-Stat5 (pStat5) staining after 30 min of IL-2 stimulation of CD4 T cells isolated from Foxp3gfp mice. Data represent more than three experiments. Numbers show MFI of pStat5 signal. (E) Proteins enriched in Foxp3 PSI after IL-2 stimulation (Foxp3 PSI P < 0.01). Changes in total protein level are included as a comparison. (F) Differentially represented proteins revealed by Foxp3 PSI MS after 3 h of TCR stimulation. Data were derived from three biological replicates. (G) Changes in protein levels in Foxp3 PSI and whole-cell lysate upon TCR stimulation. (H) A summary of dynamic proteins revealed by Foxp3 PSI MS upon TCR stimulation without significant changes of their total levels (P > 0.05). Source data are available for this figure: SourceData F8.
Dynamic proteins near Foxp3 upon IL-2 and TCR signaling. (A) Schematic of dynamic proteins near Foxp3 uncovered by Foxp3 PSI coupled with TMT-based MS. (B) Proteins enriched by SA beads in iTreg cells after IL-2 or TCR stimulation and Foxp3 PSI were resolved by SDS-PAGE followed by silver staining. Arrowhead indicates released SA. (C) Differentially represented proteins revealed by Foxp3 PSI MS after 30 min of IL-2 stimulation. Data were derived from three biological replicates. (D) Phospho-Stat5 (pStat5) staining after 30 min of IL-2 stimulation of CD4 T cells isolated from Foxp3gfp mice. Data represent more than three experiments. Numbers show MFI of pStat5 signal. (E) Proteins enriched in Foxp3 PSI after IL-2 stimulation (Foxp3 PSI P < 0.01). Changes in total protein level are included as a comparison. (F) Differentially represented proteins revealed by Foxp3 PSI MS after 3 h of TCR stimulation. Data were derived from three biological replicates. (G) Changes in protein levels in Foxp3 PSI and whole-cell lysate upon TCR stimulation. (H) A summary of dynamic proteins revealed by Foxp3 PSI MS upon TCR stimulation without significant changes of their total levels (P > 0.05). Source data are available for this figure: SourceData F8.
0.5-h IL-2 stimulation led to 88 proteins (P < 0.01) being over- and underrepresented, among which Stat5a and Stat5b were the most over-represented (Fig. 8 C), consistent with their function as the major signal transducers of IL-2 signaling (Fig. 8 D) (Lin and Leonard, 2000; Malek and Castro, 2010). We then compared dynamic proximity proteins with total proteins and mRNAs to distinguish protein subcellular relocation from total protein level changes due to transcriptional and/or posttranscriptional regulation (Fig. S4, A–C; and Table S5). Several proteins (e.g., Stat5a, Stat5b, Gdi2, Eno2, and Eno3) were over- or under-represented upon IL-2 signaling without noticeable changes in total protein quantities, indicating protein subcellular relocation. This experiment uncovered various nuclear proteins enriched or depleted near Foxp3, including transcription factors, structural proteins, RNA-binding proteins, and epigenetic modifiers (Fig. 8 E and Fig. S4 D).
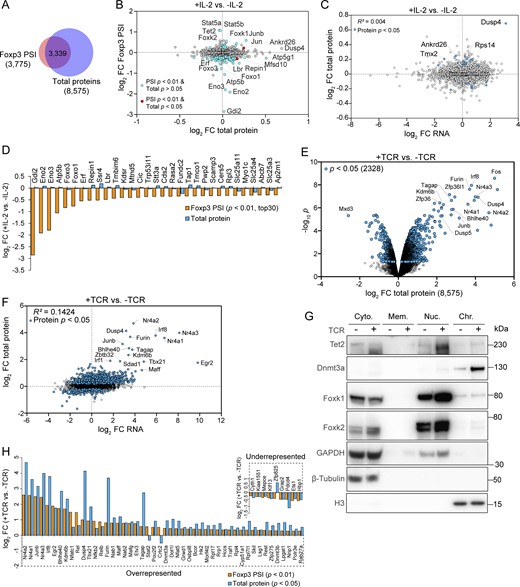
IL-2 and TCR signaling induce dynamic proteins near Foxp3. (A) Overlap of the proteins identified by Foxp3 PSI MS and whole-cell lysate MS. (B) Cross-comparison of differentially represented proteins after IL-2 stimulation identified by Foxp3 PSI MS versus whole-cell lysate MS. Data were derived from two or three replicates per condition. (C) Protein and mRNA levels measured by TMT MS or RNA-seq after IL-2 stimulation. iTreg cells induced from WT CD4 Tn cells in the presence of supplemented ASC were stimulated by IL-2 for 0.5 h before being harvested for RNA-seq (n = 2 biological replicates) or whole-cell lysate TMT MS (n = 3 biological replicates). (D) Top 30 factors depleted after IL-2 signaling in Foxp3 PSI MS (Foxp3 PSI FC < 1, P < 0.01, ranked by Foxp3 PSI FC). (E and F) Protein levels measured by TMT proteomics (E) or RNA-seq (F) in iTreg cells with or without TCR stimulation. iTreg cells induced from WT CD4 Tn cells in the presence of supplemented ASC were stimulated by TCR agonists for 3 h before being harvested for whole-cell lysate TMT MS (n = 3 biological replicates) or RNA-seq (n = 2 biological replicates). (G) Western blotting of indicated proteins in the following cellular fractions: cytoplasm (Cyto.), membrane (Mem.), nuclear (Nuc.), and chromatin (Chr.). iTreg cells induced from WT CD4 Tn cells in the presence of supplemented ASC were stimulated by TCR agonists for 3 h before being harvested for western blotting. Data represent two experiments. (H) Proteins enriched and depleted in Foxp3 PSI (p for PSI < 0.01) with significant changes of their total quantities after TCR stimulation (p for total proteins < 0.05). Source data are available for this figure: SourceData FS4.
IL-2 and TCR signaling induce dynamic proteins near Foxp3. (A) Overlap of the proteins identified by Foxp3 PSI MS and whole-cell lysate MS. (B) Cross-comparison of differentially represented proteins after IL-2 stimulation identified by Foxp3 PSI MS versus whole-cell lysate MS. Data were derived from two or three replicates per condition. (C) Protein and mRNA levels measured by TMT MS or RNA-seq after IL-2 stimulation. iTreg cells induced from WT CD4 Tn cells in the presence of supplemented ASC were stimulated by IL-2 for 0.5 h before being harvested for RNA-seq (n = 2 biological replicates) or whole-cell lysate TMT MS (n = 3 biological replicates). (D) Top 30 factors depleted after IL-2 signaling in Foxp3 PSI MS (Foxp3 PSI FC < 1, P < 0.01, ranked by Foxp3 PSI FC). (E and F) Protein levels measured by TMT proteomics (E) or RNA-seq (F) in iTreg cells with or without TCR stimulation. iTreg cells induced from WT CD4 Tn cells in the presence of supplemented ASC were stimulated by TCR agonists for 3 h before being harvested for whole-cell lysate TMT MS (n = 3 biological replicates) or RNA-seq (n = 2 biological replicates). (G) Western blotting of indicated proteins in the following cellular fractions: cytoplasm (Cyto.), membrane (Mem.), nuclear (Nuc.), and chromatin (Chr.). iTreg cells induced from WT CD4 Tn cells in the presence of supplemented ASC were stimulated by TCR agonists for 3 h before being harvested for western blotting. Data represent two experiments. (H) Proteins enriched and depleted in Foxp3 PSI (p for PSI < 0.01) with significant changes of their total quantities after TCR stimulation (p for total proteins < 0.05). Source data are available for this figure: SourceData FS4.
Likewise, 3-h TCR/costimulation enriched 89 and depleted 37 proteins (P < 0.01; Fig. 8 F). We then assessed the potential contributions of total protein changes and their related transcripts (Fig. S4, E and F) to distinguish protein subcellular relocation from increased and decreased global protein levels (Fig. 8 G): 47 proteins were differentially represented without significant changes in total quantities (PSI P < 0.01, total protein P > 0.05; Fig. 8 G [red dots], Fig. S4 G, and Table S6; e.g., Nfatc2, Nfatc3, Nfkb1, Foxk2, and Rela), consistent with their known roles in TCR signal transduction (Gascoigne et al., 2016). Conversely, 57 differentially represented proteins were accompanied by significant changes in total levels (PSI P < 0.01, total protein P < 0.05; Fig. 8 G [blue dots] and Table S7; e.g., Nr4a2, Nr4a1, Junb, Nr4a3, and Irf8). Overall, TCR/co-stimulation induced dynamic changes in proteins adjacent to Foxp3, involved in signal transduction, transcriptional regulation, RNA binding, and epigenetic modifications (Fig. 8 H and Fig. S4 H).
Thus, proteins with various molecular activities are recruited to or displaced near Foxp3 upon IL-2 or TCR signaling, consistent with reports that Foxp3 complexes with p65 and NFAT after TCR signaling (Bettelli et al., 2005; Cui et al., 2022; Kwon et al., 2017).
NFAT and AP-1 regulate Foxp3–chromatin binding and tunable Treg cell function
We first tested if inhibition of NFAT signaling influences Foxp3–chromatin interaction. To this end, we treated Foxp3gfp mice with oil (vector) or cyclosporin (CsA) every 12 h twice and examined Foxp3–chromatin binding in Treg cells sorted from lymphoid organs 24 h later. CsA inhibits calcineurin-dependent NFAT nuclear translocation (Hogan et al., 2003). CsA treatment resulted in a profound reduction of Foxp3 binding (Fig. 9, A–C). The differential Foxp3 peaks (P < 0.05) were enriched with JUNB, REL, NFAT, ERG, and BATF motifs (Fig. S5 A), suggesting that multiple TCR downstream effectors were downregulated probably because of the indirect effects of CsA.
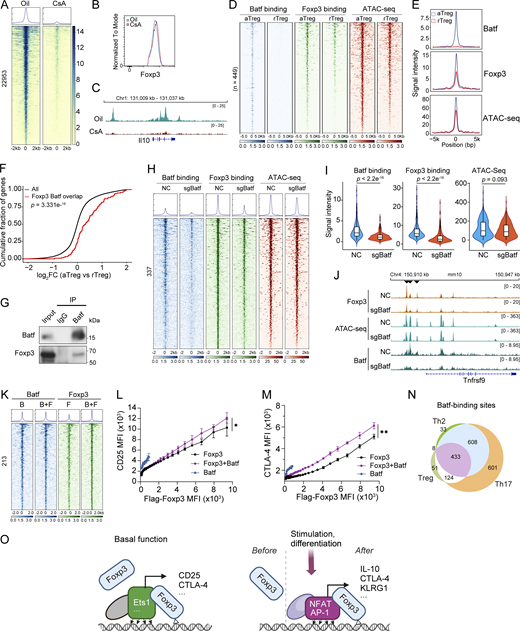
NFAT and AP-1 regulate Foxp3–chromatin binding and tunable Treg function. (A–C) Foxp3 binding in Treg cells from oil and CsA treated mice (A). Foxp3gfp mice received oil or CsA (30 mg/kg body weight) i.p. every 12 h twice. Treg cells were then sorted from spleens and lymph nodes for Foxp3 CUT&RUN-seq. Data were merged from three replicates. Foxp3 expression level was assessed in Treg cells (B). Representative Foxp3 peaks at the Il10 locus in one of three replicates are shown (C). (D and E) Comparison of Batf and Foxp3 binding and chromatin accessibility in rTreg and aTreg cells. Data were merged from two replicates. (F) Genes linked to Foxp3 and Batf binding are upregulated in aTreg cells compared with rTreg cells. Two-sample Kolmogorov–Smirnov (K–S) test. (G) Coimmunoprecipitation of Batf and Foxp3 in nTreg cells expanded in vitro for 7 days. Cells were re-stimulated by TCR agonists for 15 h before experiment. (H and I) Batf and Foxp3 binding and chromatin accessibility in Treg cells after CRISPR deletion of Batf. Unpaired two-sample Wilcoxon test. Data were derived from two replicates. (J) Foxp3 binding, chromatin-accessibility, and Batf binding at the Tnfrsf9 locus in Treg cells that received retroviral sgBatf or sgNC. Data are representative of two replicates. (K) Batf and Foxp3 peaks in Th0 cells expressing Batf (“B”), Flag-Foxp3 (“F”), or both (“B+F”). Differential Foxp3 peaks (P < 0.05, FC > 2) are shown. Data were derived from two replicates. (L and M) Relationships between CD25 (L) or CTLA-4 (M) and Flag-Foxp3 levels in Th0 cells expressing full-length Flag-Foxp3, Batf, or both (Foxp3+Batf). Anti-Flag antibody was used to assess Flag-Foxp3 expression. n = 4 replicates. Data represent two experiments. Two-way ANOVA. (N) Comparison of Batf peaks in aTreg cells (this study) and Th2 and Th17 cells (Ciofani et al., 2012; Iwata et al., 2017). (O) A hypothetical model of dynamic Foxp3–chromatin interaction. In the resting state, Foxp3 associates with chromatin via preexistent DNA-binding proteins (e.g., Ets1) to confer Treg basal function by regulating genes such as Il2ra (CD25) and Ctla4. Upon stimulation or differentiation, induced DNA-binding proteins (e.g., NFAT and AP-1) recruit Foxp3 or facilitate Foxp3–chromatin binding to regulate genes (e.g., Il10, Ctla4, and Klrg1) that enhance Treg suppression of autoimmunity and antitumor response. Direct Foxp3-DNA binding stabilizes Foxp3–chromatin interaction, although it alone is insufficient to confer stable interaction with chromatin in physiological settings. When these induced proteins degrade, Foxp3–chromatin binding and Treg function are reset to the basal level. Foxp3 complex may also be actively displaced by undetermined mechanisms. For simplicity, other Foxp3-interacting proteins are not shown. Source data are available for this figure: SourceData F9.
NFAT and AP-1 regulate Foxp3–chromatin binding and tunable Treg function. (A–C) Foxp3 binding in Treg cells from oil and CsA treated mice (A). Foxp3gfp mice received oil or CsA (30 mg/kg body weight) i.p. every 12 h twice. Treg cells were then sorted from spleens and lymph nodes for Foxp3 CUT&RUN-seq. Data were merged from three replicates. Foxp3 expression level was assessed in Treg cells (B). Representative Foxp3 peaks at the Il10 locus in one of three replicates are shown (C). (D and E) Comparison of Batf and Foxp3 binding and chromatin accessibility in rTreg and aTreg cells. Data were merged from two replicates. (F) Genes linked to Foxp3 and Batf binding are upregulated in aTreg cells compared with rTreg cells. Two-sample Kolmogorov–Smirnov (K–S) test. (G) Coimmunoprecipitation of Batf and Foxp3 in nTreg cells expanded in vitro for 7 days. Cells were re-stimulated by TCR agonists for 15 h before experiment. (H and I) Batf and Foxp3 binding and chromatin accessibility in Treg cells after CRISPR deletion of Batf. Unpaired two-sample Wilcoxon test. Data were derived from two replicates. (J) Foxp3 binding, chromatin-accessibility, and Batf binding at the Tnfrsf9 locus in Treg cells that received retroviral sgBatf or sgNC. Data are representative of two replicates. (K) Batf and Foxp3 peaks in Th0 cells expressing Batf (“B”), Flag-Foxp3 (“F”), or both (“B+F”). Differential Foxp3 peaks (P < 0.05, FC > 2) are shown. Data were derived from two replicates. (L and M) Relationships between CD25 (L) or CTLA-4 (M) and Flag-Foxp3 levels in Th0 cells expressing full-length Flag-Foxp3, Batf, or both (Foxp3+Batf). Anti-Flag antibody was used to assess Flag-Foxp3 expression. n = 4 replicates. Data represent two experiments. Two-way ANOVA. (N) Comparison of Batf peaks in aTreg cells (this study) and Th2 and Th17 cells (Ciofani et al., 2012; Iwata et al., 2017). (O) A hypothetical model of dynamic Foxp3–chromatin interaction. In the resting state, Foxp3 associates with chromatin via preexistent DNA-binding proteins (e.g., Ets1) to confer Treg basal function by regulating genes such as Il2ra (CD25) and Ctla4. Upon stimulation or differentiation, induced DNA-binding proteins (e.g., NFAT and AP-1) recruit Foxp3 or facilitate Foxp3–chromatin binding to regulate genes (e.g., Il10, Ctla4, and Klrg1) that enhance Treg suppression of autoimmunity and antitumor response. Direct Foxp3-DNA binding stabilizes Foxp3–chromatin interaction, although it alone is insufficient to confer stable interaction with chromatin in physiological settings. When these induced proteins degrade, Foxp3–chromatin binding and Treg function are reset to the basal level. Foxp3 complex may also be actively displaced by undetermined mechanisms. For simplicity, other Foxp3-interacting proteins are not shown. Source data are available for this figure: SourceData F9.
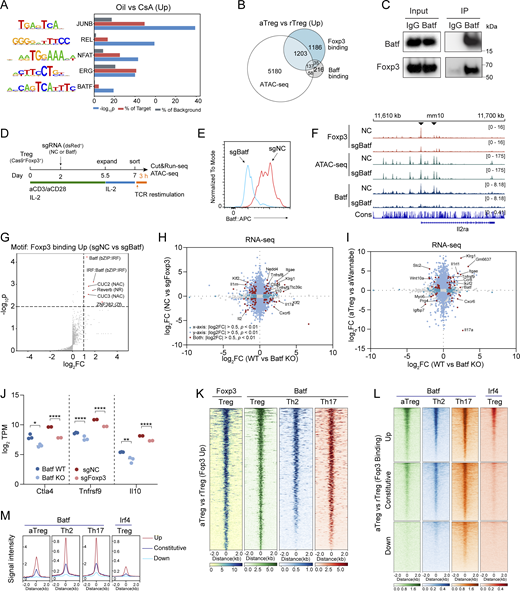
NFAT and AP-1 regulate Foxp3–chromatin binding. (A) DNA sequence motifs for transcription factors enriched at regions with significantly decreased Foxp3 binding (P < 0.05, FC > 2) in Treg cells from CsA-treated mice. (B) Peaks of Foxp3, Batf, and ATAC-seq that are significantly increased (Up; P < 0.05, log2FC ≥ 1) in aTreg versus rTreg cells. Unpaired, two-sample Wilcoxon test. (C) Co-immunoprecipitation of Batf and Foxp3 in HEK 293T cells ectopically expressing Batf and Foxp3. (D) Schematic procedures for Batf CRISPR deletion in nTreg cells. nTreg cells were sorted from RosaCas9Foxp3gfp mice and transduced with sgNC or sgBatf after in vitro activation; 7 days later, cells were restimulated by TCR agonists for 3 h before being harvested for CUT&RUN-seq and ATAC-seq. (E) Assessment of Batf CRISPR depletion in Treg cells by flow cytometry. (F) Foxp3 and Batf peaks and chromatin accessibility (ATAC-seq) at the Il2ra locus in control (NC) or Batf-depleted (sgBatf) Treg cells. Arrowhead indicates reduced binding of Foxp3. Data represent two replicates. (G) DNA sequence motifs for transcription factors enriched at the regions with reduced Foxp3 binding in Batf CRISPR knockout (sgBatf) nTreg cells. (H and I) Differential gene expression resulting from Batf KO (WT versus Batf KO) (Xu et al., 2021) and Foxp3 CRISPR deletion (this study) (H) or Foxp3 depletion (aTreg versus aWannabe) (van der Veeken et al., 2020) (I). Representative genes involved in Treg cell function are labeled. (J) Comparison of the effects of Batf KO and Foxp3 CRISPR deletion on the expression (RNA-seq) of Ctla4, Tnfrsf9, and Il10. Data were derived from two replicates per condition. Two-tailed, unpaired t tests; *P < 0.05, **P < 0.01, ****P < 0.0001. (K) Batf binding in Treg, Th2, and Th17 cells at the regions with increased Foxp3 binding in aTreg and rTreg cells (defined in Fig. 1 B). Batf ChIP-seq data in Th2 cells are from Iwata et al. (2017) and those in Th17 cells from Ciofani et al. (2012). (L and M) Batf and Irf4 binding in the regions of aTreg and rTreg cells with different Foxp3-binding modes. Irf4 ChIP-seq data are from Vasanthakumar et al. (2017). Source data are available for this figure: SourceData FS5.
NFAT and AP-1 regulate Foxp3–chromatin binding. (A) DNA sequence motifs for transcription factors enriched at regions with significantly decreased Foxp3 binding (P < 0.05, FC > 2) in Treg cells from CsA-treated mice. (B) Peaks of Foxp3, Batf, and ATAC-seq that are significantly increased (Up; P < 0.05, log2FC ≥ 1) in aTreg versus rTreg cells. Unpaired, two-sample Wilcoxon test. (C) Co-immunoprecipitation of Batf and Foxp3 in HEK 293T cells ectopically expressing Batf and Foxp3. (D) Schematic procedures for Batf CRISPR deletion in nTreg cells. nTreg cells were sorted from RosaCas9Foxp3gfp mice and transduced with sgNC or sgBatf after in vitro activation; 7 days later, cells were restimulated by TCR agonists for 3 h before being harvested for CUT&RUN-seq and ATAC-seq. (E) Assessment of Batf CRISPR depletion in Treg cells by flow cytometry. (F) Foxp3 and Batf peaks and chromatin accessibility (ATAC-seq) at the Il2ra locus in control (NC) or Batf-depleted (sgBatf) Treg cells. Arrowhead indicates reduced binding of Foxp3. Data represent two replicates. (G) DNA sequence motifs for transcription factors enriched at the regions with reduced Foxp3 binding in Batf CRISPR knockout (sgBatf) nTreg cells. (H and I) Differential gene expression resulting from Batf KO (WT versus Batf KO) (Xu et al., 2021) and Foxp3 CRISPR deletion (this study) (H) or Foxp3 depletion (aTreg versus aWannabe) (van der Veeken et al., 2020) (I). Representative genes involved in Treg cell function are labeled. (J) Comparison of the effects of Batf KO and Foxp3 CRISPR deletion on the expression (RNA-seq) of Ctla4, Tnfrsf9, and Il10. Data were derived from two replicates per condition. Two-tailed, unpaired t tests; *P < 0.05, **P < 0.01, ****P < 0.0001. (K) Batf binding in Treg, Th2, and Th17 cells at the regions with increased Foxp3 binding in aTreg and rTreg cells (defined in Fig. 1 B). Batf ChIP-seq data in Th2 cells are from Iwata et al. (2017) and those in Th17 cells from Ciofani et al. (2012). (L and M) Batf and Irf4 binding in the regions of aTreg and rTreg cells with different Foxp3-binding modes. Irf4 ChIP-seq data are from Vasanthakumar et al. (2017). Source data are available for this figure: SourceData FS5.
Next, we tested if AP-1 proteins are required for remodeling Foxp3–chromatin interaction because AP-1 motifs (e.g., Batf) are highly enriched in regions with increased Foxp3 binding (Fig. S2 D, Fig. 4 J, and Fig. 5 K) and AP-1 proteins are over-represented near Foxp3 after IL-2 and TCR stimulations (see Jun and Junb in Fig. 8, C and F). Basic leucine zipper ATF-like transcription factor Batf plays important roles in the differentiation and function of Treg cells, especially in non-lymphoid organs and tumors (Delacher et al., 2020, 2021; Itahashi et al., 2022; Xu et al., 2021). Although Batf is also required for Te cells (Kurachi et al., 2014; Sahoo et al., 2015; Schraml et al., 2009), higher expression of Batf in Treg cells suggests a special significance for Treg cell function.
We examined Batf occupancy and chromatin accessibility in aTreg and rTreg cells. We observed 449 Batf-binding sites in aTreg cells but not in rTreg cells (log2FC > 1, P < 0.05; Fig. 9, D and E), in agreement with higher Batf expression in aTreg cells (not shown). Batf binding was closely related to Foxp3 binding and increased chromatin accessibility in aTreg cells, among which 172 genes co-occupied by Foxp3 and Batf were expressed at significantly higher levels, e.g., Ctla4, Il10, and Tnfrsf9 that are known to contribute to elevated Treg suppressive function (Fig. 9 F and Fig. S5 B).
Given that Batf and Foxp3 coprecipitated in nTreg cells and HEK 293T cells ectopically expressing Batf and Foxp3 (Fig. 9 G and Fig. S5 C), Foxp3 may upregulate aTreg-related genes at least partially via Batf-dependent Foxp3–chromatin binding. To test this notion, we disrupted Batf by CRISPR in ex vivo isolated Treg cells and assessed Foxp3–chromatin binding and chromatin accessibility 3 days later (Fig. S5 D). This acute Batf deletion bypassed the requirement for Batf in the initial activation of Treg cells (not shown). Although Batf ablation was incomplete (Fig. 9 H and Fig. S5 E), Foxp3 binding at 337 sites was significantly reduced without changes in chromatin accessibility, as shown by several Foxp3 peaks at the Tnfrsf9 and Il2ra loci (Fig. 9, H–J; and Fig. S5 F). Furthermore, Batf motif was enriched in the regions with reduced Foxp3 binding upon Batf deletion (Fig. S5 G), proving the fidelity of our motif analysis. Many Foxp3 target genes (e.g., Il10, Ctla4, and Klrg1) were significantly downregulated in Batf knockout (KO) Treg cells, as reported (Xu et al., 2021), or upon acute CRISPR deletion of Foxp3 (Fig. S5, H–J). Coexpression of Batf and Foxp3 in activated CD4 Tn cells led to a moderate increase of Foxp3–chromatin binding and upregulation of CD25 and CTLA-4 expression (Fig. 9, K–M). These results support our model that AP-1 protein Batf facilitates Foxp3–chromatin binding in aTreg and tuTreg cells to enhance immune suppression.
Because Foxp3 can directly bind to DNA in vitro (Leng et al., 2022; Wu et al., 2006; Zhang et al., 2023), Foxp3 may influence Batf’s binding to DNA, such as by affecting target specificity or affinity. To test this possibility, we compared Batf peaks in Treg cells (this study) with published Batf ChIP-seq data of Th2 and Th17 cells (Ciofani et al., 2012; Iwata et al., 2017), revealing significant overlaps despite minor variations of signal intensities (Fig. 9 N and Fig. S5 K). These results suggest that the target specificity of Batf-DNA binding is largely independent of Foxp3 and that, conversely, Foxp3 associates with chromatin via Batf to modulate target genes’ expression. In agreement with this notion, regions with increased Foxp3 binding in aTreg cells are also enriched with Irf4, an interactor of Foxp3 and AP-1 complex, according to reported Irf4 ChIP-seq data (Ciofani et al., 2012; Li et al., 2012; Vasanthakumar et al., 2017; Zheng et al., 2009) (Fig. S5, L and M), further suggesting that AP-1 complex and interacting proteins mediate or facilitate Foxp3–chromatin binding.
In summary, our study delineates the Foxp3 activity modes governing tunable Treg cell function. We propose that Foxp3–chromatin interaction is mainly determined by its associated DNA-binding proteins and is stabilized by direct Foxp3-DNA binding. In the resting state, Foxp3–chromatin interaction is facilitated or mediated by ETS proteins such as Ets1 to confer Treg cell basal function by regulating genes including Il2ra and Ctla4 (Fig. 9 O). Upon stimulation or differentiation, Foxp3 associates with chromatin via induced DNA-binding proteins (e.g., NFAT and AP-1 complex) to modulate gene expression (e.g., Il10, Ctla4, and Klrg1), which enhances the suppression of autoimmunity and antitumor response.
Discussion
Our delineation of the modes of Foxp3–chromatin binding and their dynamics resulting from different immunological settings advance the fundamental understanding of the mechanisms by which Foxp3 controls Treg lineage identity and immunological function. We took several technical approaches to exclude the possibility of experimental artifacts that cause differential Foxp3–chromatin binding. First, antibodies against GFP in Treg cells expressing GFP-Foxp3 fusion protein and a selected monoclonal antibody targeting endogenous Foxp3 generated nearly identical Foxp3-binding patterns in aTreg and rTreg cells. Because GFP is an exogenous protein without known interactors in Treg cells, this result exhibits the fidelity of our experiments using a selected Foxp3 monoclonal antibody. The context-specific patterns of Foxp3–chromatin binding in aTreg, rTreg, tuTreg, and rTreg cells after ex vivo stimulation by IL-2 or TCR agonists prove the functional relevance. For example, increased and decreased Foxp3–chromatin binding is highly related to Foxp3-dependent gene expression illustrated by wannabe Treg cells that lack functional Foxp3 or by mature WT Treg cells after acute Foxp3 CRISPR deletion in vitro. Furthermore, genomic regions with increased Foxp3 binding in aTreg, tuTreg, and rTreg cells after acute IL-2 or TCR stimulation are enriched with DNA sequence motifs for AP-1 complex (including Batf), NFκB, NFAT, or STAT5 that are specific DNA-binding proteins induced in these conditions. Our observations strongly argue that Foxp3–chromatin interaction is not static, but instead dynamically regulated by environmental cues or Treg activation and differentiation states.
Although our study does not exhaust the immunological settings, the representative conditions depict a model in which Foxp3–chromatin binding is largely conferred by the DNA-binding proteins associated with Foxp3. These proteins are induced by TCR and cytokine signaling or upon Treg activation or differentiation such that Foxp3 constantly senses environmental cues and cellular contexts to modulate Treg cell function. Foxp3 also binds to chromatin in the resting state, probably via other mediators (e.g., Ets1), to provide Treg basal function, as reflected by elevated expression of CD25 and CTLA-4 for Treg fitness, survival, and immune suppression. Given that Foxp3 expression is stabilized by specialized enhancers and epigenetic mechanisms (Feng et al., 2014; Li et al., 2021; Li et al., 2014a; Yue et al., 2019; Yue et al., 2016; Zong et al., 2021) and regulation of Foxp3 target genes’ expression is mediated by dynamic Foxp3–chromatin binding, control of Treg-lineage stability and tunable function is, thus, executed by separate molecular processes via Foxp3.
The stoichiometry of Foxp3 and its associated DNA-binding proteins could be a key determinant of tunable Treg cell function. When Foxp3 is abundant, these DNA-binding proteins can act in a dose-dependent manner to modulate Treg cell function. Under certain circumstances, such as severe inflammation or attenuated Foxp3 expression, these DNA-binding proteins may outnumber Foxp3, conferring Treg cells certain Te features, such as the production of inflammatory cytokines as reported (Esposito et al., 2010; Wan and Flavell, 2007). Characterizing the stoichiometry of Foxp3 and client DNA-binding proteins and determining their roles in different immunological settings would produce valuable insights.
tuTreg cells enrich the DNA motifs for AP-1 and NFAT etc. in regions bearing increased Foxp3-binding, e.g., Il10, Ctla4, and Klrg1. The top ranking of the AP-1 complex suggests that AP-1 proteins including Batf play a crucial role. Batf was recently linked to aTreg and tuTreg cells (Itahashi et al., 2022; Xu et al., 2021), but the underlying mechanisms controlling Treg cell function remain obscure given its broad roles in T cell subtypes (Schraml et al., 2009; Seo et al., 2021). As AP-1 proteins act downstream of various signaling pathways (Atsaves et al., 2019; Müller et al., 1997), multiple cues in the TME, such as antigen stimulation via TCR, costimulation, anti-inflammatory cytokines, and hypoxia, may converge on AP-1. Our data suggest that AP-1 proteins serve as a hub in tuTreg cells hijacked by Foxp3 to promote Treg suppressive function. Given the relative uniqueness of tuTreg cells (De Simone et al., 2016), further experiments are also needed to determine the similarities and differences of Foxp3–chromatin interactions in normal non-lymphoid tissues versus TME.
Our model extends a proposal that Foxp3 occupies the pre-existent enhancer landscape (Samstein et al., 2012). Our proximity proteomics experiment uncovered remarkable dynamics of the proteins potentially interacting with Foxp3 in response to IL-2 or TCR stimulation. They may mediate or modulate Foxp3-dependent gene expression in response to these environmental cues. Future experiments are needed to determine their exact roles in Treg cells, thereby revealing the intricate interactions among chromatin, Foxp3, signaling pathways, and environmental cues.
Materials and methods
Mice
All the animals were maintained and bred in the St. Jude Children’s Research Hospital specific pathogen–free facility, and all the experimental procedures were approved by St. Jude Children’s Research Hospital IACUC (612). WT Foxp3gfp-DTR reporter mice in C57BL/6 background were described previously (Kim et al., 2007). WT Foxp3gfp knockin mice in C57BL/6 background were described previously (Fontenot et al., 2005; Zheng et al., 2010). CD4 T cells were FACS-sorted from pooled samples of 6- to 10-wk-old male and female mice for proteomics and CRISPR experiments. T cells isolated from male mice were used for ChIP-, CUT&RUN- or CUT&Tag-, ATAC-, and RNA-seq because the Foxp3 gene is located on the X-chromosome that undergoes random inactivation. Homozygous RosaCas9 mice constitutively expressing Cas9 (Platt et al., 2014) were bred with Foxp3gfp mice to generate RosaCas9/+Foxp3gfp mice for isolating T cells for CRISPR experiments.
T cell isolation and culture
CD4 T cells were enriched by EasySep Mouse CD4 T cell Isolation Kits (STEMCELL) from lymph nodes and spleens. CD4 Tn cells (CD4+GFP−CD44loCD62Lhi), nTreg (CD4+GFP+), CD4 effector T cells (Te, CD4+GFP-CD44hiCD62Llo), rTreg (CD4+GFP+CD44loCD62Lhi), and aTreg (CD4+ GFP+CD44hiCD62Llo) were further sorted by FACS from Foxp3gfp-DTR or Foxp3gfp mice. CD4 Tn and nTreg cells were isolated from RosaCas9/+Foxp3gfp mice for CRISPR-mediated Foxp3 and Batf knockout. In particular, Treg cells were double-sorted by FACS to achieve >99% purity. T cells were cultured at 37°C, 5% CO2 in RPMI1640 media supplemented with 10% fetal bovine serum (FBS), 2 mM L-glutamine, 1 mM sodium pyruvate, 1% non-essential amino acid, 10 mM HEPES, 20 µM 2-mercaptoethanol, 100 U/ml penicillin, 100 mg/ml streptomycin (complete RPMI1640), and indicated cytokines and compounds.
Induction of Treg differentiation in vitro was conducted according to published protocols (Feng et al., 2015). Briefly, cell culture plates or dishes were precoated with 1 µg/ml anti-CD3 and anti-CD28 antibodies (Bio X Cell) in PBS at 37°C for 2 h to grow FACS-sorted CD4 Tn cells in complete RPMI1640 supplemented with 100 U/ml recombinant human IL-2, 1 ng/ml recombinant human TGF-β, and 0.25 mM ASC-2-phosphate for 3 days. The cells were then expanded onto uncoated plates and harvested on day 5 or 6.
To prepare Th0 cells, CD4 Tn cells were cultured according to the same procedure in complete RPMI1640 supplemented with 100 U/ml recombinant human IL-2. For Flag-Foxp3 and Batf ectopic expression, CD4 Tn cells were activated with plate-bound anti-CD3 and anti-CD28 antibodies (1 µg/ml) for 24 h, transduced with retrovirus expressing full-length Flag-Foxp3-IRES-CD2, and then cultured in complete RPMI1640 medium with 100 U/ml recombinant human IL-2 without TCR stimulation for 2 days.
Acute IL-2 or TCR stimulation for CUT&RUN- and CUT&Tag-seq
Sorted rTreg cells (CD4+GFP+CD44loCD62Lhi) were resuspended in complete RPMI1640. For IL-2 stimulation, mock or recombinant human IL-2 was added at 500 U/ml. To stimulate Treg cells with TCR agonists, rTreg cells were seeded onto either mock (−TCR) or precoated 24-well plates with anti-CD3 and anti-CD28 antibodies (+TCR). To expedite the interaction between cells and immobilized antibodies, the plates were centrifuged at 500 g for 5 min. Cells were then incubated at 37°C for 3 h before the experiment.
CUT&Tag-seq
CUT&Tag was performed according to the protocols from EpiCypher. Briefly, 50,000–100,000 cells were used for nuclei preparation in NE buffer (20 mM HEPES, pH 7.5, 10 mM KCl, 0.5 mM spermidine, 0.1% Triton X-100, 20% glycerol, and protease inhibitors) for 10 min on ice. The nuclei were attached to concanavalin A (ConA)–coated magnetic beads and incubated with primary antibody (Foxp3 antibody [Clone FJK-16s] diluted [1:100] in the antibody buffer [20 mM HEPES, pH 7.5, 150 mM NaCl, 0.5 mM spermidine, 0.01% digitonin, 2 mM EDTA, and protease inhibitors]) overnight at 4°C on a rotator. The bead–nuclei mixture was then incubated with 50 μl of secondary antibodies in cold antibody buffer on a rotator for 30 min at room temperature (RT). After two washes with digitonin 150 buffer (20 mM HEPES, pH 7.5, 150 mM NaCl, 0.5 mM spermidine, 0.01% digitonin, and protease inhibitors), 50 μl of cold digitonin 300 buffer (20 mM HEPES, pH 7.5, 300 mM NaCl, 0.5 mM spermidine, 0.01% digitonin, and protease inhibitors) and 2.5 μl of pAG-Tn5 were added and incubated on a rotator for 1 h at RT. Then, 200 μl of digitonin 300 buffer was used to wash the beads–nuclei mixture twice, and 50 μl of Tagmentation buffer (digitonin 300 buffer with 10 mM MgCl2) was added and incubated for 1 h at 37°C. After washing with 50 μl of TAPS buffer (10 mM TAPS, pH 8.5, 0.2 mM EDTA), 5 μl of SDS release buffer (10 mM TAPS, pH 8.5, 0.1% SDS) was added and incubated for 1 h at 58°C. Next, 15 μl of SDS quench buffer (0.67% Triton-X 100 in molecular-grade H2O) was added to each reaction and vortexed at maximum speed. After removal of the beads, the supernatant (∼20 μl) was directly used for sequencing library preparation by adding 2 μl of i5 and i7 barcoded primers and 25 μl of 2× HiFi PCR master mix (NEB, M0531). The library was amplified by using the following parameters: 58°C for 5 min, 72°C for 5 min, 98°C for 45 s, 15–20 cycles of 98°C for 15 s and 60°C for 10 s, followed by 1 min at 72°C; 1.3× SPRIselect beads were used to clean up the library. Sequencing reads were mapped to the mouse genome (mm10).
CUT&RUN-seq
CUT&RUN was performed according to a described method, with minor modifications (Skene and Henikoff, 2017). Briefly, ∼0.2 million cells were attached to ConA-coated magnetic beads for each experiment. Cells were permeabilized with digitonin-wash buffer (20 mM HEPES, pH 7.5, 150 mM NaCl, 0.5 mM spermidine, 0.01% digitonin, and protease inhibitors) and then incubated with primary antibodies (1:100 dilution for Foxp3 or Batf) overnight at 4°C on a rotator. The bead–cell mixture was washed twice with digitonin-wash buffer, resuspended in 200 μl of protein A/G-MNase, and incubated for 1 h at 4°C on a rotator. After three rounds of washing, beads were resuspended in 150 μl of digitonin-wash buffer and chilled to 0°C (ice-water bath) for 5 min. Next, 3 μl of 100 mM CaCl2 was added into the tube with gentle vortexing, and the tube was placed in the ice-water bath. After 30 min of incubation, 150 μl of 2× STOP buffer (170 mM NaCl, 20 mM EDTA, 20 mM EGTA, 0.05% digitonin, 20 mg/ml GlycoBlue, and 25 mg/ml RNase A) was added and mixed with gentle vortexing. Beads were incubated at 37°C for 30 min and then placed on a magnet stand for 2 min. The clarified liquid was transferred to a fresh DNA LoBind (Eppendorf) tube. After phenol:chloroform extraction, DNA was pelleted by ethanol. A library was prepared by using a KAPA HyperPrep kit according to the manufacturer’s instructions. Sequencing reads were mapped to the mouse genome (mm10).
Protein expression and purification
MBP-Foxp3ΔN expression plasmid was a gift from Sun Hur (Harvard Medical School, Boston, MA, USA) as described (Leng et al., 2022). Foxp3 mutagenesis was done with PCR. All recombinant proteins were expressed in BL21(DE3) Escherichia coli (NEB) at 16°C overnight. Bacteria were lysed in Pierce Lysis Buffer (Thermo Fisher Scientific) according to the manufacturer’s protocols. Recombinant proteins were enriched by Ni-NTA resin (Thermo Fisher Scientific) followed by size exclusion selection via a Superdex 200 Increase 10/300 column (GE Healthcare) in 20 mM Tris-HCl pH 7.5, 200 mM NaCl, 2 mM dithiothreitol.
EMSA
Inverted-repeat FKHM 5′-TTAGGAAAATTTGTTTACTCGAGTAAACAGTGGATCCGAATTCATAT-3′ or (T3G)6 5′-TTTGTTTGTTTGTTTGTTTGTTTG-3′ DNA oligos were mixed at 0.4 µM with recombinant Foxp3 at 0.4 and 0.8 µM in 20 mM Tris-HCl pH 7.5, 150 mM NaCl, 1.5 mM MgCl2, and 2 mM dithiothreitol, incubated at RT for 30 min, and then resolved by 3–12% gradient Bis-Tris native gel (Life Technologies) at 4°C. DNA was visualized by SYBR Gold nucleic acid stain (Life Technologies).
IL-2 or TCR stimulation for proteomics
CD4 Tn cells were seeded on day 0 in the Treg induction condition as previously described and expanded onto uncoated plates on day 3. To stimulate iTreg cells with or without IL-2, cells were washed twice with complete RPMI1640 on day 5 to remove remaining IL-2 and then grown in complete RPMI1640 overnight (IL-2 starvation). On day 6, after ∼14 h of IL-2 starvation, cells were split into two parts, each receiving 200 U/ml recombinant human IL-2 or mock treatment. Cells were then incubated at 37°C for 30 min. The efficiency of IL-2 stimulation was verified by phospho-Stat5 staining according to our standard protocols (Feng et al., 2014). After stimulation, cells were frozen at −80°C for TMT-MS analysis with whole-cell lysate or immediately fixed for PSI reaction.
To stimulate iTreg cells with TCR agonists, cells were collected on day 6 and reseeded onto either uncoated (−TCR) or precoated six-well plates with anti-CD3 and anti-CD28 antibodies (+TCR) at 14 × 106 cells per well in complete RPMI1640. To expedite the interaction between cells and immobilized antibodies, the plates were centrifuged at 400 g, 37°C for 5 min and then incubated at 37°C for 3 h. After stimulation, cells were collected from the plates by scraping and immediately either processed for PSI labeling, lysed in TRIzol for RNA extraction, and stored at −80°C for TMT-MS analysis with whole-cell lysate.
PSI labeling (peroxidase-based proximity ligation)
To perform Foxp3 PSI, cells were fixed and stained with a Foxp3 staining kit according to the manufacturer’s manual (eBioscience). Specifically, cells were fixed with 1× fixative buffer at 4°C for 1 h (1 ml per 15 × 106 cells) and then washed twice with 1× perm buffer (1 ml per 3 × 10⁶ cells). Primary antibody staining was performed in 1× perm buffer (1 ml per 30 × 106 cells) with rat-anti-Foxp3 antibodies (1:500 dilution) at 4°C for 1 h with rotation, followed by triple 5-min washes in 1× perm buffer (1 ml per 3 × 10⁶ cells) with rotation at RT. Next, cells were incubated with HRP-conjugated secondary antibodies in 1× perm buffer (1 ml per 30 × 106 cells) at a final concentration of 28.1 ng/ml at 4°C for 1 h with rotation, followed by triple 5-min washes in 1× perm buffer (1 ml per 3 × 10⁶ cells) with rotation at RT.
For histone H3 PSI, cells were fixed and stained according to a described paraformaldehyde-methanol staining protocol (Feng et al., 2014). Specifically, cells were washed once with cold PBS and then fixed with 1% formaldehyde in PBS for 5 min at RT (1 ml per 15 × 106 cells). Cells were pelleted and resuspended in cold 90% methanol in H2O. Permeabilization was achieved by incubating cells in cold 90% methanol for 30 min at −20°C. Cells were then washed twice with FACS buffer (5% FBS in PBS). Primary antibody staining was performed in FACS buffer (1 ml per 30 × 106 cells) with rabbit-anti-Histone H3 antibody (1:1,000 dilution) at 4°C for 30 min with rotation, followed by triple 5-min washes in FACS buffer (1 ml per 3 × 10⁶ cells) with rotation at RT. HRP-conjugated secondary antibody incubation was conducted in 1× FACS (1 ml per 15 × 106 cells) at a final concentration of 1:8,000–1:16,000 at 4°C for 30 min with rotation, followed by triple 5-min washes in FACS buffer (1 ml per 3 × 10⁶ cells) with rotation at RT.
To label proteins within the proximities of Foxp3 or H3 with constrained reactivity, cells were suspended in a reaction buffer with substrates and low concentrations of quenching reagents (0.5 mM biotin phenol, 3.2 µM ASC, 1.6 µM Trolox, 3.2 µM NaN3 in MACS [0.05% bovine serum albumin [BSA] and 1 mM EDTA in DPBS]) at 1 ml per 15 × 106 cells and incubated at RT for 10 min with rotation. To initiate proximity ligation, H2O2 was added to a final concentration of 1 mM and immediately mixed by inversion or resuspension. After 1 min of incubation at RT, the reaction was terminated by mixing with an equal volume of 2× quenching buffer (20 mM ASC, 10 mM Trolox, and 20 mM NaN3 in MACS). Cells were pelleted and washed once with 1× quenching buffer (10 mM ASC, 5 mM Trolox, 10 mM NaN3 in MACS). Cells were then aliquoted, immediately processed for streptavidin staining followed by FACS or immunofluorescence analysis, fixed with 1% formaldehyde, and frozen for PSI-ChIP or directly frozen for proteomics experiments. Cell pellets were kept in protease inhibitors and stored at −80°C.
ChIP qPCR and sequencing
Cells were harvested, washed twice with PBS at RT, and fixed with 1% formaldehyde at RT for 5 min. Fixation was quenched by 125 mM glycine. Cells were then pelleted, washed once with ice-cold PBS, aliquoted, and either stored at −80°C or immediately processed for downstream reactions. Chromatin sonication was performed with truChIP Chromatin Shearing Kit (Covaris) with Focused-Ultrasonicator M220 (Corvaris), following the manufacturer’s instructions. Chromatin was sheared to 200–500 bp, and 5% of the sample was aliquoted as input. In each ChIP reaction, 10 μl of rabbit anti-Foxp3 or control rabbit IgG was added to the lysis/binding buffer (50 mM HEPES pH 8.0, 1 mM EDTA, 1% Triton X-100, 0.1% sodium deoxycholate, 0.1% SDS, 140 mM NaCl, 1 mM PMSF, and protease inhibitor cocktail) to precipitate the chromatin. After an overnight incubation, protein-A and protein-G magnetic beads were added to capture the antibody–chromatin complexes. Next, beads were washed according to our published protocols (Feng et al., 2014). To release the DNA, ChIP samples were treated with proteinase K, followed by phenol:chloroform:isoamyl alcohol extraction and 2-propanol precipitation in the presence of GlycoBlue Coprecipitant (ThermoFisher Scientific). DNA pellets were dissolved in 1× TE buffer (10 mM Tris HCl pH 8.0, 1 mM EDTA) for qPCR or deep sequencing analysis.
For PSI-ChIP, after the PSI reaction, cells were fixed and processed in the same way as done for traditional ChIP. Chromatin shearing was conducted in a modified shearing buffer (10 mM Tris-HCl pH 7.6, 1 mM EDTA, and 0.3% SDS). Streptavidin immunoprecipitation was performed in a modified immunoprecipitation buffer to increase the immunoprecipitation stringency (10 mM Tris-HCl pH 7.6, 1 mM EDTA, 140 mM NaCl, 1% Triton X-100, 0.1% Na-deoxycholate, 0.3% SDS, and protease inhibitors). Then, 42 μl of streptavidin magnetic beads was added per 10 million cells per PSI-ChIP. Immunoprecipitation was performed at 4°C for 3 h. Next, streptavidin beads were washed twice with each of the following buffers for 10 min per wash at RT with rotation: W1: 2% SDS; W2: 10 mM Tris HCl pH 8.0, 1 mM EDTA, 250 mM LiCl, 1% NP-40, 1% Na-deoxycholate; W3: 20 mM Tris-HCl pH 7.6, 1 mM EDTA, 50 mM NaCl, 0.05% Tween-20. DNA was eluted by proteinase K treatment, extracted by phenol:chloroform:isoamyl, and precipitated by 2-propanol, as in traditional ChIP.
To quantify the precipitated DNA, qPCR was performed using site-specific primers and PowerUp SYBR Green master mix (Applied Biosystems) and the CFX384 Real Time System (Bio-Rad). To calculate the relative enrichment of the targets, the signals of the precipitated DNA were normalized with those of the input. To perform ChIP-seq, libraries were prepared with precipitated DNA by using a KAPA HyperPrep kit (Kapa Biosystems). The library DNA was enriched by size selection with AMPure XP beads (Beckman Coulter) and quantified by using a NEBNext Library Quant Kit (NEB). Samples were multiplexed for single-end sequencing with 50 cycles on a HiSeq 4000 or HiSeq 2500 (Illumina). At least 40 million reads per sample were sequenced for downstream analysis.
Flow cytometry analysis
Cell staining and flow cytometry analyses were performed according to standard protocols (Feng et al., 2014, 2015). Briefly, cells were prestained with fixable viability dye to distinguish live and dead cells and then incubated with fluorophore-conjugated antibodies against cell surface markers in MACS or FACS buffer (see Table S8), followed by fixation/permeabilization with Foxp3/Transcription Factor Staining Buffer Set (eBioscience) and intracellular staining of Foxp3, if needed. After the final staining and washing, cells were fixed in PBS with 1% formaldehyde for 10 min. FACS analyses were performed on LSRII or LSR Fortessa (BD) flow cytometers after compensating the spectrum overlapping with single colors; data were analyzed via FlowJo (BD, version 10).
Immunofluorescent staining after PSI proximity biotinylation
First, iTreg cells induced from CD4 Tn cells of Foxp3gfp mice were processed with Foxp3-PSI labeling followed by Streptavidin-Alexa Fluor 568, GFP-booster-AF488, and anti-nuclear lamin-AF647 staining. Cells were mounted with Prolong Diamond Antifade Mounting Medium (Thermo Fisher Scientific Scientific) and visualized by the Cell and Tissue Imaging Center with a Leica SP8 confocal microscope.
Cell lysis and streptavidin immunoprecipitation
After PSI labeling, the cell pellet was resuspended in lysis buffer (2% SDS, 10 mM Tris-HCl pH 7.5, 140 mM NaCl, 1 mM EDTA, 0.5 mM EGTA, 1% Triton X-100, 0.1% Na-deoxycholate, proteinase inhibitor cocktail, and 1 mM PMSF) at a concentration of 150 × 106 cells/ml and incubated at 99°C for 1–1.5 h with shaking at 1,000 RPM. To shear chromatin DNA, the lysate was then sonicated twice for 15 s each at 10% power with a Branson Digital Sonifier SFX 550 ultrasonic cell disruptor (Emerson), followed by centrifugation at 12,000 g at RT for 5 min to remove the insoluble debris. The protein concentration of the lysate was quantified by using Pierce 660 nm Protein Assay Reagent in the presence of Ionic Detergent Compatibility Reagent (Thermo Fisher Scientific).
To purify biotinylated proteins with streptavidin beads, 2% of the lysate was aliquoted as input control and the rest was diluted with the immunoprecipitation buffer (0.3% SDS, 0.2% Na-deoxycholate, 50 mM Tris-HCl pH 7.5, 1 mM EDTA, 150 mM NaCl, 1% Triton X-100, 1 mM PMSF, and proteinase inhibitor cocktail). Then, 100 μl of Streptavidin Sepharose High-Performance beads (GE/Sigma-Aldrich) was washed twice with the immunoprecipitation buffer before being added to 1 mg protein of cell lysate. The resulting bead–protein mixture was incubated at RT for 1 h with rotation. The supernatant was collected after brief centrifugation and mixed with acetone to precipitate the unbound proteins (flow through). To reduce non-specific binding, the beads were washed sequentially with the following buffers twice each for 5 min each wash at RT with rotation: W1: 2% SDS; W2: 10 mM Tris-HCl pH 8.0, 1 mM EDTA, 250 mM LiCl, 1% NP-40, 1% Na-deoxycholate; W3: 1 M NaCl, 0.1% Tween 20 in PBS; W4: 0.1 M Na2CO3, 0.1% Tween 20 in H2O, pH∼11.5; W5: 2 M urea, 10 mM Tris-HCl pH 8.0, 0.1% Tween 20 in H2O. The beads were then washed once with buffer W6 (immunoprecipitation buffer supplemented with 10% glycerol and 30 mM biotin), and the supernatant was carefully removed. To elute the bound proteins, beads were resuspended in 50 μl of elution buffer (2% SDS, 30 mM biotin, 5.5% glycerol, 50 mM dithiothreitol, 18 mM Tris-HCl pH 7.5, 0.13% bromophenol blue, and 0.0019% phenol red), incubated at 99°C for 10–15 min with vortexing at 1,000 RPM, and then immediately centrifuged at 1,000 g for 1 min to collect the supernatant containing the eluted proteins.
Protein digestion and peptide isobaric labeling by TMT
Labeling of protein samples with TMT reagents was conducted by the Center for Proteomics and Metabolomics at St. Jude Children’s Research Hospital. Identification and quantification of proteins in whole-cell lysate were performed according to a published protocol, with slight modifications (Bai et al., 2017). Briefly, cell pellets were resuspended in lysis buffer (50 mM HEPES, pH 8.5, 8 M urea, and 0.5% sodium deoxycholate) and lysed in a bullet blender (Next Advance). The protein concentration of the lysates was determined by Coomassie-stained short gels by using BSA as a standard (Xu et al., 2009). Then, 100 µg of protein for each sample was digested with LysC (Wako) at an enzyme-to-substrate ratio of 1:100 (wt/wt) for 2 h in the presence of 1 mM dithiothreitol at RT. Following this, the samples were diluted in 50 mM HEPES (pH 8.5) to a final 2 M urea concentration and further digested with trypsin (Promega) at an enzyme-to-substrate ratio of 1:50 (wt/wt) for at least 3 h at RT. The peptides were reduced by adding 1 mM dithiothreitol for 30 min at RT followed by alkylation with 10 mM iodoacetamide for 30 min in the dark at RT. The unreacted iodoacetamide was quenched with 30 mM dithiothreitol for 30 min. Finally, the digestion was terminated and acidified by adding trifluoroacetic acid to 1%, desalted using C18 cartridges (Harvard Apparatus), and dried by a speed vacuum concentrator. The purified peptides were resuspended in 50 mM HEPES (pH 8.5) and labeled with 11-plex TMT reagents (Thermo Fisher Scientific) following the manufacturer’s recommendations. Labeling efficiency was evaluated by MS, and the excess label was quenched with 5% hydroxylamine before the samples were mixed.
Identification of streptavidin-purified proteins was performed according to published protocols, with minor modifications (Bai et al., 2017; Mertz et al., 2015). Approximately 10 µg of protein for each sample was run on a short gel and stained by Coomassie blue before protein concentration was determined using BSA as a standard (Xu et al., 2009). After protein estimation, gel bands were cut into smaller pieces for in-gel digestion. The gel bands were washed with 50% acetonitrile, reduced with 5 mM dithiothreitol at 37°C for 30 min, and then alkylated with 10 mM iodoacetamide for 30 min in the dark at RT. Unreacted iodoacetamide was quenched with 30 mM dithiothreitol for 30 min. The gel bands were then washed, dried in a speed vacuum concentrator, and rehydrated in 25 mM ammonium bicarbonate buffer (pH 8.0) containing trypsin (Promega). Samples were digested overnight at 37°C and acidified before the peptides were extracted in 100% acetonitrile. The peptide extracts were dried in a speed vacuum concentrator, reconstituted in 50 mM HEPES (pH 8.5), and labeled with 11-plex TMT reagents (Thermo Fisher Scientific) following the manufacturer’s recommendations. Labeling efficiency was evaluated by MS, and the excess labels were quenched by adding 5% hydroxylamine before mixing the samples.
Peptide fractionation by basic pH reverse phase liquid chromatography
Basic pH reverse-phase liquid chromatography was performed by the St. Jude Children’s Research Hospital Center for Proteomics and Metabolomics. The pooled TMT-labeled peptides were fractionated on an offline HPLC (Agilent 1220) by basic pH reverse-phase liquid chromatography (Wang et al., 2015) over a 60/160 min gradient at a flow rate of 100/400 μl/min on an Waters XBridge C18 column (3.5 μm particle size, 2.1 mm × 10 cm/4.6 mm × 25 cm; buffer A: 10 mM ammonium formate, pH 8.0; buffer B: 90% acetonitrile, 10 mM ammonium formate, pH 8.0). The peptides were collected in 1-min fractions and concatenated back into a total of 30/80 fractions for whole-proteome analysis. These fractions were dried in a Speedvac and stored at −80°C.
Peptide analysis by acidic pH reverse phase liquid chromatography-tandem MS (LC-MS/MS)
MS was performed by the St. Jude Children’s Research Hospital Center for Proteomics and Metabolomics. The dried fractions were resuspended in 5% formic acid and analyzed by acidic pH reverse-phase LC-MS/MS analysis (Wang et al., 2015). The peptide samples were loaded on a nanoscale capillary reverse-phase C18 column (New Objective, 50/75 µm ID, 25 cm, 1.9 µm C18 resin from Dr. Maisch, GmbH) by an HPLC system (Thermo Ultimate 3000) and eluted by a 60/120-min gradient (buffer A: 0.2% formic acid; buffer B: buffer A plus 70% acetonitrile). The eluted peptides were ionized by electrospray ionization and detected by an in-line Orbitrap Fusion mass spectrometer (Thermo Fisher Scientific). The mass spectrometer was operated in data-dependent mode with a survey scan in Orbitrap (60,000 resolution, 1 × 10⁶ AGC target and 50 ms maximal ion time) and MS/MS high-resolution scans (60,000 resolution, 2 × 10⁵ AGC target, 200 ms maximal ion time, 38 HCD normalized collision energy, 1 m/z isolation window, and 20 s dynamic exclusion).
CRISPR library construction
A retroviral sgRNA library targeting 1,548 nuclear proteins, including negative and positive controls and 1,493 proteins enriched by Foxp3 PSI versus histone H3 PSI (7 sgRNAs per gene), was designed, and 75-nt single-stranded DNA oligos (Table S2) were synthesized by a high-throughput method (Twist Bioscience). It was amplified by PCR with primers bound at the flanking arms according to our described protocols (Zong et al., 2021). The PCR product was then assembled with BbsI-linearized pSIR-BbsI-Thy1.1 or pSIR-BbsI-DsRed vector backbones (Li et al., 2021) with Gibson Assembly Master Mix (NEB). The resulting product was transformed into electrocompetent E. coli (NEB) by electroporation and selected by ampicillin. Plasmid was extracted by CompactPrep Plasmid Maxi Kit (QIAGEN) and the sgRNA coverage was validated by high-throughput sequencing. To clone gene-specific sgRNAs into pSIR-Thy1.1 or pSIR-DsRed, 2 complementary strands of DNA oligos were synthesized individually, annealed in vitro, and immediately ligated to BbsI-linearized vector backbones with T4 DNA ligase (NEB). The inserts were confirmed by Sanger sequencing.
Retroviral packaging and transduction
Retrovirus packaging and transduction of mouse primary T cells were conducted according to our published protocols, with a few modifications (Zong et al., 2021). Specifically, Platinum-E (Plat-E) cells were used to package the retrovirus per the manufacturer’s instructions (Cell Biolabs). These packaging cells were grown in complete DMEM (DMEM supplemented with 10% FBS, 10 mM HEPES, 1% non-essential amino acid, 100 U/ml penicillin, and 100 mg/ml streptomycin). Plat-E cells were cultured in the presence of 1 µg/ml puromycin and 10 µg/ml blasticidin to maintain the packaging vectors. 1 day before transfection, cells were seeded on new dishes in a medium without puromycin and blasticidin. Then, sgRNA-expressing constructs and pCL-Eco plasmid were cotransfected into these cells with TransIT-293 Transfection Reagent (Mirus). Approximately 18 h after transfection, cells were provided fresh complete DMEM. Virus-containing medium was collected 48 h after transfection, clarified with 0.45 µm filters, aliquoted, and stored at −80°C.
In vitro CRISPR screening
To perform in vitro CRIPSR screening, CD4 Tn cells sorted from RosaCas9/+Foxp3gfp mice were seeded at 1.3 × 10⁶ cells per well on 6-well plates precoated with 1 µg/ml anti-CD3 and 1 µg/ml anti-CD28 antibodies in the Treg-induction medium (complete RPMI1640 supplemented with 100 U/ml recombinant human IL-2, 1 ng/ml recombinant human TGF-β, and 0.25 mM ASC-2-phosphate [a stable form of ASC]) (Mitsumoto et al., 1994). 3 days later, retrovirus was added to achieve 10–15% transduction efficiency. Transduction was performed according to standard protocols: centrifugation at 1,200 g, 35°C for 90 min in complete RPMI1640 supplemented with 6 µg/ml polybrene and 10 mM HEPES. Cells were then cultured in a fresh Treg-induction medium. 5 days after transduction, cells were harvested and stained sequentially with fixable viability dye eFluor 780 and anti-CD4-eFlour450 antibodies. To screen for factors controlling Foxp3 expression, cells were directly sorted for the top 10% GFPhi and bottom 10% GFPlo/− cells within the live CD4+ T cell gating. To screen for factors regulating CD25 expression, anti-CD25-PE antibodies were included in the surface staining and cells were sorted for top 10% CD25-PEhi and bottom 10% CD25-PElo/− cells within the live CD4+GFP+ gating. To screen for factors controlling CTLA-4 expression, anti-CTLA-4-PE antibodies were included in the surface staining, and cells were further stained for intracellular CTLA-4 with Foxp3/Transcription Factor Staining Buffer Set (Thermo Fisher Scientific). Cells were then sorted for the top 10% CTLA-4-PEhi and bottom 10% CTLA-4-PElo/– cells within live CD4+GFP+ gating. Sorted cells were pelleted and stored at −80°C.
To retrieve sgRNA information, genomic DNA was extracted from sorted T cells by proteinase K digestion, phenol:chloroform:isoamyl extraction, and 2-propanol precipitation. The sgRNA-coding sequences were amplified from genomic DNA via a two-step PCR protocol. The first PCR (PCR1) amplified the region covering the sgRNA cassette using primers targeting the retroviral vector backbone and containing the adaptor sequences for the second indexing PCR. The second PCR (PCR2) added barcodes with Illunina i5 and i7 indexing primers. PCR and DNA purification were conducted according to our published protocols (Zong et al., 2021). Purified PCR2 products were then sequenced with MiSeq kits (Illumina) with single-end, 100 cycles. More than 1 × 10⁶ reads were obtained for each sample.
Retrovirus transduction for Batf or Foxp3 knockout
nTreg cells were double FACS-sorted from RosaCas9/+Foxp3gfp mice. 1×10⁶ Treg cells were seeded into one well of 48-well plates with mouse T-Activator CD3/CD28 beads (Thermo Fisher Scientific) and 1,000 U/ml recombinant human IL-2. On day 2, retrovirus was added for transduction in the presence of 5 µg/ml polybrene and 10 mM HEPES by centrifugation at 1,200 g 37°C for 99 min. After transduction, the culture medium was changed to fresh complete RPMI1640 with 1,000 U/ml IL-2. Fresh medium with 1,000 U/ml recombinant human IL-2 was replenished every 2 days until day 6. Mouse T-Activator CD3/CD28 beads were removed and Treg cells were maintained in complete RPMI1640 with 1,000 U/ml IL-2 for about 24 h. Viable GFP+dsRed+ (Treg) cells were sorted for the following experiments.
RNA-seq
We performed RNA-seq for naïve CD4 T cells (Tn, CD4+GFP−CD44loCD62Lhi), effector CD4 T cells (Te, CD4+GFP−CD44hiCD62Llo), rTreg (CD4+GFP+CD44lo CD62Lhi), and aTreg (CD4+GFP+CD44hiCD62Llo) sorted from 8- to 10-wk-old male Foxp3gfp mice. To explore Foxp3-dependent gene expression, sorted viable GFP+dsRed+ (Cas9+ nTreg) cells harboring either sgNC or sgFoxp3 gRNA were restimulated with mock treatment or 1 µg/ml anti-CD3 and anti-CD28 antibodies for 3 h. Cells were lysed in TRIzol reagent (Thermo Fisher Scientific) immediately after sorting or treatment and stored at −80°C. Total RNA was extracted following the Trizol manufacturer’s protocol. RNA-seq libraries were prepared by St. Jude Hartwell Genome Sequencing Center. Indexed samples were multiplexed for paired-end sequencing with 100 cycles or 50 cycles on a NovaSeq or HiSeq (Illumina).
ATAC-seq
ATAC-seq experiments were conducted as previously reported (Buenrostro et al., 2015) with minor modifications. Specifically, 5 × 10⁴ Treg cells derived from male Foxp3gfp mice were FACS-sorted by GFP expression or 5 × 10⁴ Treg cells harboring either sgNC or sgBatf gRNAs were sorted by GFP+dsRed+ (Cas9+ nTreg), washed once with cold PBS, and lysed in 300 μl of cold lysis buffer (10 mM Tris-HCl pH 7.5, 10 mM NaCl, 3 mM MgCl2, and 0.1% NP-40) by gently pipetting up and down several times. After centrifugation, the supernatant was removed and 50 μl of reaction mix containing 25 μl TD buffer, 2.5 μl TDE1 (Illumina Nextera DNA Library Prep Kit), and 22.5 μl nuclease-free water was added to perform transposition reaction at 42°C for 40 min. DNA was then purified by NucleoSpin Gel, and a PCR Clean-up kit was used afterward (Macherey-Nagel). The transposed DNA was amplified by PCR for 10–12 cycles by using the Nextera DNA Library Prep Kit and Nextera XT Indexing Kit (Illumina). The library DNA within 150–500 bp was enriched by one round of negative selection with 0.6 volume of AMPure XP beads (Beckman Coulter) and two rounds of positive selection with 1 volume of AMPure XP beads. The resulting sequencing libraries were quantified by using a NEBNext Library Quant Kit, and paired-end 100-cycle sequencing was performed on a HiSeq 4000 or HiSeq 2500 sequencing system (Illumina).
Isolation of tuTreg cells
MC38 colon adenocarcinoma cells were cultured in complete DMEM (DMEM supplemented with 10% FBS, 10 mM HEPES, 1% non-essential amino acid, 100 U/ml penicillin, and 100 mg/ml streptomycin). 0.5 million MC38 tumor cells were injected subcutaneously on the flank of 8- to 12-wk-old Foxp3gfp-DTR mice. Tumor was collected on day 21. Spleens were collected from age- and sex-matched healthy Foxp3gfp-DTR mice and processed in parallel with the tumor. To isolate tuTreg cells, tumors were excised, minced into small pieces, and digested with 1 mg/ml collagenase IV (Worthington) and 0.25 mg/ml DNase I (Sigma-Aldrich) in RPMI1640 supplemented with 5% newborn calf serum and 15 mM HEPES at 250 RPM at 37°C for 30 min. Cells were separated by 37% and 70% Percoll via centrifugation. Treg cells were sorted by FACS.
Co-immunoprecipitation
HEK293T cells were cultured in complete DMEM (DMEM supplemented with 10% FBS, 10 mM HEPES, 1% non-essential amino acid, 100 U/ml penicillin, and 100 mg/ml streptomycin). Mouse Foxp3 and Batf ectopic expression constructs were cotransfected into the HEK293T cells with TransIT-293 Transfection Reagent (Mirus). Approximately 24 h after transfection, cells were washed once with cold PBS and lysed in lysis buffer (50 mM Tris, pH 7.5, 150 mM NaCl, 0.1% NP-40, 1 mM EDTA, 5 mM MgCl2, 10% glycerol, 0.5 mM PMSF, and protease inhibitor cocktail) by incubation on ice for 15 min. To aid with lysis, cells were passed through a syringe three times. Then, 1 μl of enzymatic shearing cocktail (Active Motif) was added and the lysates were incubated at 4°C for 1 h with rotation before being centrifuged at 14,000 g, 4°C for 30 min. The supernatant was collected and precleared by incubation with prewashed Dynabeads Protein A beads (Invitrogen) for 1 h at 4°C with rotation. Precleared lysates were incubated with Batf antibodies and BSA-blocked Dynabeads Protein A beads for 3 h at 4°C with rotation. Beads were washed three times with lysis buffer and then subjected to SDS-PAGE and western blotting with indicated antibodies.
To perform coimmunoprecipitation in nTreg cells, cells were sorted (>99% purity) from Foxp3gfp mice and expanded in vitro for 6 days. Anti-CD3 and CD28 beads were then removed for 24 h. Treg cells were restimulated with plate-bound anti-CD3 and anti-CD28 antibodies for 15 h in the presence of IL-2 before being harvested for coimmunoprecipitation as described above.
Subcellular protein fractionation
CD4 Tn cells were seeded on day 0 in Treg induction conditions as previously described (Feng et al., 2015) and expanded onto uncoated plates from day 3. To stimulate iTreg cells with TCR agonists, cells were collected on day 6 and reseeded onto either uncoated (−TCR) or precoated 6-well plates with anti-CD3 and anti-CD28 antibodies (+TCR) at 14 × 106 cells per well in complete RPMI1640. To expedite the interaction between cells and immobilized antibodies, the plates were centrifuged at 500 g, 37°C for 5 min and then incubated at 37°C for 3 h. After stimulation, cells were collected from the plates. Subcellular protein fractionation was performed following the instructions in the Subcellular Protein Fractionation Kit for Cultured Cells (Thermo Fisher Scientific).
Immunoblotting
Immunoprecipitated samples and subcellular protein fractionation were mixed with 4 × LDS sample buffer (Invitrogen) supplemented with 25 mM dithiothreitol. Cell lysates or immunoprecipitated samples were heated at 95°C for 10 min and then separated by SDS-PAGE and blotted with indicated antibodies.
Silver staining
Silver staining was performed by using Silver Stain kits (Pierce) according to the manufacturer’s instructions.
ChIP-seq data analysis
Traditional and PSI ChIP-seq were analyzed with the same settings. Specifically, 50-bp single-end reads were mapped to mouse genome mm9 (MGSCv37 from Sanger) with BWA (version 0.7.12-r1039, default parameter) (Li and Durbin, 2009). Duplicate reads were identified by biobambam2 (version 2.0.87) (Tischler and Leonard, 2014), and non-duplicate reads were selected by SAMtools (parameter “-q 1 -F 1024,” version 1.2) (Li et al., 2009). ENCODE guideline was used to assess the quality of data, as previously described (Yang et al., 2019). We extended reads to the fragment size defined by SPP version 1.1 (Kharchenko et al., 2008) and generated bigwig tracks by normalizing 15 × 106 uniquely mapped reads for visualization. MACS2 was used to call peaks (version 2.1.1.20160309, parameters “--nomodel --extsize fragment size”; here, fragment size were estimated by SPP). To ensure reproducibility, we finalized the peaks called with a stringent cutoff value (FDR-adjusted P < 0.05 in MACS2) in one sample and a lower cutoff value (FDR-corrected P < 0.5 in MACS2) in other replicates. Peaks were further merged among replicates to create a reference peak set. We then extended reads to fragment size for each sample by using bedtools (version 2.24.0) (Quinlan and Hall, 2010) and counted the reads numbers overlapping the reference peak set. Correlation values indicate reproducibility among biological replicates.
CUT&RUN-seq and CUT&Tag-seq data analyses
Trim Galore (version 0.4.4) was used to trim 3′ reads raw reads with the cutadapt program. A quality score cutoff value of Q20 was used; 15 bp from 5′ was also trimmed to reduce Tn5 bias for CUT&Tag. Trimmed reads were mapped to the mm10 (Gencode GRCm38) reference genome by bwa (version 0.7.12-r1039) (Li and Durbin, 2009) and converted to a bam file (a binary version of sam file) by SAMtools (version 1.2) (Li et al., 2009); biobambam2 (version 2.0.87) (Tischler and Leonard, 2014) was used to mark duplicated reads. Non-duplicated reads were kept by SAMtools (parameter “-q 1 -F 1804,” version 1.2). All CUT&RUN samples have more than five million fragments, as suggested by the CUT&RUN-seq protocol (Meers et al., 2019). All CUT&Tag samples have more than 4 million fragments, as the CUT&Tag-seq protocol suggests using more than 3 million (Kaya-Okur et al., 2019). We generated bigwig files using the center 80 bp of fragments smaller than 2,000 bp and normalized to 10 million fragments. We confirmed the reproducibility among replicates. To identify differential binding sites, we first finalized reproducible peaks for each group by retaining a peak if it was called using a stringent cutoff value (FDR-corrected P < 0.05 in MACS2) in one sample and at least called using a lower cutoff value (FDR-corrected P < 0.5 in MACS2) in another sample. Next, we merged reproducible peaks between cell types to create the reference peak set and counted fragments (fragment size < 2,000 bp) overlapping with these merged reference peaks using bedtools (version 2.30.0) (Quinlan and Hall, 2010) for each sample. After TMM normalization (R 4.0.5, edgeR 3.32.1), Voom (Law et al., 2014) (from R package limma 3.46.0) was used to identify differentially binding sites. Finally, we generated heatmaps using deeptools2 (version 3.5.0) (Ramírez et al., 2016). Motif analyses were performed by using Homer (version 4.11) (Heinz et al., 2010). Foxp3 target genes were defined by Foxp3 peaks linked to the nearest genes.
ATAC-seq data analysis
First, 100 bp paired-end reads were obtained and trimmed by Trim Galore (version 0.4.4) by using the cutadapt program. Nextera adapters were trimmed and a quality score cutoff value of Q20 was used. To reduce Tn5 bias, 15 bp from 5′ was also trimmed. Trimmed reads were mapped to the mm10 (Gencode GRCm38) reference genome by bwa (version 0.7.12-r1039) (Li and Durbin, 2009) and converted to a bam file (a binary version of sam file) by SAMtools (version 1.2) (Li et al., 2009). Then, biobambam2 (version 2.0.87) (Tischler and Leonard, 2014) was used to mark duplicated reads and SAMtools retained non-duplicated reads (parameter “-q 1 -F 1804” version 1.2). After adjusting the Tn5 shift (reads were offset by +4 bp for the sense strand and −5 bp for the antisense strand), we separated reads into nucleosome-free, mononucleosome, dinucleosome, and trinucleosome categories as described (Buenrostro et al., 2013) and then generated bigwig files using the center 80 bp of fragments and scaled to 20 × 106 nucleosome-free reads. We examined nucleosome-free peaks and patterns of mono-, di-, tri-nucleosomes with IGV (version 2.4.13) (Robinson et al., 2011) and confirmed the expected pattern that nucleosome peaks surround nucleosome-free peaks. We also confirmed that all samples had more than 20 × 106 fragments smaller than 2 kb. Next, we merged two replicates to enhance the peak calling of nucleosome-free reads by MACS2 (version 2.1.1.20160309, default parameters with “--extsize 200 --nomodel”) (Zhang et al., 2008). To assess reproducibility, we first merged peaks from different cell types to create reference open-chromatin regions. We then used bedtools (version 2.30.0) (Quinlan and Hall, 2010) to count nucleosome-free reads from each sample to overlay with the reference regions. We considered their reproducibility acceptable if the Spearman correlation coefficient between replicates was larger than that between samples from different groups.
Motif extraction
To estimate motif abundance for Foxp3 peaks or ATAC-seq peaks, we scanned the motifs in TRANSFAC database (Matys et al., 2006) using FIMO (parameters “--motif-pseudo 0.0001 --thresh 1e-4”) from MEME suite (version 4.11.3) (Bailey et al., 2009). The highest values were recorded for transcription factors with multiple motifs in the database.
Comparison with ATAC-seq data and published ChIP-seq data
To compare our data with published ChIP-seq results (Kitagawa et al., 2017), we downloaded the data and used the same algorithms to process them. Heatmaps were generated by deepTools2 (version 3.5.0) (Ramírez et al., 2016).
Differential gene expression
To reveal the genes differentially expressed after cells received in vitro treatment, paired-end reads were mapped by STAR (version 2.5.2b) (Dobin et al., 2013) with the following parameters: “--outFilterMultimapNmax 20 --alignSJoverhangMin 8 --alignSJDBoverhangMin 1 --outFilterMismatchNmax 999 --alignIntronMin 20 --alignIntronMax 1000000 --alignMatesGapMax 1000000 --twopassMode Basic --outFilterScoreMinOverLread 0.33 --outFilterMatchNminOverLread 0.33.” Reads were counted by HTSEQ (0.6.1p1) (Anders et al., 2015) based on GENCODE annotation (version M14) (Harrow et al., 2012). Tn, Te, rTreg, and aTreg cells were sequenced by using a ribosomal RNA depletion protocol. These samples were mapped by STAR (2.3.0e_r291) with default parameters and counted by HTSEQ based on GENCODE (version M6). The third batch of data from spleen and lymph nodes was first trimmed by using Trim Galore (version 0.6.3, Babraham Bioinformatics) with parameters “--paired --retain_unpaired” and then mapped using STAR (version 2.7.9a) and counted by RSEM (version 1.3.1) on the Gencode annotation version 31. After TMM normalization (R 3.4.0, edgeR 3.18.1), Voom (Law et al., 2014) (from R package limma 3.34.9) was used to identify differentially expressed genes.
MS data analysis
Peptide identification and quantification were conducted by the St. Jude Children’s Research Hospital Center for Proteomics and Metabolomics. Specifically, the MS/MS raw files were processed by the tag-based hybrid search engine, JUMP, which showed better sensitivity and specificity than commercial packages (e.g., Proteome Discoverer) (Wang et al., 2014). The raw data were searched against the UniProt mouse database concatenated with a reversed decoy database to evaluate the false-discovery rate (Peng et al., 2003). Searches were performed using a 15-ppm mass tolerance for precursor and product ions, fully tryptic restriction with two maximal missed cleavages, three maximal modification sites, and the assignment of b and y ions. TMT tags on Lys and N-termini (+229.16293 Da) and carbamidomethyl modification of (+57.02146) on Cys were used for static modifications, and Met oxidation (+15.99492 Da) was considered to be a dynamic modification. Matched MS/MS spectra were filtered by mass accuracy and matching scores to reduce the protein false-discovery rate to ∼1%.
The peptide-spectrum matches (PSM) accepted after filtering were used for quantification. The peptide/protein quantification was performed as previously reported (Niu et al., 2017; Tan et al., 2017). Briefly, PSMs with low intensities (minimum intensity of 1,000 and median intensity of 5,000) were filtered. TMT reporter ion intensities of the accepted PSMs were extracted and processed to correct for isotopic impurities of the reporters and the loading bias across samples. The protein relative intensity was obtained by averaging mean-centered intensities of related PSMs. The absolute intensity of each protein was estimated by multiplying the relative intensity with the grand mean of the three most abundant PSMs. Differentially expressed proteins were identified as described previously (Bai et al., 2020) by using one-way ANOVA (analysis of variance) implemented in Limma, an R package (Ritchie et al., 2015).
To determine the relative enrichment of proteins identified by Foxp3 versus histone H3 PSI MS, we first performed linear regression to normalize the ion intensities of each sample to the median intensities of each TMT channel and then compared their ratios or FCs.
sgRNA library design and data analysis
A total of 10,936 sgRNAs targeting 1,548 genes including 1,493 Foxp3-PSI enriched proteins and positive and negative controls were designed for array-based oligonucleotide synthesis according to described algorithms (Zhang et al., 2019). The specificity of each sgRNA was verified by BLAST against the entire mouse genome. To assess the coverage of sgRNA library, the FASTQ data were demultiplexed and mapped to the reference sgRNA sequences. Enrichment of sgRNAs was determined by the difference of normalized counts between sorted Foxp3hi and Foxp3lo/−, CD25hi and CD25lo/−, or CTLA-4hi and CTLA-4lo/− cells. Normalized counts for each sgRNA were extracted and used to identify enriched sgRNAs by DESeq2 (Love et al., 2014). The combined enrichment score of seven sgRNAs for each gene was calculated with the MAGeCK algorithm (Li et al., 2014b).
Gene set enrichment analysis (GSEA)
For GSEA (Subramanian et al., 2005), gene sets were downloaded from MSigDB database (C2, version 6.0) (Liberzon et al., 2011) and the analysis was performed by the prerank mode of GSEA (version 3.0) on log2 FC.
Software resources
The codes for analysis are available at https://doi.org/10.6084/m9.figshare.7411835 or upon request.
Contact for reagent and resource sharing
Further information and requests for resources and reagents should be directed to and will be fulfilled by Yongqiang Feng ([email protected]).
Online supplemental material
Fig. S1 shows the cellular staining and CUT&RUN-seq results of Foxp3 and GFP antibodies. Fig. S2 shows the role of dynamic Foxp3–chromatin binding in regulating gene expression. Fig. S3 shows the functional annotation of proteins determined by Foxp3 PSI MS. Fig. S4 shows the dynamic proteins near Foxp3 induced by IL-2 and TCR signaling. Fig. S5 shows Foxp3–chromatin binding regulated by NFAT and AP-1 proteins. Table S1 lists differentiation gene expression and Foxp3 binding in aTreg and rTreg cells. Table S2 lists gene ontogeny terms of proteins enriched by Foxp3 versus histone H3 PSI MS. Table S3 lists DNA sequences of sgRNAs for 1,548 Foxp3 PSI-enriched proteins. Table S4 shows the CRISPR screening results for regulators of Foxp3, CD25, and CTLA4 expression in iTreg cells. Table S5 lists proteins whose abundance changed in Foxp3-PSI MS after IL-2 stimulation. Table S6 lists proteins whose abundance changed in Foxp3-PSI MS but not in whole-cell lysate after TCR stimulation. Table S7 lists proteins whose abundance changed in Foxp3-PSI MS and in whole-cell lysate after TCR stimulation. Table S8 lists key resources used in this study.
Data availability
Sequencing data are deposited at the Gene Expression Omnibus under the accession number GSE149674. The proteomics data are deposited at https://www.ebi.ac.uk/pride under accession number PXD019050.
Acknowledgments
We thank the Hartwell Center for high-throughput sequencing and Cherise Guess for editing the manuscript.
X. Zong was supported by an Academic Programs Office Special Postdoctoral Fellowship of St. Jude Children’s Research Hospital. This study was supported by the American Lebanese Syrian Associated Charities (St. Jude Children’s Research Hospital), National Institutes of Health grants R21 AI163942 (Y. Feng) and R01 AI153138 (Y. Feng), and National Cancer Institute cancer center support grant P30 CA021765 (St. Jude Children’s Research Hospital). The content is solely the responsibility of the authors and does not necessarily represent the official views of the National Institutes of Health.
Author contributions: M. He: Conceptualization, Data curation, Formal analysis, Investigation, Methodology, Project administration, Resources, Validation, Visualization, Writing—original draft, Writing—review & editing, X. Zong: Formal analysis, Investigation, Methodology, Visualization, Writing—original draft, B. Xu: Conceptualization, Data curation, Formal analysis, Resources, Software, Supervision, Visualization, Writing—review & editing, W. Qi: Data curation, Formal analysis, Software, Visualization, W. Huang: Investigation, Methodology, M.N. Djekidel: Formal analysis, Visualization, Y. Zhang: Formal analysis, Investigation, Software, Writing—review & editing, V.R. Pagala: Investigation, J. Li: Investigation, X. Hao: Data curation, Software, C. Guy: Investigation, L. Bai: Investigation, R. Cross: Investigation, C. Li: Methodology, Resources, J. Peng: Data curation, Funding acquisition, Methodology, Supervision, Writing—review & editing, and Y. Feng: Conceptualization, Data curation, Formal analysis, Funding acquisition, Investigation, Methodology, Project administration, Resources, Supervision, Validation, Visualization, Writing—original draft, Writing—review & editing.

