


Coordination of cellular metabolism is essential for optimal T cell responses. Here, we identify cytosolic acetyl-CoA production as an essential metabolic node for CD8 T cell function in vivo. We show that CD8 T cell responses to infection depend on acetyl-CoA derived from citrate via the enzyme ATP citrate lyase (ACLY). However, ablation of ACLY triggers an alternative, acetate-dependent pathway for acetyl-CoA production mediated by acyl-CoA synthetase short-chain family member 2 (ACSS2). Mechanistically, acetate fuels both the TCA cycle and cytosolic acetyl-CoA production, impacting T cell effector responses, acetate-dependent histone acetylation, and chromatin accessibility at effector gene loci. When ACLY is functional, ACSS2 is not required, suggesting acetate is not an obligate metabolic substrate for CD8 T cell function. However, loss of ACLY renders CD8 T cells dependent on acetate (via ACSS2) to maintain acetyl-CoA production and effector function. Together, ACLY and ACSS2 coordinate cytosolic acetyl-CoA production in CD8 T cells to maintain chromatin accessibility and T cell effector function.
Introduction
Metabolic reprogramming following T cell receptor (TCR) stimulation is a fundamental program underlying CD8 T cell function and differentiation (Buck et al., 2017; O’Neill et al., 2016; Pearce et al., 2013). The central hub for coordinating cellular metabolic activity is the mitochondrion, which supports cellular bioenergetics via oxidative phosphorylation (OXPHOS) and synthesis of biosynthetic intermediates via the tricarboxylic acid (TCA) cycle (Mehta et al., 2017; Steinert et al., 2021; DeBerardinis and Chandel, 2016). Coordination of mitochondrial metabolism is essential for optimal CD8 T cell effector (Teff) responses to infection and cancer (Klein Geltink et al., 2017, 2020; Bailis et al., 2019; O’Neill et al., 2016). Increasing mitochondrial activity is critical for naïve T cells to undergo activation and differentiate into effector lineages (Sena et al., 2013; Tan et al., 2017; Tarasenko et al., 2017; Bailis et al., 2019). Failure to maintain mitochondrial fitness is associated with CD8 T cell dysfunction (Bengsch et al., 2016; Scharping et al., 2016; Vardhana et al., 2020) and decreased memory (Tmem) cell formation (van der Windt et al., 2012; Buck et al., 2016), which may underlie deficiencies in CD8 T cell function associated with chronic viral infection and cancer (Roy et al., 2021). Recent work has shown considerable flexibility in T cell metabolism, with CD8 T cells capable of oxidizing a diverse set of physiologic fuels (i.e., glucose, lactate, β-hydroxybutyrate [βOHB]) in the immune microenvironment (Kaymak et al., 2022). Therefore, successful metabolic programming in T cells depends on both substrate availability and expression of enzymes responsible for fuel transport and utilization. Despite this, the metabolic pathways in mitochondria critical for fueling CD8 Teff cell responses remain poorly defined.
Using genetic screening and metabolic tracing, we asked which metabolic functions of mitochondria are critical for CD8 T cell–mediated adaptive immune responses. Here, we identify the regulation of cytosolic acetyl-CoA production as an essential metabolic node for CD8 Teff function. ATP citrate lyase (ACLY), which converts citrate into oxaloacetate and acetyl-CoA in the cytosol (Wellen et al., 2009), and acyl-CoA synthetase short-chain family member 2 (ACSS2), which generates acetyl-CoA from acetate (Comerford et al., 2014; Mashimo et al., 2014), together coordinate cytosolic acetyl-CoA production from mitochondrial substrates and acetate, respectively, to promote cellular bioenergetics and chromatin accessibility needed for functional CD8 Teff responses.
Results
Mitochondrial citrate production is essential for effector CD8 T cell responses in vivo
To identify control points of the TCA cycle required for CD8 T cell responses to viral infection, we utilized an in vivo shRNA screening approach using P14 T cells (expressing a TCR transgene specific for the lymphocytic choriomeningitis virus [LCMV] peptide epitope GP33–41) and LCMV infection (Pircher et al., 1989). Naïve Thy1.1+ P14 CD8 T cells were transduced with a metabolism-targeted lentiviral shRNA library, followed by adoptive transfer into naïve C57BL/6 mice and challenge with the LCMV Armstrong (Arm) strain. LCMV-specific T cells were isolated from a primary response (7 days post infection [dpi] with LCMV Arm) or secondary response (5 dpi of LCMV immune mice rechallenged with LCMV Clone 13 [cl-13]) to assess the involvement of various metabolic genes (18 genes, 80 shRNAs) (Fig. 1 A). LCMV cl-13 was used for memory recall experiments as neutralizing antibodies generated in response to LCMV Arm infection could not neutralize LCMV cl-13. As validation of the model, shRNAs targeting negative regulators of CD8 T cell function (i.e., Pdcd1, Ppp2r2d, and Cblb) (Ahn et al., 2018; Zhou et al., 2014) were enriched in LCMV-responding CD8 T cells, while control shRNAs targeting regulators of proximal TCR signaling and CTL differentiation (i.e., Zap70 and Eomes) were depleted (Fig. 1 B and Table S1). We observed depletion of barcodes corresponding to shRNAs targeting TCA cycle dehydrogenases (i.e., Idh1, Idh2, Mdh1, Mdh2, and Ogdh) (Fig. 1 B). However, the most depleted shRNAs for both primary and secondary T cell responses included genes involved in citrate metabolism—citrate synthase (Cs)—and the mitochondrial pyruvate carriers (Mpc1 and Mpc2) (Fig. 1 B). MPC1/2 and CS coordinate the synthesis of mitochondrial citrate from cytosolic pyruvate. Connected to mitochondrial citrate metabolism are the mitochondrial citrate transporter (SLC25A1) and ACLY, which together regulate a non-canonical TCA cycle that generates cytosolic acetyl-CoA from mitochondria-derived citrate (Fig. 1 C). A switch from conventional to non-canonical TCA cycle metabolism has recently been shown to underlie the transition between naïve and differentiated cell states (Arnold et al., 2022); yet the role of this pathway in immune cell function is unknown.

Mitochondrial citrate production defines effector CD8 T cells. (A) Schematic of in vivo LCMV screen. Naïve Thy1.1+ P14 CD8 T cells were transduced with a metabolic-targeting lentiviral shRNA library and transferred into naïve Thy1.2+ hosts followed by LCMV Arm infection. Thy1.1+ cells were sorted from the spleen 7 dpi (1° response) or 5 days after rechallenge with LCMV cl-13 on day 30 (2° response). shRNA barcode enrichment in naïve, 1°, or 2° P14 T cells was determined from genomic DNA by next-generation sequencing (NGS). (B) In vivo genomic screen of TCA cycle enzymes involved in Teff cell responses to LCMV infection. The plot shows the enrichment of shRNAs (log2 ratio of shRNA/control) in P14 cells isolated from primary (LCMV Arm) and secondary (LCMV cl-13) response screens. Positive (+) and negative (−) controls are indicated (n = 4–5 mice). (C) Schematic of TCA cycle metabolites and enzymes. Biochemical reactions in the cytosol (cyto) and mitochondrion (mito) are indicated. (D) scRNAseq of CD8 T cells isolated from LCMV Arm–infected mice at 8 dpi. Left: t-SNE plot identifying major CD8 T cell populations. Right: Density (top) and violin (bottom) plots for Cs and Acly expression in CD8 T cell subpopulations. A Kruskal–Wallis test followed by a pairwise Wilcox comparison was used to calculate Bonferroni adjusted P values. (E) Density plot for combined expression of non-canonical TCA cycle genes (Mpc1/2, Cs, Slc25a1, Acly) in CD8 T cells isolated from LCMV Arm–infected mice at 8 dpi.
Mitochondrial citrate production defines effector CD8 T cells. (A) Schematic of in vivo LCMV screen. Naïve Thy1.1+ P14 CD8 T cells were transduced with a metabolic-targeting lentiviral shRNA library and transferred into naïve Thy1.2+ hosts followed by LCMV Arm infection. Thy1.1+ cells were sorted from the spleen 7 dpi (1° response) or 5 days after rechallenge with LCMV cl-13 on day 30 (2° response). shRNA barcode enrichment in naïve, 1°, or 2° P14 T cells was determined from genomic DNA by next-generation sequencing (NGS). (B) In vivo genomic screen of TCA cycle enzymes involved in Teff cell responses to LCMV infection. The plot shows the enrichment of shRNAs (log2 ratio of shRNA/control) in P14 cells isolated from primary (LCMV Arm) and secondary (LCMV cl-13) response screens. Positive (+) and negative (−) controls are indicated (n = 4–5 mice). (C) Schematic of TCA cycle metabolites and enzymes. Biochemical reactions in the cytosol (cyto) and mitochondrion (mito) are indicated. (D) scRNAseq of CD8 T cells isolated from LCMV Arm–infected mice at 8 dpi. Left: t-SNE plot identifying major CD8 T cell populations. Right: Density (top) and violin (bottom) plots for Cs and Acly expression in CD8 T cell subpopulations. A Kruskal–Wallis test followed by a pairwise Wilcox comparison was used to calculate Bonferroni adjusted P values. (E) Density plot for combined expression of non-canonical TCA cycle genes (Mpc1/2, Cs, Slc25a1, Acly) in CD8 T cells isolated from LCMV Arm–infected mice at 8 dpi.
To further characterize the dynamics of this metabolic network, we used single-cell RNA sequencing (scRNAseq) to assess the expression of citrate metabolism genes in CD8 T cell subsets responding to LCMV Arm challenge (Fig. 1 D and Fig. S1 A). Consistent with previous reports (Yao et al., 2019; Daniel et al., 2022; Giles et al., 2022), CD8 T cells at 8 dpi clustered into seven major subsets, including five distinct Cd44hi subpopulations that we classified as Teff (Cx3cr1hi), effector memory (EM; Id2hiIl2rahi), central memory (Il7rhi), a distinct effector cell population with early features of T cell exhaustion (Daniel et al., 2022), and a small number of putative T exhausted cells expressing Tox (Fig. 1 D, Fig. S1 A, and Table S2). Mpc1 was universally expressed across CD8 T cell populations (Fig. S1 B), while Cs and Acly levels were elevated primarily in activated (Cd44hi) Teff cells (Fig. 1 D). A gene set for mitochondrial citrate production and export (i.e., Mpc1/2, Cs, Slc25a1, and Acly) was strongly enriched in the highly functional (Cx3cr1hiGzmbhiIfnghi) Teff cell cluster (Fig. 1 E and Fig. S1, C and D). While conventional TCA cycling is active in activated T cells (Wang et al., 2011; Blagih et al., 2015; Chang et al., 2013), these data suggest that non-canonical TCA cycle metabolism is a metabolic feature of highly functional CD8 Teff cells in vivo. Indeed, using previously published datasets (Pauken et al., 2016; Man et al., 2017; Philip et al., 2017), we found Teff cells to have enriched expression of Cs, Acly, and Mpc2 over naïve CD8 T cells, while memory CD8 T cells highly expressed Slc25a1 and Mpc1/2 (Fig. S1 E). These data are consistent with our shRNA screen (Fig. 1 B) and further support that mitochondrial citrate production and export are a feature of CD8 Teff cells and that this feature is partially maintained in memory CD8 T cells (Fig. S1 E).

scRNAseq analysis of CD8 T cells from LCMV Arm infection . Related to Fig. 1. scRNAseq analysis of CD8 T cells isolated from LCMV Arm–infected mice at 8 dpi. (A) t-SNE plot identifying major CD8 T cell populations in the spleen of infected mice. (B) Density (top) and violin (bottom) plots for Mpc1, Cd44, and Cx3cr1 in the indicated CD8 T cell subpopulations. Indicated numbers are Bonferroni-adjusted P values. (C and D)Gzmb, IFN-γ, Il2ra (C) and Id2 and Il7r (D) expression in the indicated CD8 T cell subpopulations. (E) Heat map of the relative expression of mitochondrial citrate production and export genes across naïve, effector, and memory CD8 T cell subsets isolated from LCMV Arm–infected mice, mined from previously published RNAseq datasets (Pauken et al., 2016; Man et al., 2017; Philip et al., 2017). A Kruskal–Wallis test followed by a pairwise Wilcox comparison was used to calculate Bonferroni adjusted P values (B–D).
scRNAseq analysis of CD8 T cells from LCMV Arm infection . Related to Fig. 1. scRNAseq analysis of CD8 T cells isolated from LCMV Arm–infected mice at 8 dpi. (A) t-SNE plot identifying major CD8 T cell populations in the spleen of infected mice. (B) Density (top) and violin (bottom) plots for Mpc1, Cd44, and Cx3cr1 in the indicated CD8 T cell subpopulations. Indicated numbers are Bonferroni-adjusted P values. (C and D)Gzmb, IFN-γ, Il2ra (C) and Id2 and Il7r (D) expression in the indicated CD8 T cell subpopulations. (E) Heat map of the relative expression of mitochondrial citrate production and export genes across naïve, effector, and memory CD8 T cell subsets isolated from LCMV Arm–infected mice, mined from previously published RNAseq datasets (Pauken et al., 2016; Man et al., 2017; Philip et al., 2017). A Kruskal–Wallis test followed by a pairwise Wilcox comparison was used to calculate Bonferroni adjusted P values (B–D).
To assess the functional role of mitochondrial citrate production and export for CD8 T cell responses, we generated mice with conditional deletion of Acly in the T cell lineage (Cd4CreAclyfl/fl) (validation in Fig. 2 A, inset). Acly-deficient CD8 T cells displayed reduced proliferative expansion in vitro following stimulation with activating anti-CD3 and anti-CD28 antibodies (Fig. S2 A). Next, we challenged T cell Acly-deficient (designated as Acly KO) and control (designated as WT) mice with Listeria monocytogenes–expressing ovalbumin (LmOVA), which induces robust expansion of cytolytic CD8 Teff cells in vivo (Badovinac et al., 2002). Analysis of circulating OVA-specific CD8 T cells over time revealed a >50% reduction in T cell expansion in Acly KO mice compared with controls at the peak of infection (7 dpi), followed by reduced CD8 T cell numbers over the course of contraction (Fig. 2 A). We observed a dramatic (>80%) reduction in the number of antigen-specific (OVA-Tet+) CD8 T cells in the spleen of Acly KO mice compared with control animals at 7 dpi (Fig. 2, B and C). Further, ex vivo stimulation of splenocytes from LmOVA-infected mice revealed lower numbers of IFN-γ (Fig. 2, D and E), granzyme B (Fig. 2 F and Fig. S2 B), and TNF-α–producing and polyfunctional (IFN-γ+TNF-α+) (Fig. S2, C and D) Acly KO CD8 T cells consistent with decreased activation (i.e., decreased CD44 expression) upon LmOVA challenge (Fig. S2 B).
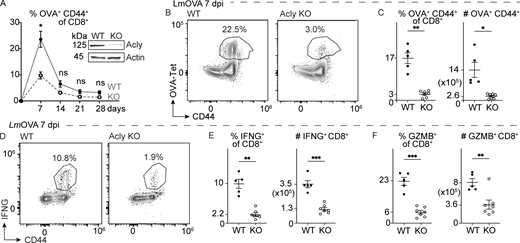
ACLY is essential for effector CD8 T cell responses. (A) Percentage of OVA-specific (Tet+) CD8 T cells in the blood of LmOVA-infected control (WT) or T cell Acly-deficient (KO) mice over time (up to 28 dpi). Data shown are mean ± SEM (five mice/group). Inset: Immunoblot of ACLY and actin protein levels in whole cell lysates from in vitro–activated control (WT) or Acly-deficient (KO) CD8 T cells. (B–F) Expansion and effector function of antigen-specific CD8 T cells isolated from the spleen of LmOVA-infected control (WT) and Acly-deficient (KO) mice at 7 dpi (n = 5–7/group). (B) Representative flow cytometry plots of CD44 versus OVA-Tet expression. (C) Percentage and total number of OVA-Tet+ T cells in the spleen at 7 dpi. (D) Representative flow cytometry plots of CD44 versus IFN-γ expression in CD8 T cells at 7 dpi. (E and F) Percentage and total number of IFN-γ+ (E) and GZMB+ (F) CD8 T cells in the spleen of infected mice at 7 dpi. All results are representative of two or more independent experiments. Data are shown as mean ± SEM. *P < 0.05; **P < 0.01; ***P < 0.001 by unpaired two-tailed t test (A, C, E, and F). Source data are available for this figure: SourceData F2.
ACLY is essential for effector CD8 T cell responses. (A) Percentage of OVA-specific (Tet+) CD8 T cells in the blood of LmOVA-infected control (WT) or T cell Acly-deficient (KO) mice over time (up to 28 dpi). Data shown are mean ± SEM (five mice/group). Inset: Immunoblot of ACLY and actin protein levels in whole cell lysates from in vitro–activated control (WT) or Acly-deficient (KO) CD8 T cells. (B–F) Expansion and effector function of antigen-specific CD8 T cells isolated from the spleen of LmOVA-infected control (WT) and Acly-deficient (KO) mice at 7 dpi (n = 5–7/group). (B) Representative flow cytometry plots of CD44 versus OVA-Tet expression. (C) Percentage and total number of OVA-Tet+ T cells in the spleen at 7 dpi. (D) Representative flow cytometry plots of CD44 versus IFN-γ expression in CD8 T cells at 7 dpi. (E and F) Percentage and total number of IFN-γ+ (E) and GZMB+ (F) CD8 T cells in the spleen of infected mice at 7 dpi. All results are representative of two or more independent experiments. Data are shown as mean ± SEM. *P < 0.05; **P < 0.01; ***P < 0.001 by unpaired two-tailed t test (A, C, E, and F). Source data are available for this figure: SourceData F2.

Expansion and cytokine production of WT and Acly-deficient CD8 T cells. Related to Fig. 2. (A) Cell numbers of activated WT (solid line) and Acly KO (dashed line) CD8 T cells cultured in IMDM (n = 3/group). (B–D) Effector function of antigen-specific CD8 T cells isolated from the spleen of LmOVA-infected control (WT) and Acly-deficient (KO) mice 7 dpi (n = 5–7/group). (B) Shown are representative flow cytometry plots of CD44 versus granzyme B (GZMB) expression in CD8 T cells, and tabulation of percent CD44+GZMB+ CD8 T cells in the spleen at 7 dpi. (C) Representative flow cytometry plots for IFN-γ versus TNF-α expression in CD8 T cells from the spleen of LmOVA-infected control (WT) and Acly-deficient (KO) mice at 7 dpi (mean ± SD, n = 5–7). (D) Percentage and total number of polyfunctional (IFN-γ+TNF-α+) CD8 T cells in the spleen of LmOVA-infected mice at 7 dpi. (E) Schematic of adoptive transfer model for CRISPR/Cas9-modifed P14 T cells followed by LCMV Arm infection. (F) Percentage (left) and total number (right) of control (sgCtrl) or Acly-deleted (sgAcly) CD8 P14 T cells isolated from the spleen of LCMV Arm–infected mice 7 dpi (n = 4/group). (G and H) Cellular phenotype and effector function of control (sgCtrl) or Acly-deleted (sgAcly) CD8 P14 T cells isolated from the spleen of LCMV Arm–infected mice 7 dpi (n = 4/group). (G) Percentage (left) and number (right) of KLRG1+ SLECs and CD127+ MPECs in spleens from LCMV-infected mice. (H) Percentage (left) and number (right) of IFNγ+, TNFα+, and IFNγ+TNFα+ P14 T cells in the spleen at 7 dpi. (I and J) Cellular phenotype and effector function of control (sgCtrl) or Acly-deleted (sgAcly) CD8 P14 T cells isolated from the spleen of LCMV Arm–infected mice 20 dpi (n = 4/group). (I) Percentage (left) and number (right) of SLECs (KLRG+) and MPECs (CD127+) in spleens from LCMV-infected mice. (J) Percentage (left) and number (right) of IFNγ+, TNFα+, and IFNγ+TNFα+ P14 T cells in the spleen at 20 dpi. All results are representative of two or more independent experiments. Data are shown as mean ± SEM. *P < 0.05; **P < 0.01; ***P < 0.001; ****P < 0.0001 by unpaired two-tailed t test (A, B, D, and F–J).
Expansion and cytokine production of WT and Acly-deficient CD8 T cells. Related to Fig. 2. (A) Cell numbers of activated WT (solid line) and Acly KO (dashed line) CD8 T cells cultured in IMDM (n = 3/group). (B–D) Effector function of antigen-specific CD8 T cells isolated from the spleen of LmOVA-infected control (WT) and Acly-deficient (KO) mice 7 dpi (n = 5–7/group). (B) Shown are representative flow cytometry plots of CD44 versus granzyme B (GZMB) expression in CD8 T cells, and tabulation of percent CD44+GZMB+ CD8 T cells in the spleen at 7 dpi. (C) Representative flow cytometry plots for IFN-γ versus TNF-α expression in CD8 T cells from the spleen of LmOVA-infected control (WT) and Acly-deficient (KO) mice at 7 dpi (mean ± SD, n = 5–7). (D) Percentage and total number of polyfunctional (IFN-γ+TNF-α+) CD8 T cells in the spleen of LmOVA-infected mice at 7 dpi. (E) Schematic of adoptive transfer model for CRISPR/Cas9-modifed P14 T cells followed by LCMV Arm infection. (F) Percentage (left) and total number (right) of control (sgCtrl) or Acly-deleted (sgAcly) CD8 P14 T cells isolated from the spleen of LCMV Arm–infected mice 7 dpi (n = 4/group). (G and H) Cellular phenotype and effector function of control (sgCtrl) or Acly-deleted (sgAcly) CD8 P14 T cells isolated from the spleen of LCMV Arm–infected mice 7 dpi (n = 4/group). (G) Percentage (left) and number (right) of KLRG1+ SLECs and CD127+ MPECs in spleens from LCMV-infected mice. (H) Percentage (left) and number (right) of IFNγ+, TNFα+, and IFNγ+TNFα+ P14 T cells in the spleen at 7 dpi. (I and J) Cellular phenotype and effector function of control (sgCtrl) or Acly-deleted (sgAcly) CD8 P14 T cells isolated from the spleen of LCMV Arm–infected mice 20 dpi (n = 4/group). (I) Percentage (left) and number (right) of SLECs (KLRG+) and MPECs (CD127+) in spleens from LCMV-infected mice. (J) Percentage (left) and number (right) of IFNγ+, TNFα+, and IFNγ+TNFα+ P14 T cells in the spleen at 20 dpi. All results are representative of two or more independent experiments. Data are shown as mean ± SEM. *P < 0.05; **P < 0.01; ***P < 0.001; ****P < 0.0001 by unpaired two-tailed t test (A, B, D, and F–J).
In parallel, we disrupted Acly expression in CD8 P14 T cells via CRISPR-mediated gene editing prior to adoptive transfer into naïve hosts and subsequent challenge with LCMV Arm (Fig. S2 E). Acute deletion of Acly resulted in a >90% reduction in the number of LCMV-specific CD8 T cells at the peak of infection (7 dpi) that remained low 3 wk after infection (Fig. S2 F). At 7 dpi, ACLY-deficient CD8 P14 T cells displayed reduced effector function, marked by reduced numbers of KLRG1+ and IFN-γ– and TNF-α–producing CD8 T cells (Fig. S2, G and H). This reduced effector function of ACLY-deficient CD8 P14 T cells persisted up to 3 wk after infection (Fig. S2, I and J). Collectively, these findings indicate that CD8 T cells require ACLY to generate robust effector T cell responses to pathogen infection in vivo.
ACLY regulates CD8 T cell metabolic capacity and acetyl-CoA production
To identify the mechanisms underlying the T cell–intrinsic defects caused by ACLY deficiency, we crossed Cd4CreAclyfl/fl mice to the OT-I TCR transgenic background. WT and Acly KO OT-I T cells were adoptively transferred into naïve Ly5.1+ hosts (5e4 cells/mouse), followed by infection with LmOVA and analysis of CD8 T cell expansion and function 7 days later. Similar to ACLY-deficient CD8 P14 T cells (Fig. S2, E–J), we observed reduced expansion (Fig. S3, A and B) and IFN-γ production (Fig. S3 C) by Acly KO OT-I T cells responding to LmOVA in vivo compared with WT controls. Transcriptional profiling of sorted LmOVA-specific Teff cells at 7 dpi by RNA sequencing (RNAseq) revealed that OXPHOS and fatty acid metabolism pathways were among the most significantly downregulated in ACLY-deficient cells (Fig. 3 A and Fig. S3 D; and Table S3). Indeed, blocking ACLY activity (using the ACLY inhibitor [ACLYi] BMS-303141, 10 μM) in LmOVA-specific OT-I Teff cells (6 dpi) ex vivo reduced rates of both oxygen consumption and glycolysis (Fig. S3, E and F), resulting in a ∼30% reduction in overall ATP production capacity (Fig. 3 B). Further, ACLYi treatment effectively collapsed CD8 Teff cell spare respiratory capacity (SRC) (Fig. 3 C), indicating that mitochondrial respiration is dependent on ACLY. Consistent with the effects of ACLYi on CD8 Teff cell metabolism, we observed reduced expression of OXPHOS genes in ACLY-deficient Teff cells responding to LmOVA infection (Fig. 3 D). Combined, these experiments indicate that ACLY activity is required to maintain Teff cellular bioenergetics during pathogen responses.

Metabolic characterization of Acly-deficient CD8 T cells. Related to Figs. 3 and 4. (A) Flow cytometry plots of CD45.2 versus forward scatter (FSC-A) to monitor the expansion of transferred OT-I CD8 T cells (Acly KO, knockout) in CD45.1 hosts following LmOVA-infection (6 dpi). (B) Percentage of CD45.2+ T cells in spleens of LmOVA-infected mice (6 dpi) that received WT or Acly KO CD45.2+ OT-I CD8 T cells (n = 4/group). (C) Percentage of IFN-γ+ OT-I CD8 T cells from the experiment described in panel B. (D) Pathway analysis of the top 10 KEGG pathways upregulated in Acly-deficient (KO) OT-I CD8 T cells (relative to controls) from LmOVA-infected mice (6 dpi). Combined score accounts for LogFC and P value) for top differentially regulated genes. (E and F) Basal and maximal ATP production rates from (E) OXPHOS or (F) glycolysis for OT-I CD8 T cells treated with vehicle control (Ctrl) or ACLY inhibitor (ACLYi). (G) Fractional enrichment (%) of [U-13C]glucose-derived mass isotopologues of intracellular citrate (Cit, M+0–6), fumarate (Fum, M+0–4), and malate (Mal, M+0–4) for in vitro-activated control (WT) or Acly-deficient (KO) CD8 T cells (n = 3/group). (H) Fractional enrichment (%) of [U-13C]glutamine-derived mass isotopologues of intracellular glutamate (Glu, M+0–5), citrate (Cit, M+0–6), and malate (Mal, M+0–4) for in vitro–activated control (WT) or Acly-deficient (KO) CD8 T cells (n = 3/group). (I) Fractional enrichment of U-[13C6]glucose versus U-[13C2]acetate labeling into citrate for OT-I cells isolated from LmOVA-infected mice at 6 dpi. LmOVA-specific OT-I T cells were cultured ex vivo with U-[13C6]glucose at two different concentrations (5 and 25 mM, light and dark gray) versus U-[13C2]acetate (0.4 and 1 mM, light and dark blue) for 4 h prior to analysis (n = 3/group). Shown is the overall enrichment of 13C carbon from glucose or acetate into the citrate pool. (J) MID of U-[13C6]glucose versus U-[13C2]acetate labeling into citrate, malate, and aspartate in OT-I cells isolated from LmOVA-infected mice at 6 dpi. Cells were isolated from LmOVA-infected mice and cultured ex vivo in medium containing 5 mM U-[13C6]glucose and 1 mM [12C]acetate (light gray) or 5 mM [12C]glucose and 1 mM U-[13C2]-acetate (dark blue) for 4 h prior to analysis (n = 3/group). (K) Representative flow cytometry plots of CD44 expression versus OVA-Tet binding by CD8 T cells isolated from the spleens of LmOVA-infected WT or KO mice at 7 dpi. Mice administered acetate (+) or vehicle control (−) by oral gavage are indicated. All results are representative of two or more independent experiments. Data are shown as mean ± SEM. *P < 0.05; **P < 0.01; ***P < 0.001; ****P < 0.0001 by unpaired two-tailed t test (B, E, F, and I) or two-way ANOVA with Sidak’s multiple comparison test (G, H, and J).
Metabolic characterization of Acly-deficient CD8 T cells. Related to Figs. 3 and 4. (A) Flow cytometry plots of CD45.2 versus forward scatter (FSC-A) to monitor the expansion of transferred OT-I CD8 T cells (Acly KO, knockout) in CD45.1 hosts following LmOVA-infection (6 dpi). (B) Percentage of CD45.2+ T cells in spleens of LmOVA-infected mice (6 dpi) that received WT or Acly KO CD45.2+ OT-I CD8 T cells (n = 4/group). (C) Percentage of IFN-γ+ OT-I CD8 T cells from the experiment described in panel B. (D) Pathway analysis of the top 10 KEGG pathways upregulated in Acly-deficient (KO) OT-I CD8 T cells (relative to controls) from LmOVA-infected mice (6 dpi). Combined score accounts for LogFC and P value) for top differentially regulated genes. (E and F) Basal and maximal ATP production rates from (E) OXPHOS or (F) glycolysis for OT-I CD8 T cells treated with vehicle control (Ctrl) or ACLY inhibitor (ACLYi). (G) Fractional enrichment (%) of [U-13C]glucose-derived mass isotopologues of intracellular citrate (Cit, M+0–6), fumarate (Fum, M+0–4), and malate (Mal, M+0–4) for in vitro-activated control (WT) or Acly-deficient (KO) CD8 T cells (n = 3/group). (H) Fractional enrichment (%) of [U-13C]glutamine-derived mass isotopologues of intracellular glutamate (Glu, M+0–5), citrate (Cit, M+0–6), and malate (Mal, M+0–4) for in vitro–activated control (WT) or Acly-deficient (KO) CD8 T cells (n = 3/group). (I) Fractional enrichment of U-[13C6]glucose versus U-[13C2]acetate labeling into citrate for OT-I cells isolated from LmOVA-infected mice at 6 dpi. LmOVA-specific OT-I T cells were cultured ex vivo with U-[13C6]glucose at two different concentrations (5 and 25 mM, light and dark gray) versus U-[13C2]acetate (0.4 and 1 mM, light and dark blue) for 4 h prior to analysis (n = 3/group). Shown is the overall enrichment of 13C carbon from glucose or acetate into the citrate pool. (J) MID of U-[13C6]glucose versus U-[13C2]acetate labeling into citrate, malate, and aspartate in OT-I cells isolated from LmOVA-infected mice at 6 dpi. Cells were isolated from LmOVA-infected mice and cultured ex vivo in medium containing 5 mM U-[13C6]glucose and 1 mM [12C]acetate (light gray) or 5 mM [12C]glucose and 1 mM U-[13C2]-acetate (dark blue) for 4 h prior to analysis (n = 3/group). (K) Representative flow cytometry plots of CD44 expression versus OVA-Tet binding by CD8 T cells isolated from the spleens of LmOVA-infected WT or KO mice at 7 dpi. Mice administered acetate (+) or vehicle control (−) by oral gavage are indicated. All results are representative of two or more independent experiments. Data are shown as mean ± SEM. *P < 0.05; **P < 0.01; ***P < 0.001; ****P < 0.0001 by unpaired two-tailed t test (B, E, F, and I) or two-way ANOVA with Sidak’s multiple comparison test (G, H, and J).

ACLY regulates CD8 T cell metabolic capacity and acetyl-CoA production. (A) List of the top 10 KEGG pathways downregulated in Acly-deficient (KO) OT-I CD8 T cells (relative to controls) from LmOVA-infected mice (6 dpi, n = 3–4/group). The combined score accounts for LogFC and P-value for top differentially regulated genes. (B and C) Bioenergetic analysis of OT-I CD8 T cells isolated from LmOVA-infected mice at 6 dpi. T cells were treated either with ACLY inhibitor (ACLYi, BMS-303141 10 μM) or solvent control (Ctrl) for 2 h prior to analysis via Seahorse assay (n = 15–20). (B) Total ATP production rates from glycolysis (gly) and OXPHOS for control or ACLYi-treated T cells. (C) SRC was calculated as the percent increase of uncoupled (FCCP) respiration above baseline. (D) Heatmap depicting expression of OXPHOS genes in control (WT) and Acly-deficient (KO) OT-I CD8 T cells isolated from LmOVA-infected mice at 6 dpi (n = 3/group). Red = comparatively high expression, Blue = comparatively low expression. (E–I) CD8 T cells were activated in vitro for 72 h and then cultured with [U-13C6]glucose for 2 h (n = 3/group). (E) Abundance of [U-13C6]glucose-derived mass isotopologues of intracellular citrate (Cit), fumarate (Fum), and malate (Mal) for activated control (WT) or Acly-deficient (KO) CD8 T cells. Shown are relative peak intensities for each isotopologue for the indicated TCA cycle metabolites. (F) Ratio of M+2 malate to M+2 citrate relative peak intensities for control (WT) or Acly-deficient (KO) CD8 T cells. (G) Fractional enrichment (%) of [U-13C6]glucose labeling into acetyl-CoA (Ac-CoA M+2) in in vitro–activated control (WT) or Acly-deficient (KO) CD8 T cells (n = 3/group). (H) Total relative abundance of acetyl-CoA in CD8 T cells as in G (n = 3/group). Cells were cultured under physiologic conditions (VIM-PCS). (I) Fractional enrichment (%) of [U-13C6]glucose labeling into acetyl groups (M+2) of acetyl-carnitine, acetyl-spermidine, and acetyl-glutamate in control (WT) or Acly-deficient (KO) CD8 T cells (n = 3/group). (J) Histogram of H3K27Ac levels 48 h after activation in vitro in WT (closed) and ACLY KO (open) CD8 T cells as determined by intracellular staining and flow cytometry. All results are representative of two or more independent experiments. Data are shown as mean ± SEM. *P < 0.05; **P < 0.01; ***P < 0.001; ****P < 0.0001 by unpaired two-tailed t test (B, C, and E–I).
ACLY regulates CD8 T cell metabolic capacity and acetyl-CoA production. (A) List of the top 10 KEGG pathways downregulated in Acly-deficient (KO) OT-I CD8 T cells (relative to controls) from LmOVA-infected mice (6 dpi, n = 3–4/group). The combined score accounts for LogFC and P-value for top differentially regulated genes. (B and C) Bioenergetic analysis of OT-I CD8 T cells isolated from LmOVA-infected mice at 6 dpi. T cells were treated either with ACLY inhibitor (ACLYi, BMS-303141 10 μM) or solvent control (Ctrl) for 2 h prior to analysis via Seahorse assay (n = 15–20). (B) Total ATP production rates from glycolysis (gly) and OXPHOS for control or ACLYi-treated T cells. (C) SRC was calculated as the percent increase of uncoupled (FCCP) respiration above baseline. (D) Heatmap depicting expression of OXPHOS genes in control (WT) and Acly-deficient (KO) OT-I CD8 T cells isolated from LmOVA-infected mice at 6 dpi (n = 3/group). Red = comparatively high expression, Blue = comparatively low expression. (E–I) CD8 T cells were activated in vitro for 72 h and then cultured with [U-13C6]glucose for 2 h (n = 3/group). (E) Abundance of [U-13C6]glucose-derived mass isotopologues of intracellular citrate (Cit), fumarate (Fum), and malate (Mal) for activated control (WT) or Acly-deficient (KO) CD8 T cells. Shown are relative peak intensities for each isotopologue for the indicated TCA cycle metabolites. (F) Ratio of M+2 malate to M+2 citrate relative peak intensities for control (WT) or Acly-deficient (KO) CD8 T cells. (G) Fractional enrichment (%) of [U-13C6]glucose labeling into acetyl-CoA (Ac-CoA M+2) in in vitro–activated control (WT) or Acly-deficient (KO) CD8 T cells (n = 3/group). (H) Total relative abundance of acetyl-CoA in CD8 T cells as in G (n = 3/group). Cells were cultured under physiologic conditions (VIM-PCS). (I) Fractional enrichment (%) of [U-13C6]glucose labeling into acetyl groups (M+2) of acetyl-carnitine, acetyl-spermidine, and acetyl-glutamate in control (WT) or Acly-deficient (KO) CD8 T cells (n = 3/group). (J) Histogram of H3K27Ac levels 48 h after activation in vitro in WT (closed) and ACLY KO (open) CD8 T cells as determined by intracellular staining and flow cytometry. All results are representative of two or more independent experiments. Data are shown as mean ± SEM. *P < 0.05; **P < 0.01; ***P < 0.001; ****P < 0.0001 by unpaired two-tailed t test (B, C, and E–I).
Glucose utilization by the TCA cycle can be monitored by tracing using [U-13C6]glucose, which generates M+2 or M+3 labeled citrate following the processing of glucose-derived pyruvate by pyruvate dehydrogenase or pyruvate carboxylase enzymes, respectively (Vander Heiden and DeBerardinis, 2017). Processing of citrate carbon by aconitase retains glucose carbon within the TCA cycle, yielding downstream M+2 or M+3 labeled TCA cycle metabolites (i.e., fumarate, malate). Alternatively, SLC25A1 and ACLY function to promote the export and processing of mitochondrial citrate to generate cytosolic acetyl-CoA (Fig. 1 C). To determine how ACLY loss impacts TCA cycle metabolism in CD8 T cells, we traced the fate of [U-13C6]glucose into TCA cycle intermediates and acetyl-CoA using in vitro–activated WT and Acly KO T cells. We observed higher levels of M+2 and M+3 isotopologues of citrate, fumarate, and malate in Acly KO T cells compared with controls (Fig. 3 E and Fig. S3 G). Acly KO T cells also displayed an increased ratio of M+2 labeled malate to citrate (Fig. 3 F), consistent with conventional cycling of glucose-derived carbon in the TCA cycle and decreased export of mitochondrial citrate (Arnold et al., 2022). Indeed, [U-13C6]glucose labeling into acetyl-CoA (M+2) was reduced by >90% while the total pool size remained unchanged in Acly KO T cells compared with control T cells (Fig. 3, G and H). In contrast, [U-13C5]glutamine-dependent glutamate (M+5) and citrate (M+4) production was significantly increased in Acly KO CD8 T cells (Fig. S3 H). Thus, ACLY plays a critical role in partitioning the metabolic fate of mitochondrial citrate between the TCA cycle and acetyl-CoA production in T cells.
Cytosolic acetyl-CoA levels can influence acetylation-dependent biological processes such as lipid biosynthesis and histone acetylation. As expected, reduced glucose-dependent acetyl-CoA synthesis in Acly KO T cells (Fig. 3 G) produced reduced levels of [U-13C6]glucose-labeled (M+2) acetylated metabolites including acetyl-carnitine, acetyl-spermidine, and acetyl-glutamate in in vitro-activated Acly KO T cells compared with WT T cells (Fig. 3 I). Consistent with previous reports (Wellen et al., 2009; Kumari et al., 2019; Lee et al., 2014), ACLY deletion also reduced global levels of histone H3 acetylation at lysine 27 (H3K27Ac), a chromatin modification associated with active transcription (Fig. 3 J). Collectively, these results indicate that ACLY is critical for maintaining glucose-derived acetyl-CoA, which is utilized by CD8 T cells for histone and metabolite acetylation.
Acetate is an alternative fuel for acetyl-CoA production in CD8 T cells
We recently demonstrated that Teff cells oxidize a diverse set of carbon sources, including lactate and βOHB, for energy production (Kaymak et al., 2022; Luda et al., 2023). Acetate is a physiological fuel source found at 0.5–1 mM in circulation that can fuel TCA cycle metabolism in CD8 Tmem cells (Balmer et al., 2016, 2020) and Teff cells under low glucose conditions (Qiu et al., 2019). Alternatively, acetate can be directly converted to cytosolic acetyl-CoA via the enzyme ACSS2 (Fig. 4 A). To assess how acetate impacts T cell glucose metabolism, we cultured OT-I Teff cells isolated from LmOVA-infected mice (6 dpi) with acetate at its physiologic concentration in mouse serum (0.4 mM) plus [U-13C6]glucose at either physiologic (5 mM) or supraphysiological (25 mM) concentrations. Consistent with our previous observations (Kaymak et al., 2022), [U-13C6]glucose contributed only ∼10% to the intracellular citrate pool when acetate was present, regardless of glucose concentration (Fig. S3 I). In contrast, [13C2]acetate was the dominant carbon source for TCA cycle-derived metabolites (i.e., citrate, malate, aspartate) compared with [U-13C6]glucose (Fig. S3 J), indicating that Teff cells oxidize acetate preferentially to glucose ex vivo. When exposed to both glucose (5 mM) and acetate (1 mM), CD8 Teff cells preferred to use acetate for acetyl-CoA synthesis 3:1 over glucose, despite the fivefold greater concentration of glucose (Fig. 4 B). This preference was also observed in the greater labeling of M+2 acetylated metabolites (i.e., acetyl-carnitine, acetyl-methionine) from [13C2]acetate versus [U-13C6]glucose (Fig. 4 C). Finally, we assessed the contribution of glucose and acetate carbon to histone acetylation by culturing OT-I Teff cells isolated from LmOVA-infected mice (6 dpi) with [13C2]acetate or [U-13C6]glucose. In this case, [13C2]acetate was found to be the dominant contributor to histone H3 (lysine 14 and 23) and H4 (lysine 5 and 12) acetylation (Fig. 4 D), comprising up to ∼60% of the acetyl groups on H3K14/23. These data highlight acetate’s role as a major substrate for acetyl-CoA production and histone acetylation in CD8 Teff cells under physiological conditions.
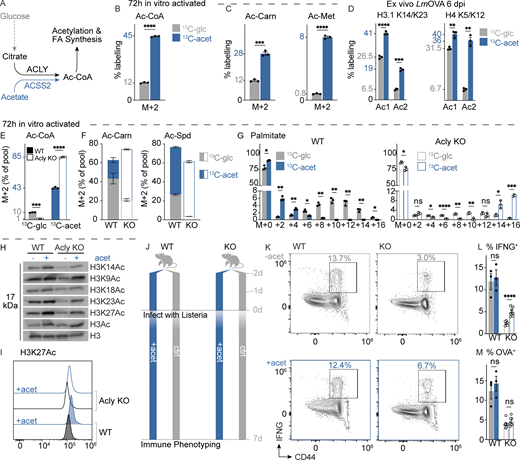
Acetate is an alternate fuel for acetyl-CoA production in CD8 T cells. (A) Schematic depicting contributions of glucose (via ACLY) and acetate (via ACSS2) to acetyl-CoA production. (B and C) Contribution of glucose and acetate to acetyl-CoA metabolism in CD8 Teff cells activated for 72 h in vitro then cultured for 2 h with indicated heavy carbon metabolite (n = 3/group). (B) Fractional enrichment (%) of U-[13C6]glucose (5 mM, gray) versus U-[13C2]acetate (1 mM, blue) labeling into acetyl-CoA (M+2) in activated CD8 T cells. (C) Fractional enrichment (%) of U-[13C6]glucose versus U[13C2]-acetate labeling into acetyl groups (M+2) of acetyl-carnitine and acetyl-methionine. (D) Fractional enrichment of U-[13C6]glucose versus U-[13C2]acetate labeling into acetylated sites of histone H3.1 (K14/23) and histone H4 (K5/12) of OT-I cells isolated from LmOVA-infected mice at 6 dpi. Cells were cultured ex vivo for 4 h with U-[13C6]glucose (5 mM, gray) or U-[13C2]acetate (2 mM, blue) prior to analysis (n = 3/group). Enrichment of 13C carbon at one (Ac1) or both (Ac2) lysine residues is indicated. (E–G) Contribution of glucose and acetate to acetyl-CoA metabolism in Acly-deficient CD8 Teff cells. Activated CD8 T cells from control (WT) and Acly-deficient (KO) mice were cultured with medium containing U-[13C6]glucose (5 mM, gray) or U-[13C2]acetate (1 mM, blue) (6–24 h) prior to metabolite extraction and analysis (n = 3/group). Fractional enrichment (%) of U-[13C6]glucose (gray) or U-[13C2]acetate (blue) into E, M+2 acetyl-CoA (6 h culture), F, M+2 acetyl-carnitine and -spermidine (6 h culture), and G, palmitate (M+0 to M+16, 24 h culture). (H) Immunoblot of histone H3 acetylation in activated control (WT) and Acly-deficient (KO) CD8 T cells cultured for 24 h in medium lacking (−) or containing (+) 5 mM acetate. Shown are levels of total (H3Ac) or site-specific (H3K9ac, H3K14ac, H3K18ac, H3K23ac, H3K27ac) acetylated histone H3 as well as total histone H3 in T cell histone extracts. (I) Histograms of H3K27ac in WT (closed) and ACLY KO (open) CD8 T cells treated with 5 mM acetate (blue) or control solvent (gray). (J–L) Effect of dietary acetate administration on CD8 Teff cell responses in vivo. (J) Schematic of LmOVA infection protocol. Control (WT) or Acly-deficient (KO) mice were administered PBS or acetate daily (1,000 mg/kg via oral gavage) starting 2 days prior to LmOVA infection (n = 3–7/group). (K) Representative flow cytometry plots of CD44 versus IFN-γ expression by CD8 T cells from the spleens of LmOVA-infected WT or KO mice (at 7 dpi) treated with (+) or without (−) acetate. (L) Percentage of IFN-γ–producing CD8 T cells from LmOVA-infected WT or KO mice (7 dpi) without (−) or with (+) oral acetate treatment. (M) Percentage (%) of OVA-specific CD8 T cells from mice as in L. All results are representative of two or more independent experiments. Data are shown as mean ± SEM. *P < 0.05; **P < 0.01; ***P < 0.001; ****P < 0.0001 by unpaired two-tailed t test (B–F, L, and M) or two-way ANOVA with Sidak’s multiple comparison test (G). Source data are available for this figure: SourceData F4.
Acetate is an alternate fuel for acetyl-CoA production in CD8 T cells. (A) Schematic depicting contributions of glucose (via ACLY) and acetate (via ACSS2) to acetyl-CoA production. (B and C) Contribution of glucose and acetate to acetyl-CoA metabolism in CD8 Teff cells activated for 72 h in vitro then cultured for 2 h with indicated heavy carbon metabolite (n = 3/group). (B) Fractional enrichment (%) of U-[13C6]glucose (5 mM, gray) versus U-[13C2]acetate (1 mM, blue) labeling into acetyl-CoA (M+2) in activated CD8 T cells. (C) Fractional enrichment (%) of U-[13C6]glucose versus U[13C2]-acetate labeling into acetyl groups (M+2) of acetyl-carnitine and acetyl-methionine. (D) Fractional enrichment of U-[13C6]glucose versus U-[13C2]acetate labeling into acetylated sites of histone H3.1 (K14/23) and histone H4 (K5/12) of OT-I cells isolated from LmOVA-infected mice at 6 dpi. Cells were cultured ex vivo for 4 h with U-[13C6]glucose (5 mM, gray) or U-[13C2]acetate (2 mM, blue) prior to analysis (n = 3/group). Enrichment of 13C carbon at one (Ac1) or both (Ac2) lysine residues is indicated. (E–G) Contribution of glucose and acetate to acetyl-CoA metabolism in Acly-deficient CD8 Teff cells. Activated CD8 T cells from control (WT) and Acly-deficient (KO) mice were cultured with medium containing U-[13C6]glucose (5 mM, gray) or U-[13C2]acetate (1 mM, blue) (6–24 h) prior to metabolite extraction and analysis (n = 3/group). Fractional enrichment (%) of U-[13C6]glucose (gray) or U-[13C2]acetate (blue) into E, M+2 acetyl-CoA (6 h culture), F, M+2 acetyl-carnitine and -spermidine (6 h culture), and G, palmitate (M+0 to M+16, 24 h culture). (H) Immunoblot of histone H3 acetylation in activated control (WT) and Acly-deficient (KO) CD8 T cells cultured for 24 h in medium lacking (−) or containing (+) 5 mM acetate. Shown are levels of total (H3Ac) or site-specific (H3K9ac, H3K14ac, H3K18ac, H3K23ac, H3K27ac) acetylated histone H3 as well as total histone H3 in T cell histone extracts. (I) Histograms of H3K27ac in WT (closed) and ACLY KO (open) CD8 T cells treated with 5 mM acetate (blue) or control solvent (gray). (J–L) Effect of dietary acetate administration on CD8 Teff cell responses in vivo. (J) Schematic of LmOVA infection protocol. Control (WT) or Acly-deficient (KO) mice were administered PBS or acetate daily (1,000 mg/kg via oral gavage) starting 2 days prior to LmOVA infection (n = 3–7/group). (K) Representative flow cytometry plots of CD44 versus IFN-γ expression by CD8 T cells from the spleens of LmOVA-infected WT or KO mice (at 7 dpi) treated with (+) or without (−) acetate. (L) Percentage of IFN-γ–producing CD8 T cells from LmOVA-infected WT or KO mice (7 dpi) without (−) or with (+) oral acetate treatment. (M) Percentage (%) of OVA-specific CD8 T cells from mice as in L. All results are representative of two or more independent experiments. Data are shown as mean ± SEM. *P < 0.05; **P < 0.01; ***P < 0.001; ****P < 0.0001 by unpaired two-tailed t test (B–F, L, and M) or two-way ANOVA with Sidak’s multiple comparison test (G). Source data are available for this figure: SourceData F4.
As CD8 T cells are dependent on ACLY to convert mitochondrial citrate into cytosolic acetyl-CoA (Fig. 3 G), we wondered whether exogenous acetate could compensate for the loss of ACLY. To test this hypothesis, we examined [U-13C6]glucose and [13C2]acetate utilization by cultured WT and Acly KO Teff cells. While ACLY loss ablated the ability of Teff cells to make acetyl-CoA from glucose, Acly KO T cells displayed a twofold increase in acetyl-CoA production from acetate with over 85% of the acetyl-CoA pool in Acly KO Teff cells being generated from [13C2]acetate (Fig. 4 E). This glucose-to-acetate metabolic switch in Acly KO Teff cells was also reflected in labeling patterns for the M+2 acetylated metabolites carnitine and spermidine (Fig. 4 F). As cytosolic acetyl-CoA is used to synthesize de novo lipids, we traced labeled [U-13C6]glucose and [13C2]acetate into intracellular palmitate in Acly KO and control Teff cells. While control (WT) CD8 Teff cells displayed characteristic labeling of palmitate from [U-13C6]glucose, including the expected presence of M+8, M+10, and M+12 fractions, Acly KO T cells derived the majority of their palmitate from [13C2]acetate, including fully-labeled M+16 palmitate derived exclusively from [13C2]acetate (Fig. 4 G). Notably, we found that exogenous acetate could rescue deficiencies in histone acetylation in Acly-deficient T cells (Fig. 4, H and I). Exogenous acetate increased global histone H3 acetylation at several lysine residues—particularly H3K27Ac—in both WT and Acly KO T cells (Fig. 4, H and I).
Finally, to test whether exogenous acetate could rescue the function of ACLY-deficient CD8 Teff cells in vivo, we administered acetate (or vehicle control) daily to control (WT) or Acly KO mice via oral gavage, as it has been demonstrated that CD8 T cells take up and utilize exogenous acetate that enters the blood (Ma et al., 2024), and analyzed CD8 T cell responses to LmOVA infection (Fig. 4 J). Acetate administration altered the functionality of Acly KO T cells, specifically increasing the percentage of IFN-γ–producing CD8 T cells in Acly KO mice (Fig. 4, K and L) while having minimal effect on T cell expansion in vivo (Fig. 4 M and Fig. S3 K). Collectively, these data reveal that CD8 Teff cells can source acetate as an alternative substrate for cytosolic acetyl-CoA production when mitochondrial citrate production is impaired.
ACLY and acetate control chromatin accessibility in CD8 T cells
T cell programming (i.e., differentiation and function) is highly dependent on epigenetic regulation, which provides heritable changes in gene expression (Kanno et al., 2012). Given the impact of ACLY deletion on acetyl-CoA levels (and rescue by acetate), we leveraged the epigenetic shifts that occur during the transition from naïve to effector state to study the impact of ACLY deletion on chromatin accessibility in CD8 T cells. Activating WT and Acly KO CD8 T cells in vitro for 48 h resulted in decreased CD44 (Fig. 5 A), GZMB, and TBET expression compared with WT cells (Fig. 5 B) with little difference in viability (Fig. S4 A), recapitulating our in vivo findings (Fig. 2). Consistent with our in vivo results (Fig. 4), adding acetate to culture media rescued CD44, GZMB, TBET, and IFN-γ expression in Acly KO CD8 T cells (Fig. 5, A and B; and Fig. S4 B). Assay for transposase-accessible chromatin (ATAC) sequencing (ATAC-seq) of these in vitro activated cells revealed a global reduction in chromatin accessibility around transcriptional start sites in Acly KO CD8 T cells that was partially rescued by acetate (Fig. 5 C and Fig. S4 C). Pathway overrepresentation analysis of the top 500 ACLY-dependent differentially accessible regions (DARs) (i.e., reduced in Acly KO versus WT) revealed enrichment for genetic loci associated with Teff function, including IL2-STAT5 signaling, interferon gamma response, and TNF signaling via NF-κB (Fig. 5 D). The addition of acetate to Acly KO CD8 T cells was sufficient to significantly increase accessibility in the majority of these same pathways (Fig. 5 E). Notably, DARs reduced by ACLY deletion were significantly enriched for targets of the transcription factors RELB and NFATC2 (Fig. S4 D), factors known to influence T cell metabolism and effector responses (Klein-Hessling et al., 2017; Capece et al., 2022). Indeed, we observed decreased accessibility at Nfkb1 and Il2ra (CD25) loci in Acly KO CD8 T cells, the latter correlating with decreased CD25 surface expression in ACLY-deficient T cells (Fig. 5 F and Fig. S4 E). Addition of exogenous acetate partially restored chromatin accessibility at these loci (Fig. 5 F), as well as at other genetic loci associated with effector function (i.e., Ifng, Gzmb, and Tbx21) (Fig. 5 G). Opening of these effector gene loci in Acly KO T cells following acetate exposure correlated with increased acetate-dependent protein expression of TBET, GZMB, and IFN-γ (Fig. 5 B and Fig. S4 B). Taken together, these data indicate that ACLY is critical for initiating chromatin remodeling in CD8 T cells at genetic loci required for activation and effector function.

Chromatin accessibility and expression of effector genes in CD8 T cells requires ACLY and is rescued by acetate. (A) Representative histogram and tabulation of CD44 surface expression by WT or Acly KO CD8 T cells activated for 48 h in media ± 1 mM acetate (n = 7/group). (B) Representative flow cytometry plots and tabulation of TBET+GZMB+ WT or Acly KO CD8 T cells treated as in A. (C) Histogram of chromatin accessibility (mean counts per million, CPMs) ± 2 kilobases (Kb) around transcriptional start site (TSS) in WT or Acly KO CD8 T cells treated as in A (n = 4/group). TES = transcriptional end site. (D) Pathway overrepresentation analysis using the Hallmark gene sets (MSigDB) of the top 500 DARs decreased by ACLY deletion. (E) Pathway overrepresentation analysis (as in D) of the top 500 DARs in Acly KO CD8 T cells increased by the addition of acetate (Acly KO+Acet vs. Acly KO). (F) Representative ATAC-seq tracks of the Il2ra (CD25) and Nfkb1 loci from WT or Acly KO CD8 T cells treated as in A. (G) Representative ATAC-seq tracks of the Ifng, Gzmb, and Tbx21 (TBET) loci in WT or Acly KO CD8 T cells treated as in A. All results are representative of two or more independent experiments. Data are shown as mean ± SEM. **P < 0.01; ***P < 0.001 by one-way ANOVA with Sidak’s multiple comparison test (A and B).
Chromatin accessibility and expression of effector genes in CD8 T cells requires ACLY and is rescued by acetate. (A) Representative histogram and tabulation of CD44 surface expression by WT or Acly KO CD8 T cells activated for 48 h in media ± 1 mM acetate (n = 7/group). (B) Representative flow cytometry plots and tabulation of TBET+GZMB+ WT or Acly KO CD8 T cells treated as in A. (C) Histogram of chromatin accessibility (mean counts per million, CPMs) ± 2 kilobases (Kb) around transcriptional start site (TSS) in WT or Acly KO CD8 T cells treated as in A (n = 4/group). TES = transcriptional end site. (D) Pathway overrepresentation analysis using the Hallmark gene sets (MSigDB) of the top 500 DARs decreased by ACLY deletion. (E) Pathway overrepresentation analysis (as in D) of the top 500 DARs in Acly KO CD8 T cells increased by the addition of acetate (Acly KO+Acet vs. Acly KO). (F) Representative ATAC-seq tracks of the Il2ra (CD25) and Nfkb1 loci from WT or Acly KO CD8 T cells treated as in A. (G) Representative ATAC-seq tracks of the Ifng, Gzmb, and Tbx21 (TBET) loci in WT or Acly KO CD8 T cells treated as in A. All results are representative of two or more independent experiments. Data are shown as mean ± SEM. **P < 0.01; ***P < 0.001 by one-way ANOVA with Sidak’s multiple comparison test (A and B).
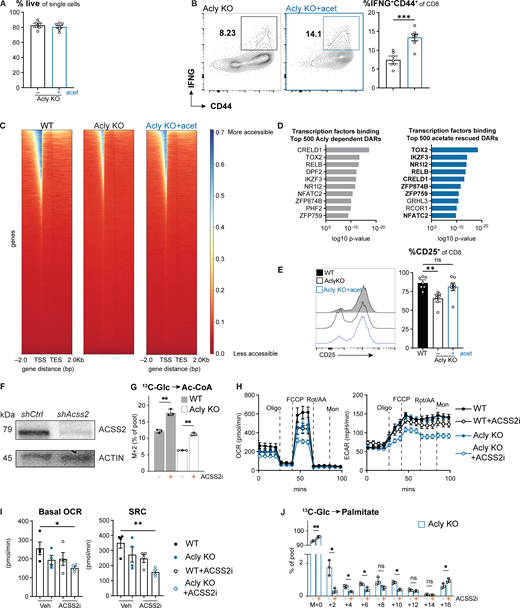
Acetate enhances Acly-deficient CD8 T cell function and chromatin accessibility. Related to Figs. 5 and 6. (A) Percent of live Acly KO CD8 T cells after 48 h of in vitro activation ±1 mM acetate (n = 7/condition). (B) Representative flow cytometry plots and tabulation of CD44+IFN-γ+Acly KO CD8 T cells treated as in A (n = 7/group). (C) Heatmap of chromatin accessibility (red = less accessible, blue = more accessible) ±2 kilobases (Kb) around transcriptional start sites for in vitro–activated WT, Acly KO, and Acly KO CD8 T cells treated with 1 mM acetate. TES = transcriptional end site. N = 3 biological replicates/sample. (D) Overrepresentation analysis using the GTRD transcription factor targets gene set (MSigDB) for the top 500 Acly-dependent (decreased in Acly KO versus WT) and acetate-rescued (Acly KO+acet versus Acly KO) DARs. Shown are transcription factors predicted to bind promoter binding sites of ACLY- and acetate-dependent DARs. (E) Representative histogram and tabulation of percent CD25+ WT and Acly KO CD8 T cells treated as in A (n = 7/group). (F) Immunoblot of ACSS2 and actin protein levels in whole cell lysates from activated CD8 T cells expressing control (shCtrl) or Acss2-targeting (shAcss2) shRNAs. (G) Fractional enrichment (%) of U-[13C6]glucose (5 mM) labeling into acetyl-CoA (M+2) in activated control (WT, closed bars) and Acly-deficient (KO, open bars) CD8 T cells. T cells were cultured for 6 h with 13C-tracers in the presence of solvent control (Ctrl) or ACSS2 inhibitor (ACSS2i) (n = 3/group). (H) OCR and ECAR of WT or Acly KO CD8 T cells ±ACSS2 inhibitor (ACSS2i) following in vitro activation for 48 h in VIM media +1 mM acetate (n = 4/group). Oligo, oligomycin; Rot/AA, rotenone and antimycin A; Mon, monensin. (I) Basal OCR (average of the first 4 measurements) and SRC (maximal minus basal OCR) of CD8 T cells cultured as in H. (J) Fractional enrichment (%) of U-[13C6]glucose (5 mM) labeling into palmitate in Acly-deficient (KO, open bars) CD8 T cells. T cells were cultured for 6 h with 13C-tracers in the presence of solvent control or ACSS2i. All results are representative of two or more independent experiments. Data are shown as mean ± SEM. *P < 0.05; **P < 0.01; ***P < 0.001; by unpaired two-tailed t test (A, B, and G) or one- or two-way ANOVA with Sidak’s multiple comparison test (E, I, and J). Source data are available for this figure: SourceData FS4.
Acetate enhances Acly-deficient CD8 T cell function and chromatin accessibility. Related to Figs. 5 and 6. (A) Percent of live Acly KO CD8 T cells after 48 h of in vitro activation ±1 mM acetate (n = 7/condition). (B) Representative flow cytometry plots and tabulation of CD44+IFN-γ+Acly KO CD8 T cells treated as in A (n = 7/group). (C) Heatmap of chromatin accessibility (red = less accessible, blue = more accessible) ±2 kilobases (Kb) around transcriptional start sites for in vitro–activated WT, Acly KO, and Acly KO CD8 T cells treated with 1 mM acetate. TES = transcriptional end site. N = 3 biological replicates/sample. (D) Overrepresentation analysis using the GTRD transcription factor targets gene set (MSigDB) for the top 500 Acly-dependent (decreased in Acly KO versus WT) and acetate-rescued (Acly KO+acet versus Acly KO) DARs. Shown are transcription factors predicted to bind promoter binding sites of ACLY- and acetate-dependent DARs. (E) Representative histogram and tabulation of percent CD25+ WT and Acly KO CD8 T cells treated as in A (n = 7/group). (F) Immunoblot of ACSS2 and actin protein levels in whole cell lysates from activated CD8 T cells expressing control (shCtrl) or Acss2-targeting (shAcss2) shRNAs. (G) Fractional enrichment (%) of U-[13C6]glucose (5 mM) labeling into acetyl-CoA (M+2) in activated control (WT, closed bars) and Acly-deficient (KO, open bars) CD8 T cells. T cells were cultured for 6 h with 13C-tracers in the presence of solvent control (Ctrl) or ACSS2 inhibitor (ACSS2i) (n = 3/group). (H) OCR and ECAR of WT or Acly KO CD8 T cells ±ACSS2 inhibitor (ACSS2i) following in vitro activation for 48 h in VIM media +1 mM acetate (n = 4/group). Oligo, oligomycin; Rot/AA, rotenone and antimycin A; Mon, monensin. (I) Basal OCR (average of the first 4 measurements) and SRC (maximal minus basal OCR) of CD8 T cells cultured as in H. (J) Fractional enrichment (%) of U-[13C6]glucose (5 mM) labeling into palmitate in Acly-deficient (KO, open bars) CD8 T cells. T cells were cultured for 6 h with 13C-tracers in the presence of solvent control or ACSS2i. All results are representative of two or more independent experiments. Data are shown as mean ± SEM. *P < 0.05; **P < 0.01; ***P < 0.001; by unpaired two-tailed t test (A, B, and G) or one- or two-way ANOVA with Sidak’s multiple comparison test (E, I, and J). Source data are available for this figure: SourceData FS4.
ACSS2 drives acetate-dependent metabolic compensation in CD8 T cells
Our results indicate that acetate can partially rescue changes caused by ACLY loss, including effects on chromatin accessibility (Fig. 5, E–G). We next explored mechanisms underlying the glucose-to-acetate metabolic switch for acetyl-CoA production in effector CD8 T cells. ACSS2 mediates the conversion of acetate to acetyl-CoA in the cytosol (Fig. 4 A). Single-cell profiling of CD8 T cells from LCMV Arm infection revealed expression of mitochondria-localized Acss1 in both naive and activated T cells, while Acss2 mRNA expression was highest in effector cells (Cx3cr1hiGzmbhiIfnghi and Cd44hi) (Fig. 6 A). Notably, the loss of ACLY triggered an increase in ACSS2 protein expression in CD8 T cells (Fig. 6 B). These data suggest a potential compensatory mechanism for maintaining cytosolic acetyl-CoA production when ACLY activity is blocked, similar to cancer cells (Zhao et al., 2016). To explore the individual roles of ACSS2 and ACLY in CD8 T cell activation and function, we treated WT and Acly KO CD8 T cells with an inhibitor against ACSS2 (ACSS2i, 6.25 μM) during the first 24 h of activation. Consistent with [U-13C6]glucose and [13C2]acetate tracing results (Fig. 3 E and Fig. 4, B–G), Acly KO alone did not significantly alter glucose and acetate consumption by CD8 T cells (Fig. 6 C). Inhibition of ACSS2 alone (WT+ACSS2i) significantly reduced acetate uptake but not glucose consumption, while ACSS2 inhibition combined with Acly KO significantly reduced both glucose and acetate consumption (Fig. 6 C). These data suggest that CD8 T cell acetate consumption is linked to ACSS2-dependent conversion of acetate to acetyl-CoA.
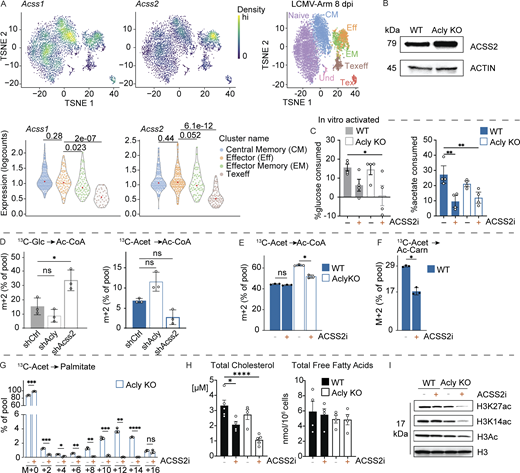
ACSS2 drives acetate-dependent metabolic compensation in ACLY-deficient CD8 T cells. (A) Density (top) and violin (bottom) plots for Acss1 and Acss2 mRNA expression in CD8 T cells isolated from LCMV Arm–infected mice at 8 dpi. (B) Immunoblot of ACSS2 and actin protein levels in whole cell lysates from in vitro-activated control (WT) and Acly-deficient (KO) CD8 T cells. Actin blot was also used in Fig. 2 A. (C) Percent glucose (left) or acetate (right) consumed from media during the first 24 h of activation by WT or KO CD8 T cells ± an ACSS2 inhibitor (ACSS2i) (n = 4/group). Media contained 5 mM glucose and 1 mM acetate. (D) Fractional enrichment (%) of U-[13C6]glucose (left) versus U-[13C2]acetate (right) labeling (4 h culture) into acetyl-CoA (M+2) in in vitro-activated CD8 T cells expressing control (shCtrl), Acly- (shAcly), or Acss2- (shAcss2) targeting shRNAs (n = 3/group). (E) Fractional enrichment (%) of U-[13C6]glucose (5 mM, gray) versus U-[13C2]acetate (1 mM, blue) labeling into acetyl-CoA (M+2) in activated control (WT, closed bars) and Acly-deficient (KO, open bars) CD8 T cells. T cells were cultured for 6 h with 13C-tracers in the presence of solvent control (Ctrl) or ACSS2i (n = 3). (F) Fractional enrichment (%) of U-[13C2]acetate (1 mM, blue) labeling in the acetyl group (M+2) of acetyl-carnitine in Acly-deficient (KO) CD8 T cells cultured for 6 h with solvent control (Ctrl) or Acss2 inhibitor (ACSS2i) (n = 3). (G) Mass isotopologue distribution (MID) for U-[13C2]acetate-derived palmitate in Acly-deficient (KO) CD8 T cells cultured for 6 h with solvent control (Ctrl) or ACSS2i (n = 3). (H) Total cholesterol (left) or free fatty acids (right) in activated WT or KO CD8 T cells ± ACSS2i in vitro cultured for 72 h (n = 4). (I) Immunoblot of histone H3 acetylation in activated control (WT) and Acly-deficient (KO) CD8 T cells cultured for 6 h in medium containing glucose and acetate (5 mM each) plus solvent control (−) or Acss2 inhibitor (+). Shown are levels of total acetylated (acH3), K27 acetylated (H3K27ac), K14 acetylated (H3K14ac), and total histone H3 in histone extracts. All results are representative of two or more independent experiments. Data are shown as mean ± SEM. A Kruskal–Wallis test followed by a pairwise Wilcox comparison was used to calculate Bonferroni adjusted P values (A). *P < 0.05; **P < 0.01; ***P < 0.001; ****P < 0.0001 by one-way ANOVA with Sidak’s multiple comparison test (C, D, G, and H) or unpaired two-tailed t test (E and F). Source data are available for this figure: SourceData F6.
ACSS2 drives acetate-dependent metabolic compensation in ACLY-deficient CD8 T cells. (A) Density (top) and violin (bottom) plots for Acss1 and Acss2 mRNA expression in CD8 T cells isolated from LCMV Arm–infected mice at 8 dpi. (B) Immunoblot of ACSS2 and actin protein levels in whole cell lysates from in vitro-activated control (WT) and Acly-deficient (KO) CD8 T cells. Actin blot was also used in Fig. 2 A. (C) Percent glucose (left) or acetate (right) consumed from media during the first 24 h of activation by WT or KO CD8 T cells ± an ACSS2 inhibitor (ACSS2i) (n = 4/group). Media contained 5 mM glucose and 1 mM acetate. (D) Fractional enrichment (%) of U-[13C6]glucose (left) versus U-[13C2]acetate (right) labeling (4 h culture) into acetyl-CoA (M+2) in in vitro-activated CD8 T cells expressing control (shCtrl), Acly- (shAcly), or Acss2- (shAcss2) targeting shRNAs (n = 3/group). (E) Fractional enrichment (%) of U-[13C6]glucose (5 mM, gray) versus U-[13C2]acetate (1 mM, blue) labeling into acetyl-CoA (M+2) in activated control (WT, closed bars) and Acly-deficient (KO, open bars) CD8 T cells. T cells were cultured for 6 h with 13C-tracers in the presence of solvent control (Ctrl) or ACSS2i (n = 3). (F) Fractional enrichment (%) of U-[13C2]acetate (1 mM, blue) labeling in the acetyl group (M+2) of acetyl-carnitine in Acly-deficient (KO) CD8 T cells cultured for 6 h with solvent control (Ctrl) or Acss2 inhibitor (ACSS2i) (n = 3). (G) Mass isotopologue distribution (MID) for U-[13C2]acetate-derived palmitate in Acly-deficient (KO) CD8 T cells cultured for 6 h with solvent control (Ctrl) or ACSS2i (n = 3). (H) Total cholesterol (left) or free fatty acids (right) in activated WT or KO CD8 T cells ± ACSS2i in vitro cultured for 72 h (n = 4). (I) Immunoblot of histone H3 acetylation in activated control (WT) and Acly-deficient (KO) CD8 T cells cultured for 6 h in medium containing glucose and acetate (5 mM each) plus solvent control (−) or Acss2 inhibitor (+). Shown are levels of total acetylated (acH3), K27 acetylated (H3K27ac), K14 acetylated (H3K14ac), and total histone H3 in histone extracts. All results are representative of two or more independent experiments. Data are shown as mean ± SEM. A Kruskal–Wallis test followed by a pairwise Wilcox comparison was used to calculate Bonferroni adjusted P values (A). *P < 0.05; **P < 0.01; ***P < 0.001; ****P < 0.0001 by one-way ANOVA with Sidak’s multiple comparison test (C, D, G, and H) or unpaired two-tailed t test (E and F). Source data are available for this figure: SourceData F6.
We next measured the relative contribution of [U-13C6]glucose and [13C2]acetate to acetyl-CoA production in CD8 T cells expressing shRNAs targeting Acly or Acss2 (Fig. S4 F). Knockdown of Acly reduced [U-13C6]glucose-dependent and increased [13C2]acetate-dependent acetyl-CoA (M+2) production, similar to Acly KO T cells (Fig. 4 E), while silencing Acss2 triggered compensatory synthesis of acetyl-CoA from [U-13C6]glucose (Fig. 6 D). Similar to shRNA knockdown, ACSS2 inhibition reduced [13C2]acetate-dependent acetyl-CoA (M+2) production in Acly KO T cells (Fig. 6 E). The high level of [13C2]acetate labeling in both WT and Acly KO T cells in the presence of ACSS2 inhibitor (WT ∼40%; KO ∼50%) likely reflects mitochondrial acetyl-CoA produced from acetate via ACSS1 (Fig. 6 A). However, M+2 labeling of acetyl-carnitine from [13C2]acetate was reduced in ACSS2i-treated WT T cells (Fig. 6 F), indicating an effect of ACSS2 inhibition on cytosolic acetyl-CoA-dependent reactions.
Interestingly, ACSS2 blockade increased [U-13C6]glucose-dependent acetyl-CoA (M+2) production in both WT and Acly KO T cells (Fig. S4 G), suggesting that ACLY and ACSS2 control independent yet compensatory pathways for acetyl-CoA production in CD8 T cells. Based on these findings, we hypothesized that ACSS2 is required for metabolic compensation in Acly KO T cells. Indeed, ACLY loss and ACSS2 inhibition lowered both basal and maximal oxygen consumption rates (OCR) in CD8 T cells to a similar extent, but combined ACLY deletion and ACSS2 inhibition synergized to further reduce OCR and SRC compared with WT CD8 T cells (Fig. S4, H and I). Consistent with reduced mitochondrial metabolism, de novo palmitate synthesis from [13C2]acetate in Acly KO T cells was blocked upon ACSS2 inhibition and could not be rescued by [U-13C6]glucose (Fig. 6 G and Fig. S4 J). ACSS2 inhibition had differential effects on lipid metabolism in CD8 T cells. ACSS2 inhibition had minimal effect on total free fatty acid levels in CD8 T cells, while ACSS2i treatment lowered cholesterol levels in both WT and Acly KO T cells (Fig. 6 H). Consistent with the effects of ACSS2 inhibition on acetate-dependent acetyl-CoA production (Fig. 6 E), levels of histone H3 acetylation (H3K27Ac, H3K14Ac), which were already lower in Acly KO T cells (Fig. 4, H and I), were further reduced upon ACSS2 inhibition (Fig. 6 I).
Next, we examined the role of ACSS2 in CD8 T cell responses to pathogen infection in vivo. WT or Acly KO CD8 OT-I cells were transduced with control or Acss2-targeting shRNAs, adoptively transferred into naïve hosts, and then infected with LmOVA 1 day later (Fig. S5 A). Consistent with earlier results (Figs. 2 and S2), CD8 T cells lacking ACLY (Acly KO/shCtrl) displayed reduced expansion (Fig. S5 B) and IFN-γ production (Fig. 7 A and Fig. S5 C) in response to LmOVA infection (7 dpi). Knockdown of Acss2 alone (WT/shAcss2) had less of an impact on CD8 T cell expansion compared with Acly KO T cells (Fig. S5, B and C) but displayed a similar reduction in IFN-γ production in response to LmOVA (7 dpi) (Fig. 7 A and Fig. S5 D). Strikingly, targeting both ACLY and ACSS2 ablated OVA-specific CD8 T cell expansion in vivo (4.38 ± 0.96 × 10⁶ cells for WT/shCtrl versus 1.7 ± 0.5 × 10⁴ cells for Acly KO/shAcss2) (Fig. S5 B) and reduced IFN-γ production on a per-cell basis in the few Acly KO/shAcss2 CD8 T cells that responded to LmOVA infection (Fig. 7 A and Fig. S5 D).

ACSS2 is required for CD8 Teff function in the absence of ACLY. Related to Fig. 7. (A–D) Schematic of adoptive transfer of WT and Acly KO OT-I cells transduced with either shCtrl or shAcss2 shRNAs and LmOVA infection protocol for B–D. (B) Percentage and total number of Thy1.1+ T cells (genotypes indicated) in the spleen of LmOVA-infected mice at 7 dpi. (C) Percent OVA-tetramer+CD44+ CD8 T cells in the blood over time in mice treated as in A. (D) Total number of IFN-γ+ Thy1.1+ cells (genotypes indicated) in the spleen of LmOVA-infected mice at 7 dpi. (E) Representative flow cytometry plots and tabulation of percent IFN-γ+CD44+ WT or Acly KO CD8 T cells activated in vitro for 48 h ±ACSS2 inhibitor (n = 7/group). (F) Tabulation of percent live CD8 T cells treated as in E. (G) Heat map of chromatin accessibility ±2 kilobases (Kb) around transcriptional start sites of genes in WT or Acly KO CD8 T cells activated in vitro for 48 h in the presence or absence of ACSS2i (6.25 μM) (n = 4/group). TES = Transcription end site, Blue = more accessible, Red = less accessible. (H) Representative ATAC-seq tracks for the Atf3 and Tnfsr4 (OX40) loci in WT or Acly KO CD8 T cells treated as in E. (I) Tabulation of percent CD25+ (Il2ra) WT or Acly KO CD8 T cells treated as in E (n = 7/group). (J) Tabulation of GZMB and TBET double positive CD8 T cells 48 h after in vitro activation treated as indicated. WT, Acly KO, and Acly KO + acetate data taken from Fig. 5 B. (K) Left: Schematic of adoptive transfer of Acly KO OT-I cells transduced with either shCtrl or shAcss2 shRNAs and LmOVA infection protocol. Mice were administered PBS or acetate daily (1,000 mg/kg, via oral gavage) starting 2 days prior to LmOVA infection (n = 3–7/group). Right: Total number of IFN-γ+ Thy1.1 T cells (genotypes indicated) in the spleen of LmOVA-infected mice at 7 dpi. All results are representative of two or more independent experiments. Data are shown as mean ± SEM. *P < 0.05; **P < 0.01; ***P < 0.001; ****P < 0.0001; by unpaired two-tailed t test (B, D, and K) or one-way ANOVA with Sidak’s multiple comparison test (E, F, I, and J).
ACSS2 is required for CD8 Teff function in the absence of ACLY. Related to Fig. 7. (A–D) Schematic of adoptive transfer of WT and Acly KO OT-I cells transduced with either shCtrl or shAcss2 shRNAs and LmOVA infection protocol for B–D. (B) Percentage and total number of Thy1.1+ T cells (genotypes indicated) in the spleen of LmOVA-infected mice at 7 dpi. (C) Percent OVA-tetramer+CD44+ CD8 T cells in the blood over time in mice treated as in A. (D) Total number of IFN-γ+ Thy1.1+ cells (genotypes indicated) in the spleen of LmOVA-infected mice at 7 dpi. (E) Representative flow cytometry plots and tabulation of percent IFN-γ+CD44+ WT or Acly KO CD8 T cells activated in vitro for 48 h ±ACSS2 inhibitor (n = 7/group). (F) Tabulation of percent live CD8 T cells treated as in E. (G) Heat map of chromatin accessibility ±2 kilobases (Kb) around transcriptional start sites of genes in WT or Acly KO CD8 T cells activated in vitro for 48 h in the presence or absence of ACSS2i (6.25 μM) (n = 4/group). TES = Transcription end site, Blue = more accessible, Red = less accessible. (H) Representative ATAC-seq tracks for the Atf3 and Tnfsr4 (OX40) loci in WT or Acly KO CD8 T cells treated as in E. (I) Tabulation of percent CD25+ (Il2ra) WT or Acly KO CD8 T cells treated as in E (n = 7/group). (J) Tabulation of GZMB and TBET double positive CD8 T cells 48 h after in vitro activation treated as indicated. WT, Acly KO, and Acly KO + acetate data taken from Fig. 5 B. (K) Left: Schematic of adoptive transfer of Acly KO OT-I cells transduced with either shCtrl or shAcss2 shRNAs and LmOVA infection protocol. Mice were administered PBS or acetate daily (1,000 mg/kg, via oral gavage) starting 2 days prior to LmOVA infection (n = 3–7/group). Right: Total number of IFN-γ+ Thy1.1 T cells (genotypes indicated) in the spleen of LmOVA-infected mice at 7 dpi. All results are representative of two or more independent experiments. Data are shown as mean ± SEM. *P < 0.05; **P < 0.01; ***P < 0.001; ****P < 0.0001; by unpaired two-tailed t test (B, D, and K) or one-way ANOVA with Sidak’s multiple comparison test (E, F, I, and J).

ACSS2 is essential for CD8 Teff responses in the absence of ACLY. (A) Representative flow cytometry plots and tabulation of IFN-γ–producing WT or Acly KO OT-I CD8 T cells (expressing control [shCtrl] or Acss2-targeting [shAcss2] shRNAs) 7 dpi with LmOVA (3–5/group). (B) Representative flow cytometry plots and tabulation of TBET+GZMB+ WT and Acly KO CD8 T cells following in vitro activation in the presence or absence of ACSS2i for 48 h (n = 7/group). (C) Histogram of chromatin accessibility (mean counts per million, CPM) ±2 kilobases (Kb) around transcriptional start sites (TSS), in CD8 T cells treated as in B (n = 4/group). TES = transcription end site. (D) Venn diagram of significantly decreased DARs from Acly KO versus WT compared to the significantly decreased DARs from Acly KO+ACSS2i vs WT CD8 T cells treated as in B. (E) Pathway overrepresentation analysis using the Hallmark Gene Sets (MSigDB) of overlapping DARs from D. (F and G) Representative ATAC tracks from CD8 T cells treated as in B. Shown are gene tracks for Il2ra and Nfkb1 loci (F) and representative effector gene loci (G, Ifng, Gzmb, Tbx21). Red gates highlight DARs of interest. (H) Effect of dietary acetate on ACSS2-deficient CD8 T cell responses in vivo. Acly-deficient (KO) Thy1.1+ OT-I CD8 T cells were transduced with control (shCtrl) or Acss2-targeting (shAcss2) shRNAs, followed by adoptive transfer and infection with LmOVA. Mice were administered PBS or acetate daily (1,000 mg/kg, via oral gavage) starting 2 days prior to LmOVA infection (n = 3–7/group). Representative flow cytometry plots and tabulation of percent CD44 versus IFN-γ expression by CD8 T cells from the spleens of LmOVA-infected mice 7 dpi (n = 3–6). All results are representative of two or more independent experiments. Data are shown as mean ± SEM. *P < 0.05; ****P < 0.0001 by unpaired two-tailed t test (A and H) or one-way ANOVA with Sidak’s multiple comparison test (B).
ACSS2 is essential for CD8 Teff responses in the absence of ACLY. (A) Representative flow cytometry plots and tabulation of IFN-γ–producing WT or Acly KO OT-I CD8 T cells (expressing control [shCtrl] or Acss2-targeting [shAcss2] shRNAs) 7 dpi with LmOVA (3–5/group). (B) Representative flow cytometry plots and tabulation of TBET+GZMB+ WT and Acly KO CD8 T cells following in vitro activation in the presence or absence of ACSS2i for 48 h (n = 7/group). (C) Histogram of chromatin accessibility (mean counts per million, CPM) ±2 kilobases (Kb) around transcriptional start sites (TSS), in CD8 T cells treated as in B (n = 4/group). TES = transcription end site. (D) Venn diagram of significantly decreased DARs from Acly KO versus WT compared to the significantly decreased DARs from Acly KO+ACSS2i vs WT CD8 T cells treated as in B. (E) Pathway overrepresentation analysis using the Hallmark Gene Sets (MSigDB) of overlapping DARs from D. (F and G) Representative ATAC tracks from CD8 T cells treated as in B. Shown are gene tracks for Il2ra and Nfkb1 loci (F) and representative effector gene loci (G, Ifng, Gzmb, Tbx21). Red gates highlight DARs of interest. (H) Effect of dietary acetate on ACSS2-deficient CD8 T cell responses in vivo. Acly-deficient (KO) Thy1.1+ OT-I CD8 T cells were transduced with control (shCtrl) or Acss2-targeting (shAcss2) shRNAs, followed by adoptive transfer and infection with LmOVA. Mice were administered PBS or acetate daily (1,000 mg/kg, via oral gavage) starting 2 days prior to LmOVA infection (n = 3–7/group). Representative flow cytometry plots and tabulation of percent CD44 versus IFN-γ expression by CD8 T cells from the spleens of LmOVA-infected mice 7 dpi (n = 3–6). All results are representative of two or more independent experiments. Data are shown as mean ± SEM. *P < 0.05; ****P < 0.0001 by unpaired two-tailed t test (A and H) or one-way ANOVA with Sidak’s multiple comparison test (B).
ACLY and ACSS2 coordinate common pathways of CD8 Teff function via effects on chromatin accessibility
We next sought to determine if acetate-dependent metabolic compensation in Acly KO T cells mediated by ACSS2 was acting at the level of chromatin accessibility. Unlike knocking down Acss2 expression in vivo, inhibiting ACSS2 in vitro had no impact on TBET and GZMB expression or IFN-γ production in control CD8 T cells (Fig. 7 B and Fig. S5 E). However, as in vivo, inhibition of both ACSS2 and ACLY resulted in a severe reduction in TBET, GZMB, and IFN-γ production without impacting viability (Fig. 7 B; and Fig. S5, E and F). ATAC-seq of ACSS2i-treated CD8 T cells appeared to have a modest increase in overall chromatin accessibility around transcriptional start sites, but statistically, no significant changes in DARs were found compared with control T cells, suggesting ACSS2 activity does not contribute to chromatin accessibility when ACLY is functional (Fig. 7 C and Fig. S5 G; and Table S4). Acly KO T cells treated with ACSS2i displayed higher overall chromatin accessibility at transcriptional start sites compared with Acly KO and WT CD8 T cells (Fig. 7 C and Fig. S5 G). Despite this, blocking ACLY and ACSS2 resulted in 15,255 regions with significantly reduced accessibility compared with WT CD8 T cells (Fig. 7 D). Comparing the reduced DARs in Acly KO CD8 T cells to Acly KO T cells treated with ACSS2i revealed a ∼98% overlap in shared DARs (Fig. 7 D), with only 316 regions regulated exclusively by ACSS2 (Fig. 7 D). Pathway analysis of these shared DARs revealed enrichment in several ACLY- and acetate-dependent pathways: IL2 STAT5 signaling, TNF-α signaling via NF-κB, and inflammatory response signaling pathways (Fig. 5 D and Fig. 7 E). Chromatin accessibility was reduced in ACSS2i-treated Acly KO T cells at genetic loci associated with these pathways similar to Acly KO T cells, including Il2ra/CD25 and Nfkb1 (Fig. 7 F) and Atf3 and Tnfrsf4/OX40 (Fig. S5 H), but not with ACSS2 inhibition alone. Reduced accessibility at the Il2ra locus in ACSS2i-treated Acly KO T cells correlated with reduced protein expression (Fig. S5 I). Similarly, chromatin accessibility at genetic loci encoding key Teff molecules (i.e., Ifng, Gzmb, and Tbx21) was reduced in ACSS2i-treated Acly KO T cells compared with controls (Fig. 7 G), consistent with reduced expression of these effector molecules by flow cytometry (Fig. 7 B and Fig. S5 E). These data suggest that regulation of chromatin accessibility in CD8 T cells is driven by ACLY, with accessibility at a few loci dependent exclusively on ACSS2, even in the absence of ACLY. Despite this, the rescue of Acly KO T cell function by acetate was dependent upon ACSS2 (Fig. S5 J), suggesting acetate may be acting through a mechanism independent of chromatin accessibility. However, whether this is truly the case remains to be determined, especially given that acetate was able to partially restore chromatin accessibility in Acly KO T cells (Fig. 5, C–G).
Finally, to assess whether ACSS2 mediates the dietary effects of acetate on CD8 T cell function in vivo (Fig. 4, J–L), we measured the functional response of adoptively transferred Acly KO CD8 OT-I T cells (expressing control or Acss2-targeting shRNAs) to LmOVA infection with the animals receiving daily oral gavage of acetate (Fig. S5 K). Dietary administration of acetate was sufficient to rescue the function of Acly KO T cells as before, increasing the frequency (Fig. 7 H) but not the number (Fig. S5 K) of IFN-γ–producing cells; importantly, this effect was entirely dependent on ACSS2. Acly-deficient T cells also lacking ACSS2 (KO/shAcss2) failed to increase IFN-γ production in response to dietary acetate (Fig. 7 H). Collectively, these results highlight critical roles for ACLY and ACSS2 in maintaining acetyl-CoA homeostasis in CD8 T cells, which are essential for maintaining effector T cell responses in vivo.
Discussion
Using genetic models and metabolic tracing, we have identified mitochondrial citrate production as an essential metabolic function of the TCA cycle supporting CD8 T cell responses in vivo. Our findings indicate that a metabolic switch from conventional to “non-canonical” TCA cycle metabolism—mediated by ACLY—enables mitochondrial support of cytosolic acetyl-CoA production, which is essential for both T cell proliferative expansion and cytokine production. ACLY acts as an essential bridge between the mitochondrion and cytosol, coordinating the production of mitochondrial citrate into cytosolic acetyl-CoA used for de novo lipid production and histone acetylation required for optimal effector T cell function. Using ACLY-deficient T cells that cannot generate acetyl-CoA from mitochondrial citrate, we identified a non-redundant program for cytosolic acetyl-CoA production mediated by the acetate-processing enzyme ACSS2. ACSS2 enables CD8 T cells to use acetate for cytosolic acetyl-CoA production, even in the presence of fivefold more glucose (Fig. 4 B). This parallel pathway of acetyl-CoA production is sufficient to restore effector function (i.e., IFN-γ production), but not proliferation, of T cells in vivo when the production of cytosolic acetyl-CoA from mitochondrial sources is compromised. Notably, exogenous acetate in the diet can rescue the effector function of ACLY-deficient CD8 T cells in vivo (Fig. 4, K and L), providing evidence for a nutrient-responsive pathway in T cells mediated by ACSS2 that maintains CD8 Teff function in the face of mitochondrial dysfunction.
Our results show that ACLY and ACSS2 work together to pair nutrient availability and mitochondrial function with acetyl-CoA levels in support of CD8 T cell function, displaying reciprocal expression and metabolic activities similar to what is observed in tumor cells (Zhao et al., 2016). However, our data indicate that ACSS2 functions to maintain Teff function in part by re-establishing permissive histone acetylation marks (i.e., H3K27Ac) in an acetate-dependent fashion. While ACSS2 has previously been linked to acetate-dependent CD8 T cell function under low glucose conditions (Qiu et al., 2019), our data indicate that ACSS2 regulates acetate-dependent acetyl-CoA production even under glucose-replete conditions. Notably, acetate can rescue defects in chromatin accessibility observed in ACLY-deficient T cells when glucose is abundant, especially around genes critical for CD8 Teff functions (Fig. 4). This is further highlighted by the substantial overlap in genomic loci controlled by ACLY and ACSS2 (Fig. 7 D), where >97% of the ACSS2-regulated genomic regions are also regulated by ACLY. This is consistent with the observation that despite the presence of acetate-derived acetyl-CoA (Fig. 4 B), inhibiting ACSS2 alone had less of an impact on CD8 T cell expansion, activation, and cytokine production compared with ACLY-deficient T cells (Fig. 7, A–D; and Fig. S4 B). These observations suggest that ACSS2 acts as a “backup generator” for cytosolic acetyl-CoA production in CD8 T cells, running when acetate is available but dispensable when the primary generator (mitochondrial-dependent production mediated by ACLY) is functional. Thus, our data highlight a previously unappreciated role of acetate metabolism in supporting CD8 Teff responses when mitochondrial support of cytosolic acetyl-CoA production is compromised.
ACSS2 has previously been shown to be expressed by tumor-infiltrating lymphocytes under conditions of glutamine depletion (Leone et al., 2019). We speculate that ACSS2 represents a central mechanism for maintaining acetyl-CoA homeostasis—and ultimately effector function—in T cells under conditions of mitochondrial dysfunction or stress. We hypothesize that under conditions of chronic infection or cancer, loss of ACSS2 expression would render CD8 T cells unable to process acetate and disrupt CD8 T cell function, potentially leading to a terminally exhausted (Texterm) state. In this regard, enhancing the nuclear localization of ACSS2 under stressful environmental conditions may enhance acetate-dependent effects on effector function and epigenetically reinforce the Teff cell state. Together, these data highlight potential roles for acetate—a metabolite found at significant levels (>100 μM) in serum (Cantor et al., 2017; Kaymak et al., 2022)—in shaping effector T cell responses in vivo and illustrate how context-dependent metabolic rewiring and acetyl-CoA availability are critical for supporting adaptive CD8 T cell responses.
Materials and methods
Mice
C57BL/6, B6.PL-Thy1a/CyJ (Thy1.1+), B6.SJL-PtprcaPepcb/BoyJ (CD45.1), Tg(TcraTcrb)1100Mjb (OT-I), B6.Cg-Tcratm1Mom Tg(TcrLCMV)327Sdz (P14), Cd4-Cre, and Aclytm1.1Welk/Mmjax (Aclyfl/fl) mice were purchased from the Jackson Laboratory. Mice were bred and maintained under specific pathogen–free conditions at the Van Andel Institute (VAI) under approved protocols. For in vivo acetate administration experiments, 1.5 g/kg sodium acetate dissolved in water was prepared and orally administered to the mice twice daily. Experiments were performed using mice between 8 and 12 wk of age. Mice were kept in groups of five mice or less and had access to a pellet-based feed and autoclaved reverse osmosis water.
T cell purification and culture
For in vitro CD8+ mouse T cell isolation, CD8+ T cells were purified from the spleen and peripheral lymph nodes by negative selection (StemCell Technologies) as previously described (Kaymak et al., 2022). Cells were cultured in a T cell medium (TCM) containing IMDM or custom IMDM for tracing studies (without serine, glycine, glucose, and glutamine) supplemented with 10% dialyzed FBS (Wisent), L-glutamine (Invitrogen), penicillin-streptomycin (Invitrogen), 2-ME (Sigma-Aldrich), and glucose. L-serine (0.4 mM) and L-glycine (0.4 mM) were added to cell culture media as indicated. In stated conditions using physiological media, T cells were cultured in Van Andel Institute modified Iscove's Medium (VIM) (Kaymak et al., 2022) containing dialyzed FCS and physiologic carbon sources (PCS) added to culture medium as indicated at the following concentrations: acetate (400 μM), βOHB (850 μM), citrate (215 μM), lactate (3 mM), and pyruvate (150 μM). In vitro–activated CD8+ Teff cells were generated by stimulating naïve CD8+ T cells (1 × 10⁶ cells/ml) with plate-bound anti-CD3ε (clone 2C11) and anti-CD28 (clone 37.51) antibodies (eBioscience) plus 50 U/ml IL2 (PeproTech) for 3 days. For retroviral transduction experiments, CD8+ Thy1.1+ OT-I T cells (WT or Acly-deficient) were transduced with retrovirus 24 h after activation and expanded for 2 additional days in IMDM containing IL-2 as previously described (Kaymak et al., 2022; Ma et al., 2019). Transduced T cells were FACS-sorted and cultured overnight prior to adoptive transfer into naïve C57BL/6 hosts.
Adoptive transfer and infection models
Mice were immunized intravenously with a sublethal dose of recombinant attenuated L. monocytogenes expressing OVA (Lm-OVA, 2 × 10⁶ CFU) as previously described (Kaymak et al., 2022). For adoptive transfer experiments using LmOVA, 5–10 × 103 OT-I CD8+ T cells were adoptively transferred into C57BL/6 mice (CD45.1+ or CD45.2+) by i.v. injection, followed by LmOVA infection 1 day later. Splenocytes were isolated from mice 7 dpi and analyzed for the presence of OVA-specific CD8+ T cells by Thy1.1 or CD45.2 staining and cytokine production analyzed by intracellular cytokine staining (ICS) following peptide restimulation (OVA257-264) as previously described (Kaymak et al., 2022; Ma et al., 2017). For LCMV infection, 5–10 × 103 P14 CD8+ T cells were adoptively transferred into C57BL/6 mice by i.v. injection, followed by intraperitoneal infection with LCMV Arm (2 × 10⁵ PFU/mouse) 1 day later. For the rechallenge of LCMV Arm immunized mice, animals were infected with LCMV cl-13 strain (2 × 10⁶ PFU/mouse) via the tail vein.
CRISPR-mediated knockout was conducted via RNP electroporation of naïve P14 T cells using the Lonza 4D-Nucleofector System and P3 primary cell 4D Nucleofactor electroporation kit following manufacturer’s instructions (Lonza). Briefly, Cas9 protein (1.89 μl of 20 μM stock, Synthego) was mixed with 1 μl of sgRNA template (1.5 nmol) to a final volume of 5 μl in RNase-free water and incubated for 10 min at room temperature. Naïve P14 T cells (2.5 × 10⁶) were washed twice in 15 ml PBS (wash followed by 4 min centrifugation at 500 g), resuspended in 1 ml PBS, and then centrifuged in a microfuge tube (4 min, 400 g, room temperature). The cell pellet was resuspended in 20 μl P3 buffer, then mixed with 5 μl Cas9 RNP mix, and transferred to Lonza nucleofector strips. Cells were electroporated using the “mouse T cell, unstimulated” program (Pulse DN100). Following electroporation, 130 μl of prewarmed TCM was added to the electroporation well and cells rested for 10 min in a tissue culture incubator (5% CO2, 37°C). Cells were resuspended in HBSS and adoptively transferred into recipient mice via i.v. injection.
For metabolic analysis of Lm-OVA-specific Thy1.1+ OT-I T cells ex vivo, Thy1.2+ C57BL/6 mice received 2.5 × 10⁶ or 5 × 10⁴ Thy1.1+ OT-I T cells for analysis at 2 and 6 dpi, respectively. Lm-OVA-specific CD8+ OT-I T cells were isolated from the spleen of infected mice by positive selection using the EasySep mouse CD90.1 positive selection kit (StemCell Technologies) as previously described (Ma et al., 2019; Sheldon et al., 2021). CD8+ Teff cells isolated from LmOVA-infected mice were cultured immediately ex vivo in Seahorse XF RPMI assay medium with the following medium conditions: 5 mM glucose, 0.5 mM L-glutamine, 0.15 mM pyruvate, and 10% dialyzed FBS. For LCMV infection, mice were immunized with LCMV Arm strain by i.v. injection (2 × 10⁵ CFU).
LCMV in vivo shRNA screen
A custom mouse lentiviral shRNA library targeting 18 metabolic genes and non-targeting controls was cloned into the pCELL-Thy1.1 vector (Cellecta), with 3–5 shRNAs targeting each gene. The in vivo screening approach using LCMV was developed based on the work of Chen et al. (2014). Lentivirus was produced by cotransfecting lentiviral shRNA plasmids, psPAX2, and pMD2.G in HEK293T cells. Viral supernatants were harvested 48 and 72 h after transfection, pooled, and concentrated using Lenti-X Concentrator (Takara Bio) according to manufacturer protocols. The concentrated lentivirus was added to naïve P14 T cells cultured with 5 ng/ml IL-7 and 100 ng/ml IL-15 together with 8 ng/ml polybrene and 20 mM HEPES, and the cells were centrifuged at 1,180 RCF, 30°C for 90 min in retronectin-coated plates. An aliquot of cells was saved as “input.” 48 h after transduction, P14 T cells were adoptively transferred into naïve hosts (5 × 10⁵/mouse), followed by LCMV Arm infection (2 × 10⁵ PFU/mouse by i.p. injection) 1 day later. Mice were randomly divided into two groups for primary and secondary LCMV responses. To isolate Teff cells (“primary response”), donor-derived P14 cells were sorted by magnetic beads StemCell Technologies) based on Thy1.1 expression and stored at −80°C. To isolate responding Tmem cells (“secondary response”), immunized mice were infected with LCMV cl-13 (2 × 10⁶ PFU/mouse by i.v. injection) 30 days after LCMV Arm infection, and Thy1.1+ P14 cells sorted from spleens 5 days later. Genomic DNA from input, primary, and secondary cell pellets were isolated using a Nucleospin tissue kit (Takara Bio) according to the manufacturer’s instructions.
Library construction from 2 to 5 μg genomic DNA/sample consisted of two PCR amplification steps: (1) amplification (18 cycles) of hairpin sequences (primers: F2, 5′-TCGGATTCGCACCAGCACGCTA-3′; R2, 5′-AAGAGACGAGAAGTGCGATGA-3′) and (2) a second round of amplification (16–20 cycles) using the same primers and 10 μl from the first PCR amplification step as input. PCR products were run on an agarose gel and bands corresponding to the shRNAs were gel purified (>2 μg DNA yield). Library sequencing was performed on an Illumina Hi-seq platform using GexSeq and P7 primers. Single-end reads were trimmed and matched against shRNA sequences from the original library. Read counts for shRNAs were normalized against total reads across all samples and enrichment or depletion of each shRNA was calculated as the fold change (FC) relative to input control and log2 transformed for each biological replicate (i.e., FC = log2(shRNAtest/shRNAinput)). Results are summarized in Table S1.
scRNAseq analysis
C57BL/6 mice (three biological replicates) were infected with LCMV Arm. At 8 dpi, mice were sacrificed, and single-cell suspensions generated from spleens followed by filtration through a 70-μM filter. Spleen samples were split into two halves: the first half was subjected to CD45+ cell isolation (#130-052-301; Miltenyi Biotec) and the second half used for CD8+ T cell isolation (negative selection kit, #19853; STEMCELL Technologies). Single-cell libraries were prepared using the 10X Genomics 5′ v2 scRNAseq kit following manufacturer instructions (10X Genomics). Sequencing was performed on an Illumina NovaSeq 6000 S2 flow cell (Illumina, Inc.) using 125 cycles—26 bp for read 1 containing the cell barcode (16 bp) and UMI (10 bp), and 91 bp for read 2, containing the biological read. Mapping and quantification of expression profiles was conducted using salmon (v1.8.0) and GRCm39 (GENCODE rel M29). Salmon used the –alevin parameter with library orientation to ISF. Transcript level counts were imported using the tximeta (v1.14.0) in R (v4.2) and creation of a SingleCellExperiment object. Quality control (QC) and normalization was completed by using scran (v1.24.0) and scater (v1.24.0). Briefly, cells with >25% mitochondrial reads were removed and low-quality cells, as assessed by perCellQCMetrics in the scater package, were removed using default guidelines. Normalization was first conducted using logNormCounts from the scuttle package (v1.6.2). Further normalization was implemented using the scater package. Doublet removal was conducted using computeDoubletDensity, a function in the scDblFinder package (v1.10.0).
After normalization and filtering of low-quality cells, the top 10% of highly variable genes were used to run a PCA analysis using denoisePCA, a scran function, setting ncomponents equal to 2. Clustering analysis was achieved by using principle components and using buildSNNGraph function in scater to identify and build shared nearest neighbors, where k = 10 in that function. Cluster_walktrap function in igraph (v1.3.2) was used for identifying clusters. Creation of the t-distributed stochastic neighbor embedding (t-SNE) and the uniform manifold and projection (UMAP) embedding and projections were completed using the runTSNE and runUMAP function, both from the scatter package, respectively. Cell clusters were identified and named using both gene expression and gene expression density using the plot_density() function from the Nebulosa (v1.6.0) package. Details explaining cluster identification are defined in Table S2. Subclustering for cluster “Teff” was performed by fitting a multicomponent mixture model as implemented in the Mclust package (v5.4.10) using Klrg1 and Cx3cr1 normalized counts to define potential subclusters. Models were chosen using the Bayesian information criterion, and the result was splitting cluster 4 into two separate clusters, “Teff” and “EM,” using the component threshold defined by the model. Statistics on violin plots were determined by Kruskal–Wallis test followed by a pairwise Wilcox comparison test with a Bonferroni P adjustment. Sequencing files for scRNAseq have been deposited at GEO (accession: GSE267377).
Flow cytometry, viability, and ICS
Single-cell suspensions were surface stained with fluorescently conjugated antibodies listed in Table S5. Cell viability was assessed by using Fixable Viability Dye eFluor 780 (eBioscience) according to the manufacturer’s protocols. To assess cytokine production, splenocytes were plated in the presence of PMA (50 ng/ml) and ionomycin (50 ng/ml) for 2 h and with brefeldin A (5 μg/ml) added for the last 2 h of stimulation prior to surface staining. After restimulation, cells were surface stained, fixed, and permeabilized using FoxP3/Transcription Factor Staining Buffer Set, followed by processing for intracellular staining using fluorescently labeled antibodies. For analysis of antigen-specific response to LmOVA or LCMV, splenocytes harvested 7 dpi were stimulated with OVA257-264 peptide or LCMV gp33-41, respectively, using previously published protocols (Ma et al., 2019; Staron et al., 2014). Flow cytometry was performed on Cytoflex (Beckman Coulter) or Aurora Cytek cytometers and cell sorting on Astrios (Beckman Coulter) or BD FACSAria Fusion cell sorters. Data analysis was performed using FlowJo software (Tree Star).
Extracellular flux analysis
T cell OCR and extracellular acidification rate (ECAR) were measured using a Seahorse XF96 Extracellular Flux Analyzer following established protocols (Kaymak et al., 2022; Ma et al., 2019). Activated and IL-2-expanded T cells (1.5 × 10⁵/well) were cultured in XF medium containing 5 mM glucose and 0.5 mM glutamine, following centrifugation onto poly-D-lysine-coated XF96 plates, and cellular bioenergetics was assessed at 5-min intervals following the sequential addition of oligomycin (2.0 μM), fluoro-carbonyl cyanide phenylhydrazone (FCCP, 2.0 μM), rotenone/antimycin A (2 μM), and monensin (10 mM). Data were normalized to cell number. Bioenergetics data analysis was based on protocols developed by Mookerjee and Brand (Mookerjee et al., 2018), which are available at https://russelljoneslab.vai.org.
Stable isotope labeling (SIL) and metabolomics
SIL experiments with in vitro–activated T cells using liquid chromatography (LC) or gas chromatography (GC) coupled to mass spectrometry (MS) were conducted as previously described (Sheldon et al., 2021; Kaymak et al., 2022). In brief, naïve CD8+ T cells were activated as above, washed in IMDM or VIM containing 10% dialyzed FBS, and recultured (2–2.5 × 10⁶ cells/well in 24-well plates) for indicated times in medium (IMDM or VIM) containing 13C-labeled metabolites (Cambridge Isotope Laboratories) at the following concentrations: [U-13C6]glucose, 5 or 25 mM; [U-13C2]acetate, 400 μM or 1 mM. Cells were transferred from tissue culture plates to microfuge tubes and centrifuged at 500 g and 4°C for 3 min. The cell pellet was washed with ice-cold saline and centrifuged before being snap frozen on dry-ice and stored at −80°C. Metabolites were extracted by modified Bligh-Dyer extraction upon the addition of ice-cold methanol (A456; Thermo Fisher Scientific) directly to frozen cells, to which one volume of chloroform (A456; Thermo Fisher Scientific) was added. The sample was vortexed for 10 s, incubated on ice for 30 min, and then 0.9 parts of LC-MS grade water (W6-4; Thermo Fisher Scientific) was added. The samples were vortexed vigorously and centrifuged at maximum speed to achieve phase separation. The top layer containing polar metabolites was aliquoted into a fresh tube and dried in a speedvac for LC-MS analysis. The bottom layer was retained for fatty acid methyl-ester (FAME) measurement.
For LC-MS analysis, metabolite extracts were resuspended in 50 μl of 60% acetonitrile (A955, Thermo Fisher Scientific) and analyzed by high resolution MS using an ID-X Orbitrap mass spectrometer (Thermo Fisher Scientific) coupled to a Thermo Vanquish Horizon LC system. 2 μl of sample volume was injected on the column. Chromatographic separations were accomplished with Acquity BEH Amide (1.7 µm, 2.1 × 150 mm) analytical columns (#176001909; Waters) fitted with a preguard column (1.7 µm, 2.1 × 5 mm; #186004799; Waters) using an elution gradient with a binary solvent system. Solvent A consisted of LC/MS grade water (W6-4; Thermo Fisher Scientific), and Solvent B was 90% LC/MS grade acetonitrile (A955; Thermo Fisher Scientific). For negative mode analysis, both mobile phases contained 10 mM ammonium acetate (A11450; Thermo Fisher Scientific), 0.1% (vol/vol) ammonium hydroxide, and 5 µM medronic acid (5191-4506; Agilent Technologies). For positive mode analysis, both mobile phases contained 10 mM ammonium formate (A11550; Thermo Fisher Scientific) and 0.1% (vol/vol) formic acid (A11710X1; Thermo Fisher Scientific). For both negative and positive mode analyses, the 20-min analytical gradient at a flow rate of 400 μl/min was 0–1.0 min ramp from 100% B to 90% B, 1.0–12.5 min from 90% B to 75% B, 12.5–19 min from 75% B to 60% B, and 19–20 min hold at 60% B. Following every analytical separation, the column was re-equilibrated for 20 min as follows: 0–1 min hold at 65% B at 400 μl/min, 1–3 min hold at 65% B and ramp from 400 μl/min to 800 μl/min, 3–14 min hold at 65% B and 800 μl/min, 14–14.5 min ramp from 65% B to 100% B at 800 μl/min, 14.5–16 min hold at 100% B and increase flow from 800 μl/min to 1,200 μl/min, 16–18.4 min hold at 100% B at 1,200 μl/min, 18.4–19.5 min hold at 100% B and decrease flow from 1,200 μl to 400 μl/min, 19.5–20 min hold at 100% B and 400 μl/min. The column temperature was maintained at 40°C. The H-ESI source was operated at spray voltage of 2,500 V (negative mode)/3,500 V (positive mode), sheath gas: 60 a.u., aux gas: 19 a.u., sweep gas: 1 a.u., ion transfer tube: 300°C, vaporizer: 300°C. For isotopically labeled experimental replicates, high resolution MS1 data was collected with a 20-min full-scan method with m/z scan range using quadrupole isolation from 70 to 1,000, mass resolution of 120,000 full width half maximum, radio frequency) lens at 35%, and standard automatic gain control (AGC). Unlabeled control samples were used for data dependent MS2 (ddMS2) fragmentation for compound identification and annotation via the AquireX workflow (Thermo Fisher Scientific). In this workflow, first blank and experimental samples are injected to generate exclusion and inclusion lists, respectively, followed by iterative sample injections for ddMS2 fragmentation where triggered ions are added to the exclusion list for subsequent injections. ddMS2 data was collected using MS1 resolution at 60,000, MS2 resolution at 30,000, intensity threshold at 2.0 × 10⁴, and dynamic exclusion after one trigger for 10 s. MS2 fragmentation was completed first with higher-energy collisional dissociation) using stepped collision energies at 20, 35, and 50%, and was followed on the next scan by collision-induced dissociation) fragmentation in assisted collision energy mode at 15, 30, and 45% with an activation Q of 0.25. Both MS2 scans used standard AGC and a maximum injection time of 54 ms. The total cycle time of the MS1 and ddMS2 scans was 0.6 s. Full scan LC-MS data were analyzed in Compound Discoverer (v3.2, Thermo Fisher Scientific). Compounds were identified by chromatography-specific retention time of external standards and MS2 spectral matching using the mzCloud database (Thermo Fisher Scientific).
TCA cycle intermediates were measured via GC-MS following LC-MS analysis. Briefly, following LC/MS, extracts were dried and derivatized with 30 μl of methoxyamine (11.4 mg/ml) in pyridine and 70 μl of N-tert-Butyldimethylsilyl-N-methyltrifluoroacetamide + 1% Trimethylchlorosilane, as described previously (Sheldon et al., 2021). In addition, GC-MS was used to evaluate the incorporation of 13C into de novo–synthesized fatty acids from metabolic precursors using FAMEs. The bottom organic fraction from the Bligh-Dyer extraction (above) was aliquoted, dried in a speedvac, and FAMEs were generated as described previously (Kaymak et al., 2022). GC-MS analysis of both tert-Butyldimethylsilyl derivatives and FAMEs was conducted on an Agilent 7890/5977b GC/MSD equipped with a DB-5MS+DG (30 m × 250 µm× 0.25 µm) capillary column (Agilent J&W). Data were collected by electron impact set at 70 eV. A total of 1 μl of the derivatized sample was injected in the GC in split mode (1:2 or 1:4) with an inlet temperature set to 280°C, using helium as a carrier gas with a column flow rate of 1.2 ml/min. The oven program for all metabolite analyses started at 95°C for 1 min, increased at a rate of 40°C/min until 118°C and held for 2 min, then increased to 250°C at a rate of 12°C/min, then increased to 320°C at a rate of 40°C/min, and finally held at 320°C for 7 min. The source temperature was 230°C, the quadrupole temperature was 150°C, and the GC-MS interface at 285°C. Data were acquired both in scan mode (50–800 m/z) and at 2 Hz.
MassHunter software (v10; Agilent Technologies) was used for peak picking and integration of GC-MS data. Peak areas of all isotopologues for a molecular ion of each compound in both labeled experimental and unlabeled control samples were used for mass isotopologue distribution analysis via a custom algorithm developed at VAI. This algorithm uses matrices correcting for the natural contribution of isotopologue enrichment and generated for each metabolite as described previously (Kaymak et al., 2022; Ma et al., 2019).
Protein extraction and immunoblotting
Histones were extracted using a histone extraction kit according to the manufacturer’s instructions. For total protein extraction, CD8+ T cells were lysed in a modified radioimmunoprecipitation assay lysis buffer supplemented with pro-ease and phosphatase inhibitors. Protein from histone extracts or whole-cell lysates was quantified using a Pierce BCA Protein Assay Kit. Lysates were resolved by SDS-PAGE, transferred to a polyvinylidine fluoride membrane, incubated with primary antibodies, and visualized using HRP-conjugated anti-rabbit and anti-mouse secondary antibodies, as listed in Table S5. Membranes were incubated with primary antibodies overnight at 4°C and then incubated with secondary antibody for 1 h at room temperature prior to exposure.
RNA isolation, sequencing, and quantitative PCR analysis
Total RNA was isolated from murine T cells via RNeasy Kit (Qiagen) with DNase digestion (Qiagen) following manufacturer’s instructions. Total RNA was reverse transcribed using a High-Capacity cDNA Reverse Transcriptase kit (Life Technologies). RNA preparation and library construction for RNAseq was conducted by the VAI Genomics Core as previously described (Roy et al., 2020). Libraries were sequenced on a NovaSeq 6000 (Illumina) using 50 bp paired-end sequencing (5 × 10⁷ reads/sample). Gene-set enrichment analysis on RNAseq data was conducted using the gage function and non-parametric Kolmogorov–Smirnov test from the GAGE (v2.22.0) R Bioconductor package (Luo et al., 2009). Processed data from the RNAseq experiments is available in Table S3.
For the meta-analysis in Fig. S1, raw sequences from RNAseq of CD8+ T cells from three previously published studies (GEO accessions: GSE89307, GSE84820, and GSE86881) were downloaded. Adaptor sequences and low-quality reads were trimmed using Trim Galore (v0.6.0). Trimmed reads were aligned to the mm10 reference genome using STAR (v2.7.8). Count tables of all samples were then imported into limma (v3.48.3), with a batch variable included in the design matrix to account for the different study designs and sequencing platforms. Batch corrected counts were then normalized using DESeq2 (vst normalization), and z scores were calculated and plotted in a heatmap. The heatmap was clustered based on T cell type (Teff, naïve, Tmem).
ATAC-seq
Isolated CD8 T cells from WT (Acly f/f Cd4Cre−) and Acly KO (Acly f/f Cd4Cre+) mice ±Acss2i (6.25 μM) in VIM media (Kaymak et al., 2022) ±1 mM acetate were activated with plate-bound anti-CD3ε (clone 2C11) and anti-CD28 (clone 37.51) antibodies (eBioscience) plus 50 U/ml IL2 (PeproTech) for 48 h. ATAC-seq and library creation was performed using 50,000 fresh cells per condition according to previously published protocols (Grandi et al., 2022). IDT for Illumina Set A sequencing adapters were used (Illumina). Libraries were sequenced on a NovaSeq 6000 (Illumina) using 50 bp paired-end sequencing (5 × 10⁷ reads/sample). Reads were trimmed using TrimGalore v0.6.10 (Krueger et al., 2021) in paired-end mode with default parameters and then aligned to the mm10 genome using “bwa mem” v0.7.17 (Li, 2013, Preprint), marking duplicate reads using SAMBLASTER v0.1.26 (Faust and Hall, 2014). For peak calling and differential accessibility analysis, alignments were quality-filtered, including removal of mitochondrial alignments, then deduplicated using “samtools view” v1.17 (Li et al., 2009), with the parameters “-q 30 -F 2828 -f 2” and “-F 1024,” respectively. To call peaks centered at cut sites, BAM files were converted to the BEDPE format using “bedtools bamtobed” v2.30.0 (Quinlan and Hall, 2010), with the parameters “-bedpe -mate1” followed by an AWK command to convert the resulting BEDPE file to BED format; “macs2 callpeak” v2.2.7.1 (Zhang et al., 2008) was used with the parameters, “--keep-dup “all” -g mm -f “BED” --shift -75 --extsize 150 --nomodel --call-summits -B --SPMR.” Output bedgraph files were converted to BigWig format using bedGraphToBigWig from UCSCtools.
Differential accessibility tests were run using csaw v1.34 (Lun and Smyth, 2016) with deduplicated read alignments and removal of mm10 ENCODE v2 blacklist regions (Amemiya et al., 2019). Background read counts were based on 10 kb non-overlapping windows, while high abundance read counts were based on 150 bp windows with default spacing and a cutoff of log2(2) enrichment over the background as calculated using the filterWindowsGlobal function. Normalization factors were calculated using the normFactors function with the background window reads. The differential binding tests were conducted using the quasi-likelihood workflow in edgeR v3.42.4 (McCarthy et al., 2012; Robinson et al., 2010) as described in the csaw guidebook. Using the overlapResults function, the tested windows were overlapped with the merged union of the peaks called by MACS2 for each sample as described above. Representative ATAC tracks were produced using IGV (Thorvaldsdóttir et al., 2013). GEO accession ID is GSE262865.
Statistical analysis
Data are presented as mean ± SD for technical replicates or mean ± SEM for biological replicates. Statistical analysis was assessed by GraphPad Prism software (GraphPad) using unpaired Student’s t test or one-way ANOVA. Statistical significance is indicated in all figures by the following annotations: *, P < 0.05; **, P < 0.01; ***, P < 0.001.
Online supplemental material
The supplementary information contains additional gene expression data in various clusters from our scRNAseq dataset and previously published RNAseq datasets (Fig. S1). It also contains additional flow profiling, metabolomics and tracing, and ATAC-seq analysis of Acly KO CD8 T cells from both CRISPR generated and derived from the Acly f/f Cd4cre mouse (Figs. S2, S3, and S4). Finally, the supplementary information contains additional flow profiling and ATAC-seq analysis of WT and Acly KO CD8 T cells with a knockdown or inhibition of ACSS2 (Fig. S5). Table S1 contains raw scores from the shRNA screen in Fig. 1 B. Table S2 contains logFC gene expression data among various clusters from the scRNAseq data in Fig. 1 D. Table S3 contains annotated logFC in gene expression between Acly KO and WT CD8 T cells from Fig. 3 A. Table S4 contains annotated DARs identified from ATAC-seq in Fig. 5 C and Fig. 7 C. Table S5 shows key reagents and resources.
Data availability
All unique/stable reagents generated in this study will be made available from the lead contact with a completed Materials Transfer Agreement. Plasmids generated in this study will be available on Addgene. Sequencing files for RNAseq (Fig. 3) have been deposited at GEO (accession: GSE270851). Sequencing files for ATAC-seq (Figs. 5 and 7) have been deposited at GEO (accession: GSE262865). Sequencing files for scRNAseq (Figs. 1 and 6) have been deposited at GEO (accession: GSE267377). All other data underlying main and supplemental figures are available in the published article and its online supplemental material.
Acknowledgments
We acknowledge Drs. Ralph DeBerardinis, Julian Lum, Sara Nowinski, Carolyn Anderson, scientists at Agios and Servier Pharmaceuticals, and members of the Jones and Krawczyk laboratories for scientific discussions contributing to this manuscript. We thank Jeanie Wedberg, Margene Brewer, and Michelle Minard for administrative assistance. We thank members of the VAI Core Facilities (Mass Spectrometry, Bioinformatics and Biostatistics, Flow Cytometry, and Vivarium) for technical assistance.
M.J. Watson is supported by a National Cancer Institute T32 training grant (T32CA251066-01A1) and a postdoctoral fellowship from the Daymon Runyon Foundation (2495-23). D.G. Roy is supported by the fonds de recherche du Québec—Santé and the Cancer Research Society (grant no. PJT 192049). C.M. Krawczyk is supported by the National Institute of Allergy and Infectious Diseases (NIAID, R21AI153997) and VAI. S. Ma is supported by Cancer Research Institute fellowship and Salk Pioneer Fund Postdoctoral Scholar Award. S.M. Kaech is supported by National Institutes of Health R01 AI066232 and R21 AI151986. R.G. Jones is supported by the Paul G. Allen Frontiers Group Distinguished Investigator Program, NIAID (R01AI165722), the Chan Zuckerberg Initiative, and VAI.
Author contributions: I. Kaymak: Conceptualization, Data curation, Investigation, Methodology, Visualization, Writing—original draft, Writing—review & editing, M.J. Watson: Formal analysis, Investigation, Visualization, Writing—original draft, Writing—review & editing, B.M. Oswald: Data curation, Formal analysis, Investigation, Methodology, Visualization, Writing—review & editing, S. Ma: Investigation, B.K. Johnson: Formal analysis, Visualization, Writing—original draft, L. DeCamp: Investigation, Methodology, B.M. Mabvakure: Formal analysis, Visualization, K. Luda: Investigation, E.H. Ma: Conceptualization, Formal analysis, K. Lau: Formal analysis, Z. Fu: Formal analysis, B. Muhire: Formal analysis, Methodology, Software, S.M. Kitchen-Goosen: Investigation, A.V. Ark: Investigation, M.S. Dahabieh: Conceptualization, Data curation, B. Samborska: Investigation, M. Vos: Visualization, H. Shen: Formal analysis, Supervision, Z.P. Fan: Data curation, Formal analysis, T.P. Roddy: Conceptualization, Funding acquisition, Project administration, Supervision, Writing—review & editing, G.A. Kingsbury: Conceptualization, Funding acquisition, C.M. Sousa: Conceptualization, Methodology, Resources, Supervision, C.M. Krawczyk: Conceptualization, Supervision, Writing—review & editing, K.S. Williams: Project administration, Supervision, Visualization, Writing—original draft, Writing—review & editing, R.D. Sheldon: Conceptualization, Data curation, Formal analysis, Investigation, Methodology, Project administration, Resources, Software, Supervision, Validation, Visualization, Writing—review & editing, S.M. Kaech: Investigation, Resources, Supervision, D.G. Roy: Investigation, Methodology, Writing—review & editing, R.G. Jones: Conceptualization, Data curation, Formal analysis, Funding acquisition, Methodology, Project administration, Resources, Supervision, Validation, Visualization, Writing—original draft, Writing—review & editing.

