


Long-term antitumor efficacy of chimeric antigen receptor (CAR) T cells depends on their functional persistence in vivo. T cells with stem-like properties show better persistence, but factors conferring bona fide stemness to T cells remain to be determined. Here, we demonstrate the induction of CAR T cells into an immortal-like and functional state, termed TIF. The induction of CARTIF cells depends on the repression of two factors, BCOR and ZC3H12A, and requires antigen or CAR tonic signaling. Reprogrammed CARTIF cells possess almost infinite stemness, similar to induced pluripotent stem cells while retaining the functionality of mature T cells, resulting in superior antitumor effects. Following the elimination of target cells, CARTIF cells enter a metabolically dormant state, persisting in vivo with a saturable niche and providing memory protection. TIF represents a novel state of T cells with unprecedented stemness, which confers long-term functional persistence of CAR T cells in vivo and holds broad potential in T cell therapies.

Introduction
Adoptive T cell therapy (ACT) stands as a cornerstone of cancer immunotherapy (Fesnak et al., 2016; Guedan et al., 2019; Restifo et al., 2012). The sustained therapeutic efficacy of ACT relies on the long-term persistence of adoptively transferred T cells (Chan et al., 2021; Gattinoni et al., 2012). In both human patients and mouse models, T cells exhibiting a memory, stem-like, or precursor phenotype have demonstrated superior therapeutic outcomes (Gattinoni et al., 2009, 2011; Hinrichs et al., 2009; Klebanoff et al., 2005; Krishna et al., 2020). Consequently, inducing stem-like properties in endogenous or adoptively transferred T cells has emerged as a pivotal objective in cancer immunotherapy (Chan et al., 2021; Gattinoni et al., 2012). Stem-like T cells, including central memory T (TCM) cells (Graef et al., 2014), memory stem T (TSCM) cells (Gattinoni et al., 2009, 2011), and precursor exhausted T (TPEX) cells (He et al., 2016; Im et al., 2016; Leong et al., 2016; Utzschneider et al., 2016; Wu et al., 2016), have thus been extensively investigated due to their paramount importance in immunity and immunotherapy. Nonetheless, the efficient generation of large numbers of T cells with authentic stemness for ACT remains an unresolved challenge.
The obstacles to producing large quantities of stem-like T cells, often rendering it difficult, if not impossible, stem from the intrinsic characteristics of both T cell responses and stem cells. A defining feature of T cell responses is the massive contraction following clonal expansion (Williams and Bevan, 2007), which results in only a few cells persisting to provide memory protection (Kaech and Cui, 2012). Consequently, sustaining abundant antigen-specific T cells beyond the peak response contradicts the natural dynamics of T cell response. Similarly, the scarcity of cells capable of self-renewal, such as stem and precursor cells, is evident in adult organisms (Rossi et al., 2008). Thus, the endeavor to generate and maintain substantial numbers of stem-like cells does not align with the scarcity of stem cells in nature. Moreover, stemness typically conflicts with functionality. Imparting stemness upon mature cells through cellular reprogramming, such as inducing pluripotent stem cells (iPSCs) (Takahashi and Yamanaka, 2006), inevitably results in the loss of the cell’s original identity and function, rendering it unsuitable for disease therapy (Rando and Chang, 2012). The challenge of reprogramming differentiated mature cells to acquire bona fide stemness while preserving their identity and physiological function remains elusive (Rando and Chang, 2012).
Results
Induction of immortal-like and functional CD19 CAR T (CAR19TIF) cells by repressing ZC3H12A and BCOR
After CD19 CAR T (CAR19T) cell therapy for B cell malignancies, relapse is a prevalent issue, primarily due to antigen loss or the poor persistence of CAR T cells (Chong et al., 2021). While targeting alternative B cell antigens such as CD22 and BCMA can help mitigate antigen loss, the challenge of insufficient CAR T cell persistence remains a significant obstacle to achieving enduring efficacy. CAR19T cells are capable of recognizing both normal and malignant B cells. Despite the elimination of mature B cells during the initial response, hematopoietic stem cells (HSCs) continue to generate CD19+ progenitor cells that cannot be entirely eradicated. Indeed, the resurgence of CD19+ normal B cells in the periphery serves as an early indicator of relapse following CAR19T cell treatment (Maude et al., 2014).
To replicate the clinical scenario where infused CAR19T cells must engage normal B cells, we utilized a previously published CD19 CAR targeting mouse CD19 (mCD19) (Kochenderfer et al., 2010) (Fig. 1 A). T cells transduced with this mCD19 CAR demonstrated the ability to eliminate both endogenous and malignant B cells when combined with lymphodepleting conditioning (Kochenderfer et al., 2010). However, in the absence of conditioning, CAR19T cells neither expanded nor effectively targeted CD19+ cells in immunocompetent mice (Kochenderfer et al., 2010). This underscores the crucial role of chemotherapeutic conditioning as a fundamental aspect of CAR T cell therapy in clinical practice. Our experiments confirmed that CAR19T cells failed to proliferate or eradicate CD19+ cells in immunocompetent mice without conditioning (Fig. S1, A–C). To develop a conditioning-free and durable CAR T cell therapy for immunocompetent hosts, all ACT procedures in this study were conducted without any conditioning regimens, including chemotherapeutic treatments (e.g., cyclophosphamide and/or fludarabine), total body irradiation, vaccination, cytokine infusion, etc.

Ablation of ZC3H12A and BCOR induces immortal-like and functional CAR19T IF cells. (A) The composition of the anti-mCD19 CAR. (B) Vector design of pMSCV-sgRNA-CAR19. Thy1.1 is coexpressed with CAR at the protein level via P2A, serving as a marker of CAR expression. (C) Experimental design. CD8+Cas9+ T cells were activated by anti-CD3/anti-CD28 (1 μg/ml), infected with retrovirus expressing CAR19 with sgRNA targeting indicated genes. 1 million CD8+Thy1.1+ CAR19T cells were transferred into B6 mice. CAR19T cells and B cells from peripheral blood were monitored by flow cytometry. (D–F) Representative plots (D) and statistical analysis (E and F) of Thy1.1+ CAR19T cells and CD19+ B cells among single live cells from peripheral blood 7 and 28 days after transfer are shown (n = 4 mice for each group). (G) Experimental design for genome-wide dual sgRNA screening for genes whose loss of function confers persistence to ZC3H12A-deficient CAR19T cells. The indicated sgRNA library was used to infect activated CD8+ T cells, and 150 million CAR19T cells were transferred into 50 B6 mice (3 million per mouse). 7 days and 3 mo later, Thy1.1+ CAR19T cells were sorted from the spleen for sgRNA analysis. (H) Screening result. (I and J) Representative plots (I) and statistical analysis (J) of Thy1.1+ CAR19T cells and CD19+ B cells among single live cells from peripheral blood of mice transferred with CAR19TIF cells expressing indicated sgRNAs are shown (n = 3 mice in PBS group, n = 6 mice in sgNT group, n = 5 mice in sgZc3h12a group, n = 5 mice in sgBcor/Zc3h12a group). (K) Percentages of CD19+ B cells from the spleen of mice 6 mo after transferring CAR19TIF cells expressing indicated sgRNAs (n = 4 mice in sgNT group, n = 5 mice in sgBcor/Zc3h12a group). (L and M) Representative plots (L) and statistical analysis (M) of Thy1.1+ CAR19T cells expressing indicated sgRNA and CD19+ B cells among single live cells from spleen 7 days after transfer are shown (n = 4 mice for each group). (E, F, J, K, and M) Data represent mean ± SEM from one of three independent experiments. *P < 0.05, ****P < 0.0001, ns, not significant, one-way ANOVA multiple-comparisons test in E and F, two-way ANOVA multiple-comparisons test in J, two-tailed unpaired Student’s t test in K and M.
Ablation of ZC3H12A and BCOR induces immortal-like and functional CAR19T IF cells. (A) The composition of the anti-mCD19 CAR. (B) Vector design of pMSCV-sgRNA-CAR19. Thy1.1 is coexpressed with CAR at the protein level via P2A, serving as a marker of CAR expression. (C) Experimental design. CD8+Cas9+ T cells were activated by anti-CD3/anti-CD28 (1 μg/ml), infected with retrovirus expressing CAR19 with sgRNA targeting indicated genes. 1 million CD8+Thy1.1+ CAR19T cells were transferred into B6 mice. CAR19T cells and B cells from peripheral blood were monitored by flow cytometry. (D–F) Representative plots (D) and statistical analysis (E and F) of Thy1.1+ CAR19T cells and CD19+ B cells among single live cells from peripheral blood 7 and 28 days after transfer are shown (n = 4 mice for each group). (G) Experimental design for genome-wide dual sgRNA screening for genes whose loss of function confers persistence to ZC3H12A-deficient CAR19T cells. The indicated sgRNA library was used to infect activated CD8+ T cells, and 150 million CAR19T cells were transferred into 50 B6 mice (3 million per mouse). 7 days and 3 mo later, Thy1.1+ CAR19T cells were sorted from the spleen for sgRNA analysis. (H) Screening result. (I and J) Representative plots (I) and statistical analysis (J) of Thy1.1+ CAR19T cells and CD19+ B cells among single live cells from peripheral blood of mice transferred with CAR19TIF cells expressing indicated sgRNAs are shown (n = 3 mice in PBS group, n = 6 mice in sgNT group, n = 5 mice in sgZc3h12a group, n = 5 mice in sgBcor/Zc3h12a group). (K) Percentages of CD19+ B cells from the spleen of mice 6 mo after transferring CAR19TIF cells expressing indicated sgRNAs (n = 4 mice in sgNT group, n = 5 mice in sgBcor/Zc3h12a group). (L and M) Representative plots (L) and statistical analysis (M) of Thy1.1+ CAR19T cells expressing indicated sgRNA and CD19+ B cells among single live cells from spleen 7 days after transfer are shown (n = 4 mice for each group). (E, F, J, K, and M) Data represent mean ± SEM from one of three independent experiments. *P < 0.05, ****P < 0.0001, ns, not significant, one-way ANOVA multiple-comparisons test in E and F, two-way ANOVA multiple-comparisons test in J, two-tailed unpaired Student’s t test in K and M.
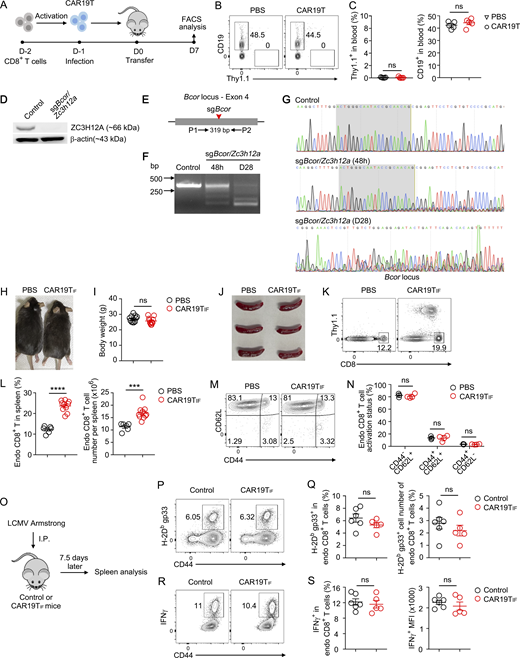
Wild-type CAR19T cells do not expand in immunocompetent mice, and CAR19TIFcells persisting in vivo does not cause side effects. (A) Experimental design. CD8+ T cells were activated and transduced with retrovirus expressing CAR19 with a Thy1.1 marker. 1 million CD8+Thy1.1+ CAR19T cells were transferred into B6 mice, with PBS as a control. After 7 days, Thy1.1+ CAR19T cells and CD19+ B cells from the spleen were examined by flow cytometry. (B and C) Representative plots (B) and statistical analysis (C) of Thy1.1+ CAR19T cells and CD19+ B cells among single live cells from spleen 7 days after transfer are shown (n = 5 mice for each group). (D) Immunoblot analysis of ZC3H12A expression in CD8+Thy1.1− (control) and CD8+Thy1.1+ (sgBcor/Zc3h12a) T cells 4 days after transduction. β-Actin was used as a loading control. (E) PCR detection of indels in Bcor loci. The red arrow indicates the cleavage site of sgBcor. A pair of PCR primers spanning the cleavage site of Cas9/sgBcor was used to amplify the indicated genomic region. (F) Editing of Bcor loci at 48 h after transduction and 28 days after transfer was examined by PCR. (G) Editing of Bcor was examined by DNA sequencing. The PCR products from F were sequenced. Shaded regions indicate sgRNA binding sites. Representative tracks of sequencing results are shown. (H) Representative images of mice 6 mo after receiving CAR19TIF cells or PBS transfer. (I) Body weight of mice 6 mo after receiving CAR19TIF cells or PBS transfer (n = 11 mice for each group). (J) Representative images of spleen from mice 2 mo after receiving CAR19TIF cells or PBS transfer. (K and L) Flow cytometry analysis of endogenous CD8+ T cells from spleen of mice 2 mo after receiving CAR19TIF cells or PBS transfer. Representative plots (K) and statistical analysis (L) are shown (n = 6 mice in PBS group, n = 10 mice in CAR19TIF group). (M and N) Flow cytometry analysis of activation status of endogenous CD8+ T cells from spleen of mice 2 mo after receiving CAR19TIF cells or PBS transfer. Representative plots (M) and statistical analysis (N) are shown (n = 3 mice in PBS group, n = 4 mice in CAR19TIF group). (O) Experimental design. (P and Q) Representative plots (P) and statistical analysis (Q) of H-2Db gp33+ CD8+ T cells in spleen 7.5 days after LCMV Armstrong infection. (R and S) Representative plots (R) and statistical analysis (S) of IFNγ+ CD8+ T cells in spleen 7.5 days after LCMV Armstrong infection. n = 5 or 6 mice in each group. (C, I, L, N, Q, and S) Data represent mean ± SEM from one of three independent experiments. ***P < 0.001, ****P < 0.0001, ns, not significant, two-tailed unpaired Student’s t test. Source data are available for this figure: SourceData FS1.
Wild-type CAR19T cells do not expand in immunocompetent mice, and CAR19TIFcells persisting in vivo does not cause side effects. (A) Experimental design. CD8+ T cells were activated and transduced with retrovirus expressing CAR19 with a Thy1.1 marker. 1 million CD8+Thy1.1+ CAR19T cells were transferred into B6 mice, with PBS as a control. After 7 days, Thy1.1+ CAR19T cells and CD19+ B cells from the spleen were examined by flow cytometry. (B and C) Representative plots (B) and statistical analysis (C) of Thy1.1+ CAR19T cells and CD19+ B cells among single live cells from spleen 7 days after transfer are shown (n = 5 mice for each group). (D) Immunoblot analysis of ZC3H12A expression in CD8+Thy1.1− (control) and CD8+Thy1.1+ (sgBcor/Zc3h12a) T cells 4 days after transduction. β-Actin was used as a loading control. (E) PCR detection of indels in Bcor loci. The red arrow indicates the cleavage site of sgBcor. A pair of PCR primers spanning the cleavage site of Cas9/sgBcor was used to amplify the indicated genomic region. (F) Editing of Bcor loci at 48 h after transduction and 28 days after transfer was examined by PCR. (G) Editing of Bcor was examined by DNA sequencing. The PCR products from F were sequenced. Shaded regions indicate sgRNA binding sites. Representative tracks of sequencing results are shown. (H) Representative images of mice 6 mo after receiving CAR19TIF cells or PBS transfer. (I) Body weight of mice 6 mo after receiving CAR19TIF cells or PBS transfer (n = 11 mice for each group). (J) Representative images of spleen from mice 2 mo after receiving CAR19TIF cells or PBS transfer. (K and L) Flow cytometry analysis of endogenous CD8+ T cells from spleen of mice 2 mo after receiving CAR19TIF cells or PBS transfer. Representative plots (K) and statistical analysis (L) are shown (n = 6 mice in PBS group, n = 10 mice in CAR19TIF group). (M and N) Flow cytometry analysis of activation status of endogenous CD8+ T cells from spleen of mice 2 mo after receiving CAR19TIF cells or PBS transfer. Representative plots (M) and statistical analysis (N) are shown (n = 3 mice in PBS group, n = 4 mice in CAR19TIF group). (O) Experimental design. (P and Q) Representative plots (P) and statistical analysis (Q) of H-2Db gp33+ CD8+ T cells in spleen 7.5 days after LCMV Armstrong infection. (R and S) Representative plots (R) and statistical analysis (S) of IFNγ+ CD8+ T cells in spleen 7.5 days after LCMV Armstrong infection. n = 5 or 6 mice in each group. (C, I, L, N, Q, and S) Data represent mean ± SEM from one of three independent experiments. ***P < 0.001, ****P < 0.0001, ns, not significant, two-tailed unpaired Student’s t test. Source data are available for this figure: SourceData FS1.
CD19 is a self-protein expressed by mature B cells and their progenitors, making CAR19T cells inherently autoreactive. The precise reasons underlying the inability of CAR19T cells to expand in immunocompetent mice remain elusive (Kochenderfer et al., 2010). Intriguingly, in autoimmune diseases, autoreactive T cells exhibit efficient expansion and provoke sustained tissue damage in both lymphoreplete mice and humans (Collier et al., 2021). This paradox prompted us to explore whether we could harness the mechanisms of autoimmunity to promote the expansion of CAR19T cells in immunocompetent mice without conditioning. Through an extensive literature search, we identified genes whose loss of function in effector T cells could trigger the spontaneous expansion of T cells. Based on the severity of autoimmune phenotypes observed in mice, we ranked Bcl2l11/Fas double deficiency (Hughes et al., 2008; Hutcheson et al., 2008; Weant et al., 2008), Ctla4 deficiency (Waterhouse et al., 1995), Tgfbr2 deficiency (Li et al., 2006), and Zc3h12a deficiency (Uehata et al., 2013) as top candidates.
We designed a vector capable of expressing both sgRNA and mCD19 CAR from independent promoters, alongside a Thy1.1 marker (Fig. 1 B). This vector enabled the generation of CAR19T cells with genes targeted by sgRNA in a single step upon delivery into Cas9-expressing T cells. Using this platform, we generated CAR19T cells with sgRNA targeting Bcl2l11/Fas, Ctla4, Tgfbr2, or Zc3h12a, while non-targeting (NT) sgRNA served as a negative control (Fig. 1 C). Upon transferring these gene-targeted CD8+ CAR19T cells into C57BL/6 (B6) mice, only CAR19T cells with sgRNA targeting Zc3h12a exhibited expansion and clearance of endogenous CD19+ B cells by day 7 after transfer (Fig. 1, D–F). However, by the 4-wk mark, ZC3H12A-deficient CAR19T cells vanished and B cells began to rebound (Fig. 1, D–F), closely resembling the relapse scenario observed after CAR19T cell therapy (Maude et al., 2014). Consequently, while ZC3H12A deficiency can enhance the expansion of CAR19T cells, resulting in transient B cell elimination, these cells do not persist to establish lasting memory.
We then aimed to identify additional genes whose loss of function could enhance the persistence of ZC3H12A-deficient CAR19T cells. To accomplish this, we adapted our vector to simultaneously express two sgRNAs along with mCD19 CAR (Fig. 1 G). One sgRNA was designed to target Zc3h12a, while the other was selected from a genome-wide sgRNA library targeting protein-coding genes in the mouse genome (Fig. 1 G) (Doench et al., 2016). We transferred ∼150 million CAR19T cells with sgRNAs targeting Zc3h12a and an unknown gene into 50 mice (3 million cells per mouse) and harvested CD8+Thy1.1+ cells from these mice after 7 days and 3 mo after transfer for deep sequencing analysis of sgRNA enrichment (Fig. 1 G).
Our screening revealed BCOR as the top hit (Fig. 1 H), a transcription repressor with no known roles in T cell persistence (Huynh et al., 2000). For validation, we transferred CAR19T cells expressing sgNT (non-targeting), sgZc3h12a, or sgBcor and sgZc3h12a (sgBcor/Zc3h12a) into B6 mice and monitored B cells and CAR19T cells in the peripheral blood at various time points. As anticipated, ZC3H12A-deficient CAR19T cells exhibited rapid contraction after expansion (Fig. 1, I and J). In contrast, ZC3H12A- and BCOR-double deficient CAR19T cells expanded to a similar extent as ZC3H12A-deficient CAR19T cells but showed limited contraction (Fig. 1, I and J). Consistently, there was no B cell rebound in the peripheral blood of these mice after 6 mo (Fig. 1 K).
As a control, BCOR deficiency alone could not expand CAR19T cells (Fig. 1, L and M), indicating that BCOR deficiency must act on top of ZC3H12A deficiency to promote the persistence of CAR19T cells. The editing of the Zc3h12a gene was validated by immunoblot (Fig. S1 D), and the editing of Bcor gene was confirmed by DNA sequencing due to the lack of a suitable antibody for mouse BCOR protein (Fig. S1, E–G). Although the initial editing efficiency of Bcor (2 days after transduction) was relatively low, the Bcor locus in all CD8+Thy1.1+ cells isolated from mice 1 mo after transfer was edited (Fig. S1, F and G), indicating strong selection for cells devoid of BCOR.
In summary, through two rounds of screening, we discovered that the suppression of two genes in the mouse genome, Zc3h12a and Bcor, induced CAR19T cells capable of expansion, persistence, and inducing long-term B cell depletion in immunocompetent mice without any conditioning. For simplicity, and based on the rationale detailed below, we have termed these CAR19T cells lacking ZC3H12A and BCOR as CAR19TIF cells, reflecting their immortal-like and functional characteristics (see below).
CAR19TIF cells possess nearly infinite stemness but are not transformed
To assess the stem-like properties of CAR19TIF cells, we conducted serial transfer experiments (Fig. 2 A). In each transfer, ∼2 million CAR19TIF cells from the last generation of recipients were transferred into a new batch of mice (Fig. 2 A). Surprisingly, after six successive transfers, the percentages and cell numbers of splenic CAR19TIF cells from the sixth recipients (6°) were comparable with those of primary recipients (1°) (Fig. 2, B–D). Notably, all CD19+ cells were eradicated in each generation of recipients (Fig. 2 E), affirming the functionality of CAR19TIF cells during serial transfers. HSCs, the bona fide adult stem cells, typically cease replication and repopulation after three to four serial transfers (Cudkowicz et al., 1964; Siminovitch et al., 1964). Hence, the self-renewing capability of CAR19TIF cells surpasses that of HSCs and resembles that of iPSCs, which exhibit infinite self-renewal potential (Martello and Smith, 2014). However, it’s important to note that CAR19TIF cells could not survive in vitro (Fig. 2 F), nor in NSG mice (see below), confirming that CAR19TIF cells do not undergo transformation.

CAR19T IF cells are immortal-like and super-functional, which have a saturable niche in vivo. (A) Experimental design of the serial transfer of CAR19TIF cells in B6 mice. (B–E) Representative plots (B) and statistical analysis (C–E) of Thy1.1+ CAR19TIF cells and CD19+ B cells from spleen 1 mo after transfer are shown (n = 3 mice in PBS group, n = 4 mice in 1° group, n = 5 mice in 2° group, n = 4 mice in 3° group, n = 6 mice in 4° group, n = 6 mice in 5° group, n = 6 mice in 6° group). (F) Survival of CAR19TIF cells in vitro. CAR19TIF and endogenous CD8+ T cells isolated from mice receiving CAR19TIF cells 1 mo after transfer were cultured in vitro in T cell medium for indicated hours, and the number of live cells was counted (n = 4 replicates for each group). (G) Experimental design of transferring different numbers of CAR19TIF cells into B6 mice. (H–K) Representative plots (H) and statistical analysis (I–K) of Thy1.1+ CAR19TIF cells and CD19+ B cells from spleen 1 mo after transfer are shown (n = 3 mice in PBS group, n = 6 mice in 5 × 10⁶ group, n = 4 mice in 5 × 10⁵ group, n = 5 mice in 5 × 10⁴ group, n = 4 mice in 5 × 10³ group, n = 3 mice in 5 × 10² group). (C–F and I–K) Data represent mean ± SEM from one of three independent experiments. *P < 0.05, **P < 0.01, ***P < 0.001, ****P < 0.0001, ns, not significant, one-way ANOVA multiple-comparisons test in C–E and I–K, two-way ANOVA multiple-comparisons test in F.
CAR19T IF cells are immortal-like and super-functional, which have a saturable niche in vivo. (A) Experimental design of the serial transfer of CAR19TIF cells in B6 mice. (B–E) Representative plots (B) and statistical analysis (C–E) of Thy1.1+ CAR19TIF cells and CD19+ B cells from spleen 1 mo after transfer are shown (n = 3 mice in PBS group, n = 4 mice in 1° group, n = 5 mice in 2° group, n = 4 mice in 3° group, n = 6 mice in 4° group, n = 6 mice in 5° group, n = 6 mice in 6° group). (F) Survival of CAR19TIF cells in vitro. CAR19TIF and endogenous CD8+ T cells isolated from mice receiving CAR19TIF cells 1 mo after transfer were cultured in vitro in T cell medium for indicated hours, and the number of live cells was counted (n = 4 replicates for each group). (G) Experimental design of transferring different numbers of CAR19TIF cells into B6 mice. (H–K) Representative plots (H) and statistical analysis (I–K) of Thy1.1+ CAR19TIF cells and CD19+ B cells from spleen 1 mo after transfer are shown (n = 3 mice in PBS group, n = 6 mice in 5 × 10⁶ group, n = 4 mice in 5 × 10⁵ group, n = 5 mice in 5 × 10⁴ group, n = 4 mice in 5 × 10³ group, n = 3 mice in 5 × 10² group). (C–F and I–K) Data represent mean ± SEM from one of three independent experiments. *P < 0.05, **P < 0.01, ***P < 0.001, ****P < 0.0001, ns, not significant, one-way ANOVA multiple-comparisons test in C–E and I–K, two-way ANOVA multiple-comparisons test in F.
6 mo after transfer of CAR19TIF cells, all recipient mice appeared healthy (Fig. S1 H), maintaining normal body weights (Fig. S1 I). Notably, spleen histology showed no evidence of cell overgrowth or inflammatory responses in mice with CAR19TIF cells (Fig. S1 J). Although there was a slight increase in endogenous CD8+ T cell numbers in CAR19TIF cell–transferred mice (Fig. S1, K and L), likely attributed to the absence of B cells, the majority of these cells retained a naive phenotype (Fig. S1, M and N). These findings suggest that while CAR19TIF cells persist in significant numbers in vivo, they do not elicit overt side effects.
To evaluate whether CAR19TIF cell presence influences the endogenous T cell response, mice were challenged with LCMV Armstrong virus (Fig. S1 O). Mice harboring CAR19TIF cells mounted CD8+ T cell responses to LCMV Armstrong comparable with that of control mice (Fig. S1, P–S), indicating that CAR19TIF cells do not interfere with the endogenous CD8+ T cell response during viral infection.
In the serial transfer experiments described above (Fig. 2, A–E), donor CAR19TIF cells were isolated from the spleen for simplicity. To investigate whether CAR19TIF cells in other tissues also possess stemness, we conducted serial transfer experiments using CAR19TIF cells isolated from the bone marrow (BM) and liver (Fig. S2 A). Remarkably, in both secondary and tertiary transfers, CAR19TIF cells from either the BM or liver expanded and effectively eliminated all B cells in the spleen, BM, and liver of the recipient mice (Fig. S2, B and C), highlighting the superior stemness of CAR19TIF cells from both BM and liver.

Stemness of CAR19T IF cells and their phenotypical changes before and after transfer. (A) Experimental design for serial transfer of CAR19TIF cells from bone marrow (BM) and liver. (B and C) Representative plots (B) and statistical analysis (C) of Thy1.1+ CAR19TIF cells and CD19+ B cells from spleen, BM, and liver 1 mo after transfer are shown (n = 6 mice for each group). The data in C represent mean ± SEM from one of two independent experiments. **P < 0.01, ****P < 0.0001, ns, not significant, one-way ANOVA multiple-comparisons test. (D) Experimental design of serial transfer of carboxyfluorescein succinimidyl ester (CFSE)-labeled CAR19TIF cells. FACS-sorted CAR19TIF cells were labeled with CFSE and transferred into B6 mice. (E) Representative plots of CFSE labeling and its dilution in CAR19TIF cells before and after transfer are shown (n = 4 mice for each group). (F–J) Cell expansion (F and G) and phenotypical changes (H–J) were examined by flow cytometry at indicated days after transfer (n = 4 mice for each group). (K) Flow cytometry analysis of phenotypic changes of CAR19TIF cells after coculture with B cells. CAR19TIF cells isolated from the spleen of 3° donor mice and B cells isolated from the spleen of B6 mice were cocultured at a 1:1 ratio for 24 h. The expression of indicated proteins was examined by flow cytometry (n = 5 replicates for each group). The data in G–K represent mean ± SEM from one of three independent experiments. **P < 0.01, ****P < 0.0001, ns, not significant, two-way ANOVA multiple-comparisons test in H–J, two-tailed unpaired Student’s t test in K.
Stemness of CAR19T IF cells and their phenotypical changes before and after transfer. (A) Experimental design for serial transfer of CAR19TIF cells from bone marrow (BM) and liver. (B and C) Representative plots (B) and statistical analysis (C) of Thy1.1+ CAR19TIF cells and CD19+ B cells from spleen, BM, and liver 1 mo after transfer are shown (n = 6 mice for each group). The data in C represent mean ± SEM from one of two independent experiments. **P < 0.01, ****P < 0.0001, ns, not significant, one-way ANOVA multiple-comparisons test. (D) Experimental design of serial transfer of carboxyfluorescein succinimidyl ester (CFSE)-labeled CAR19TIF cells. FACS-sorted CAR19TIF cells were labeled with CFSE and transferred into B6 mice. (E) Representative plots of CFSE labeling and its dilution in CAR19TIF cells before and after transfer are shown (n = 4 mice for each group). (F–J) Cell expansion (F and G) and phenotypical changes (H–J) were examined by flow cytometry at indicated days after transfer (n = 4 mice for each group). (K) Flow cytometry analysis of phenotypic changes of CAR19TIF cells after coculture with B cells. CAR19TIF cells isolated from the spleen of 3° donor mice and B cells isolated from the spleen of B6 mice were cocultured at a 1:1 ratio for 24 h. The expression of indicated proteins was examined by flow cytometry (n = 5 replicates for each group). The data in G–K represent mean ± SEM from one of three independent experiments. **P < 0.01, ****P < 0.0001, ns, not significant, two-way ANOVA multiple-comparisons test in H–J, two-tailed unpaired Student’s t test in K.
To assess whether the stemness of CAR19TIF cells is attributed to a subset of cells with reduced proliferation, we integrated CFSE labeling into the serial transfer experiments to monitor cell division (Fig. S2 D). In theory, CAR19TIF cells displaying high CFSE levels would exhibit slower proliferation and potentially retain stem-like characteristics. Surprisingly, we observed that CAR19TIF cells with the lowest CFSE levels in each transfer generation retained the ability to proliferate extensively and repopulate subsequent hosts (Fig. S2 E). These findings suggest that even CAR19TIF cells undergoing substantial proliferation in prior hosts maintain stemness essential for repopulating naive hosts.
Analysis of CAR19TIF cells before and after transfer revealed reversible phenotypic alterations. Pretransfer CAR19TIF cells from the spleen exhibited a CD62L+CD69− phenotype and were smaller than endogenous CD8+ T cells (Fig. S2, F–J). Upon transfer into new hosts, CAR19TIF cells underwent rapid activation, characterized by increased cell size, upregulation of CD69, and partial downregulation of CD62L (Fig. S2, F–J). This activation process could be recapitulated by stimulating CAR19TIF cells with B cells in vitro (Fig. S2 K). 4 wk after transfer, all these phenotypic changes reverted to pretransfer levels (Fig. S2, F–J). However, CAR19TIF cells exhibited limited contraction after extensive expansion (Fig. S2, F and G).
We conducted single-cell T cell receptor (TCR) sequencing (scTCR-seq) experiments to monitor the clonality of CAR19TIF cells during serial transfers (Fig. S3 A). In primary recipients, we identified 2,604 clones of CAR19TIF cells in the spleen out of 20,000 sequenced cells (Fig. S3 B), representing ∼0.05% of the total splenic CAR19TIF cells at 4 wk after transfer. Notably, the largest clone constituted 6.05% of the total sequenced cells (Fig. S3 B), indicating a remarkably diverse TCR repertoire of CAR19TIF cells in primary recipients. Subsequently, 2 million splenic CAR19TIF cells (∼5% of the total CAR19TIF cells from primary recipients) were transferred to secondary recipients (Fig. S3 A). After an additional 4 wk, 2 million splenic CAR19TIF cells from secondary recipients were transferred to tertiary recipients (Fig. S3 A). 4 wk later, scTCR-seq analysis of splenic CAR19TIF cells from tertiary recipients revealed 721 clones out of 20,000 sequenced cells, with the largest clone representing 44.8% of the total sequenced cells (Fig. S3 C).

Clonality of CAR19T IF cells. (A) Experimental setup for scTCR-seq. (B) TCR repertoire of CAR19TIF cells in primary recipients. CDR3 amino acid sequences of the top five clones are shown. (C) TCR repertoire of CAR19TIF cells in tertiary recipients. CDR3 amino acid sequences of the top five clones are shown. (D) An alluvial plot of clonotype comparison of the top four clonotypes in primary and tertiary recipients.
Clonality of CAR19T IF cells. (A) Experimental setup for scTCR-seq. (B) TCR repertoire of CAR19TIF cells in primary recipients. CDR3 amino acid sequences of the top five clones are shown. (C) TCR repertoire of CAR19TIF cells in tertiary recipients. CDR3 amino acid sequences of the top five clones are shown. (D) An alluvial plot of clonotype comparison of the top four clonotypes in primary and tertiary recipients.
Although CAR19TIF cells in tertiary recipients comprised <0.25% (5% × 5%, without accounting for the actual intake of transferred cells, ∼10% with intravenous injection) of splenic CAR19TIF cells in primary recipients, they retained 27.6% of the original diversity (721 out of 2,604 clones) after two consecutive transfers. This underscores that numerous clones from primary recipients have the opportunity to proliferate in tertiary hosts. Notably, the largest clone of CAR19TIF cells in tertiary recipients differed from the largest clone in primary recipients (Fig. S3 D), indicating that individual clones possess relatively equal opportunities to repopulate hosts upon retransfer. The dominance of the CAR19TIF population upon transfer into the next generation of recipients is not dictated solely by the largest clone from the previous generation. Furthermore, such clonality of CAR19TIF cells mirrors that observed in CAR T cells in other investigations (Shah et al., 2019; Sheih et al., 2020), suggesting that depletion of BCOR and ZC3H12A does not markedly alter the clonality of CAR T cells.
To eliminate concerns regarding potential off-target effects of sgRNAs targeting Bcor and/or Zc3h12a, we employed an alternative set of sgRNAs to generate CAR19TIF cells. We successfully induced, maintained, and serially transferred CAR19TIF cells in B6 mice using this distinct set of sgRNAs (data not shown), affirming that the induction of CAR19TIF cells is not due to off-target effects of sgRNAs.
Collectively, these findings demonstrate that CAR19TIF cells exhibit an almost infinite self-renewing capacity akin to iPSCs, while simultaneously retaining the functional attributes of mature T cells.
CAR19TIF cells are super-functional and have a saturable niche in vivo
We administered varying numbers of CAR19TIF cells into B6 mice, ranging from 5,000,000 to 500 cells, and examined the recovered cells from the spleen after 6 wk (Fig. 2 G). Remarkably, despite a 10,000-fold difference in cell input, CAR19TIF cells exhibited similar percentages and cell numbers across different groups (Fig. 2, H–J), indicating a saturable niche for CAR19TIF cells in vivo. Strikingly, as few as 500 CAR19TIF cells were sufficient to eradicate all the hundreds of millions of endogenous B cells in recipient mice without any conditioning and reconstitute their own compartment (Fig. 2, H–K), highlighting the exceptional functionality of CAR19TIF cells.
We assessed the distribution of CAR19TIF cells in mice (Fig. S4, A and B) and found that CD19+ cells were undetectable in mice harboring CAR19TIF cells (Fig. S4 C). CAR19TIF cells were detected in all examined organs, with relatively lower representation in lymph nodes and higher enrichment in the BM (Fig. S4, B–G). Notably, CAR19TIF cells in BM exhibited elevated expression levels of CD25 and PD-1 and were slightly larger compared with those in the spleen (Fig. S4, H and I). While ∼1% of CAR19TIF cells from the spleen were actively cycling (Ki67+), BM harbored a significantly higher proportion, about seven times more (Fig. S4, J and K). Furthermore, around a quarter of CAR19TIF cells from BM expressed CD69, indicating recent activation or tissue residency (Chang and Radbruch, 2021; Chang et al., 2018), whereas only 4% of such cells exhibited CD69 expression in the spleen (Fig. S4, L and M). The expression levels of the stemness markers CD62L and CXCR5 on CAR19TIF cells were comparable between the spleen and BM (Fig. S4, H, I, N, and O). Together, despite the absence of target cells, CAR19TIF cells demonstrated a widespread distribution in mice, with a relatively higher abundance in the BM.

CAR19T IF cells are relatively enriched in BM and dependent on CD19 + cells. (A) The formula used to calculate the relative distribution of CAR19TIF cells in different organs of B6 mice transferred with CAR19TIF cells. (B) Relative distribution of CAR19TIF cells in spleen (SPL), lymph node (LN), bone marrow (BM), lung, and peritoneal cavity (peritoneal) of recipient mice at 1 mo after transfer (n = 10 mice in SPL group, n = 10 mice in LN group, n = 12 mice in BM group, n = 10 mice in lung group, n = 10 mice in liver group, and n = 8 mice in peritoneal group for each group). (C) Percentages of CD19+ B cells among CD45+ cells in indicated organs from mice at 1 mo after transfer with CAR19TIF cells or PBS (n = 3 mice for each group). (D–F) Percentages and cell numbers of Thy1.1+ CAR19TIF cells and endogenous CD8+ T cells from spleen and BM at 1 mo after transfer. Representative plots (D) and statistical analysis (E and F) are shown (n = 14 mice for each group). (G) Normalized ratio of Thy1.1+ CAR19TIF cells to endogenous CD8+ T cells from spleen and BM (n = 14 mice for each group). (H and I) Flow cytometry analysis of the expression of indicated protein on Thy1.1+ CAR19TIF cells from SPL and BM at 1 mo after transfer. Representative plots (H) and statistical analysis of mean fluorescence intensity (MFI) (I) are shown (n = 4 mice for each group). (J and K) Percentages of Ki67+ CAR19TIF cells from spleen and BM at 1 mo after transfer. Representative plots (J) and statistical analysis (K) are shown (n = 4 mice for each group). (L and M) Percentages of CD69+ CAR19TIF cells from spleen and BM of mice transferred with CAR19TIF cells at 1 mo after transfer. Representative plots (L) and statistical analysis (M) are shown (n = 4 mice for each group). (N and O) Flow cytometry analysis of the percentages of CD44hiCD62Lhi cells among Thy1.1+ CAR19TIF cells from SPL and BM at 1 mo after transfer. Representative plots (N) and statistical analysis (O) are shown (n = 4 mice for each group). (P and Q) Flow cytometry analysis of CD19+ cells in spleen and BM of B6 and Rag1−/− mice. Representative plots (P) and statistical analysis (Q) are shown (n = 3 mice for each group). (R and S) Flow cytometry analysis of CD19+ cells in spleen and BM of B6 and NSG mice. Representative plots (R) and statistical analysis (S) are shown (n = 3 mice for each group). (T and U) 2 million Thy1.1+ CAR19TIF cells isolated from 2° donor mice were transferred into B6 or Rag1−/− mice. After 4 wk, percentages and cell numbers of CAR19TIF cells from the spleen of recipient mice were examined by flow cytometry. Representative plots (T) and statistical analysis (U) are shown (n = 4 in B6 group, n = 5 mice in Rag1−/− group). (V and W) 2 million of Thy1.1+ CAR19TIF cells isolated from 2° donor mice were transferred into B6 or NSG mice. After 4 wk, percentages and cell numbers of CAR19TIF cells from spleen of recipient mice were examined by flow cytometry. Representative plots (V) and statistical analysis (W) are shown (n = 4 mice for each group). (B, C, E–G, I, K, M, O, Q, S, U, and W) Data represent mean ± SEM. *P < 0.05, ***P < 0.001, ****P < 0.0001, ns, not significant, one-way ANOVA multiple-comparisons test in B, two-tailed unpaired Student’s t test in other panels.
CAR19T IF cells are relatively enriched in BM and dependent on CD19 + cells. (A) The formula used to calculate the relative distribution of CAR19TIF cells in different organs of B6 mice transferred with CAR19TIF cells. (B) Relative distribution of CAR19TIF cells in spleen (SPL), lymph node (LN), bone marrow (BM), lung, and peritoneal cavity (peritoneal) of recipient mice at 1 mo after transfer (n = 10 mice in SPL group, n = 10 mice in LN group, n = 12 mice in BM group, n = 10 mice in lung group, n = 10 mice in liver group, and n = 8 mice in peritoneal group for each group). (C) Percentages of CD19+ B cells among CD45+ cells in indicated organs from mice at 1 mo after transfer with CAR19TIF cells or PBS (n = 3 mice for each group). (D–F) Percentages and cell numbers of Thy1.1+ CAR19TIF cells and endogenous CD8+ T cells from spleen and BM at 1 mo after transfer. Representative plots (D) and statistical analysis (E and F) are shown (n = 14 mice for each group). (G) Normalized ratio of Thy1.1+ CAR19TIF cells to endogenous CD8+ T cells from spleen and BM (n = 14 mice for each group). (H and I) Flow cytometry analysis of the expression of indicated protein on Thy1.1+ CAR19TIF cells from SPL and BM at 1 mo after transfer. Representative plots (H) and statistical analysis of mean fluorescence intensity (MFI) (I) are shown (n = 4 mice for each group). (J and K) Percentages of Ki67+ CAR19TIF cells from spleen and BM at 1 mo after transfer. Representative plots (J) and statistical analysis (K) are shown (n = 4 mice for each group). (L and M) Percentages of CD69+ CAR19TIF cells from spleen and BM of mice transferred with CAR19TIF cells at 1 mo after transfer. Representative plots (L) and statistical analysis (M) are shown (n = 4 mice for each group). (N and O) Flow cytometry analysis of the percentages of CD44hiCD62Lhi cells among Thy1.1+ CAR19TIF cells from SPL and BM at 1 mo after transfer. Representative plots (N) and statistical analysis (O) are shown (n = 4 mice for each group). (P and Q) Flow cytometry analysis of CD19+ cells in spleen and BM of B6 and Rag1−/− mice. Representative plots (P) and statistical analysis (Q) are shown (n = 3 mice for each group). (R and S) Flow cytometry analysis of CD19+ cells in spleen and BM of B6 and NSG mice. Representative plots (R) and statistical analysis (S) are shown (n = 3 mice for each group). (T and U) 2 million Thy1.1+ CAR19TIF cells isolated from 2° donor mice were transferred into B6 or Rag1−/− mice. After 4 wk, percentages and cell numbers of CAR19TIF cells from the spleen of recipient mice were examined by flow cytometry. Representative plots (T) and statistical analysis (U) are shown (n = 4 in B6 group, n = 5 mice in Rag1−/− group). (V and W) 2 million of Thy1.1+ CAR19TIF cells isolated from 2° donor mice were transferred into B6 or NSG mice. After 4 wk, percentages and cell numbers of CAR19TIF cells from spleen of recipient mice were examined by flow cytometry. Representative plots (V) and statistical analysis (W) are shown (n = 4 mice for each group). (B, C, E–G, I, K, M, O, Q, S, U, and W) Data represent mean ± SEM. *P < 0.05, ***P < 0.001, ****P < 0.0001, ns, not significant, one-way ANOVA multiple-comparisons test in B, two-tailed unpaired Student’s t test in other panels.
To investigate the potential influence of undetectable CD19+ progenitor cells on the maintenance of CAR19TIF cells, we utilized Rag1−/− and NSG mice as recipients. Rag1−/− mice exhibited minimal CD19+ mature B cells in the spleen but retained ∼3% CD19+ progenitor cells in the BM (Fig. S4, P and Q), whereas NSG mice lacked CD19+ cells entirely (Fig. S4, R and S). Notably, CAR19TIF cells were capable of expansion, CD19+ cell eradication, and persistence in Rag1−/− mice but failed to do so in NSG mice (Fig. S4, T–W), indicating that the expansion and persistence of CAR19TIF cells necessitate the presence of CD19+ target cells.
Collectively, these findings demonstrate the exceptional functionality of CAR19TIF cells and highlight their dependency on the existence of CD19+ cells for expansion and persistence in vivo.
CAR19TIF cells exhibit features of effector, memory, and precursor-exhausted T cells at the population level
In mechanistic investigations, obtaining suitable controls for CAR19TIF cells posed a challenge due to their exceptional persistence and stemness. As previously demonstrated, wild-type and BCOR-deficient CAR19T cells failed to undergo expansion in B6 mice (Fig. 1, L and M; and Fig. S1, A–C), while ZC3H12A-deficient CAR19T cells exhibited contraction within 2 wk (Fig. 1, I and J). Consequently, we opted to employ endogenous CD8+ T cells as controls for phenotypic analysis, given that CAR19TIF cells had no discernible impact on these cells (Fig. S1, M and N).
2 mo after transfer, the majority of endogenous splenic CD8+ T cells in mice harboring CAR19TIF cells displayed a CD62LhiCD44lo naive T (TN) cell phenotype, with ∼10% exhibiting a CD62LhiCD44hi TCM phenotype (Fig. 3, A and B). Notably, about 95% of CAR19TIF cells in the spleen displayed the CD62LhiCD44hi phenotype (Fig. 3, A and B), indicative of TCM cell characteristics. The expression levels of CD62L, TCF1, CD25, CD127, and CD122 were comparable between CAR19TIF cells and endogenous CD8+ T cells (Fig. 3, C–F), supporting a TN or TCM cell phenotype for CAR19TIF cells. The heightened expression of ICOS was anticipated (Fig. 3, C and D), given its negative regulation by ZC3H12A (Uehata et al., 2013), while slight upregulation of CD27 and CD28 was also observed on CAR19TIF cells (Fig. 3, E and F).

CAR19T IF cells exhibit hybrid features of effector, memory, and precursor-exhausted T cells. (A) Flow cytometry gating of endogenous CD8+ T cells and CAR19TIF cells from the spleen of mice 2 mo after transfer. (B) Statistical analysis of the percentages of CD44+CD62L+ cells among endogenous CD8+ T cells and Thy1.1+ CAR19TIF cells (n = 6 mice for each group). (C–F) Flow cytometry analysis of the expression of indicated proteins on endogenous CD8+ T cells and Thy1.1+ CAR19TIF cells 2 mo after transfer. Representative plots (C and E) and statistical analysis of mean fluorescence intensity (MFI) (D and F) are shown (n = 4 or 6 mice for each group). (G) Experimental design. Activated P14 cells were transduced with retrovirus expressing GFP and transferred into B6 mice that were infected with LCMV clone 13. GFP+ P14 cells from infected mice and CAR19TIF cells from 3° recipient mice were analyzed by flow cytometry. (H and I) Representative plots (H) and statistical analysis (I) of CX3CR1 and Ly108 expression on indicated cells (n = 3 mice for each group). (J and K) Cells were stimulated with 50 ng/ml phorbol 12-myristate 13-acetate (PMA) and 1 µM ionomycin for 4 h in the presence of GolgiStop, and expression of IL2 and IFNγ were examined by intracellular staining. Representative plots (J) and statistical analysis (K) are shown (n = 4 mice for each group). (L) Purified B cells were cocultured with CAR19TIF cells isolated from the spleen of 2° mice 2 mo after transfer or medium control at indicated ratio for 24 h. After killing, live B cells were examined by flow cytometry and quantified (n = 4 replicates for each group). (B, D, F, I, K, and L) Data represent mean ± SEM from one of three independent experiments. *P < 0.05, **P < 0.01, ****P < 0.0001, ns, not significant, two-tailed unpaired Student’s t test in B, D, F, I, and L, one-way ANOVA multiple-comparisons test in K.
CAR19T IF cells exhibit hybrid features of effector, memory, and precursor-exhausted T cells. (A) Flow cytometry gating of endogenous CD8+ T cells and CAR19TIF cells from the spleen of mice 2 mo after transfer. (B) Statistical analysis of the percentages of CD44+CD62L+ cells among endogenous CD8+ T cells and Thy1.1+ CAR19TIF cells (n = 6 mice for each group). (C–F) Flow cytometry analysis of the expression of indicated proteins on endogenous CD8+ T cells and Thy1.1+ CAR19TIF cells 2 mo after transfer. Representative plots (C and E) and statistical analysis of mean fluorescence intensity (MFI) (D and F) are shown (n = 4 or 6 mice for each group). (G) Experimental design. Activated P14 cells were transduced with retrovirus expressing GFP and transferred into B6 mice that were infected with LCMV clone 13. GFP+ P14 cells from infected mice and CAR19TIF cells from 3° recipient mice were analyzed by flow cytometry. (H and I) Representative plots (H) and statistical analysis (I) of CX3CR1 and Ly108 expression on indicated cells (n = 3 mice for each group). (J and K) Cells were stimulated with 50 ng/ml phorbol 12-myristate 13-acetate (PMA) and 1 µM ionomycin for 4 h in the presence of GolgiStop, and expression of IL2 and IFNγ were examined by intracellular staining. Representative plots (J) and statistical analysis (K) are shown (n = 4 mice for each group). (L) Purified B cells were cocultured with CAR19TIF cells isolated from the spleen of 2° mice 2 mo after transfer or medium control at indicated ratio for 24 h. After killing, live B cells were examined by flow cytometry and quantified (n = 4 replicates for each group). (B, D, F, I, K, and L) Data represent mean ± SEM from one of three independent experiments. *P < 0.05, **P < 0.01, ****P < 0.0001, ns, not significant, two-tailed unpaired Student’s t test in B, D, F, I, and L, one-way ANOVA multiple-comparisons test in K.
CAR19TIF exhibited elevated expression levels of PD-1 and CXCR5 (Fig. 3, C and D), markers typically associated with follicular helper T cells or TPEX cells (He et al., 2016; Im et al., 2016; Leong et al., 2016). Interestingly, the expression of LAG-3 and TIM-3 was only minimally increased on CAR19TIF cells compared with endogenous CD8+ T cells (Fig. 3, C–F), suggesting that these cells are not terminally exhausted, which is consistent with their expansion and killing capacity (Fig. 2). Additionally, CAR19TIF cells expressed c-Kit (Fig. 3, C and D), a marker commonly found on HSCs, although they exhibited a low level of CD150 expression (Fig. 3, E and F), a marker associated with TSCM cells (Gattinoni et al., 2009, 2011).
The CD44hiCD62LhiPD-1hi phenotype observed in CAR19TIF cells resembles that of TPEX cells documented in chronic viral infections and cancer (He et al., 2016; Im et al., 2016; Leong et al., 2016; Utzschneider et al., 2016; Wu et al., 2016), albeit TPEX cells are typically characterized as CD44hiCD62LintPD-1int. To differentiate CAR19TIF cells from TPEX cells, we investigated additional markers commonly associated with exhausted T cells, namely Ly108 and CX3CR1. Ly108 identifies a progenitor population, whereas CX3CR1 denotes an effector population (Chen et al., 2021; Zander et al., 2019). Comparing CAR19TIF cells with exhausted CD8+ T cells from chronic viral infection (Fig. 3 G), we categorized exhausted CD8+ T cells into three subsets during LCMV clone 13 infection: Ly108+CX3CR1− TPEX, Ly108−CX3CR1+ TEFF (effector cells), and Ly108−CX3CR1− TEX (exhausted cells), with minimal Ly108+CX3CR1+ double-positive cells observed (Fig. 3, H and I), consistent with previous findings. Intriguingly, CAR19TIF cells were predominantly Ly108+CX3CR1+ (Fig. 3, H and I), indicating a distinct phenotype from TPEX cells. CAR19TIF cells express both the progenitor marker Ly108 (alongside CD62L and TCF1) and the effector marker CX3CR1, suggesting a hybrid phenotype with characteristics of both “stem cells” and effector cells, at least at the population level. Indeed, upon in vitro stimulation with phorbol 12-myristate 13-acetate (PMA) and ionomycin, CAR19TIF cells produced IL-2 and IFNγ, similar to TCM cells (Fig. 3, J and K). Furthermore, in an in vitro killing assay, CAR19TIF cells exhibited the capability to directly eliminate B cells without necessitating pre-expansion or differentiation into effector cells (Fig. 3 L), reaffirming their cytotoxic effector T cell functionality.
In summary, these findings underscore the unique phenotype exhibited by CAR19TIF cells, which diverges from known T cell subsets. Characterized by a distinctive CD44hiCD62LhiPD-1hiCX3CR1hi phenotype, along with their FSClow characteristics (see below), CAR19TIF cells stand out among other T cell subsets (see Discussion).
ZC3H12A and BCOR deficiencies synergistically reprogram CAR19TIF cells
To delve into the mechanisms underlying CAR19TIF cell reprogramming, we initiated by conducting bulk RNA-seq analysis of cells isolated from the spleen. Principal component analysis (PCA) unveiled distinct trajectories by day 10 after transfer, a timepoint where ZC3H12A-deficient CAR19T cells underwent contraction while ZC3H12A- and BCOR-double deficient CAR19TIF cells persisted (Fig. 1 J), signifying an early divergence in their transcriptomes (Fig. 4 A). Compared with sole ZC3H12A deficiency, CAR19TIF cells exhibited alterations in 1,183 downregulated genes and 239 upregulated genes (Fig. S5 A). Pathway analysis unveiled repression of inflammation-associated modules in CAR19TIF cells, juxtaposed with an upregulation in signaling associated with pluripotency, stemness, and the Wnt pathway (Fig. S5, B and C), suggesting that BCOR deficiency suppresses inflammation while fostering stemness.

ZC3H12A and BCOR deficiencies synergistically reprogram CAR19T IF cells. (A) PCA of ZC3H12A-deficient CAR19T cells 10 days after transfer, CAR19TIF cells 10 days after transfer, CAR19TIF cells 3 mo after transfer, and endogenous CD8+ T cells 3 mo after transfer. (B) Heatmaps showing the expression of selected genes in CAR19TIF cells and endogenous CD8+ T cells 3 mo after transfer. (C) The similarity of CAR19TIF cells (3 mo after transfer) with other T cell subsets from published studies (Johnnidis et al., 2021; Miller et al., 2019; Pace et al., 2018; Yao et al., 2019). (D) Pathway analysis of upregulated and downregulated genes in CAR19TIF cells (3 mo after transfer) compared with endogenous CD8+ T cells. (E) ChIP-seq data of BCOR binding to Eomes promoter region. (F and G) Flow cytometry analysis of EOMES expression in endogenous CD8+ T cells and Thy1.1+ CAR19TIF cells (1 mo after transfer). Representative plots (F) and statistical analysis of mean fluorescence intensity (MFI) (G) are shown (n = 6 mice for each group). (H and I) CD8+Cas9+ T cells were activated, coinfected with retrovirus expressing CAR19 with sgRNA targeting Bcor/Zc3h12a (GFP+) and retrovirus expressing CAR19 with sgRNA targeting another indicated gene. 1 million CD8+GFP+ CAR19T cells were transferred into B6 mice. After 4 wk, the ratio of GFP+Thy1.1+ cells among total GFP+ cells from the spleen was examined. Data were normalized to pretransfer. Representative plots (H) and statistical analysis (I) are shown (n = 10 mice in sgNT group, n = 4 mice in sgFzd10 group, n = 4 mice in sgRor2 group, n = 3 mice in Wnt3 group, n = 4 mice in sgWnt10a group, n = 4 mice in sgWnt10b group, n = 4 mice in sgCtnnb1 group, n = 4 mice in sgHoxb4 group, n = 8 mice in sgEomes group, n = 3 mice in sgIL2rb group, n = 3 mice in sgIcos group, n = 8 mice in sgkit group, n = 4 mice in sgPdcd1 group, and n = 4 mice in sgSell group). (J) Unsupervised clustering of CAR19TIF cells by scRNA-seq. (K) The expression of indicated genes in CAR19TIF cells at single-cell level. (G and I) Data represent mean ± SEM from one of two independent experiments. ****P < 0.0001, two-tailed unpaired Student’s t test.
ZC3H12A and BCOR deficiencies synergistically reprogram CAR19T IF cells. (A) PCA of ZC3H12A-deficient CAR19T cells 10 days after transfer, CAR19TIF cells 10 days after transfer, CAR19TIF cells 3 mo after transfer, and endogenous CD8+ T cells 3 mo after transfer. (B) Heatmaps showing the expression of selected genes in CAR19TIF cells and endogenous CD8+ T cells 3 mo after transfer. (C) The similarity of CAR19TIF cells (3 mo after transfer) with other T cell subsets from published studies (Johnnidis et al., 2021; Miller et al., 2019; Pace et al., 2018; Yao et al., 2019). (D) Pathway analysis of upregulated and downregulated genes in CAR19TIF cells (3 mo after transfer) compared with endogenous CD8+ T cells. (E) ChIP-seq data of BCOR binding to Eomes promoter region. (F and G) Flow cytometry analysis of EOMES expression in endogenous CD8+ T cells and Thy1.1+ CAR19TIF cells (1 mo after transfer). Representative plots (F) and statistical analysis of mean fluorescence intensity (MFI) (G) are shown (n = 6 mice for each group). (H and I) CD8+Cas9+ T cells were activated, coinfected with retrovirus expressing CAR19 with sgRNA targeting Bcor/Zc3h12a (GFP+) and retrovirus expressing CAR19 with sgRNA targeting another indicated gene. 1 million CD8+GFP+ CAR19T cells were transferred into B6 mice. After 4 wk, the ratio of GFP+Thy1.1+ cells among total GFP+ cells from the spleen was examined. Data were normalized to pretransfer. Representative plots (H) and statistical analysis (I) are shown (n = 10 mice in sgNT group, n = 4 mice in sgFzd10 group, n = 4 mice in sgRor2 group, n = 3 mice in Wnt3 group, n = 4 mice in sgWnt10a group, n = 4 mice in sgWnt10b group, n = 4 mice in sgCtnnb1 group, n = 4 mice in sgHoxb4 group, n = 8 mice in sgEomes group, n = 3 mice in sgIL2rb group, n = 3 mice in sgIcos group, n = 8 mice in sgkit group, n = 4 mice in sgPdcd1 group, and n = 4 mice in sgSell group). (J) Unsupervised clustering of CAR19TIF cells by scRNA-seq. (K) The expression of indicated genes in CAR19TIF cells at single-cell level. (G and I) Data represent mean ± SEM from one of two independent experiments. ****P < 0.0001, two-tailed unpaired Student’s t test.

Bulk RNA-seq analysis reveals distinct but cooperative roles between ZC3H12A and BCOR deficiencies in the reprogramming of CAR19T IF cells. (A) A volcano plot of differentially expressed genes (DEGs) between ZC3H12A-deficient CAR19T cells and CAR19TIF cells 10 days after transfer. (B) GSEA plot of ZC3H12A-deficient CAR19T cells and CAR19TIF cells 10 days after transfer. (C) Pathway analysis of DEGs between ZC3H12A-deficient CAR19T cells and CAR19TIF cells 10 days after transfer. (D) A volcano plot of DEGs between CAR19TIF cells (3 mo after transfer) and endogenous CD8+ T cells. (E) GSEA plot of CAR19TIF cells (3 mo after transfer) and Tpex from literature. (F) A volcano plot of DEGs of CAR19TIF cells between 10 days and 3 mo after transfer. (G) GSEA of CAR19TIF cells at 10 days and 3 mo after transfer based on gene sets from MSigDB. (H) A heatmap showing the expression of selected genes associated with T cell stemness, cell cycle, metabolism, cytotoxic function, and cytokines in ZC3H12A-deficient CAR19T cells and CAR19TIF cells 10 days after transfer, as well as CAR19TIF cells 3 mo after transfer. (I) KEGG pathway analysis of upregulated and downregulated genes in CAR19TIF cells 3 mo after transfer versus 10 days after transfer.
Bulk RNA-seq analysis reveals distinct but cooperative roles between ZC3H12A and BCOR deficiencies in the reprogramming of CAR19T IF cells. (A) A volcano plot of differentially expressed genes (DEGs) between ZC3H12A-deficient CAR19T cells and CAR19TIF cells 10 days after transfer. (B) GSEA plot of ZC3H12A-deficient CAR19T cells and CAR19TIF cells 10 days after transfer. (C) Pathway analysis of DEGs between ZC3H12A-deficient CAR19T cells and CAR19TIF cells 10 days after transfer. (D) A volcano plot of DEGs between CAR19TIF cells (3 mo after transfer) and endogenous CD8+ T cells. (E) GSEA plot of CAR19TIF cells (3 mo after transfer) and Tpex from literature. (F) A volcano plot of DEGs of CAR19TIF cells between 10 days and 3 mo after transfer. (G) GSEA of CAR19TIF cells at 10 days and 3 mo after transfer based on gene sets from MSigDB. (H) A heatmap showing the expression of selected genes associated with T cell stemness, cell cycle, metabolism, cytotoxic function, and cytokines in ZC3H12A-deficient CAR19T cells and CAR19TIF cells 10 days after transfer, as well as CAR19TIF cells 3 mo after transfer. (I) KEGG pathway analysis of upregulated and downregulated genes in CAR19TIF cells 3 mo after transfer versus 10 days after transfer.
3 mo after transfer, as ZC3H12A-deficient CAR19T cells vanished and CAR19TIF cells in the spleen entered a quiescent state, their transcriptome markedly diverged from that of endogenous CD8+ T cells, with 1,079 genes downregulated and 1,479 genes upregulated (Fig. S5 D). Notably, several costimulatory molecules, such as ICOS, 4-1BB, and TIGIT, exhibited upregulation in CAR19TIF cells (Fig. 4 B). Conversely, GZMB and TNF were downregulated, whereas IFNγ and GZMK showed upregulation (Fig. 4 B), aligning with the cytotoxic functionality of these cells (Fig. 3 L). CAR19TIF cells exhibited diminished expression of the lymph node homing receptor CCR7 (Fig. 4 B), elucidating their sparse presence in lymph nodes (Fig. S4 B). Moreover, the heightened expression of several inflammatory chemokine receptors, including CXCR4 and CX3CR1, in CAR19TIF cells (Fig. 4 B) concurs with their widespread distribution throughout the body (Fig. S4 B).
Regarding transcription factors (TFs), CAR19TIF cells exhibited increased expression of TCF1, TOX, TOX2, BATF, ZEB2, BLIMP1, BCL6, and EOMES compared with endogenous CD8+ T cells, while ID2 and SATB1 were downregulated (Fig. 4 B). Additionally, CAR19TIF cells expressed HOXB3 and HOXB4 (Fig. 4 B), which are specific to HSCs and are typically absent in T cells.
Comparative analysis of the transcriptome of CAR19TIF cells with RNA-seq data from established T cell subsets revealed a heterogeneous profile, incorporating features of stem-like T cells, TPEX cells, and effector T cells (Fig. 4 C and Fig. S5 E) (Johnnidis et al., 2021; Miller et al., 2019; Pace et al., 2018; Yao et al., 2019). Pathway analysis unveiled a significant enrichment of Wnt signaling, coupled with repression of ribosome biogenesis, translation, MYC targets, and oxidative phosphorylation (OXPHOS) in CAR19TIF cells (Fig. 4 D), reinforcing their stem cell characteristics and quiescent state. Notably, a discernible divergence in the transcriptional profiles of CAR19TIF cells between 10 days and 3 mo after transfer was observed (Fig. 4 A and Fig. S5 F), indicative of a differentiation process following the elimination of target cells. Throughout this transition, inflammation, cell cycle, and metabolism-associated programs experienced downregulation, while stemness-associated modules were further augmented (Fig. S5, G–I).
Published ChIP-seq data has elucidated Eomes as a direct target of BCOR (Fig. 4 E) (Kotov et al., 2019), and our analysis revealed a significant upregulation of EOMES protein in CAR19TIF cells (Fig. 4, F and G). To unravel the reprogramming mechanism underlying CAR19TIF cells, we conducted rescue experiments to elucidate the contribution of upregulated genes, including several Wnt pathway components (Fzd10, Ror2, Wnt3, Wnt10a, Wnt10b, and Ctnnb1), as well as Hoxb4, Eomes, Il2rb, Icos, Kit, Pdcd1, and Sell, in CAR19TIF cells. Among these genes, Eomes emerged as crucial for the expansion and/or persistence of CAR19TIF cells (Fig. 4, H and I). However, despite its necessity, overexpression of EOMES in ZC3H12A-deficient CAR19T cells failed to enhance their persistence (data not shown), indicating that while EOMES is necessary, it alone is insufficient to induce CAR19TIF cells in the context of ZC3H12A deficiency.
To explore whether the hybrid phenotype of CAR19TIF cells arises from population heterogeneity, we conducted single-cell RNA sequencing (scRNA-seq) analysis of CAR19TIF cells isolated from the spleen (Fig. S6 A). Despite dividing CAR19TIF cells into 10 “clusters” using unsupervised clustering (Fig. 4 J and Fig. S6 B), the differences in gene expression among these clusters were relatively minor (Fig. S6 B and Table S1). Crucially, the expression of key functional genes was consistent across these clusters, including Tcf7, Sell, Tox, Eomes, Gzmk, Prf1, and others (Fig. 4 K and Fig. S6 C). Furthermore, topic modeling analysis revealed that the stemness-associated topic (topic5) was detected in all clusters (Fig. S6, D and E) (Dey et al., 2017), indicating that the stemness of CAR19TIF cells is not limited to a specific subset. The co-expression of stemness and effector function genes in individual cells underscores that the hybrid phenotype of CAR19TIF cells manifests at the single-cell level.

scRNA-seq analysis of CAR19T IF cells. (A) Experimental setup for scRNA-seq. (B) Heatmap visualization showing 10 clusters. Representative genes were labeled. (C) Violin plots of the relative expression of representative genes across all clusters. (D) A two-dimensional t-SNE plot of CAR19TIF cells scRNA-seq profiles colored by the weight of topic5. (E) A bar plot of scores of topic5 genes enriched and involved in T cell naïve/stemness state.
scRNA-seq analysis of CAR19T IF cells. (A) Experimental setup for scRNA-seq. (B) Heatmap visualization showing 10 clusters. Representative genes were labeled. (C) Violin plots of the relative expression of representative genes across all clusters. (D) A two-dimensional t-SNE plot of CAR19TIF cells scRNA-seq profiles colored by the weight of topic5. (E) A bar plot of scores of topic5 genes enriched and involved in T cell naïve/stemness state.
Overall, these findings suggest that ZC3H12A and BCOR deficiencies synergistically induce a distinct program in CAR19TIF cells, endowing them with expansion, stemness, and quiescence (see Fig. 10 K and Discussion).
CAR19TIF cells transition into a metabolically dormant state after the elimination of target cells
Metabolism plays pivotal roles in dictating T cell fate decisions (MacIver et al., 2013; Peng and Li, 2023). On day 7 after transfer, the expanding CAR19TIF cells exhibited significantly larger sizes compared with endogenous CD8+ T cells (Fig. 5 A). However, after 4 wk, as CAR19TIF cells transitioned to a quiescent state, their sizes became even smaller than those of TN cells (Fig. 5 A). This dynamic alteration in the cell size of CAR19TIF cells was consistently observed throughout serial transfers (Fig. 5 B), indicating that a diminution in size in the absence of target cells is an inherent characteristic of CAR19TIF cells. Notably, proteins, particularly ribosomes, constitute the predominant portion of cell mass (van Riggelen et al., 2010). Intriguingly, we observed that ribosome biogenesis was suppressed in CAR19TIF cells compared with endogenous CD8+ T cells (Fig. 5 C). Indeed, the expression of most ribosome components was significantly downregulated in CAR19TIF cells (Fig. 5 D). Moreover, MYC, the master transcription factor governing ribosome biogenesis and metabolism (van Riggelen et al., 2010), exhibited reduced expression levels in CAR19TIF cells relative to TN cells (Fig. 5, E and F).

CAR19T IF cells transition into a metabolically dormant state following the eradication of target cells. (A) Flow cytometry analysis of splenic cell size 7 and 28 days after transfer of CAR19TIF cells (n = 4 mice for each group). (B) Flow cytometry analysis of cell size 1 mo after transfer of CAR19TIF cells into different generations of recipients (n = 3–6 mice for each group). (C) GSEA showing downregulation of genes involved in ribosome biogenesis in CAR19TIF cells (3 mo after transfer) compared with endogenous CD8+ T cells. (D) A heatmap showing the expression of ribosome genes in endogenous CD8+ T cells and CAR19TIF cells (3 mo after transfer). (E and F) Flow cytometry analysis of MYC expression in endogenous naive CD8+ T cells and CAR19TIF cells from spleen 28 days after transfer. Representative plots (E) and statistical analysis of mean fluorescence intensity (MFI) (F) are shown (n = 4 mice for each group). (G) GSEA showing downregulation of genes involved in oxidative phosphorylation in splenic CAR19TIF cells (3 mo after transfer) compared with endogenous CD8+ T cells. (H and I) Seahorse experiments examining OCR and ECAR of endogenous CD8+ T cells and CAR19TIF cells sorted from spleen 28 days after transfer. Representative plots and statistics are shown (n = 4 replicates for each group). (J and K) Flow cytometry analysis of 2-NBDG uptake by endogenous CD8+ T cells and CAR19TIF cells from spleen 28 days after transfer. Representative plots (J) and statistical analysis (K) are shown (n = 4 mice for each group). (L) A volcano plot of differentially identified metabolites between endogenous CD8+ T cells and CAR19TIF cells from spleen of 2° donor mice 1 mo after transfer by untargeted metabolomics. (M) Metabolic feature of CAR19TIF cells and endogenous CD8+ T cells from spleen of 2° donor mice 1 mo after transfer. (N) A heatmap showing the level of selected metabolites in endogenous CD8+ T cells and Thy1.1+ CAR19TIF cells from spleen. (O and P) The expression of Adora2a2 and Nt5e in endogenous CD8+ T cells and CAR19TIF cells (3 mo after transfer) from spleen. Data were from RNA-seq results (TPM). (Q and R) Flow cytometry analysis of CD73 expression on endogenous naïve CD8+ (TN) T cells and Thy1.1+ CAR19TIF cells from the spleen of 5° donor mice 1 mo after transfer. Representative plots (Q) and statistical analysis of mean fluorescence intensity (MFI) (R) are shown (n = 6 mice for each group). (S) Endogenous CD8+ T cells and CAR19TIF cells from the spleen of 5° donor mice 1 mo after transfer were pretreated with ADORA2A inhibitor ZM241385 (100 μM) or DMSO for 24 h, then incubated with 2-NBDG for another 30 min. 2-NBDG uptake was examined by flow cytometry (n = 3 mice for each group). (A, B, F, H, I, K, R, and S) Data represent mean ± SEM from one of three independent experiments. *P < 0.05, **P < 0.01, ***P < 0.001, ****P < 0.0001, two-way ANOVA multiple-comparisons test in A, one-way ANOVA multiple-comparisons test in S, two-tailed unpaired Student’s t test in other panels.
CAR19T IF cells transition into a metabolically dormant state following the eradication of target cells. (A) Flow cytometry analysis of splenic cell size 7 and 28 days after transfer of CAR19TIF cells (n = 4 mice for each group). (B) Flow cytometry analysis of cell size 1 mo after transfer of CAR19TIF cells into different generations of recipients (n = 3–6 mice for each group). (C) GSEA showing downregulation of genes involved in ribosome biogenesis in CAR19TIF cells (3 mo after transfer) compared with endogenous CD8+ T cells. (D) A heatmap showing the expression of ribosome genes in endogenous CD8+ T cells and CAR19TIF cells (3 mo after transfer). (E and F) Flow cytometry analysis of MYC expression in endogenous naive CD8+ T cells and CAR19TIF cells from spleen 28 days after transfer. Representative plots (E) and statistical analysis of mean fluorescence intensity (MFI) (F) are shown (n = 4 mice for each group). (G) GSEA showing downregulation of genes involved in oxidative phosphorylation in splenic CAR19TIF cells (3 mo after transfer) compared with endogenous CD8+ T cells. (H and I) Seahorse experiments examining OCR and ECAR of endogenous CD8+ T cells and CAR19TIF cells sorted from spleen 28 days after transfer. Representative plots and statistics are shown (n = 4 replicates for each group). (J and K) Flow cytometry analysis of 2-NBDG uptake by endogenous CD8+ T cells and CAR19TIF cells from spleen 28 days after transfer. Representative plots (J) and statistical analysis (K) are shown (n = 4 mice for each group). (L) A volcano plot of differentially identified metabolites between endogenous CD8+ T cells and CAR19TIF cells from spleen of 2° donor mice 1 mo after transfer by untargeted metabolomics. (M) Metabolic feature of CAR19TIF cells and endogenous CD8+ T cells from spleen of 2° donor mice 1 mo after transfer. (N) A heatmap showing the level of selected metabolites in endogenous CD8+ T cells and Thy1.1+ CAR19TIF cells from spleen. (O and P) The expression of Adora2a2 and Nt5e in endogenous CD8+ T cells and CAR19TIF cells (3 mo after transfer) from spleen. Data were from RNA-seq results (TPM). (Q and R) Flow cytometry analysis of CD73 expression on endogenous naïve CD8+ (TN) T cells and Thy1.1+ CAR19TIF cells from the spleen of 5° donor mice 1 mo after transfer. Representative plots (Q) and statistical analysis of mean fluorescence intensity (MFI) (R) are shown (n = 6 mice for each group). (S) Endogenous CD8+ T cells and CAR19TIF cells from the spleen of 5° donor mice 1 mo after transfer were pretreated with ADORA2A inhibitor ZM241385 (100 μM) or DMSO for 24 h, then incubated with 2-NBDG for another 30 min. 2-NBDG uptake was examined by flow cytometry (n = 3 mice for each group). (A, B, F, H, I, K, R, and S) Data represent mean ± SEM from one of three independent experiments. *P < 0.05, **P < 0.01, ***P < 0.001, ****P < 0.0001, two-way ANOVA multiple-comparisons test in A, one-way ANOVA multiple-comparisons test in S, two-tailed unpaired Student’s t test in other panels.
Engaging mitochondrial metabolism represents a metabolic hallmark of long-lived T cells (MacIver et al., 2013). However, our RNA-seq data revealed a downregulation of genes associated with OXPHOS in CAR19TIF cells compared with endogenous CD8+ T cells (Fig. 5 G). Consistently, Seahorse experiments unveiled a reduction in both the oxygen consumption rate (OCR) and the extracellular acidification rate (ECAR) in CAR19TIF cells (Fig. 5, H and I). Moreover, glucose uptake was markedly diminished in CAR19TIF cells relative to endogenous CD8+ T cells (Fig. 5, J and K), elucidating the subdued metabolic activity of CAR19TIF cells.
Untargeted metabolome analysis unveiled ∼319 metabolites that were elevated, while around 309 metabolites were decreased in CAR19TIF cells (Fig. 5 L), thereby metabolically distinguishing CAR19TIF cells from endogenous CD8+ T cells (Fig. 5 M). Notably, adenosine emerged as one of the highly increased metabolites in CAR19TIF cells (Fig. 5, L and N). Adenosine, an immunosuppressive metabolite generated by nucleosidases CD39 and CD73 (Allard et al., 2020), has been demonstrated to inhibit glucose uptake and T cell metabolism (Mastelic-Gavillet et al., 2019). Remarkably, we observed an upregulation of both CD73 (encoded by Nt5e), the enzyme responsible for adenosine production, and ADORA2A, the receptor for adenosine, in CAR19TIF cells (Fig. 5, O–R). Treatment with the ADORA2A antagonist ZM241385 partially restored glucose uptake in CAR19TIF cells (Fig. 5 S), suggesting that autocrine adenosine production represents one mechanism by which CAR19TIF cells sustain metabolic quiescence.
These findings collectively demonstrate that while CAR19TIF cells exhibit minimal contraction following expansion, they transition into a dormant state characterized by minimal metabolic activity.
CAR19TIF cells mediate long-term tumor repression
Poor expansion and/or persistence of adoptively transferred T cells pose a barrier to durable ACT (Chan et al., 2021; Gattinoni et al., 2012). In our model, both wild-type and BCOR-deficient CAR19T cells exhibited limited expansion in immunocompetent mice (Fig. 1, L and M; and Fig. S1, A–C), while ZC3H12A-deficient CAR19T cells failed to persist beyond 2 wk (Fig. 1, I and J). In contrast, CAR19TIF cells exhibited remarkable persistence in mice, preventing B cell rebound throughout the observation period (Fig. 1, I and J). Consistently, transfer of congenically marked splenocytes (CD45.1+) into either control B6 mice (CD45.2+) or those previously administered CAR19TIF cells revealed the absence of detectable CD19+ B cells only in mice with CAR19TIF cells, whereas engraftment of CD19− non-B cells was observed in both groups (Fig. 6, A–C). This underscores the continuous surveillance and elimination of endogenous and exogenous CD19+ cells by CAR19TIF cells.

CAR19T IF cells mediate long-term repression of tumors. (A) Experimental design. 10 million splenocytes from CD45.1 mice were injected into control B6 mice or B6 mice with CAR19TIF cells (male) via tail vein. Chimerism of splenocytes was analyzed by flow cytometry 2 wk after transfer. (B and C) Representative plots (B) and statistical analysis (C) of CD45.1+CD19+ B cells among total CD45.1+ cells in the spleen are shown (n = 4 mice for each group). (D) Experimental design. Male B6 mice were subcutaneously inoculated with MC38-mCD19 cells (0.2 million). 10 days later, CAR19TIF cells (3 million per mouse) from 2° donor mice or PBS were transferred into tumor-bearing mice. Tumor growth and mouse survival were monitored. (E and F) Tumor growth (E) and survival (F) of mice with indicated treatment (n = 4 mice for each group). (G) Experimental design. MC38-mCD19 cells (0.5 million) were subcutaneously inoculated in control B6 mice or mice with CAR19TIF (male). Tumor growth and mouse survival were monitored. (H and I) Tumor growth (H) and survival (I) of mice with indicated treatment (n = 5 mice in control group, n = 10 mice in CAR19TIF group). (J) Experimental design. B16F10-mCD19 cells (0.1 million) were injected into control B6 mice or B6 mice with CAR19TIF cells (male) via the tail vein. Tumor growth and mice survival were monitored. (K and L) Representative images of tumor burden in the lung 3 wk after transfer (K) and mouse survival (L) are shown (n = 5 mice in control group, n = 6 mice in CAR19TIF group). Bar is 0.5 cm. (C, E, and H) Data represent mean ± SEM from one of two independent experiments. **P < 0.01, ****P < 0.0001, two-tailed unpaired Student’s t test in C, two-way ANOVA multiple-comparisons test in E and H, log-rank (Mantel–Cox) test in F, I, and L.
CAR19T IF cells mediate long-term repression of tumors. (A) Experimental design. 10 million splenocytes from CD45.1 mice were injected into control B6 mice or B6 mice with CAR19TIF cells (male) via tail vein. Chimerism of splenocytes was analyzed by flow cytometry 2 wk after transfer. (B and C) Representative plots (B) and statistical analysis (C) of CD45.1+CD19+ B cells among total CD45.1+ cells in the spleen are shown (n = 4 mice for each group). (D) Experimental design. Male B6 mice were subcutaneously inoculated with MC38-mCD19 cells (0.2 million). 10 days later, CAR19TIF cells (3 million per mouse) from 2° donor mice or PBS were transferred into tumor-bearing mice. Tumor growth and mouse survival were monitored. (E and F) Tumor growth (E) and survival (F) of mice with indicated treatment (n = 4 mice for each group). (G) Experimental design. MC38-mCD19 cells (0.5 million) were subcutaneously inoculated in control B6 mice or mice with CAR19TIF (male). Tumor growth and mouse survival were monitored. (H and I) Tumor growth (H) and survival (I) of mice with indicated treatment (n = 5 mice in control group, n = 10 mice in CAR19TIF group). (J) Experimental design. B16F10-mCD19 cells (0.1 million) were injected into control B6 mice or B6 mice with CAR19TIF cells (male) via the tail vein. Tumor growth and mice survival were monitored. (K and L) Representative images of tumor burden in the lung 3 wk after transfer (K) and mouse survival (L) are shown (n = 5 mice in control group, n = 6 mice in CAR19TIF group). Bar is 0.5 cm. (C, E, and H) Data represent mean ± SEM from one of two independent experiments. **P < 0.01, ****P < 0.0001, two-tailed unpaired Student’s t test in C, two-way ANOVA multiple-comparisons test in E and H, log-rank (Mantel–Cox) test in F, I, and L.
Next, we evaluated CAR19TIF cells in primary and memory responses against tumors. In these experiments, we excluded non-persistent ZC3H12A-deficient CAR19T cells and non-expanding BCOR-deficient CAR19T cells as controls (Fig. 1, I–M) due to their evident shortcomings in long-term elimination of endogenous CD19+ cells. Mice mock-transferred with PBS served as controls. In the primary response (Fig. 6 D), CAR19TIF cells effectively suppressed the growth of MC38 tumor cells expressing mCD19 (MC38-mCD19) and prolonged mouse survival (Fig. 6, E and F). Assessing CAR19TIF cells in memory protection, we subcutaneously inoculated MC38-mCD19 into control mice and mice previously administered CAR19TIF cells (Fig. 6 G). While MC38-mCD19 tumors rapidly expanded in control B6 mice, those with CAR19TIF cells exhibited transient tumor growth followed by regression (Fig. 6 H), resulting in extended mouse survival (Fig. 6 I).
Metastasis, a common cause of tumor relapse and mortality, was evaluated using intravenous injection of B16F10 melanoma cells expressing mCD19 (B16F10-mCD19) to model lung metastasis (Fig. 6 J). B16F10-mCD19 cells efficiently colonized the lungs of control mice, leading to rapid mortality (Fig. 6, K and L). In contrast, mice with CAR19TIF cells exhibited reduced lung colonization by B16F10-mCD19 cells, resulting in prolonged survival (Fig. 6 L).
These findings collectively demonstrate that CAR19TIF cells confer long-term protection against tumors.
Induction of TIF cells with CARs targeting solid tumor antigens
We then explored the possibility of inducing TIF cells using CARs targeting different antigens. Initially, we examined a CAR directed against human EGFR (derived from the cetuximab antibody) (Fig. 7 A) (Liu et al., 2021). EGFR CAR T cells expressing sgNT, sgBcor, sgZc3h12a, or sgBcor/Zc3h12a were transferred into B6 mice, and we monitored the expansion and persistence of these CAR T cells (Fig. 7 B). Serial blood sampling revealed that only EGFR CAR T cells expressing sgRNAs targeting both Bcor and Zc3h12a were detectable in peripheral blood, peaking at 4 wk after transfer and persisting for at least 24 wk (Fig. 7 C). Consistently, EGFR CAR T cells were only detected in the spleen when both BCOR and ZC3H12A were depleted (Fig. 7, D–F). These findings indicate that unlike CAR19T cells, where ZC3H12A deficiency alone facilitated CAR T cell expansion (Fig. 1, D–F), ZC3H12A deficiency alone fails to promote EGFR CAR T cell expansion. However, dual deficiency of BCOR and ZC3H12A enhances the expansion and persistence of EGFR CAR T cells, which we term EGFRTIF cells due to their similarities to CAR19TIF cells (see below).

Induction, stemness, and antitumor efficacy of EGFRT IF cells. (A) The composition of anti-EGFR CAR. (B) Experimental design for the induction and analysis of EGFRTIF cells. (C) Statistical analysis of EGFRTIF cells among single live cells from peripheral blood at indicated times (n = 3 mice for each group). (D–F) Representative plots (D) and statistical analysis (E and F) of EGFRTIF cells among single live cells from spleen 28 days after transfer are shown (n = 3 mice for each group). (G) Experimental design. Rag1−/− mice were subcutaneously inoculated with MC38-EGFR tumor cells (0.5 million). 5 days later, PBS, 1 million control (sgNT) EGFR CAR T cells, or EGFRTIF cells were transferred into tumor-bearing mice. Tumor growth and mouse survival were monitored. (H and I) Representative plots (H) and statistical analysis (I) of EGFR CAR T cells among single live cells from blood are shown (n = 3 mice for each group). (J and K) Tumor growth (J) and mouse survival (K) were monitored (n = 6 mice for each group). (C, E, F, and I–K) Data represent mean ± SEM. Data are representative of three independent experiments. *P < 0.05, ***P < 0.001, ****P < 0.0001, two-way ANOVA multiple-comparisons test in C and J, one-way ANOVA multiple-comparisons test in I, log-rank (Mantel–Cox) test in K.
Induction, stemness, and antitumor efficacy of EGFRT IF cells. (A) The composition of anti-EGFR CAR. (B) Experimental design for the induction and analysis of EGFRTIF cells. (C) Statistical analysis of EGFRTIF cells among single live cells from peripheral blood at indicated times (n = 3 mice for each group). (D–F) Representative plots (D) and statistical analysis (E and F) of EGFRTIF cells among single live cells from spleen 28 days after transfer are shown (n = 3 mice for each group). (G) Experimental design. Rag1−/− mice were subcutaneously inoculated with MC38-EGFR tumor cells (0.5 million). 5 days later, PBS, 1 million control (sgNT) EGFR CAR T cells, or EGFRTIF cells were transferred into tumor-bearing mice. Tumor growth and mouse survival were monitored. (H and I) Representative plots (H) and statistical analysis (I) of EGFR CAR T cells among single live cells from blood are shown (n = 3 mice for each group). (J and K) Tumor growth (J) and mouse survival (K) were monitored (n = 6 mice for each group). (C, E, F, and I–K) Data represent mean ± SEM. Data are representative of three independent experiments. *P < 0.05, ***P < 0.001, ****P < 0.0001, two-way ANOVA multiple-comparisons test in C and J, one-way ANOVA multiple-comparisons test in I, log-rank (Mantel–Cox) test in K.
Flow cytometry analysis of splenic EGFRTIF cells at 4 wk after transfer revealed a CD44hiCD62Lhi central memory-like phenotype (Fig. S7, A and B). EGFRTIF cells expressed CXCR5, TCF1, PD-1, but not TIM-3 (Fig. S7 C), consistent with the typical features of CAR19TIF cells (Fig. 3). Unlike CAR19TIF cells, which were smaller than endogenous CD8+ T cells (Fig. 5, A and B), EGFRTIF cells exhibited a similar cell size to endogenous CD8+ T cells (Fig. S7 C), suggesting that EGFRTIF cells may not be as quiescent as CAR19TIF cells, possibly due to tonic signaling of this EGFR CAR (Liu et al., 2021). Notably, EGFRTIF cells robustly produced IFNγ upon ex vivo stimulation (Fig. S7, D–F), indicating that these cells were not exhausted.

Characterization of EGFRT IF cells. (A–F) Flow cytometry analysis of the expression of indicated proteins on endogenous CD8+ T cells and EGFRTIF cells from spleen of primary recipient mice (4 wk after transfer). Representative plots (A, C, and D) and statistical analysis (B, C, E, and F) are shown (n = 3 mice for each group). (G) Experimental design for serial transfer of EGFRTIF cells in B6 mice and NSG mice. (H–J) Representative plots (H) and statistical analysis (I and J) of EGFRTIF cells among single live cells from the spleen of B6 mice 1 mo after transfer are shown (n = 3 mice in PBS group, n = 3 mice in 1° group, n = 3 mice in 2° group, and n = 5 mice in 3° group). (K–M) Representative plots (K) and statistical analysis (L and M) of EGFRTIF cells among single live cells from the spleen of NSG mice 1 mo after transfer are shown (n = 3 mice in PBS group, n = 4 mice in 1° group, n = 3 mice in 2° group, and n = 4 mice in 3° group). (N) Survival of EGFRTIF cells in vitro. EGFRTIF and endogenous CD8+ T cells were cultured in vitro in T cell medium for indicated hours (n = 6 replicates for each group). (B, C, E, F, I, J, and L–N) Data represent mean ± SEM. Data are representative of three independent experiments. *P < 0.05, **P < 0.01, ***P < 0.001, ****P < 0.0001, ns, not significant, two-tailed unpaired Student’s t test in B and C, two-way ANOVA multiple-comparisons test in N, one-way ANOVA multiple-comparisons test in other panels.
Characterization of EGFRT IF cells. (A–F) Flow cytometry analysis of the expression of indicated proteins on endogenous CD8+ T cells and EGFRTIF cells from spleen of primary recipient mice (4 wk after transfer). Representative plots (A, C, and D) and statistical analysis (B, C, E, and F) are shown (n = 3 mice for each group). (G) Experimental design for serial transfer of EGFRTIF cells in B6 mice and NSG mice. (H–J) Representative plots (H) and statistical analysis (I and J) of EGFRTIF cells among single live cells from the spleen of B6 mice 1 mo after transfer are shown (n = 3 mice in PBS group, n = 3 mice in 1° group, n = 3 mice in 2° group, and n = 5 mice in 3° group). (K–M) Representative plots (K) and statistical analysis (L and M) of EGFRTIF cells among single live cells from the spleen of NSG mice 1 mo after transfer are shown (n = 3 mice in PBS group, n = 4 mice in 1° group, n = 3 mice in 2° group, and n = 4 mice in 3° group). (N) Survival of EGFRTIF cells in vitro. EGFRTIF and endogenous CD8+ T cells were cultured in vitro in T cell medium for indicated hours (n = 6 replicates for each group). (B, C, E, F, I, J, and L–N) Data represent mean ± SEM. Data are representative of three independent experiments. *P < 0.05, **P < 0.01, ***P < 0.001, ****P < 0.0001, ns, not significant, two-tailed unpaired Student’s t test in B and C, two-way ANOVA multiple-comparisons test in N, one-way ANOVA multiple-comparisons test in other panels.
To assess the stemness of EGFRTIF cells, we conducted serial transfer experiments in both B6 and NSG mice (Fig. S7 G). Remarkably, EGFRTIF cells could be serially transferred across at least three generations in both B6 and NSG mice without experiencing outgrowth (Fig. S7, H–M), and they demonstrated an inability to survive in vitro conditions (Fig. S7 N). These findings underscore the superior stemness of EGFRTIF cells while affirming their non-transformed nature.
Subsequently, we investigated the therapeutic potential of EGFRTIF cells against tumors. Initially, we established MC38-EGFR tumor cells, which showed initial growth but were swiftly rejected in B6 mice (data not shown), likely due to the immunogenicity of human EGFR in mice. Hence, we injected MC38-EGFR cells into Rag1−/− mice, followed by the administration of PBS, control EGFR CAR T cells (sgNT), or EGFRTIF cells (Fig. 7 G). Notably, BCOR- or ZC3H12A-single knockout EGFR CAR T cells were excluded due to their incapacity for in vivo expansion (Fig. 7, C–F). Robust expansion of EGFRTIF cells, but not control EGFR CAR T cells, was evident in the blood of tumor-bearing mice (Fig. 7, H and I), correlating with enhanced tumor control and prolonged survival of the mice (Fig. 7, J and K).
To further examine the applicability of the TIF program, we evaluated another clinically relevant CAR targeting the glycolipid GD2, derived from the 14G2A monoclonal antibody (Fig. 8 A) (Long et al., 2015). Owing to the distinct framework regions (FRs) of the 14G2A antibody, this GD2 CAR exhibited constitutive tonic signaling when CD28 was utilized as the costimulation domain, resulting in CAR T cell exhaustion and limited expansion in vivo (Long et al., 2015). We transferred GD2 (14G2A) CAR T cells expressing sgNT, sgBcor, sgZc3h12a, or sgBcor/Zc3h12a into B6 mice and monitored the behavior of CAR T cells (Fig. 8 B). Notably, expansion and persistence of GD2 (14G2A) CAR T cells were solely observed upon depletion of both BCOR and ZC3H12A (Fig. 8, C–F), and we coined these cells GD2TIF. GD2TIF cells exhibited nearly identical phenotypic characteristics to CAR19TIF and EGFRTIF cells (Fig. 8, G–L, compared with Fig. 3 and Fig. S7). Furthermore, GD2TIF cells could be serially transferred across at least three generations in both B6 and NSG mice without experiencing outgrowth (Fig. 8, M–S), and similar to CAR19TIF and EGFRTIF cells, they were unable to survive under in vitro conditions (Fig. 8 T), thereby demonstrating the stemness and safety profile of these cells.

Induction and characterization of GD2T IF cells. (A) Composition of anti-GD2 CAR with scFv derived from the 14G2A monoclonal antibody. (B) Experimental design for the induction of GD2TIF cells. (C) Statistical analysis of GD2TIF cells among single live cells from blood at the indicated times (n = 3 mice for each group). (D–F) Representative plots (D) and statistical analysis (E and F) of GD2TIF cells among single live cells in spleen 28 days after transfer are shown (n = 3 mice for each group). (G–L) Flow cytometry analysis of the expression of indicated proteins on endogenous CD8+ T cells and GD2TIF cells from spleen of primary recipient mice 4 wk after transfer. Representative plots (G, I, and K) and statistical analysis (H, J, and L) are shown (n = 3 mice in H and J, n = 6 mice in L). (M) Experimental design for serial transfer of GD2TIF cells in B6 mice and NSG mice. (N–P) Representative plots (N) and statistical analysis (O and P) of GD2TIF cells among single live cells in spleen of B6 mice 1 mo after transfer are shown (n = 3 mice in PBS group, n = 3 mice in 1° group, n = 6 mice in 2° group, n = 6 mice in 3° group). (Q–S) Representative plots (Q) and statistical analysis (R and S) of GD2TIF cells among single live cells in spleen of NSG mice 1 mo after transfer are shown (n = 3 mice in PBS group, n = 4 mice in 1° group, n = 5 mice in 2° group, n = 6 mice in 3° group). (T) Survival of GD2TIF cells in vitro. GD2TIF and endogenous CD8+ T cells were cultured in vitro in T cell medium for indicated hours (n = 6 replicates for each group). (C, E, F, H, J, L, O, P, and R–T) Data represent mean ± SEM. Data are representative of three independent experiments. *P < 0.05, **P < 0.01, ***P < 0.001, ****P < 0.0001, ns, not significant, two-way ANOVA multiple-comparisons test in C and T, two-tailed unpaired Student’s t test in H and J, one-way ANOVA multiple-comparisons test in other panels.
Induction and characterization of GD2T IF cells. (A) Composition of anti-GD2 CAR with scFv derived from the 14G2A monoclonal antibody. (B) Experimental design for the induction of GD2TIF cells. (C) Statistical analysis of GD2TIF cells among single live cells from blood at the indicated times (n = 3 mice for each group). (D–F) Representative plots (D) and statistical analysis (E and F) of GD2TIF cells among single live cells in spleen 28 days after transfer are shown (n = 3 mice for each group). (G–L) Flow cytometry analysis of the expression of indicated proteins on endogenous CD8+ T cells and GD2TIF cells from spleen of primary recipient mice 4 wk after transfer. Representative plots (G, I, and K) and statistical analysis (H, J, and L) are shown (n = 3 mice in H and J, n = 6 mice in L). (M) Experimental design for serial transfer of GD2TIF cells in B6 mice and NSG mice. (N–P) Representative plots (N) and statistical analysis (O and P) of GD2TIF cells among single live cells in spleen of B6 mice 1 mo after transfer are shown (n = 3 mice in PBS group, n = 3 mice in 1° group, n = 6 mice in 2° group, n = 6 mice in 3° group). (Q–S) Representative plots (Q) and statistical analysis (R and S) of GD2TIF cells among single live cells in spleen of NSG mice 1 mo after transfer are shown (n = 3 mice in PBS group, n = 4 mice in 1° group, n = 5 mice in 2° group, n = 6 mice in 3° group). (T) Survival of GD2TIF cells in vitro. GD2TIF and endogenous CD8+ T cells were cultured in vitro in T cell medium for indicated hours (n = 6 replicates for each group). (C, E, F, H, J, L, O, P, and R–T) Data represent mean ± SEM. Data are representative of three independent experiments. *P < 0.05, **P < 0.01, ***P < 0.001, ****P < 0.0001, ns, not significant, two-way ANOVA multiple-comparisons test in C and T, two-tailed unpaired Student’s t test in H and J, one-way ANOVA multiple-comparisons test in other panels.
Induction of GD2TIF cells requires CAR tonic signaling
The induction and persistence of CAR19TIF cells are reliant on the presence of CD19+ target cells (Fig. S4, P–W), whereas EGFR and GD2 CAR T cells may encounter fewer target cells expressing high levels of the respective antigens (hEGFR and GD2) in mice. We hypothesized that the induction of EGFRTIF and GD2TIF cells could be attributed to the potent tonic signaling of these CAR constructs (Liu et al., 2021; Long et al., 2015). To explore this notion, we turned to another GD2 CAR (derived from the K666 monoclonal antibody), reported to induce minimal tonic signaling (Fig. 9 A) (Straathof et al., 2020; Thomas et al., 2016). However, depleting BCOR and ZC3H12A only marginally expanded GD2 (K666) CAR T cells in stark contrast to the robust expansion observed with GD2 (14G2A) CAR T cells (GD2TIF) under similar conditions (Fig. 9, B–D). These findings suggest that without an abundance of target cells, such as normal B cells for CD19 CAR, the initiation of the TIF program might hinge on the tonic signaling activity of the CAR. To test this hypothesis, we investigated another CAR with minimal tonic signaling: the HER2 CAR derived from the 4D5 monoclonal antibody (Fig. 9 E) (Long et al., 2015; Zhao et al., 2009). Consistently, depleting BCOR and ZC3H12A resulted in only a marginal expansion of HER2 CAR T cells (Fig. 9, F–H).

Induction of GD2T IF cells requires CAR tonic signaling. (A) Composition of anti-GD2 CAR with scFv derived from the K666 monoclonal antibody. (B) Experimental design. (C and D) Representative plots (C) and statistical analysis (D) of GD2(K666) CAR T cells and GD2(14G2A) CAR T (GD2TIF) cells among single live cells in spleen 28 days after transfer are shown (n = 3 mice for each group). (E) Composition of anti-HER2 CAR with scFv derived from the 4D5 monoclonal antibody. (F) Experimental design. (G and H) Representative plots (G) and statistical analysis (H) of HER2 CAR T cells among single live cells from blood 7 days after transfer are shown (n = 5 mice for each group). (I) scFv of HER2 CAR (4D5), GD2 CAR (14G2A), and a chimeric scFv consisting of the complementary determining regions (CDRs) of HER2 CAR and the framework regions (FRs) of the GD2 CAR (HER2-CDR-GD2-FR CAR). (J) The CDR sequences of HER2 CAR and GD2 CAR (14G2A). (K) Experimental design. (L and M) Representative plots (L) and statistical analysis (M) of HER2-CDR-GD2-FR CAR T cells among single live cells from blood at indicated times are shown (n = 3 mice for each group). (D, H, and M) Data represent mean ± SEM. Data are representative of three independent experiments. *P < 0.05, **P < 0.01, ****P < 0.0001, two-tailed unpaired Student’s t test in D and H, two-way ANOVA multiple-comparisons test in M.
Induction of GD2T IF cells requires CAR tonic signaling. (A) Composition of anti-GD2 CAR with scFv derived from the K666 monoclonal antibody. (B) Experimental design. (C and D) Representative plots (C) and statistical analysis (D) of GD2(K666) CAR T cells and GD2(14G2A) CAR T (GD2TIF) cells among single live cells in spleen 28 days after transfer are shown (n = 3 mice for each group). (E) Composition of anti-HER2 CAR with scFv derived from the 4D5 monoclonal antibody. (F) Experimental design. (G and H) Representative plots (G) and statistical analysis (H) of HER2 CAR T cells among single live cells from blood 7 days after transfer are shown (n = 5 mice for each group). (I) scFv of HER2 CAR (4D5), GD2 CAR (14G2A), and a chimeric scFv consisting of the complementary determining regions (CDRs) of HER2 CAR and the framework regions (FRs) of the GD2 CAR (HER2-CDR-GD2-FR CAR). (J) The CDR sequences of HER2 CAR and GD2 CAR (14G2A). (K) Experimental design. (L and M) Representative plots (L) and statistical analysis (M) of HER2-CDR-GD2-FR CAR T cells among single live cells from blood at indicated times are shown (n = 3 mice for each group). (D, H, and M) Data represent mean ± SEM. Data are representative of three independent experiments. *P < 0.05, **P < 0.01, ****P < 0.0001, two-tailed unpaired Student’s t test in D and H, two-way ANOVA multiple-comparisons test in M.
It has been elucidated that the robust tonic signaling of the GD2 (14G2A) CAR is attributed to its distinctive FRs, initiating CAR signaling independently of antigen binding. Even when all complementary determining regions (CDRs) of the GD2(14G2A) CAR were replaced by the respective CDRs from the CD19 CAR, which exhibits minimal tonic signaling, the resulting CD19-CDR-GD2(14G2A)-FR chimeric CAR still displayed constitutive tonic signaling (Long et al., 2015). Motivated by this discovery, we substituted all CDRs of the GD2 (14G2A) CAR with those of the HER2 CAR (Fig. 9, I and J), creating the HER2-CDR-GD2 (14G2A)-FR chimeric CAR, which we evaluated for TIF cell induction (Fig. 9 K). Compared with the modest induction of the TIF program with the native HER2 CAR (Fig. 9, G and H), depletion of BCOR and ZC3H12A significantly amplified the expansion of the chimeric HER2-CDR-GD2 (14G2A)-FR CAR T cells, which persisted in vivo for at least 21 wk (Fig. 9, L and M). This CDR swapping analysis underscores two key insights: (1) the induction of GD2TIF cells may not necessitate antigen recognition, as CDRs from either the GD2(14G2A) CAR or the HER2 CAR could effectively induce TIF cells; and (2) in combination with BCOR/ZC3H12A deficiency, tonic signaling alone is adequate to provoke the TIF program when CAR target cells are unavailable, such as HER2 CAR T cells in mice.
Induction of human CAR TIF cells
Finally, we explored whether the TIF program could be induced in human T cells using a recently developed protocol (Larson et al., 2022). In this approach, activated human T cells were transduced with lentivirus expressing both a CAR and sgRNAs, followed by electroporation of Cas9 mRNA for gene editing (Fig. 10 A). Editing of BCOR and ZC3H12A genes was confirmed by DNA sequencing (data not shown). Similar to the induction of mouse GD2TIF cells (Fig. 8), human GD2 CAR T cells (CD4+ or CD8+) were only detected in the sgBCOR/ZC3H12A group, but not in the other groups (Fig. 10, B and C). These BCOR/ZC3H12A double-edited human GD2 CAR T cells exhibited expansion and persistence in secondary NSG mice upon serial transfer (Fig. 10, D and E), underscoring their superior stemness, especially considering the exhaustion feature of this GD2 CAR (Long et al., 2015). Significantly, a substantial proportion of these serially transferred cells expressed both CD62L and PD-1 (Fig. 10 E), a feature shared with mouse CAR19TIF, EGFRTIF, and GD2TIF cells.

Induction human CAR T IF cells. (A) Experimental design for production of human CAR T cells and editing of BCOR and ZC3H12A. (B and C) Representative plots (B) and statistical analysis (C) of human GD2 CAR T cells among single live cells in blood of 1° recipients at indicated time points are shown (n = 3 mice in PBS group, n = 5 mice in sgNT group, n = 5 mice in sgZC3H12A group, n = 5 mice in sgBCOR group, n = 3 mice in sgBCOR/ZC3H12A group). (D and E) Representative plots (D) and statistical analysis (E) of human GD2 CAR T cells among single live cells in the blood of 2° recipients 6 wk after transfer are shown (n = 5 mice for each group). (F) Experimental design. Nalm6 cells (0.5 million) were intravenously injected into NSG mice. 4 days later, 1.5 million non-CAR T cells, sgNT, or sgBCOR/ZC3H12A CD19 CAR T cells were transferred into tumor-bearing mice intravenously. (G and H) Representative plots (G) and statistical analysis (H) of CD19 CAR T cells among single live cells in blood 6 wk after transfer are shown (n = 3 mice for each group). (I and J) Nalm6 in blood (I) and mice survival (J) were monitored (n = 6 mice in non-CAR T cell group, n = 6 mice in sgNT group, n = 5 mice in sgBCOR/ZC3H12A group). (K) A model of CAR TIF cells induction (see Discussion). Illustration created with http://Biorender.com. (C, E, and H–J) Data represent mean ± SEM. Data are representative of three independent experiments. *P < 0.05, **P < 0.01, ***P < 0.001, ****P < 0.0001, two-way ANOVA multiple-comparisons test in C, two-tailed unpaired Student’s t test in E and H, log-rank (Mantel–Cox) test in J.
Induction human CAR T IF cells. (A) Experimental design for production of human CAR T cells and editing of BCOR and ZC3H12A. (B and C) Representative plots (B) and statistical analysis (C) of human GD2 CAR T cells among single live cells in blood of 1° recipients at indicated time points are shown (n = 3 mice in PBS group, n = 5 mice in sgNT group, n = 5 mice in sgZC3H12A group, n = 5 mice in sgBCOR group, n = 3 mice in sgBCOR/ZC3H12A group). (D and E) Representative plots (D) and statistical analysis (E) of human GD2 CAR T cells among single live cells in the blood of 2° recipients 6 wk after transfer are shown (n = 5 mice for each group). (F) Experimental design. Nalm6 cells (0.5 million) were intravenously injected into NSG mice. 4 days later, 1.5 million non-CAR T cells, sgNT, or sgBCOR/ZC3H12A CD19 CAR T cells were transferred into tumor-bearing mice intravenously. (G and H) Representative plots (G) and statistical analysis (H) of CD19 CAR T cells among single live cells in blood 6 wk after transfer are shown (n = 3 mice for each group). (I and J) Nalm6 in blood (I) and mice survival (J) were monitored (n = 6 mice in non-CAR T cell group, n = 6 mice in sgNT group, n = 5 mice in sgBCOR/ZC3H12A group). (K) A model of CAR TIF cells induction (see Discussion). Illustration created with http://Biorender.com. (C, E, and H–J) Data represent mean ± SEM. Data are representative of three independent experiments. *P < 0.05, **P < 0.01, ***P < 0.001, ****P < 0.0001, two-way ANOVA multiple-comparisons test in C, two-tailed unpaired Student’s t test in E and H, log-rank (Mantel–Cox) test in J.
We further investigated the induction of human TIF cells using a clinically approved CD19 CAR (Brudno et al., 2020). Since the induction of CAR19TIF cells relies on CD19+ target cells, which are absent in NSG mice (Fig. S4, R and S), we injected Nalm6 B cell leukemia cells into NSG mice as target cells, followed by the transfer of non-CAR T cells, control (sgNT), or BCOR/ZC3H12A double-edited human CD19 CAR T cells (Fig. 10 F). BCOR/ZC3H12A editing significantly enhanced the expansion and persistence of human CD19 CAR T cells (Fig. 10, G and H). Nalm6 cells grew rapidly in NSG mice (Fig. 10 I), resulting in the quick demise of the mice (Fig. 10 J). The growth of Nalm6 cells in mice that received control CD19 CAR T cells was initially suppressed for 5 wk but resurged in the blood starting from the sixth week (Fig. 10 I), followed by swift mortality in these relapsed mice (Fig. 10 J). Conversely, mice that received BCOR/ZC3H12A-edited CD19 CAR T cells effectively repressed tumor cell growth and conferred long-term survival to a significant portion of recipient mice (Fig. 10, I and J). These findings demonstrate the induction of the TIF program in human T cells using clinically utilized CARs.
Discussion
The quest to generate stem-like T cells for ACT has long been recognized as the “holy grail” in T cell biology (Gattinoni et al., 2012). Here, we demonstrate that depleting two defined factors, ZC3H12A and BCOR, induces CAR T cells into a novel state termed TIF, which exhibits unprecedented stemness while preserving the functionality of mature T cells.
Serial reconstitution of naive hosts serves as the gold standard for evaluating stemness. For memory T cells, only a sparse population is retrieved after three to four generations of successive transfers (Galletti et al., 2020; Graef et al., 2014; Grassmann et al., 2020; Rai et al., 2014). Similarly, the repopulating capacity of HSCs declines significantly after three to four transfers, ceasing altogether between four and six transfers (Cudkowicz et al., 1964; Siminovitch et al., 1964). Remarkably, CAR19TIF cells were capable of reconstituting naive hosts to a level similar to primary recipients after six successive transfers, a phenomenon unprecedented in known T cell subsets and even surpassing HSCs. This suggests that CAR19TIF cells resemble iPSCs, which self-renew infinitely (Martello and Smith, 2014). Importantly, repeated and extensive expansion during serial transfers did not exhaust CAR19TIF cells, which effectively eradicated all target cells in recipients. This underscores that acquiring iPSCs-like self-renewing capacity by CAR19TIF cells does not compromise mature T cell function.
To our understanding, the induction of CAR19TIF cells stands as a landmark achievement, representing the first instance of reprogramming mature cells into a state capable of nearly limitless self-renewal, reminiscent of iPSCs, while concurrently maintaining the functionality of mature T cells. This breakthrough not only reveals a paradigm shift in mammalian cell biology but also reshapes our comprehension of the intricate interplay between stemness, differentiation, and functionality (Rando and Chang, 2012). Recently, a study uncovered that, through appropriate vaccination protocols, virus-specific CD8+ T cells could undergo serial transfers in mice for up to 16 generations over a span of 10 years, termed ISTCs (Soerens et al., 2023). ISTCs were characterized as CD62LnegTCF1intTIM-3hi, exhibiting a phenotypic distinction from CAR TIF cells, identified as CD62LhiTCF1hiTIM-3neg. Nevertheless, both this study and ours suggest the potential for T cells to sustain indefinite stemness without undergoing transformation.
CAR19TIF cells exhibit a unique combination of features characteristic of both stem and effector cells, a concept recently introduced in the context of memory T cells (Lugli et al., 2020). However, CAR19TIF cells distinguish themselves from known T cell subsets in several critical aspects, particularly in their genuine stemness. The distinct CD44hiCD62LhiPD-1hiCX3CR1hiFSClow phenotype sets CAR19TIF cells apart from established T cell subsets with stem-like properties, such as TSCM (CD44lowCD62LhiPD-1neg) (Gattinoni et al., 2009, 2011), TCM (CD44hiCD62LhiPD-1neg) (Youngblood et al., 2011), and TPEX (CD44hiCD62LintPD-1intCX3CR1neg) (Chen et al., 2021; He et al., 2016; Im et al., 2016; Leong et al., 2016; Utzschneider et al., 2016; Wu et al., 2016; Zander et al., 2019), as no known T cell subset simultaneously expresses CD44, CD62L, PD-1, and CX3CR1 at high levels. Additionally, the size of resting CAR19TIF cells is even smaller than that of naïve T cells, contrasting with all other known T cell subsets (after activation/proliferation), which typically exhibit larger sizes than naïve T cells (Gabriel et al., 2021).
Previous investigations have shown that ZC3H12A deficiency leads to the generation of long-lived effector T cells and increases TCF1+ TPEX cells in CD19 CAR T cells (Wei et al., 2019; Zheng et al., 2022). However, our study reveals that ZC3H12A-deficient CD19 CAR T cells experience rapid contraction after expansion, resulting in the absence of memory cells and subsequent B cell rebound. This emphasizes that suppressing ZC3H12A alone cannot confer stemness. Furthermore, ZC3H12A deficiency fails to expand T cells expressing EGFR or GD2 CAR in immunocompetent mice, indicating that the persistence-promoting effect of ZC3H12A deficiency is context dependent. In contrast, the TIF program induced by BCOR and ZC3H12A double deficiency remains consistent across CD19, EGFR, and GD2 CAR T cells.
Both ZC3H12A and BCOR function as negative regulators of gene expression, with ZC3H12A acting post-transcriptionally to promote mRNA decay and BCOR exerting epigenetic effects as a transcriptional corepressor (Huynh et al., 2000; Matsushita et al., 2009). Inhibiting these proteins leads to extensive changes in gene expression, resulting in the upregulation and downregulation of thousands of genes, collectively reprogramming CAR19TIF cells. Notably, the expression patterns of ZC3H12A and BCOR are neither unique nor highly expressed in T cells (Matsushita et al., 2009; Wamstad and Bardwell, 2007), making the successful induction of CAR19TIF cells by inhibiting these proteins unexpected. The precise mechanism by which the synergistic effect of ZC3H12A and BCOR double deficiency reprograms CAR19TIF cells remains unclear. While EOMES plays a role downstream of BCOR in CAR19TIF cells, other mechanisms must also be at play. Unfortunately, the inability of wild-type and BCOR-deficient CAR19T cells to expand in immunocompetent mice has hindered our ability to obtain these cells for comparison with CAR19TIF cells, thereby limiting the depth of mechanistic studies.
Another perplexing observation was that, unlike in CAR19T cells, ZC3H12A deficiency alone did not enhance the expansion of GD2 and EGFR CAR T cells in an immunocompetent setting. Similarly, BCOR deficiency did not promote the expansion of GD2 and EGFR CAR T cells. However, the combined deficiency of BCOR and ZC3H12A induced GD2TIF and EGFRTIF cells with characteristics similar to CAR19TIF cells. These findings highlight the necessity of synergism between BCOR and ZC3H12A for the induction of CAR TIF cells targeting solid tumor antigens. The underlying mechanisms remain challenging to elucidate due to the unavailability of BCOR- or ZC3H12A-deficient GD2 or EGFR CAR T cells for comparative analysis. Future investigations utilizing appropriate models, such as infections, may provide insights into this puzzling phenomenon.
Recently, two studies have revealed that the knockout of both RC3H1 (Roquin-1) and ZC3H12A (Regnase-1) in T cells results in stronger antitumor immunity compared with knocking out either factor alone (Behrens et al., 2021; Mai et al., 2023). Mechanistically, RC3H1 and ZC3H12A function in an overlapping pathway to facilitate the decay of mRNA encoding proteins involved in T cell activation, proliferation, and inflammation (Mino et al., 2015; Zhao et al., 2021), elucidating the additive toxicities and limited increase in stemness observed when both factors are knocked out. In contrast, BCOR operates in a distinct pathway, the deficiency of which significantly enhances T cell stemness while dampening inflammation induced by ZC3H12A deficiency. Consequently, the combination of BCOR and ZC3H12A deficiencies appears more conducive to programming long-lived T cells with reduced inflammation.
The induction and maintenance of CAR19TIF cells depend on the presence of the antigen, while GD2TIF cells, and potentially EGFRTIF cells as well, rely on tonic signaling mediated by the CAR. Despite CAR tonic signaling traditionally being considered detrimental to CAR T cells (Long et al., 2015), recent studies have unveiled its potential to enhance CAR T cell persistence under specific conditions (Singh et al., 2021). The TIF program is minimally activated by CARs with low tonic signaling, such as HER2 CAR (4D5) and GD2 CAR (K666). Notably, HER2 CAR TIF cells could be induced by relocating all their CDRs to the unique FR of GD2 CAR (14G2A), thereby triggering robust tonic signaling independent of antigen engagement (Long et al., 2015). Therefore, the initiation and perpetuation of the TIF program through ZC3H12A and BCOR double deficiency rely on CAR signaling, whether initiated by antigen or tonic signaling (Fig. 10K). However, the inability of both GD2TIF and EGFRTIF cells to survive in vitro, coupled with their limited niche in vivo, suggests the involvement of additional factor(s) in their in vivo maintenance, warranting further exploration.
In this study, none of the hundreds of mice infused with CAR TIF cells displayed autoimmune or inflammatory reactions. With the exception of the permanent absence of mature B cells observed in mice hosting CAR19TIF cells, those harboring TIF cells remained healthy, maintaining a normal endogenous T cell compartment. Importantly, deletion of ZC3H12A and BCOR in mature CD8+ T cells did not induce oncogenic transformation of TIF cells in any recipient mouse. This finding aligns with their quiescent state, inability to survive in vitro, a saturable niche in NSG mice, and downregulation of the oncogene MYC. Addressing additional safety concerns regarding toxicity and oncogenic transformation can be achieved by integrating controllable CARs (Weber et al., 2021) or suicide genes (Brandt et al., 2020) into CAR TIF cells.
The limited persistence of functional T cells commonly contributes to cancer and chronic infections (Chan et al., 2021; Gattinoni et al., 2012). TIF cells demonstrate genuine stemness and unparalleled persistence in vivo, holding promise to enhance current CAR T cell therapy. Beyond oncology, TIF cells harbor potential for diverse applications. First, CAR19TIF cell therapy obviates the need for chemotherapeutic conditioning, making it more suitable than conventional CAR19T cells for autoimmune diseases managed through B cell depletion. The latter requires repeated administration of depleting antibodies and exhibits variable efficacy in B cell elimination across patients (Lee et al., 2021). Second, the abundant presence of persisting TIF cells in vivo suggests their utility as a versatile platform for delivering therapeutic biologics requiring repeated dosing, encompassing antibodies, recombinant proteins, peptides, and hormones.
Materials and methods
Mice and cell lines
C57BL/6 (Cat# JAX:000664, RRID: IMSR_JAX:000664; The Jackson Laboratory), CD45.1 (Cat# JAX:002014, RRID: IMSR_JAX:002014; The Jackson Laboratory), Rag1−/− (Cat# JAX:034159; The Jackson Laboratory), NSG mice (Cat# JAX: 005557, RRID: IMSR_JAX:005557; The Jackson Laboratory), and Cas9 transgenic mice (Cat# JAX:026430, RRID: IMSR_JAX:026430; The Jackson Laboratory) originally came from The Jackson Laboratory. Mice were maintained under specific pathogen–free conditions at the Laboratory Animal Research Center of Tsinghua University (Beijing, China). These animal facilities were approved by the Beijing Administration Office of Laboratory Animals. All animal work was approved by the Institutional Animal Care and Use Committee (IACUC). Age- (6–12 wk old) and sex-matched mice were used for experiments.
To generate mCD19-expressing MC38 and B16F10 cell lines, MC38 and B16F10 cells were transduced with retroviruses expressing mCD19 (pMIG-mCD19-IRES-GFP). GFP- and mCD19-double-positive cells were sorted and expanded. To generate an EGFR-expressing MC38 cell line, MC38 cells were transduced with a lentivirus expressing EGFR (pLentiCas9-EGFR-T2A-Thy1.1). Thy1.1+ cells were sorted and expanded. Phoenix-Eco (Cat# CRL-3214, RRID: CVCL_H717; ATCC) and HEK293T cells (Cat# CRL-3216, RRID: CVCL_0063; ATCC) were cultured in DMEM (Gibco) containing 5% FBS, 2 mM glutamine, 100 U/ml penicillin, and 100 µg/ml streptomycin in a humidified incubator at 37°C. All cell lines were tested for mycoplasma using the TransDect PCR Mycoplasma Detection Kit (Cat# FM311; TRAN) and confirmed to be negative.
Vector and library construction
To generate a retroviral vector for the expression of single guide RNA (sgRNA) together with a Thy1.1-P2A-CAR19 cassette, we cloned the hU6-sgRNA-EFS-Cas9-P2A-puro expression cassette from lentiCRISPRv2 (Cat# 52961; Addgene) into the pMSCV backbone (Cat# 74056; Addgene). Subsequently, the Cas9-P2A-puro cassette was replaced with a Thy1.1 cassette. For the anti-mCD19 CAR construct, the DNA sequence was obtained from a published report (Kochenderfer et al., 2010) and synthesized by Sangon Biotech (Shanghai). The P2A-CAR19 constructs were cloned in-frame with Thy1.1. This vector was named pMSCV-sgRNA-CAR19 (Fig. 1 B), and it was used for the one-step generation of CAR19T cells with genes targeted by sgRNA after delivery into Cas9-expressing CD8+ T cells. The DNA sequence of the anti-hCD19 CAR construct (47G-4) was derived from a published report (Brudno et al., 2020) and synthesized by Sangon Biotech. The DNA sequences of the anti-EGFR (cetuximab) CAR, anti-GD2 CAR (14G2A and K666), and anti-HER2 (4D5) CAR were obtained from published studies (Liu et al., 2021; Long et al., 2015; Straathof et al., 2020; Zhao et al., 2009) and synthesized by Sangon Biotech. The synthesized CAR cDNA was substituted into the pMSCV-U6-sgRNA-EFS-Thy1.1-P2A-CAR vector. The sequences of CAR-scFv are listed in Table S4.
For dual sgRNA screening, we inserted another U6 promoter to drive the second sgRNA (Fig. 1 G). Subsequently, the sgRNA portion of the Brie genome-wide sgRNA library (Cat# 73632; Addgene) for mice was PCR-amplified and ligated into this vector using Gibson assembly (Cat# E2621S; NEB). The ligated product was then precipitated, washed, and electroporated into TOP10 bacteria, which were plated on 40 plates. These plates were incubated at 33°C for 15 h and the bacterial clones were collected from the plates for plasmid extraction. The coverage of this library included >200 colonies per sgRNA. The library was sequenced using Illumina NovaSeq 6000 (Berry Genomics). For the screening process, ∼150 million CAR19T cells expressing dual sgRNAs were transferred into 50 B6 mice (3 million cells per mouse). On day 7 after the transfer, CD8+Thy1.1+ CAR19T cells sorted from the spleens of 10 recipient mice were pooled and used as input for normalization. 3 mo later, CD8+Thy1.1+ CAR19T cells were harvested from spleens of mice and pooled together for sgRNA enrichment analysis.
For triple gene knockout, we replaced the Thy1.1 marker in the sgBcor/Zc3h12a vector with GFP and coinfected T cells with pMSCV-sgRNA-CAR19 containing the Thy1.1 marker. As a result, GFP+Thy1.1+ cells expressed three sgRNAs for the triple knockout.
Library construction for deep sequencing
To quantify the enrichment of sgRNA, genomic DNA was extracted using the TIANamp Genomic DNA Kit (Cat# DP304; TIANGEN BIOTECH) following the manufacturer’s protocol. The sgRNA sequences were PCR-amplified using high-fidelity Q5 DNA polymerase (Cat# M0491L; NEB) with barcoded primers derived from genomic DNA for library construction, followed by deep sequencing. The raw data from deep sequencing were processed to retain only the sgRNA sequences using ENCoRE software. After comparing them to the reference sgRNA sequences, the reads for each individual sgRNA in each sample were normalized within that sample as reads per million reads to account for the differences in sequencing depth among samples. For each gene, a P value was calculated using a paired Student's t test to examine the differences in gRNA abundance between the input and end point for the four gRNAs.
Validation of gene editing in T cells expressing sgRNA
The editing of Bcor loci in CAR19TIF cells was examined by DNA sequencing. Briefly, CD8+Thy1.1+ and CD8+Thy1.1− cells were sorted using the S3e cell sorter (Bio-Rad) either 48 h after spin-infection or 1 mo after adoptive transfer. Genomic DNA was extracted for PCR amplification of genomic regions spanning the sgRNA cleavage sites. The amplified regions were sequenced to validate gene editing. PCR primers are listed in Table S2.
Western blot
The expression of ZC3H12A in control and ZC3H12A- and BCOR-double deficient CAR19TIF cells was examined by Western blot. 4 days after spin-infection, CD8+Thy1.1+ CAR19TIF cells and CD8+Thy1.1− control cells were sorted using an S3e cell sorter (Bio-Rad). An equal number of cells were lysed with Triton X-100 lysis buffer (40 mM Hepes, pH = 7.4, 1% Triton X-100, 150 mM NaCl, 10 mM β-glycerol phosphate, 10 mM pyrophosphate, 2.5 mM MgCl2, and 1× protease inhibitor) for 10 min on ice. The soluble fractions of cell lysates were isolated by centrifugation at 20,000 g at 4°C for 10 min and quantified using a BCA kit (Thermo Fisher Scientific). Protein samples were denatured with the addition of 6 × SDS sampling buffer and incubated at 95°C for 5 min. Protein samples were then subjected to SDS-PAGE and immunoblotting analysis. Antibodies used to detect ZC3H12A and β-actin are listed in Table S3.
Virus production
Retroviruses were packaged by cotransfecting Phoenix-Eco cells with indicated plasmid and helper plasmid pCL-Eco (Cat# 12371; Addgene) using calcium phosphate precipitation-mediated transfection. The viral supernatant was collected at 48 and 72 h after transfection, filtered via 0.45-µm filters, aliquoted, and frozen at −80°C. Lentiviruses were packaged by cotransfecting HEK293T cells with indicated plasmid encoding CAR, pMD2.G (Cat# 12259; Addgene), and psPAX2 (Cat# 12260; Addgene) using PEI transfection. Viral supernatant was collected at 48 and 72 h after transfection. The supernatants were filtered through 0.45-µm filters, and the virus in the supernatant was concentrated by ultracentrifugation (25,000 rpm for 2 h). The concentrated virus was aliquoted and frozen at −80°C.
Primary T cell culture and infection
Mouse primary T cells were cultured in T cell medium (TCM): RPMI1640 medium (Gibco) supplemented with 5% fetal bovine serum (FBS), 2 mM glutamine, 55 µM β-mercaptoethanol, 1 mM sodium pyruvate, 100 U/ml penicillin, 100 µg/ml streptomycin, and 2 ng/ml IL-2 in a humidified incubator at 37°C with 5% CO2.
Single-cell suspensions were prepared from the spleen and lymph nodes of Cas9-expressing mice (both male and female mice were used). CD8+ T cells were purified using a negative selection kit (Cat# 480035; BioLegend), and the purified CD8+ T cells were activated with 1 μg/ml anti-CD3 (Cat# BP0001-1, RRID: AB 1107634; BioXCell) and 1 μg/ml anti-CD28 (Cat# BP0015-1, RRID: AB 1107624; BioXCell) overnight.
24 h after activation, viral transduction was performed by spin-infection at 2,000 g for 2 h at 33°C in the presence of 16 µg/ml polybrene (Cat# H9268; Sigma-Aldrich), followed by incubation for another 4 h. Then, cells were washed and cultured in fresh TCM with IL-2. 24 h after spin infection, the efficiency of transduction was determined by examining reporter-positive cells (Thy1.1 or GFP) using flow cytometry.
Human CAR T cell production and gene editing
Peripheral blood mononuclear cells (PBMCs) were isolated from fresh whole blood obtained from healthy donors by gradient centrifugation using Ficoll-Paque PLUS (Cat# 17-1440-02; GE Healthcare). For T cell activation, 96-well plates were precoated with 5 μg/ml anti-hCD3 (Cat# 317326, RRID:AB_11150592; BioLegend), 1 μg/ml anti-hCD28 (Cat# 16-0289-85, RRID:AB_468926; Thermo Fisher Scientific), and 10 μg/ml RetroNectin (Cat# T100A; Takara). Then, PBMCs were loaded in these wells in human T cell media (X-VIVO media, Cat# 04-418Q; Lonza) supplemented with 5% human AB serum, 55 μM β-mercaptoethanol, 100 U/ml penicillin, 100 μg/ml streptomycin, 10 ng/ml hIL2, 10 ng/ml hIL7, and 10 ng/ml hIL15. This culture was maintained in a humidified incubator at 37°C with 5% CO2. After 24 h, activated T cells were infected with lentivirus expressing CAR and sgRNA. 3 days later, 2 million CAR T cells were electroporated with 1 μg Cas9 mRNA in 16-well Nucleocuvette Strips using the EO-115 program (Lonza) following the manufacturer’s instructions. Cells were expanded in human T cell media for another 3 days before analysis or transfer into mice. The collection of peripheral blood samples from healthy donors was approved by the ethics committee for biomedical studies from Tsinghua University. All the volunteers involved in this current study have given their written consent.
The editing of BCOR and ZC3H12A genes in human CAR T cells was examined by DNA sequencing. Briefly, human CAR T cells were collected 3 days after electroporation. Genomic DNA was extracted for PCR amplification of genomic regions spanning the sgRNA cleavage sites. The amplified regions were sequenced to validate gene editing. PCR primers are listed in Table S2.
Adoptive T cell transfer
All adoptive transfers in this study were performed in the absence of any conditioning regimen. 24 h after spin infection, the indicated numbers of CD8+Thy1.1+ cells were transferred into age- and sex-matched B6 mice (Cas9+), Rag1−/− mice, or NSG mice via tail vein. The presence of CD8+Thy1.1+ CAR T cells and the elimination of endogenous B cells (for CD19 CAR T cells) in peripheral blood, spleen, and indicated organs were examined by flow cytometry.
For serial transfers, ∼2 million CAR19TIF cells from the spleen of the last batch of recipient mice were transferred into the next batch of recipient mice via the tail vein. The interval between transfers was 1 or 2 mo, as indicated in the figures or figure legends. In some transfers, CAR19TIF cells were sorted by flow cytometry based on surface markers and CFSE (Cat# C34554; Thermo Fisher Scientific) signal and then re-labeled with CFSE for the next transfer.
Tumor models
In the primary tumor protection model, MC38-mCD19 cells (2 × 10⁵) were subcutaneously injected into the right flank of male B6 mice. 2 million CAR19TIF cells isolated from the spleen of 2° donor mice (in 0.2 ml PBS) or PBS alone were injected into tumor-bearing mice via the tail vein. For the memory protection model, MC38-mCD19 cells (5 × 10⁵) were subcutaneously injected into the right flank of male B6 mice previously transferred with 2 million CAR19TIF cells (>1 mo) or PBS. Tumor size and mouse survival were recorded every 2–3 days. Tumor size was calculated as length × width. Mice bearing a tumor >300 mm2 were considered to have reached the endpoint of the experiment and were euthanized.
In the lung metastasis model, B16F10-mCD19 cells (1 × 10⁵) were intravenously injected into B6 mice previously transferred with 2 million CAR19TIF cells (>1 mo) or PBS. 3 wk after tumor injection, one cohort of mice was euthanized for macroscopic examination of tumor metastasis in the lungs, while another cohort of mice was monitored for survival.
In the EGFR+ tumor model, MC38-EGFR cells (5 × 10⁵) were subcutaneously injected into the right flank of Rag1−/− mice. Subsequently, PBS or 1 million sgNT or sgBcor/Zc3h12a EGFR CAR T cells were injected into tumor-bearing mice via the tail vein. Tumor size and mouse survival were recorded every 2–3 days. Tumor size was calculated as length × width. Mice bearing a tumor >300 mm2 were considered to have reached the endpoint of the experiment and were euthanized.
In the B cell leukemia model, Nalm6 cells (5 × 10⁵) were intravenously injected into NSG mice. 4 days later, ∼1.5 million untreated human T cells, sgNT CD19 CAR T cells, or sgBCOR/ZC3H12A CD19 CAR T cells were injected into tumor-bearing mice via the tail vein. The presence of CAR T cells and Nalm6 cells in peripheral blood was examined by flow cytometry, and mouse survival was recorded daily.
Flow cytometry
Single-cell suspensions were prepared from blood, lymph nodes, spleen, or indicated organs. Cell surface proteins were stained with the indicated antibodies in the presence of Fc block in FACS buffer (PBS containing 1% FBS, 2 mM EDTA, 100 U/ml penicillin, and 100 µg/ml streptomycin) at 4°C for 15 min. Intracellular staining for cytoplasmic and nuclear proteins was performed with the Transcription Factor Staining Buffer kit according to the manufacturer’s instructions (BD Pharmingen). Dead cells were excluded by DAPI (BioLegend) staining or the LIVE/DEAD Fixable Near-IR Dead Cell Stain Kit (Invitrogen). Antibodies for staining were obtained from BD Pharmingen, BioLegend, or Invitrogen as listed with RRID. Samples were analyzed by the LSRFortessa cytometer (BD). Flow cytometry data were analyzed using Flowjo software (https://www.flowjo.com). Cell sorting was performed on the S3e cell sorter (Bio-Rad). All antibodies used in this study are listed in Table S3.
In vitro killing assay
CAR19TIF cells were sorted from donor mice as effector T cells, while B cells were isolated from B6 mice as target cells. These two subsets were cocultured in vitro at the indicated effector-to-target cell (E:T) ratios for 24 h at 37°C. In parallel, target cells were cultured alone to count the basal cell number. The percentage of specific lysis for a given E:T ratio was calculated as (B cell number of the control group—B cell number of CAR19TIF group) divided by the B cell number of the control group.
In vitro stimulation assay
CAR19TIF cells and endogenous CD8+ T cells were stimulated with B cells (E/T:1/1) for 24 h. Cell size and the expression of indicated protein were analyzed by flow cytometry.
Metabolic assays
OCR and ECAR were measured using the Seahorse XFe96 analyzer following the manufacturer’s instructions. Briefly, endogenous CD8+ T and CAR19TIF cells were sorted and allowed to recover in a humidified incubator at 37°C with 5% CO2 for 1 h. Endogenous CD8+ T and CAR19TIF cells were then suspended in XF medium and then plated in a poly-L-lysine-coated XF96 plate at a density of 3 × 10⁵ cells/well. OCR was measured in response to 2 μM oligomycin, 2 μM FCCP, 1 μM antimycin, and 1 μM rotenone (Cat# 103708-100; Agilent) sequentially. ECAR was measured in response to 10 mM glucose, 4 μM oligomycin, and 50 mM 2-DG (Cat# 103020-100; Agilent).
Untargeted metabolome analysis was performed using a UHPLC system (Vanquish, Thermo Fisher Scientific). In brief, endogenous CD8+ T cells and CAR19TIF cells were sorted by flow cytometry, stored in dry ice, and sent to Biotree (Shanghai) for LC/MS analysis. The raw data were converted to the mzXML format using ProteoWizard and processed with an in-house program, developed using R and based on XCMS for peak detection, extraction, alignment, and integration. Then, an in-house MS2 database (BiotreeDB) was applied for metabolite annotation with a cutoff set at 0.3. Pathway enrichment analysis was performed using KEGG (http://www.genome.jp/kegg/) and MetaboAnalyst (http://www.metaboanalyst.ca/).
Glucose uptake was examined by flow cytometry using 2-NBDG (Cat# HY-116215; MCE) in a glucose-free medium (Cat# CM15023; Macgene). Cells were washed with glucose-free medium and incubated with 100 μM 2-NBDG in glucose-free medium at 37°C for 30 min. The uptake of 2-NBDG was measured by flow cytometry. To examine the effect of adenosine on 2-NBDG uptake, cells were preincubated with 100 μM ADORA2A inhibitor ZM241385 (Cat# HY-19532; MCE) for 24 h, and then the uptake of 2-NBDG was measured as described above.
LCMV infections
The lymphocytic choriomeningitis virus (LCMV) Armstrong and Clone 13 strains were gifts from Yuncai Liu’s lab at Tsinghua University. In Fig. S1 O, mice were infected intraperitoneally with LCMV Armstrong (2 × 10⁵ plaque-forming units [PFU]). On day 7.5 after infection, CD8+ T cell response in the spleen was analyzed by flow cytometry. In Fig. 3 G, P14 cells were transduced with pMIG-IRES-GFP (empty) virus to track transferred cells. GFP+ P14 cells (1 × 10⁴) were transferred into B6 mice, and mice were infected intravenously with LCMV Clone 13 (2 × 10⁶ PFU). 8 wk after infection, CD8+GFP+ T cells in the spleen were analyzed by flow cytometry. Mice infected with LCMV virus were housed in accordance with the institutional biosafety regulations of Tsinghua University.
Bulk RNA sequencing and analysis
At indicated time points after the transfer, Thy1.1+CD8+ CAR19TIF cells, EGFRTIF cells, or endogenous CD8+ T cells were sorted by flow cytometry with purity >95% from the spleen of recipient mice. RNA samples were isolated and purified using TIANGEN RNAprep Pure Cell/Bacteria Kit, then shipped to BGI for library preparation and RNA sequencing on a DNBseq. Raw FASTQ files from sequencing were aligned to reference genome and reference gene set using HISAT/Bowtie2. Differential gene analysis was performed by DEseq2(R). Genes were determined differentially expressed if FDR < 0.001 and log-fold change >1 or <−1. GSEA and KEGG enrichment analysis with performed by ClusterProfiler (v3.14.0). Heatmaps and volcano plots were plotted by using ggplots2.
scRNA-seq and analysis
2 mo after transfer, CD8+Thy1.1+ CAR19TIF cells from recipient mice were sorted by flow cytometry and directly processed for scRNA-seq library preparation by using Chromium Single Cell 3′ Library & Gel Bead Kit v2 (10x Genomics) according to the manufacturer’s protocol. The ultimate constructed and purified library with the target recovery of ∼6,000 single cells was sequenced on Illumina Hiseq. Cell Ranger toolkit (v2.0.0) was used for 10x Genomics scRNA-seq data alignment and quantification. The generated data files including aligned and filtered reads, barcodes, and unique molecular identifiers were processed by Seurat (v3.1.1) for downstream analysis. For the data set, cells were considered low-quality and then excluded if number of detected genes <200 or >4,000. Cells were also removed if their mitochondrial gene proportions were >20%. Following the normalization process, the top 2,000 variable genes were chosen for principle component analysis. 1–10 PCs, determined by JackStraw function as significant ones, were selected for t-SNE and clustering analysis. Cluster-specific genes were identified using FindAllMarkers (log FC threshold = 0.25) function. FeaturePlot and VlnPlot functions were also used for data visualization. For topic modeling analysis, FitGoM function from CountClust (v.1.12.0) was used with the K number as 16 and tolerance value as 0.1. “Top genes” for a given topic were calculated by ExtractTopFeatures function.
Statistics and reproducibility
The statistical information of each experiment, including the statistical methods, the P value, and sample numbers (n) are shown in the figure or figure legends. GraphPad Prism 8 (https://www.graphpad.com) was used to plot all graphs and to perform statistical and quantitative assessments. Error bars represent the standard error of mean (SEM).
Online supplemental material
Fig. S1 shows that wild-type and BCOR-deficient CAR19T cells do not expand in immunocompetent mice after adoptive transfer. It also validates the knockout of ZC3H12A and editing of Bcor loci in CAR19TIF cells. CAR19TIF cells persisting in vivo do not cause side effects in mice. Fig. S2 shows that CAR19TIF cells from the bone marrow and liver also possess stemness. The phenotypical changes of CAR19TIF cells before and after expansion in recipient mice are shown. Fig. S3 shows that CAR19TIF cells remain polyclonal after serial transfers. Fig. S4 shows that CAR19TIF cells are relatively enriched in BM and dependent on CD19+ cells. Fig. S5 shows the distinct but cooperative roles between ZC3H12A deficiency and BCOR deficiency during the reprogramming of CAR19TIF cells. Fig. S6 shows scRNA-seq analysis of CAR19TIF cells. Fig. S7 shows the characterization of EGFRTIF cells. Table S1 shows the differentially expressed genes from scRNA-seq. Table S2 lists all the primers used in this study. Table S3 lists all the antibodies used in this study. Table S4 lists the protein sequences of all CARs used in this study.
Data availability
Transcriptome data have been deposited in the Gene Expression Omnibus under accession no. GSM5717963. All other data from this study have been shown in figures and supplementary materials.
Acknowledgments
We thank Xin Lin for providing plasmids containing EGFR sequence and EGFR CAR sequence; Xin Lin’s lab for technical help with human T cell culture and transduction; and Chen Dong’s lab for equipment.
This research was supported by National Natural Science Foundation of China (grant 82350108 to M. Peng), Vanke Special Fund for Public Health and Health Discipline Development Tsinghua University (NO.2022Z82WKJ013, to M. Peng), Tsinghua University DUSHI Program (52302102323, to M. Peng), Tsinghua-Peking Center for Life Sciences (to M. Peng), and SXMU-Tsinghua Collaborative Innovation Center for Frontier Medicine (to M. Peng).
Author contributions: L. Wang and G. Jin performed most experiments and analyzed data; Q. Zhou helped with human CAR T cell experiments; Y. Liu, Z. Li, X. Zhao, and N. Yin provided technical help; N. Yin supervised the project; M. Peng conceived and supervised the project, analyzed and interpreted data, and wrote the manuscript with inputs from all authors.

