


The site of transition between tissue-resident memory (TRM) and circulating phenotypes of T cells is unknown. We integrated clonotype, alloreactivity, and gene expression profiles of graft-repopulating recipient T cells in the intestinal mucosa at the single-cell level after human intestinal transplantation. Host-versus-graft (HvG)–reactive T cells were mainly distributed to TRM, effector T (Teff)/TRM, and T follicular helper compartments. RNA velocity analysis demonstrated a trajectory from TRM to Teff/TRM clusters in association with rejection. By integrating pre- and post-transplantation (Tx) mixed lymphocyte reaction–determined alloreactive repertoires, we observed that pre-existing HvG-reactive T cells that demonstrated tolerance in the circulation were dominated by TRM profiles in quiescent allografts. Putative de novo HvG-reactive clones showed a transcriptional profile skewed to cytotoxic effectors in rejecting grafts. Inferred protein regulon network analysis revealed upstream regulators that accounted for the effector and tolerant T cell states. We demonstrate Teff/TRM interchangeability for individual T cell clones with known (allo)recognition in the human gut, providing novel insight into TRM biology.
Introduction
Tissue-resident memory T cells (TRMs) are traditionally defined as non-recirculating cells that persist long-term in non-lymphoid tissues (NLTs) (Schenkel and Masopust, 2014). It has been generally accepted that TRM cells persist in the absence of antigens and provide rapid on-site immune protection against recurring infections (Casey et al., 2012; Mackay et al., 2012). Most TRM cells highly express the lectin protein CD69, and many CD8 TRMs coexpress the αE integrin CD103 (Thome and Farber, 2015). Human TRMs are further characterized by a set of core signature genes, including upregulation of tissue-homing marker CXCR6, tissue retention molecule CD49a, and downregulation of transcription factor KLF2 and surface markers CD62L and S1PR1 to avoid tissue exit (Kumar et al., 2017). Emerging studies have revealed the capacity for recirculation and phenotypic plasticity among TRMs in NLTs (Fu and Sykes, 2022). However, these conclusions have been drawn largely from murine studies (Behr et al., 2020, 2021; Beura et al., 2018, 2019; Bromley et al., 2013; Collins et al., 2016; Fonseca et al., 2020; Gebhardt et al., 2011; Schenkel et al., 2014), given the lack of accessibility of human NLTs for longitudinal studies. Although recent human studies at steady state (Klicznik et al., 2019) and in disease settings (Risnes et al., 2021; Strobl et al., 2021) showed clonal sharing between recirculating TRMs in the peripheral blood with NLTs and demonstrated that T cell clones exit the tissue to blood, the site of transition between TRM and circulating phenotypes has not been identified and a transitional phenotype has not been demonstrated for individual TRM clones.
Intestinal transplantation (ITx) provides a unique opportunity to study these fundamental questions in humans, given that serial biopsies are obtained during post-Tx clinical monitoring, and the intestinal mucosa is highly enriched for TRMs with donor- and recipient-derived cells that are distinguishable by allele-specific human leukocyte antigen (HLA) monoclonal antibodies via flow cytometry (Zuber et al., 2015). Long-term graft survival after ITx is hindered by rejection caused by alloreactive recipient T cells infiltrating the donor graft (Fu et al., 2021a). Our previous studies showed that a faster rate of donor T cell replacement by recipient T cells in the intestinal graft mucosa correlated with early rejection, which was associated with a preponderance of host-versus-graft (HvG) T cell clones (Zuber et al., 2016), defined by high-throughput sequencing of alloreactive clones from pre-Tx mixed lymphocyte reactions (MLR) (Morris et al., 2015; Obradovic et al., 2021b). Recipient T cells infiltrating the graft mucosa showed an effector T cell (Teff) phenotype (CD69low/−CD103low/−CD28+) early after Tx and eventually took on the TRM phenotype (CD69+CD103+/−CD28low/−) during quiescence. Interestingly, these recipient TRMs in intestinal allografts can regain features of circulating Teff cells during late rejections (e.g., upregulation of CD28 and NKG2D) (Zuber et al., 2016). Phenotypic data suggested an interchangeability between TRM and Teff phenotypes in the allograft, but this was not demonstrated at the clonal level. Furthermore, it was unknown whether the HvG-reactive recipient TRMs might tolerize to the donor. We have now performed single-cell immune profiling to integrate T cell clonotype, alloreactivity, and gene expression (GEX) profiles to address these issues.
Our data reveal heterogeneity within the allograft of pre-existing HvG-reactive T cells and identify a trajectory from TRM to Teff/TRM profiles in association with rejection and inflammation in the intestinal mucosa. We further demonstrated distinct contributions of potentially tolerant pre-existing HvG-reactive T cells in allografts that were dominated by TRM transcriptional profiles in quiescent but not rejecting grafts. Moreover, we identified putative de novo HvG-reactive T cells in post-Tx ileal grafts with a transcriptional profile that was highly skewed to activated cytotoxic effectors in rejecting, but not quiescent, grafts. Inferred protein regulon network analysis further identified upstream regulators that accounted for T cell effector function and tolerant features. Taken together, our study provides novel insights into the tissue residency and immune tolerance of alloreactive T cells in the graft after human ITx and a deeper understanding of TRM biology in humans.
Results
Expansion of HvG clones is greater in intestinal allografts than in peripheral blood during early rejection, and HvG clones persist long-term in the allograft despite rejection resolution
Our previous studies demonstrated marked enrichment of intragraft HvG-reactive T cells in the presence of early rejection (Zuber et al., 2016). However, the persistence of HvG T cells in the intestinal mucosa compared with peripheral blood late after Tx and their potential contributions to late rejection and the recipient TRM repertoire were not previously addressed. By performing high throughput T cell receptor (TCR) β chain CDR3 sequencing on serial intestinal biopsies and peripheral blood mononuclear cells (PBMCs), we found that the expansion of both CD4 and CD8 HvG-reactive clones, defined by pre-Tx CFSE-MLRs, within the recipient-mappable TCR repertoire, was significantly greater in intestinal allografts than in peripheral blood collected in the same period during early rejection (post-operative day [POD] < 100) (Fig. 1, A and B). Cumulative frequencies of CD4 and CD8 HvG-reactive clones among the recipient-mappable clones in post-Tx intestinal allografts and the peripheral blood were also higher than those in pre-Tx recipient lymphoid tissues (Fig. 1 A). Expanded HvG clones within the allograft were overall more dominant during early rejection (POD < 100) compared with late rejection (POD ≥ 100) or in the absence of rejection (Fig. 1, B and C). In fact, HvG cells accumulated similarly at low levels in ileal allografts in the presence and absence of late rejection (POD ≥ 100) (Fig. 1, B and C). These trends were largely consistent when patients were subgrouped (Fig. S1, A and B; and Table S1) by the status of blood macrochimerism (peak level of donor T cell chimerism in blood ≥4%), which we have shown to correlate with less rejection after ITx (Fu et al., 2019, 2021b; Zuber et al., 2015).
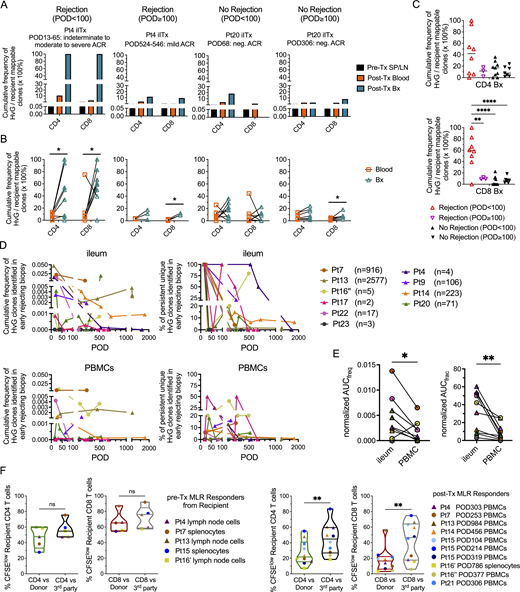
Expansion and persistence of HvG clones in intestinal allograft and peripheral blood over time, and hyporesponsiveness to donor antigens among post-Tx recipient T cells. (A) Cumulative frequency as a percentage of HvG clones among recipient mappable clones in pre-Tx recipient spleen (SP) or lymph nodes (LN), and post-Tx blood and ileum biopsy (Bx) collected within the same time period in the presence or absence of early (POD < 100) or late (POD ≥ 100) rejection from representative patients (Pts4, 20). (B) Cumulative frequency of HvG clones as a percentage of recipient mappable clones in post-Tx blood and ileum biopsy (Bx) collected within the same time period in the presence or absence of early (POD < 100) or late (POD ≥ 100) rejection from all patients combined are summarized (detailed information on patients and PODs is shown in Table S1). Paired t test was performed within CD4 or CD8 T cells (*P < 0.05). ACR: acute cellular rejection. Neg: negative for rejection. (C) Cumulative frequency of CD4 (upper panel) and CD8 (lower panel) HvG clones as a percentage of recipient CD4 and CD8 mappable clones, respectively, in post-Tx ileum biopsy, subgrouped by “Rejection (POD < 100),” “Rejection (POD ≥ 100),” “No Rejection (POD < 100),” and “No Rejection (POD ≥ 100).” One-way ANOVA followed by Tukey’s multiple comparisons test was performed to determine statistical significance (**P < 0.01, ****P < 0.0001). (D) Long-term follow-up of the persistence of HvG clones identified in early rejecting ileal biopsies and the dynamic changes of their cumulative frequency (left panels) and clone fraction (right panels) in ileal allografts (upper panels) and PBMCs (lower panels) post-Tx up to POD2000 in 10 patients. Cumulative frequency was calculated as a percentage of all sequences weighted by copy numbers in designated populations. Clone fraction was calculated as a percentage of unique sequences unweighted by copy numbers in designated populations. Number of unique HvG clones identified in early rejecting ileal biopsies in each patient is shown next to the symbol legend: MVTx (in circles), LITx (in squares), and iITx (in triangles). (E) For the cumulative frequency (freq) plot and clone fraction (frac) plot mentioned above, AUC normalized by days of measurement (PODlast – PODfirst) was calculated for each ileum and PBMC pair for each patient (n = 10). Paired t test was performed and P < 0.05 was considered statistically significant (*P < 0.05, **P < 0.01). (F) Left panels: Summary of % CFSElow (i.e., dividing cells) recipient CD4 and CD8 T cells in pre-Tx MLRs using pre-Tx recipient splenocytes (Pts7, 15) or lymph node cells (Pts4, 13, 16′) as responders against irradiated stimulators (donor pre-Tx antigens or third party antigens). Right panels: Summary of % CFSElow recipient CD4 and CD8 T cells in post-Tx MLRs using post-Tx PBMCs (Pt4 POD303, Pt7 POD253, Pt13 POD984, Pt14 POD456, Pt15 POD104/214/319, Pt16″ POD377, Pt21 POD306) or splenocytes (Pt16′ POD786) as responders against irradiated stimulators (donor pre-Tx antigens or third party antigens). Pt16′: first Tx of Pt16; Pt16″: second Tx of Pt16. Student’s t test was used to compare paired data as indicated (**P < 0.01; ns: not significant). Symbol legends: MVTx (circles), LITx (squares), or iITx (triangles).
Expansion and persistence of HvG clones in intestinal allograft and peripheral blood over time, and hyporesponsiveness to donor antigens among post-Tx recipient T cells. (A) Cumulative frequency as a percentage of HvG clones among recipient mappable clones in pre-Tx recipient spleen (SP) or lymph nodes (LN), and post-Tx blood and ileum biopsy (Bx) collected within the same time period in the presence or absence of early (POD < 100) or late (POD ≥ 100) rejection from representative patients (Pts4, 20). (B) Cumulative frequency of HvG clones as a percentage of recipient mappable clones in post-Tx blood and ileum biopsy (Bx) collected within the same time period in the presence or absence of early (POD < 100) or late (POD ≥ 100) rejection from all patients combined are summarized (detailed information on patients and PODs is shown in Table S1). Paired t test was performed within CD4 or CD8 T cells (*P < 0.05). ACR: acute cellular rejection. Neg: negative for rejection. (C) Cumulative frequency of CD4 (upper panel) and CD8 (lower panel) HvG clones as a percentage of recipient CD4 and CD8 mappable clones, respectively, in post-Tx ileum biopsy, subgrouped by “Rejection (POD < 100),” “Rejection (POD ≥ 100),” “No Rejection (POD < 100),” and “No Rejection (POD ≥ 100).” One-way ANOVA followed by Tukey’s multiple comparisons test was performed to determine statistical significance (**P < 0.01, ****P < 0.0001). (D) Long-term follow-up of the persistence of HvG clones identified in early rejecting ileal biopsies and the dynamic changes of their cumulative frequency (left panels) and clone fraction (right panels) in ileal allografts (upper panels) and PBMCs (lower panels) post-Tx up to POD2000 in 10 patients. Cumulative frequency was calculated as a percentage of all sequences weighted by copy numbers in designated populations. Clone fraction was calculated as a percentage of unique sequences unweighted by copy numbers in designated populations. Number of unique HvG clones identified in early rejecting ileal biopsies in each patient is shown next to the symbol legend: MVTx (in circles), LITx (in squares), and iITx (in triangles). (E) For the cumulative frequency (freq) plot and clone fraction (frac) plot mentioned above, AUC normalized by days of measurement (PODlast – PODfirst) was calculated for each ileum and PBMC pair for each patient (n = 10). Paired t test was performed and P < 0.05 was considered statistically significant (*P < 0.05, **P < 0.01). (F) Left panels: Summary of % CFSElow (i.e., dividing cells) recipient CD4 and CD8 T cells in pre-Tx MLRs using pre-Tx recipient splenocytes (Pts7, 15) or lymph node cells (Pts4, 13, 16′) as responders against irradiated stimulators (donor pre-Tx antigens or third party antigens). Right panels: Summary of % CFSElow recipient CD4 and CD8 T cells in post-Tx MLRs using post-Tx PBMCs (Pt4 POD303, Pt7 POD253, Pt13 POD984, Pt14 POD456, Pt15 POD104/214/319, Pt16″ POD377, Pt21 POD306) or splenocytes (Pt16′ POD786) as responders against irradiated stimulators (donor pre-Tx antigens or third party antigens). Pt16′: first Tx of Pt16; Pt16″: second Tx of Pt16. Student’s t test was used to compare paired data as indicated (**P < 0.01; ns: not significant). Symbol legends: MVTx (circles), LITx (squares), or iITx (triangles).
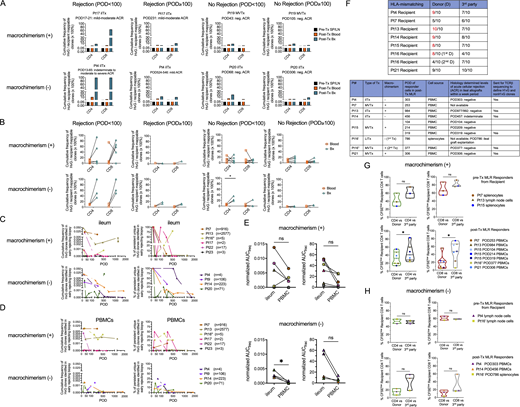
Expansion and persistence of HvG clones in intestinal allografts and peripheral blood over time, and hyporesponsiveness to donor antigens among post-Tx recipient T cells in patients with or without macrochimerism. (A) Cumulative frequency as a percentage of HvG clones among recipient mappable clones in pre-Tx recipient spleen (SP) or lymph nodes (LN), and post-Tx blood and ileum biopsy (Bx) collected within the same time period in the presence or absence of early (POD < 100) or late (POD ≥ 100) rejection from representative patients with (Pts17, 19) and without (Pts4, 20) macrochimerism. (B) Cumulative frequency of HvG clones as a percentage of recipient mappable clones in post-Tx blood and ileum biopsy (Bx) collected within the same time period in the presence or absence of early (POD < 100) or late (POD ≥ 100) rejection from patients with and without macrochimerism (detailed information on patients and PODs is shown in Table S1). Paired t test was performed within CD4 or CD8 T cells (*P < 0.05). ACR: acute cellular rejection. Neg: negative for rejection. (C and D) Long-term follow-up of the persistence of HvG clones identified in early rejecting ileal biopsies and the dynamic changes of their cumulative frequency (left panels) and clone fraction (right panels) in ileal allograft (C) and PBMCs (D) post-Tx up to POD2000 in patients with (n = 6) and without (n = 4) macrochimerism. Number of unique HvG clones identified in early rejecting ileal biopsies in each patient is shown next to the symbol legends: MVTx (in circles), LITx (in squares), and iITx (in triangles). (E) For the cumulative frequency (freq) plot and clone fraction (frac) plot mentioned above, AUC normalized by days of measurement (PODlast – PODfirst) was calculated for paired ileum and PBMC samples from patients with (upper panel, n = 6) and without (lower panel, n = 4) macrochimerism. Paired t test was performed and P < 0.05 was considered statistically significant (*P < 0.05). (F) Upper panel: Degree of HLA-mismatching of alleles of HLA-A, B, C, DR, DQ between each recipient (Pts4, 7, 13, 14, 15, 16′, 16″, 21) with their donor or third party. Lower panel: Type of Tx, status of macrochimerism (peak level of donor T cell chimerism in blood ≥4%), date of sampling of responder cells in post-Tx MLRs, including those sent for bulk TCRβ sequencing, and histologically determined levels of ACR in ileal allografts within a 1-wk period. (G) For patients with macrochimerism: Upper panel (n = 3): Summary of % CFSElow (i.e., dividing cells) recipient CD4 and CD8 T cells in pre-Tx MLRs using pre-Tx recipient splenocytes or lymph node cells as responders against irradiated stimulators (donor or third party antigens). Lower panel (n = 7): Summary of % CFSElow recipient CD4 and CD8 T cells in post-Tx MLRs using post-Tx PBMCs as responders against irradiated stimulators (donor or third party antigens). (H) For patients without macrochimerism: Upper panel (n = 2): Summary of % CFSElow recipient CD4 and CD8 T cells in pre-Tx MLRs using pre-Tx recipient lymph node cells as responders against irradiated stimulators (donor or third party antigens). Lower panel (n = 3): Summary of % CFSElow recipient CD4 and CD8 T cells in post-Tx MLRs using post-Tx PBMCs or splenocytes as responders against irradiated stimulators (donor or third party antigens). Pt16′: First Tx of Pt16; Pt16″: Second Tx of Pt16. Student’s t test was used to compare paired data as indicated (*P < 0.05; ns: not significant).
Expansion and persistence of HvG clones in intestinal allografts and peripheral blood over time, and hyporesponsiveness to donor antigens among post-Tx recipient T cells in patients with or without macrochimerism. (A) Cumulative frequency as a percentage of HvG clones among recipient mappable clones in pre-Tx recipient spleen (SP) or lymph nodes (LN), and post-Tx blood and ileum biopsy (Bx) collected within the same time period in the presence or absence of early (POD < 100) or late (POD ≥ 100) rejection from representative patients with (Pts17, 19) and without (Pts4, 20) macrochimerism. (B) Cumulative frequency of HvG clones as a percentage of recipient mappable clones in post-Tx blood and ileum biopsy (Bx) collected within the same time period in the presence or absence of early (POD < 100) or late (POD ≥ 100) rejection from patients with and without macrochimerism (detailed information on patients and PODs is shown in Table S1). Paired t test was performed within CD4 or CD8 T cells (*P < 0.05). ACR: acute cellular rejection. Neg: negative for rejection. (C and D) Long-term follow-up of the persistence of HvG clones identified in early rejecting ileal biopsies and the dynamic changes of their cumulative frequency (left panels) and clone fraction (right panels) in ileal allograft (C) and PBMCs (D) post-Tx up to POD2000 in patients with (n = 6) and without (n = 4) macrochimerism. Number of unique HvG clones identified in early rejecting ileal biopsies in each patient is shown next to the symbol legends: MVTx (in circles), LITx (in squares), and iITx (in triangles). (E) For the cumulative frequency (freq) plot and clone fraction (frac) plot mentioned above, AUC normalized by days of measurement (PODlast – PODfirst) was calculated for paired ileum and PBMC samples from patients with (upper panel, n = 6) and without (lower panel, n = 4) macrochimerism. Paired t test was performed and P < 0.05 was considered statistically significant (*P < 0.05). (F) Upper panel: Degree of HLA-mismatching of alleles of HLA-A, B, C, DR, DQ between each recipient (Pts4, 7, 13, 14, 15, 16′, 16″, 21) with their donor or third party. Lower panel: Type of Tx, status of macrochimerism (peak level of donor T cell chimerism in blood ≥4%), date of sampling of responder cells in post-Tx MLRs, including those sent for bulk TCRβ sequencing, and histologically determined levels of ACR in ileal allografts within a 1-wk period. (G) For patients with macrochimerism: Upper panel (n = 3): Summary of % CFSElow (i.e., dividing cells) recipient CD4 and CD8 T cells in pre-Tx MLRs using pre-Tx recipient splenocytes or lymph node cells as responders against irradiated stimulators (donor or third party antigens). Lower panel (n = 7): Summary of % CFSElow recipient CD4 and CD8 T cells in post-Tx MLRs using post-Tx PBMCs as responders against irradiated stimulators (donor or third party antigens). (H) For patients without macrochimerism: Upper panel (n = 2): Summary of % CFSElow recipient CD4 and CD8 T cells in pre-Tx MLRs using pre-Tx recipient lymph node cells as responders against irradiated stimulators (donor or third party antigens). Lower panel (n = 3): Summary of % CFSElow recipient CD4 and CD8 T cells in post-Tx MLRs using post-Tx PBMCs or splenocytes as responders against irradiated stimulators (donor or third party antigens). Pt16′: First Tx of Pt16; Pt16″: Second Tx of Pt16. Student’s t test was used to compare paired data as indicated (*P < 0.05; ns: not significant).
To further understand the persistence of graft-infiltrating HvG-reactive T cells, we focused on HvG-reactive clones identified in early rejecting ileum biopsies (POD < 100) and tracked them in late allografts and circulation (POD ≥ 100). The absolute number of unique HvG clones identified in early rejecting biopsies varied from 2 to 2,577 (median: 44) across 10 patients who met inclusion criteria (Fig. 1 D). Clonal tracking plots of HvG clones identified in early rejecting allografts measured by either cumulative frequency (unique clones weighted by copy number) or clone fraction (unique clones not weighted by copy number) showed long-term persistence of at least a proportion of HvG clones in both ileum and PBMCs, despite rejection resolution (Fig. 1 D). The degree of late persistence of these early graft-infiltrating HvG clones, reflected by normalized area under the curve (AUC) values, was significantly higher in ileum compared to PBMCs within individuals (Fig. 1 E). Again, these trends were largely consistent when patients were subgrouped (Fig. S1, C–E) by macrochimerism status. These data are consistent with our previous findings (Zuber et al., 2016) and suggest that HvG-reactive T cells infiltrating allografts during early rejections may become TRM and persist long-term in the ileal allografts, posing a constant threat of late rejection, or alternatively, becoming tolerized.
Long-term recipient T cells in circulation and lymphoid tissues are hyporesponsive to donor antigens in post-Tx MLRs
Our hypothesis of local tolerance of pre-existing HvG-reactive T cells was suggested by observations from post-Tx MLRs on T cells in the circulation and lymphoid tissues. We found that, unlike pre-Tx recipient T cells from spleen and lymph nodes that react strongly to both donor and third-party antigens (Fig. 1 F), recipient PBMCs or splenocytes collected late after Tx (POD104-984) had significantly lower percentages of CD4 and CD8 CFSElow cells (i.e., dividing cells) when tested against donor antigens compared with the third party (Fig. 1 F). Importantly, this hyporesponsiveness of recipient post-Tx T cells to donor antigens was not associated with less HLA-mismatching because, in five out of eight cases, the recipient had a higher degree of HLA mismatch to the donor than to the third party (Fig. S1 F). When subgrouped by the status of macrochimerism (Fig. S1, G and H), patients with and without macrochimerism all demonstrated the trend described in Fig. 1 F. Taken together, our data suggest that hyporesponsiveness to the donor was induced among circulating and splenic recipient T cells late after Tx.
Single-cell RNA sequencing (scRNA-seq) of recipient T cells in intestinal allografts in the presence or absence of rejection
To definitively address the hypothesis that intragraft HvG-reactive T cells that expand during early rejection persist long-term and acquire TRM features, potentially contributing to late rejection or becoming hyporesponsive to the donor, we performed in-depth studies by integrating alloreactive T cell clonotypes with functional transcriptomic profiles at the single cell level (see Materials and methods and Fig. S2), as described in the following figures. Understanding the immunological features of graft-infiltrating recipient T cells in relation to potential alloreactivity at the clonal level could determine the following: (1) whether pre-Tx MLR-defined HvG-reactive T cells in the late allograft are still capable of rejection or may be tolerized; (2) whether de novo HvG clones developing after Tx may contribute to late rejections. We first focused on the transcriptomic profiles of recipient T cells in intestinal grafts during late quiescence or rejection. scRNA-seq data were generated from FACS-sorted recipient HLA+ CD45+ CD3+ T cells from fresh or frozen/thawed suspensions of intraepithelial lymphocytes (IEL) and/or lamina propria lymphocytes (LPL), isolated from ileal biopsies or tissue resections collected during the late post-Tx (POD626-1764) period from a total of six pediatric ITx patients (Table S2), including six quiescent and five rejecting allograft specimens. Samples from Pt15 multivisceral Tx (MVTx) POD1194 (IEL + LPL mixed), Pt13 isolated ITx (iITx) POD1032 IEL and LPL, Pt16″ (secondary Tx of Pt16) MVTx POD1004 IEL and LPL, and Pt21 MVTx POD626 (IEL + LPL mixed) were quiescent and free of rejection. All rejecting allograft specimens used in the scRNA-seq study, including Pt4 iITx POD1606 IEL and LPL, Pt14 iITx POD1764 IEL + LPL mixed, and Pt21 MVTx POD1145 IEL and LPL, were collected during ileal graft explantation, providing a snapshot of immunological events during graft loss (Table S2).

Pipeline for integrated analysis at the transcriptomic and alloreactive clonal levels and flow diagram of experimental design and data analysis related to scRNA-seq . (A) Integrated V(D)J and gene expression analysis with alloreactivity annotation. Illustration of data integration between bulk TCRβ-seq and scRNA-seq. The latter combines 5′GEX-seq and TCRαβ-seq by identifying TCRβ chain CDR3 nucleotide + TRBV + TRBJ sequences in individual cells undergoing immune profiling by transcriptional analysis. T cells are annotated as CD4 or CD8 HvG or non-HvG or as undetected by interrogation of the sequence set defined as alloreactive or non-alloreactive from pre-Tx MLRs. Similarly, post-Tx MLR using post-Tx recipient PBMCs as responders and pre-Tx donor spleen (SP) or lymph node (LN) cells as stimulators allow us to define CD4 or CD8 H’vG (H’: post-Tx host) and non-H’vG or post-Tx undetected repertoires. By combining pre- and post-Tx MLRs, several functional repertoires can be categorized as follows: persistent HvG (HvG in pre-Tx MLR and H’vG in post-Tx MLR); tolerant HvG (HvG in pre-Tx MLR and non-H'vG in post-Tx MLR but detectable in post-Tx unstimulated repertoire); missing HvG (HvG in pre-Tx MLR and not detected in post-Tx MLR or unstimulated samples); acquired H’vG (non-HvG in pre-Tx MLR and H’vG in post-Tx MLR); de novo H’vG (undetectable in pre-Tx MLR or unstimulated repertoires and H’vG in post-Tx MLR); persistent non-HvG (non-HvG in pre-Tx MLR and non-H’vG in post-Tx MLRs but detectable in pre- and post-Tx unstimulated repertoires). scRNA-seq was performed using the 10x Genomics platform for simultaneous measurement of mRNA expression by 5′GEX-seq and paired V(D)J TCR α and β sequences at the single cell level by scTCRαβ-seq. Single-cell TCRβ sequences from intestinal allograft mucosal specimens sorted on recipient HLA+ T cells were mapped to the above-mentioned pre- and post-Tx MLR-defined sequence sets to allow alloreactivity annotation on each cell. (B) Flow diagram of experimental design and data analysis related to scRNA-seq for each main figure and associated supplemental figures and tables.
Pipeline for integrated analysis at the transcriptomic and alloreactive clonal levels and flow diagram of experimental design and data analysis related to scRNA-seq . (A) Integrated V(D)J and gene expression analysis with alloreactivity annotation. Illustration of data integration between bulk TCRβ-seq and scRNA-seq. The latter combines 5′GEX-seq and TCRαβ-seq by identifying TCRβ chain CDR3 nucleotide + TRBV + TRBJ sequences in individual cells undergoing immune profiling by transcriptional analysis. T cells are annotated as CD4 or CD8 HvG or non-HvG or as undetected by interrogation of the sequence set defined as alloreactive or non-alloreactive from pre-Tx MLRs. Similarly, post-Tx MLR using post-Tx recipient PBMCs as responders and pre-Tx donor spleen (SP) or lymph node (LN) cells as stimulators allow us to define CD4 or CD8 H’vG (H’: post-Tx host) and non-H’vG or post-Tx undetected repertoires. By combining pre- and post-Tx MLRs, several functional repertoires can be categorized as follows: persistent HvG (HvG in pre-Tx MLR and H’vG in post-Tx MLR); tolerant HvG (HvG in pre-Tx MLR and non-H'vG in post-Tx MLR but detectable in post-Tx unstimulated repertoire); missing HvG (HvG in pre-Tx MLR and not detected in post-Tx MLR or unstimulated samples); acquired H’vG (non-HvG in pre-Tx MLR and H’vG in post-Tx MLR); de novo H’vG (undetectable in pre-Tx MLR or unstimulated repertoires and H’vG in post-Tx MLR); persistent non-HvG (non-HvG in pre-Tx MLR and non-H’vG in post-Tx MLRs but detectable in pre- and post-Tx unstimulated repertoires). scRNA-seq was performed using the 10x Genomics platform for simultaneous measurement of mRNA expression by 5′GEX-seq and paired V(D)J TCR α and β sequences at the single cell level by scTCRαβ-seq. Single-cell TCRβ sequences from intestinal allograft mucosal specimens sorted on recipient HLA+ T cells were mapped to the above-mentioned pre- and post-Tx MLR-defined sequence sets to allow alloreactivity annotation on each cell. (B) Flow diagram of experimental design and data analysis related to scRNA-seq for each main figure and associated supplemental figures and tables.
We also included a normal ileum control sample (IEL + LPL mixed) from a non-transplant deceased donor #251 (D251: 9 years old) (Table S2; in Figs. 2, 3, and 5, referred to as “non-transplant control”). Recipient age at the time of sampling for scRNA-seq was between 4 and 11 years old (median: 6 years old). Donor age was between 4 mo and 7 years (median: 2 years old). The number of single cells identified from 5′ GEX sequencing (5′GEX-seq) before the quality control (QC) step was 2,526 to 27,730 (median: 5,421) (Table S2). The Seurat analysis pipeline (Butler et al., 2018; Hao et al., 2021; Stuart et al., 2019) was used to perform the downstream analysis of scRNA-seq data, such as QC, normalization, down sampling, clustering, and differential GEX analysis (see Materials and methods).
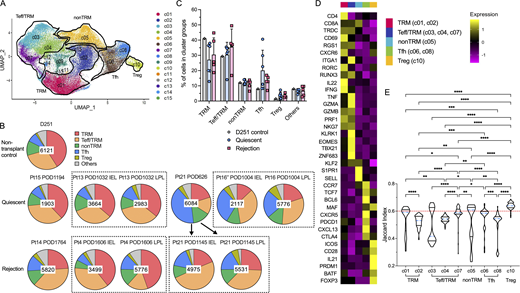
Cluster distribution and stability of recipient intestinal graft T cells after Tx. (A) Combined UMAP plots show cell clusters in all samples, with key phenotypes of major cluster groups noted next to black gated clusters: multifunctional TRM (c01/c02); nonTRM (c05), Tfh (c06/c08); Tregs (c10); cytotoxic Teff/TRM (c03/c04/c07). See Table S3 for representative DE genes in each cluster compared to other clusters for major cluster group determination. (B) Proportional constitution of the above cluster groups identified in quiescent (Pt13_POD1032_IEL, Pt13_POD1032_LPL, Pt15_POD1194, Pt16″_POD1004_LPL, Pt16″_POD1004_LPL, Pt21_POD626) and rejecting allografts (Pt4_POD1606_IEL, Pt4_POD1606_LPL, Pt14_POD1764, Pt21_POD1145_IEL, Pt21_POD1145_LPL), as well as in a deceased donor non-transplant control (D251) ileum sample is shown in pie charts. The number in the center of each pie chart represents the total number of single cells in that sample. (C) Percentages of cells in each cluster group identifiable in D251 control, quiescent (n = 6) or rejecting (n = 5) ileal specimens (see Table S4 for absolute cell counts). No statistical difference was found among D251 control, quiescent, and rejecting samples within each cluster group by two-way ANOVA followed by Tukey’s multiple comparisons test (P > 0.05). (D) Heatmap of dominant DE genes in each T cell cluster group (TRM, Teff/TRM, nonTRM, Tfh, Tregs) color-coded by log2 fold change. (E) Violin plots of Jaccard similarity index to evaluate single cell cluster stability. The blue dotted line within each violin plot represents the median of Jaccard index within that cluster. The red dotted line at y axis = 0.6 indicates a reference Jaccard index cut-off value. Clusters with a median stability score <0.6 are considered as unstable. Kruskal–Wallis test by ranks followed by Dunn’s multiple comparisons test was performed to determine significant differences of Jaccard indices between each two clusters (*adjusted P < 0.05, **adjusted P < 0.01, ***adjusted P < 0.001, ****adjusted P < 0.0001).
Cluster distribution and stability of recipient intestinal graft T cells after Tx. (A) Combined UMAP plots show cell clusters in all samples, with key phenotypes of major cluster groups noted next to black gated clusters: multifunctional TRM (c01/c02); nonTRM (c05), Tfh (c06/c08); Tregs (c10); cytotoxic Teff/TRM (c03/c04/c07). See Table S3 for representative DE genes in each cluster compared to other clusters for major cluster group determination. (B) Proportional constitution of the above cluster groups identified in quiescent (Pt13_POD1032_IEL, Pt13_POD1032_LPL, Pt15_POD1194, Pt16″_POD1004_LPL, Pt16″_POD1004_LPL, Pt21_POD626) and rejecting allografts (Pt4_POD1606_IEL, Pt4_POD1606_LPL, Pt14_POD1764, Pt21_POD1145_IEL, Pt21_POD1145_LPL), as well as in a deceased donor non-transplant control (D251) ileum sample is shown in pie charts. The number in the center of each pie chart represents the total number of single cells in that sample. (C) Percentages of cells in each cluster group identifiable in D251 control, quiescent (n = 6) or rejecting (n = 5) ileal specimens (see Table S4 for absolute cell counts). No statistical difference was found among D251 control, quiescent, and rejecting samples within each cluster group by two-way ANOVA followed by Tukey’s multiple comparisons test (P > 0.05). (D) Heatmap of dominant DE genes in each T cell cluster group (TRM, Teff/TRM, nonTRM, Tfh, Tregs) color-coded by log2 fold change. (E) Violin plots of Jaccard similarity index to evaluate single cell cluster stability. The blue dotted line within each violin plot represents the median of Jaccard index within that cluster. The red dotted line at y axis = 0.6 indicates a reference Jaccard index cut-off value. Clusters with a median stability score <0.6 are considered as unstable. Kruskal–Wallis test by ranks followed by Dunn’s multiple comparisons test was performed to determine significant differences of Jaccard indices between each two clusters (*adjusted P < 0.05, **adjusted P < 0.01, ***adjusted P < 0.001, ****adjusted P < 0.0001).

RNA velocity analysis reveals interchangeability between TRM and Teff/TRM cluster groups in association with rejection and inflammation in the intestinal mucosa. (A) Velocities across all genes and all cells are visualized as streamlines embedded in UMAPs in the indicated samples: MJ007, MJ001, MJ006, MJ018, MJ019, and MJ005, illustrating the direction of movement of the velocity vector within and across clusters. (B) Pseudotime across all genes and all cells ranges from 0 to 1 projected to UMAPs. Pseudotime is a time-like dimension that measures the cells’ progress through transitions. (C) Directionality of PAGA projected to UMAPs showing selected TRM (c01, c02) and Teff/TRM (c03, c04, c07) cluster groups. PAGA reconciles clustering with trajectory inference through a topology-preserving map of single cells. (D) In combined quiescent (upper panel) and rejecting (lower panel) groups, velocities are visualized as streamlines in a UMAP-based embedding (left panel), pseudotime projected to UMAPs (middle panel), and directionality of PAGA projected to UMAPs showing selected TRM (c01, c02) and Teff/TRM (c03, c04, c07) cluster groups.
RNA velocity analysis reveals interchangeability between TRM and Teff/TRM cluster groups in association with rejection and inflammation in the intestinal mucosa. (A) Velocities across all genes and all cells are visualized as streamlines embedded in UMAPs in the indicated samples: MJ007, MJ001, MJ006, MJ018, MJ019, and MJ005, illustrating the direction of movement of the velocity vector within and across clusters. (B) Pseudotime across all genes and all cells ranges from 0 to 1 projected to UMAPs. Pseudotime is a time-like dimension that measures the cells’ progress through transitions. (C) Directionality of PAGA projected to UMAPs showing selected TRM (c01, c02) and Teff/TRM (c03, c04, c07) cluster groups. PAGA reconciles clustering with trajectory inference through a topology-preserving map of single cells. (D) In combined quiescent (upper panel) and rejecting (lower panel) groups, velocities are visualized as streamlines in a UMAP-based embedding (left panel), pseudotime projected to UMAPs (middle panel), and directionality of PAGA projected to UMAPs showing selected TRM (c01, c02) and Teff/TRM (c03, c04, c07) cluster groups.
We generated integrated uniform manifold approximation and projection (UMAP) plots in a combined (Fig. 2 A) layout by anchor-based analysis as described previously (Stuart et al., 2019). Recipient mucosal T cells from six quiescent and five rejecting allograft specimens and the non-transplant control intestine shared at least five transcriptionally defined cluster groups (Fig. 2, A–D; and Table S3): multifunctional (IL22+, IFNG+, GZMB+) TRMs (CD69+, RGS1+, CXCR6+, RUNX3+, KLF2−), c01 and c02; cytotoxic γδ and CD8 αβ T cells with mixed Teff and TRM features (Teff/TRM: CD69low, RGS1+, RUNX3+, KLF2+, TBX21+, GZMB+): c03, c04, and c07; nonTRMs (S1PR1+, SELL+, KLF2+, CCR7+), c05; follicular helper T cells (Tfh: CXCR5+, PDCD1+, BCL6+, CXCL13+), c06 and c08; and regulatory T cells (Tregs: FOXP3+, CTLA4+) with a more differentiated effector profile (PRDM1+, ICOS+, BATF+) as described previously (Mijnheer et al., 2021), c10. Clusters c11–c13 are mainly contaminating B cells and monocytes, including only low numbers of cells, and are not discussed further. Clusters c09, c14, and c15 had previously undefined phenotypes and had high mitochondrial gene expression even after the application of QC steps (see Materials and methods). These minor clusters are discussed briefly below.
There was no significant difference in terms of cluster group composition between the quiescent and rejecting groups overall (Fig. 2, B and C; and Table S4). However, distinct histologic patterns were observed between these two groups. Immunohistochemistry (IHC) staining on matched clinical specimens obtained from the same patient on the same day of sampling as mentioned above in the quiescent group (Table S2) showed intact villi, crypt structures, and lymphoid aggregates (i.e., Peyer’s patches) in ileal mucosa with normal-appearing distributions of T cells (CD3+ CD8+/−), B cells (CD20+), and plasma cells (CD138+) (Fig. S3 A). In contrast, in rejecting Pt4 iITx POD1606, the ileal graft explant exhibited histologic evidence of chronic rejection and ischemia with persistent acute rejection that was present since POD513 (Table S2); IHC staining showed patchy areas of mucosal ulceration with less distinct long villi and alignment of T cells and B cells at the lamina propria (Fig. S3 B). Additionally, ischemic fibrosis and necrosis extended to the submucosa. In rejecting Pt14 iITx POD1764, the ileal graft explant exhibited histologic evidence of chronic rejection with persistent acute rejection since POD727 (Table S2) and serum donor–specific antibody on POD1743. IHC staining on POD1764 showed severe distortion of ileal mucosal and submucosal structures with infiltrating CD8+ T cells, B cells, and plasma cells (Fig. S3 B).

IHC staining of T, B, and plasma cells in quiescent and rejecting ileal grafts . (A and B) IHC staining of CD3, CD8, CD20, and CD138 on consecutive FFPE tissue slides of (A) quiescent ileal graft samples (Pt13 POD1032, Pt15 POD1194, Pt16″ POD1004 and Pt21 POD626 are shown) and (B) rejecting ileal graft samples (Pt4 POD1606, Pt14 POD1764, and Pt21 POD1145 are shown). Red scale bar (100 μm) and blue scale bar (300 μm) are shown on the CD3 panel and apply to all figures within each column.
IHC staining of T, B, and plasma cells in quiescent and rejecting ileal grafts . (A and B) IHC staining of CD3, CD8, CD20, and CD138 on consecutive FFPE tissue slides of (A) quiescent ileal graft samples (Pt13 POD1032, Pt15 POD1194, Pt16″ POD1004 and Pt21 POD626 are shown) and (B) rejecting ileal graft samples (Pt4 POD1606, Pt14 POD1764, and Pt21 POD1145 are shown). Red scale bar (100 μm) and blue scale bar (300 μm) are shown on the CD3 panel and apply to all figures within each column.
In one patient (Pt21) for whom we captured both early quiescent (POD626) and late rejection/graft explant (POD1145) timepoints, we observed decreased percentages of Tfh cells and increased percentages of cytotoxic Teff/TRM cells over time (Fig. 2 B). These observations are in line with the IHC staining: Peyer’s patches were present at the early quiescent time point (POD626) with well-preserved villi and crypt structures (Fig. S3 A), but in the explanted ileal graft during late rejection on POD1145 there was obvious distortion of mucosal structures with focal enrichment of CD8+ T cells and B cells (Fig. S3 B).
To better quantify the stability and plasticity of clusters defined by scRNA-seq, we applied the Jaccard similarity index (Tang et al., 2021), which is based on the principle that if a cluster is robust and stable (a mean/median stability score/Jaccard index >0.6), random subsetting and resclustering will keep the cell identities within the same cluster. Using the median Jaccard index (Fig. 2 E), we found that the Treg cluster (c10) was the most stable in our dataset, followed by the nonTRM cluster (c05). The Teff/TRM cluster group (especially c03, c04, and to a lesser extent c07) showed the least stability among the five major cluster groups, reflected by the median Jaccard index distributions (Fig. 2 E).
The trajectory from TRM to Teff/TRM clusters associates with rejection and inflammation in the intestinal mucosa
To obtain a deeper understanding of the transcriptional dynamics of defined cluster groups, especially the relationship between TRM and Teff/TRM clusters, RNA velocity analysis was performed using the previously-described scVelo Python package to predict cell fate via streamline (Fig. 3 A) and pseudotime (Fig. 3 B) trajectories and partition-based graph abstraction (PAGA) (Fig. 3 C) (Bergen et al., 2020; Wolf et al., 2019). The quiescent ileal biopsy sample from Pt15 POD1194 (MJ001) showed similar transcriptional dynamics (Fig. 3, A–C) as the ileum of the non-transplant control deceased donor D251 (MJ007), including not only comparable streamline-embedded UMAPs (Fig. 3 A) and pseudotime color–scaled UMAPs (Fig. 3 B) but also a trajectory from Teff/TRM (c07) to TRM (c01) clusters, and transiting status within Teff/TRM (c07 to c03/c04) and TRM (c01 to c02) clusters (Fig. 3 C). A similar trajectory pattern from Teff/TRM to TRM clusters was seen in another quiescent sample from Pt21 POD626 (MJ006). In sharp contrast, a trajectory from TRM to Teff/TRM was observed in this patient during late rejection and graft explantation on POD1145 (MJ018; MJ019), as well as in other rejecting samples from different patients (Fig. 3, MJ005; Fig. S4, A and B, MJ008), suggesting that rejection is associated with the transition of TRMs to the Teff/TRM transitional cluster.

RNA velocity analysis for indicated scRNA-seq samples and H&E staining for paired ileal stoma and regular ileal biopsies in two patients . (A) Pseudotime trajectory ranges from 0 to 1 projected to UMAPs for the following samples: MJ008, MJ009, MJ002, MJ003, MJ016, and MJ017. (B) Directionality of PAGA projected to UMAPs showing selected TRM (c01, c02) and Teff/TRM (c03, c04, c07) cluster groups for the following samples: MJ008, MJ009, MJ002, MJ003, MJ016, and MJ017. (C) Illustration of a phase portrait plot, adapted from previously published work (Bergen et al., 2020), indicates the assignment of three different states of a particular gene. (1) Steady state: A black dotted line corresponds to the estimated steady state ratio of unspliced versus spliced mRNA. (2) Induction state: A green arrow curve that deviates above the steady state line corresponds to a higher abundance of unspliced mRNA, indicating gene upregulation. (3) Repression state: A blue arrow curve that deviates below the steady state line corresponds to a higher abundance of spliced mRNA, indicating gene downregulation. (D) Representative putative velocity driver genes for phase portraits (upper panel: x axis: spliced RNA; y axis: unspliced RNA) and expression dynamics along latent time (lower panel: x axis: latent time; y axis: spliced RNA) for each sample (MJ007, MJ001, MJ006, MJ018, MJ019, and MJ005). The latent time approximates the real time experienced by cells as they differentiate, based on their transcriptional dynamics. (E and F) H&E staining for ileal stoma and regular ileal biopsy taken within the same week during quiescence (shown in 10× and 20× magnifications). Green scale bars (200 μm) and black scale bars (100 μm) are shown on each panel as indicated in the figure. (E) Pt21’s biopsy is normal, without inflammation or increase in apoptosis, and good villous architecture. Pt21’s stoma sample taken on POD262 has many nonspecific inflammatory changes, including blunted villi, increased chronic inflammatory cell infiltration and neutrophilic infiltration. (F) Ileal biopsy from Pt16″ shows nonspecific reactive changes, but without increase in apoptosis or active/chronic inflammation. The stoma sample taken on POD1004 shows nonspecific inflammatory changes, including blunted villi, increased chronic inflammatory cell infiltration and scattered neutrophils.
RNA velocity analysis for indicated scRNA-seq samples and H&E staining for paired ileal stoma and regular ileal biopsies in two patients . (A) Pseudotime trajectory ranges from 0 to 1 projected to UMAPs for the following samples: MJ008, MJ009, MJ002, MJ003, MJ016, and MJ017. (B) Directionality of PAGA projected to UMAPs showing selected TRM (c01, c02) and Teff/TRM (c03, c04, c07) cluster groups for the following samples: MJ008, MJ009, MJ002, MJ003, MJ016, and MJ017. (C) Illustration of a phase portrait plot, adapted from previously published work (Bergen et al., 2020), indicates the assignment of three different states of a particular gene. (1) Steady state: A black dotted line corresponds to the estimated steady state ratio of unspliced versus spliced mRNA. (2) Induction state: A green arrow curve that deviates above the steady state line corresponds to a higher abundance of unspliced mRNA, indicating gene upregulation. (3) Repression state: A blue arrow curve that deviates below the steady state line corresponds to a higher abundance of spliced mRNA, indicating gene downregulation. (D) Representative putative velocity driver genes for phase portraits (upper panel: x axis: spliced RNA; y axis: unspliced RNA) and expression dynamics along latent time (lower panel: x axis: latent time; y axis: spliced RNA) for each sample (MJ007, MJ001, MJ006, MJ018, MJ019, and MJ005). The latent time approximates the real time experienced by cells as they differentiate, based on their transcriptional dynamics. (E and F) H&E staining for ileal stoma and regular ileal biopsy taken within the same week during quiescence (shown in 10× and 20× magnifications). Green scale bars (200 μm) and black scale bars (100 μm) are shown on each panel as indicated in the figure. (E) Pt21’s biopsy is normal, without inflammation or increase in apoptosis, and good villous architecture. Pt21’s stoma sample taken on POD262 has many nonspecific inflammatory changes, including blunted villi, increased chronic inflammatory cell infiltration and neutrophilic infiltration. (F) Ileal biopsy from Pt16″ shows nonspecific reactive changes, but without increase in apoptosis or active/chronic inflammation. The stoma sample taken on POD1004 shows nonspecific inflammatory changes, including blunted villi, increased chronic inflammatory cell infiltration and scattered neutrophils.
Representative velocity driver genes (Fig. S4, C and D) further demonstrated that the Teff/TRM to TRM transition in quiescent samples was associated with activation of TRM signature genes (CD69 [Kumar et al., 2017], RORA [Chi et al., 2021]), a T cell development gene (TOX2 [Wilkinson et al., 2002]), and an IFN-γ signaling inhibitory gene in T cells (SLC9A9 [Esposito et al., 2015]) over latent time, while the TRM to Teff/TRM transition in rejecting samples was associated with the activation of cytotoxic genes (e.g., GNLY [Peña and Krensky, 1997]) and Teff (IL7R [Belarif et al., 2019]) and nonTRM (S1PR5 [Kumar et al., 2017]) genes.
On the other hand, we found that a TRM to Teff/TRM transition can happen in the absence of rejection, namely in quiescent stoma samples from Pt13 POD1032 (MJ002; MJ003) and Pt16 POD1004 (MJ016; MJ017) (Fig. S4, A and B). This observation may reflect a more inflammatory environment in stomal samples, which are constantly exposed to the outside environment, as opposed to the regular biopsies taken from the inner ileal mucosa, as shown in Fig. S4, E and F and in line with previous reports (Lauro et al., 2014; Ma et al., 2022). Our interpretation is supported by the pseudotime color plots (Fig. 3 B and Fig. S4 A), as a non-transplant control (MJ007) and a quiescent biopsy (MJ001) sample showed close to 0 pseudotime values (purple color) among Teff/TRM and one of the TRM (c01) clusters. However, quiescent stomal (MJ006) and rejecting explant (MJ005) samples that included both IEL and LPL cells showed higher pseudotime values (red to yellow colors) (Fig. 3 B). When paired IEL and LPL from the same specimen were sequenced separately (Fig. 3 B and Fig. S4 A), IEL overall showed higher pseudotime values for these clusters than their LPL counterparts, regardless of rejection status.
When combining all quiescent samples versus all rejecting samples (Fig. 3 D), the combined quiescent group showed a Teff/TRM to TRM trajectory with approximate pseudotime value around 0.5 (red color scale), while the combined rejecting group showed a TRM to Teff/TRM trajectory with close to 1 pseudotime value (yellow color scale). It is noteworthy that CD28 ranked #37 among the top 100 velocity genes in each TRM cluster (c01, c02) in the combined rejecting group but does not appear in the top 100 velocity genes in any cluster in the combined quiescent group. This observation is consistent with our previous demonstration that established recipient CD8 IELs upregulate CD28 during rejection episodes, as measured by flow cytometry (Zuber et al., 2016). Taken together, our data suggest that the trajectory from TRM to Teff/TRM clusters is associated with both rejection and inflammation in the intestinal mucosa.
Integration of single-cell sequencing data with anti-donor T cell alloreactivity reveals phenotypic heterogeneity of HvG-reactive T cells defined by pre- versus post-Tx MLRs and different detection rates in quiescent versus rejecting grafts
Next, we integrated single-cell mRNA expression and paired V(D)J TCR α and β sequences with anti-donor T cell alloreactivity (Fig. S2 A). Our published protocol (Morris et al., 2015; Obradovic et al., 2021b; Zuber et al., 2016) using pre-Tx MLR combined with Adaptive Biotechnologies’ TCRβ bulk sequencing to identify HvG and non-HvG TCR repertoires was applied and single cell TCRβ sequences (CDR3 nucleotide + TRBV + TRBJ) from intestinal allograft mucosal specimens were mapped to these pre-Tx sequence sets. Therefore, individual T cells were annotated as CD4 or CD8, HvG or non-HvG clones, or not detected in pre-Tx recipient repertoires (Fig. 4, A and C; and Table S5). Similarly, post-Tx CFSE-MLR using post-Tx recipient PBMCs as responders and pre-Tx donor lymphoid tissues as stimulators allowed us to define CD4 or CD8 H’vG (H’: post-Tx host) and non-H’vG or post-Tx undetectable sequences (Fig. 4, B and D; and Table S5). Both pre-Tx MLR-defined HvG clones (Fig. 4, A and C) and post-Tx MLR-defined H’vG clones (Fig. 4, B and D) were mainly detected in TRM, Teff/TRM, and Tfh clusters in combined and split UMAPs, regardless of quiescent or rejecting status. There was no significant difference between the quiescent and rejecting samples with respect to the percentages of HvG or H’vG CD4 or CD8 cells within each cluster group. CD4 HvG and H’vG clones were enriched in TRM and Tfh clusters, and CD8 HvG and H’vG clones were enriched in cytotoxic Teff/TRM and TRM clusters, demonstrating phenotypic heterogeneity of graft-infiltrating recipient alloreactive T cells.
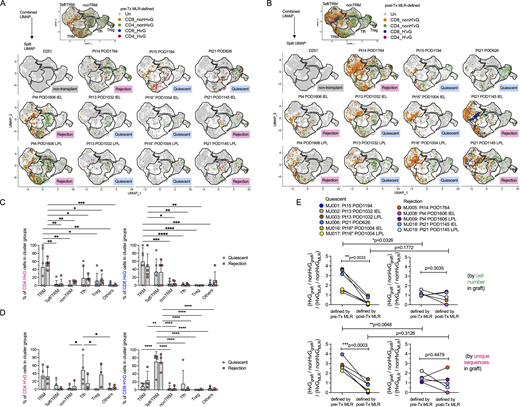
Cluster distribution and detection rate of pre- and post-Tx MLR-defined alloreactive recipient T cells in intestinal graft and association with rejection. (A) Combined and split UMAP plots show pre-Tx MLR-defined CD4 or CD8 HvG or non-HvG clones in intestinal grafts in quiescent (n = 6) versus rejecting (n = 5) conditions. (B) Combined and split UMAP plots show post-Tx MLR-defined CD4 or CD8 H’vG or non-H’vG clones in intestinal grafts in quiescent (n = 6) versus rejecting (n = 5) conditions. Un: undetected. (C) Percentages of pre-Tx MLR-defined CD4 HvG (left panel) and CD8 HvG (right panel) cells in the following cluster groups: TRM, Teff/TRM, nonTRM, Tfh, Tregs, and others in quiescent (n = 6) versus rejecting (n = 5) conditions. (D) Percentages of post-Tx MLR-defined CD4 H’vG (left panel) and CD8 H’vG (right panel) cells in the following cluster groups: TRM, Teff/TRM, nonTRM, Tfh, Tregs, and others in quiescent (n = 6) versus rejecting (n = 5) conditions. Two-way ANOVA followed by Tukey’s multiple comparisons test was performed to determine statistical significance (*P < 0.05, **P < 0.01, ***P < 0.001, ****P < 0.0001). See Table S5 for sequence counts and cell counts. (E) Odds ratio of detecting HvG clones over non-HvG clones among recipient mappable repertoire by cell number (upper panel) or by unique sequences (lower panel) in ileal graft was calculated by normalizing the chance of detecting HvG clones over non-HvG clones in pre- or post-Tx MLRs: (HvGgraft/non-HvGgraft)/(HvGMLR/non-HvGMLR) in quiescent (left panel, n = 5) versus rejecting (right panel, n = 6) conditions. Paired Student’s t test was performed to determine statistical significance (**P < 0.01, ***P < 0.001) within quiescent or rejecting groups. Unpaired Student’s t test was performed to determine statistical significance (*P < 0.05, **P < 0.01) within groups defined by pre- or post-Tx MLRs. See Table S6 for more details.
Cluster distribution and detection rate of pre- and post-Tx MLR-defined alloreactive recipient T cells in intestinal graft and association with rejection. (A) Combined and split UMAP plots show pre-Tx MLR-defined CD4 or CD8 HvG or non-HvG clones in intestinal grafts in quiescent (n = 6) versus rejecting (n = 5) conditions. (B) Combined and split UMAP plots show post-Tx MLR-defined CD4 or CD8 H’vG or non-H’vG clones in intestinal grafts in quiescent (n = 6) versus rejecting (n = 5) conditions. Un: undetected. (C) Percentages of pre-Tx MLR-defined CD4 HvG (left panel) and CD8 HvG (right panel) cells in the following cluster groups: TRM, Teff/TRM, nonTRM, Tfh, Tregs, and others in quiescent (n = 6) versus rejecting (n = 5) conditions. (D) Percentages of post-Tx MLR-defined CD4 H’vG (left panel) and CD8 H’vG (right panel) cells in the following cluster groups: TRM, Teff/TRM, nonTRM, Tfh, Tregs, and others in quiescent (n = 6) versus rejecting (n = 5) conditions. Two-way ANOVA followed by Tukey’s multiple comparisons test was performed to determine statistical significance (*P < 0.05, **P < 0.01, ***P < 0.001, ****P < 0.0001). See Table S5 for sequence counts and cell counts. (E) Odds ratio of detecting HvG clones over non-HvG clones among recipient mappable repertoire by cell number (upper panel) or by unique sequences (lower panel) in ileal graft was calculated by normalizing the chance of detecting HvG clones over non-HvG clones in pre- or post-Tx MLRs: (HvGgraft/non-HvGgraft)/(HvGMLR/non-HvGMLR) in quiescent (left panel, n = 5) versus rejecting (right panel, n = 6) conditions. Paired Student’s t test was performed to determine statistical significance (**P < 0.01, ***P < 0.001) within quiescent or rejecting groups. Unpaired Student’s t test was performed to determine statistical significance (*P < 0.05, **P < 0.01) within groups defined by pre- or post-Tx MLRs. See Table S6 for more details.
In the Pt15 POD1194 quiescent ileal graft, pre-Tx MLR-defined CD4 HvG clones were enriched in the TRM cluster group and a few CD8 HvG clones were identifiable in TRM and Teff/TRM cluster groups (Fig. 4 A). Strikingly, post-Tx MLR-defined CD4 and CD8 H’vG clones were completely absent in this specimen (Fig. 4 B). A similar trend was visually apparent for the Pt21 POD626 quiescent sample (Fig. 4, A and B). To assess the enrichment of HvG clones in the graft in all samples, we calculated relative detection rates by first dividing the number of HvG clones in the graft by the number of non-HvG clones in the same site, and dividing this ratio by the ratio of total clones originally identified as HvG divided by those identified as non-HvG from the MLR: [(HvGgraft/non-HvGgraft)/(HvGMLR/non-HvGMLR)] (Fig. 4 E and Table S6). We observed a significantly decreased likelihood of detecting HvG clones defined by post- compared to pre-Tx MLR in late quiescent but not rejecting ileal grafts, by both cell number and unique sequence measurements (Fig. 4 E), raising the possibility that pre-existing HvG-reactive cells in quiescent grafts might be tolerant, and suggesting reduced infiltration of newly developing recipient HvG-reactive T cells into quiescent grafts. The significantly higher detection rate of HvG clones defined by pre-Tx MLR in quiescent samples than in rejecting samples (Fig. 4 E) further supports the possibility of intragraft tolerance among HvG clones in quiescent samples. Although the detection rate of HvG clones defined by post-Tx MLR (referred as H’vG) was comparable between compiled quiescent and rejecting samples (Fig. 4 E), an explanation for the distinct graft outcomes arises from the observation that in the Pt21 POD1145 rejecting ileum explant, post-Tx MLR-defined CD8 H’vG clones were highly enriched in the unstable Teff/TRM cluster group (Fig. 4, A and B). This distribution pattern of alloreactive TCRs is strikingly different than that at the earlier quiescent time point (POD626), when both HvG and H’vG cells were largely found in the TRM and Tfh clusters, suggesting that H’vG-reactive CD8 T cells generated de novo after the transplant with interchangeable Teff/TRM phenotypes likely contribute to late rejection. A similar trend was observed in the Pt14 POD1764 rejecting sample, although to a lesser extent (Fig. 4, A and B). The late rejecting samples from Pt4 POD1606 contained a paucity of post-Tx MLR-defined H’vG cells (Fig. 4 B), suggesting the possible involvement of other cells such as the “missing HvG” clones as discussed below.
Integration of scRNA-seq data with pre- and post-Tx MLR-defined anti-donor reactivity: Immune tolerant features in late quiescent allografts
To explore the possibilities that (1) HvG clones defined by pre-Tx MLR persisting in late allografts may acquire immune tolerant features and (2) H’vG clones generated de novo after Tx may be key players in late rejections, we further integrated the 10x scRNA-seq data with both pre- and post-Tx MLR-defined T cell alloreactivity (Fig. S2, A and B) in late allografts (Fig. 5 and Table S7). By combining pre- and post-Tx MLRs, six functional sequence sets can be categorized as follows: persistent HvG (HvG in pre-Tx MLR and H'vG in post-Tx MLR); tolerant HvG (HvG in pre-Tx MLR and non-H'vG in post-Tx MLR but detectable in post-Tx unstimulated repertoire); missing HvG (HvG in pre-Tx MLR and not detected in post-Tx MLR or unstimulated samples); acquired H’vG (non-HvG in pre-Tx MLR and H'vG in post-Tx MLR); putative de novo H’vG (undetectable in pre-Tx MLR or unstimulated repertoires and H’vG in post-Tx MLR); and persistent non-HvG (non-HvG in pre-Tx MLR and non-H'vG in post-Tx MLR but detectable in pre- and post-Tx unstimulated repertoires).
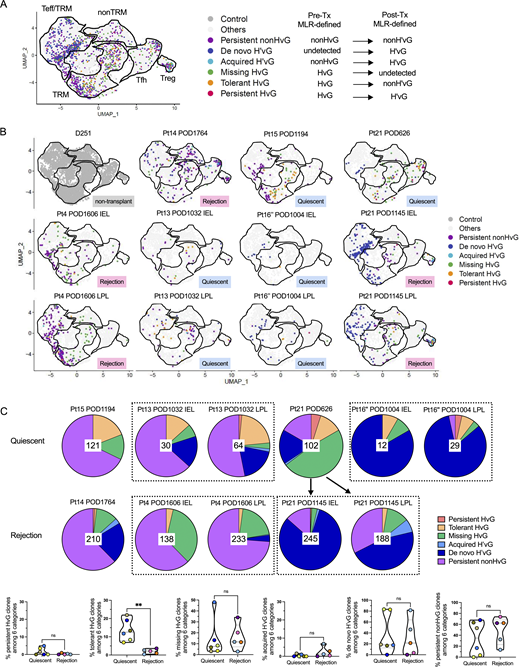
Integration of scRNA-seq data with pre- and post-Tx MLR-defined T cell anti-donor reactivity: immune tolerant features in late quiescent allografts. (A and B) Distribution of six functional alloreactive and non-alloreactive categories in combined (A) and split (B) UMAP plots in quiescent (n = 6) versus rejecting (n = 5) conditions: persistent HvG (HvG in pre-Tx MLR and H’vG in post-Tx MLR); tolerant HvG (HvG in pre-Tx MLR and non-H'vG in post-Tx MLR but detectable in post-Tx unstimulated repertoire); missing HvG (HvG in pre-Tx MLR and not detected in post-Tx MLR or unstimulated samples); acquired H’vG (non-HvG in pre-Tx MLR and H’vG in post-Tx MLR); de novo H’vG (undetectable in pre-Tx MLR or unstimulated repertoires and H’vG in post-Tx MLR); persistent non-HvG (non-HvG in pre-Tx MLR and non-H’vG in post-Tx MLR but detectable in pre- and post-Tx unstimulated repertoires). (C) Proportional constitution of above six categories in quiescent (upper pie charts, n = 6) versus rejecting (lower pie charts, n = 5) ileal grafts is shown in pie charts. The number in the center of each pie chart represents the total number of single cells in that sample with annotation of the six categories listed above. Bottom panel summarizes the percentages of persistent HvG, tolerant HvG, missing HvG, acquired H’vG, de novo H’vG, and persistent non-HvG clones within a total of six categories in quiescent (n = 6) versus rejecting (n = 5) conditions. Mann–Whitney test was performed to determine statistical significance (**P < 0.01; ns: not significant). See Table S7 for sequence counts and cell counts.
Integration of scRNA-seq data with pre- and post-Tx MLR-defined T cell anti-donor reactivity: immune tolerant features in late quiescent allografts. (A and B) Distribution of six functional alloreactive and non-alloreactive categories in combined (A) and split (B) UMAP plots in quiescent (n = 6) versus rejecting (n = 5) conditions: persistent HvG (HvG in pre-Tx MLR and H’vG in post-Tx MLR); tolerant HvG (HvG in pre-Tx MLR and non-H'vG in post-Tx MLR but detectable in post-Tx unstimulated repertoire); missing HvG (HvG in pre-Tx MLR and not detected in post-Tx MLR or unstimulated samples); acquired H’vG (non-HvG in pre-Tx MLR and H’vG in post-Tx MLR); de novo H’vG (undetectable in pre-Tx MLR or unstimulated repertoires and H’vG in post-Tx MLR); persistent non-HvG (non-HvG in pre-Tx MLR and non-H’vG in post-Tx MLR but detectable in pre- and post-Tx unstimulated repertoires). (C) Proportional constitution of above six categories in quiescent (upper pie charts, n = 6) versus rejecting (lower pie charts, n = 5) ileal grafts is shown in pie charts. The number in the center of each pie chart represents the total number of single cells in that sample with annotation of the six categories listed above. Bottom panel summarizes the percentages of persistent HvG, tolerant HvG, missing HvG, acquired H’vG, de novo H’vG, and persistent non-HvG clones within a total of six categories in quiescent (n = 6) versus rejecting (n = 5) conditions. Mann–Whitney test was performed to determine statistical significance (**P < 0.01; ns: not significant). See Table S7 for sequence counts and cell counts.
In combined (Fig. 5 A) and split (Fig. 5 B) UMAPs, we annotated each single cell with one of the six functional categories above. In line with the result in Fig. 4, we were able to identify tolerant HvG T cells in the TRM cluster group in the Pt15 POD1194 quiescent graft, and in the TRM and Tfh cluster groups in the Pt21 POD626 quiescent graft (Fig. 5 B). Furthermore, enrichment of putative de novo H’vG T cells in the Teff/TRM cluster group was observed in Pt21 POD1145 IEL and LPL specimens with persistent acute rejection (Fig. 5 B). Among the T cells defined by the six categories described above in individual specimens (Fig. 5 C), quiescent allografts contained a significantly greater percentage of tolerant HvG clones compared with rejecting allografts, suggesting more pronounced hyporesponsiveness of recipient T cells to the allogeneic donor in the intestinal mucosa of quiescent compared with rejecting allografts.
Transcriptomic profiling of tolerant HvG, missing HvG, and putative de novo H’vG cells in the graft and their contribution to distinct outcomes
Given that tolerant HvG, missing HvG, and putative de novo H’vG cells may be functionally distinct in quiescent versus rejecting grafts, we further evaluated their distribution in different UMAP cluster groups and performed differential GEX analysis (Fig. 6 and Fig. S5, A–D). Tolerant HvG cells within quiescent allografts were dominated by TRM profiles. The fraction of tolerant HvG cells in TRM clusters was significantly higher in quiescent compared with rejecting allografts (Fig. 6 A). No significant difference was observed for other cluster groups in terms of the proportion of tolerant HvG cells between quiescent and rejecting allografts. Differentially expressed (DE) gene analysis of tolerant HvG cells in rejecting versus quiescent allografts identified two lists of genes in both directions (Fig. 6, B and D). Tolerant HvG cells in quiescent allografts showed significantly increased expression of genes related to biosynthesis and regulation of cell adhesion and defense response compared with those in rejecting allografts, reflected by the following top-ranked biological terms: ATP biosynthetic process, positive regulation of cell adhesion, immune system development, inflammatory response, and regulation of defense response (Fig. 6, B and C). However, tolerant HvG cells in rejecting allografts showed significantly increased expression of genes related to protein translation and T cell activation compared with those in quiescent allografts (Fig. 6, B and D). Additionally, patients with overall quiescent allografts during a follow-up period (Pt15 up to POD1336, Pt13 up to POD1032, Pt21 up to POD626) tended to show a higher level and longer persistence of tolerant HvG clones in the ileal grafts compared with PBMCs (Fig. 6, E and F), consistent with the enriched TRM transcriptome profiles of tolerant HvG clones in quiescent specimens (Fig. 6 A). In contrast, patients with frequently rejecting allografts showed minimal levels of tolerant HvG clones in both ileal grafts and PBMCs over time (Fig. 6, E and F).
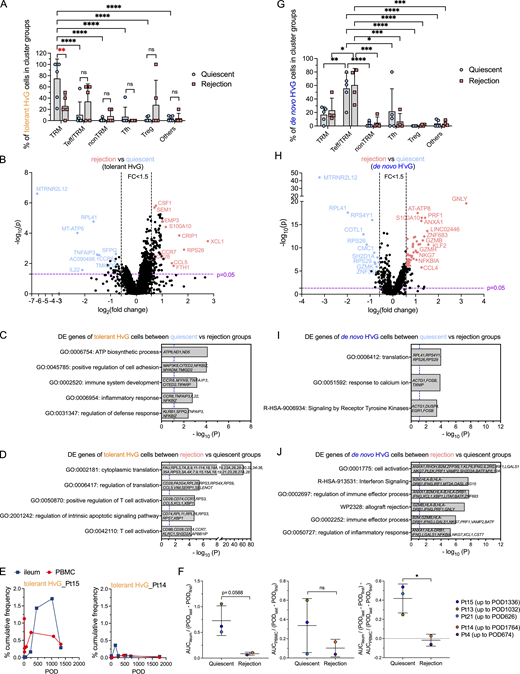
Transcriptomic profiling of tolerant HvG and de novo H’vG cells in quiescent versus rejecting ileal grafts. (A and G) Fractions of tolerant HvG (A) and de novo H’vG (G) cells detectable in TRM, Teff/TRM, nonTRM, Tfh, Treg, or other clusters within each sample in quiescent (n = 6) and rejection (n = 5) groups. Two-way ANOVA followed by Tukey’s multiple comparisons test was performed to determine statistical significance (*P < 0.05, **P < 0.01, ***P < 0.05, ****P < 0.0001, ns: not significant). (B and H) Volcano plot of DE gene analysis among tolerant HvG (B) and de novo H’vG (H) cells in rejection (n = 5) versus quiescent (n = 6) groups. P < 0.05 and fold change >1.5 were applied in each direction to identify DE genes for downstream GO term analysis. (C, D, I, and J) GO term analysis identified up to five top non-redundant T cell–relevant biological processes that contributed by DE genes when comparing quiescent versus rejection groups among tolerant HvG (C) and de novo H’vG (I) cells. GO term analysis identified up to six top nonredundant T cell–relevant biological processes that contributed to DE genes when comparing rejection versus quiescent groups among tolerant HvG (D) and de novo H’vG (J) cells. P < 0.05 (−log10 P > 1.122) is considered to be statistically significant, where −log10 P = 1.122 were labeled by blue dashed vertical lines in both plots. (E) Cumulative frequencies of tolerant HvG clones in post-Tx ileum and PBMCs are shown in two representative patients: Pt15 (quiescent group) and Pt14 (rejection group). (F) Normalized area under curve (AUC) values by POD of above tracking plots of tolerant HvG clones in ileum (left panel), PBMCs (middle panel), and ileum versus PBMCs (right panel) were calculated for quiescent (n = 3) and rejecting (n = 2) groups, respectively: AUCileum/(PODlast – PODfirst), AUCPBMC/(PODlast – PODfirst), and AUCileum/(PODlast – PODfirst) − AUCPBMC/(PODlast – PODfirst). Unpaired Student’s t test was performed to determine statistical significance (*P < 0.05). See Table S7 for sequence counts and cell counts.
Transcriptomic profiling of tolerant HvG and de novo H’vG cells in quiescent versus rejecting ileal grafts. (A and G) Fractions of tolerant HvG (A) and de novo H’vG (G) cells detectable in TRM, Teff/TRM, nonTRM, Tfh, Treg, or other clusters within each sample in quiescent (n = 6) and rejection (n = 5) groups. Two-way ANOVA followed by Tukey’s multiple comparisons test was performed to determine statistical significance (*P < 0.05, **P < 0.01, ***P < 0.05, ****P < 0.0001, ns: not significant). (B and H) Volcano plot of DE gene analysis among tolerant HvG (B) and de novo H’vG (H) cells in rejection (n = 5) versus quiescent (n = 6) groups. P < 0.05 and fold change >1.5 were applied in each direction to identify DE genes for downstream GO term analysis. (C, D, I, and J) GO term analysis identified up to five top non-redundant T cell–relevant biological processes that contributed by DE genes when comparing quiescent versus rejection groups among tolerant HvG (C) and de novo H’vG (I) cells. GO term analysis identified up to six top nonredundant T cell–relevant biological processes that contributed to DE genes when comparing rejection versus quiescent groups among tolerant HvG (D) and de novo H’vG (J) cells. P < 0.05 (−log10 P > 1.122) is considered to be statistically significant, where −log10 P = 1.122 were labeled by blue dashed vertical lines in both plots. (E) Cumulative frequencies of tolerant HvG clones in post-Tx ileum and PBMCs are shown in two representative patients: Pt15 (quiescent group) and Pt14 (rejection group). (F) Normalized area under curve (AUC) values by POD of above tracking plots of tolerant HvG clones in ileum (left panel), PBMCs (middle panel), and ileum versus PBMCs (right panel) were calculated for quiescent (n = 3) and rejecting (n = 2) groups, respectively: AUCileum/(PODlast – PODfirst), AUCPBMC/(PODlast – PODfirst), and AUCileum/(PODlast – PODfirst) − AUCPBMC/(PODlast – PODfirst). Unpaired Student’s t test was performed to determine statistical significance (*P < 0.05). See Table S7 for sequence counts and cell counts.
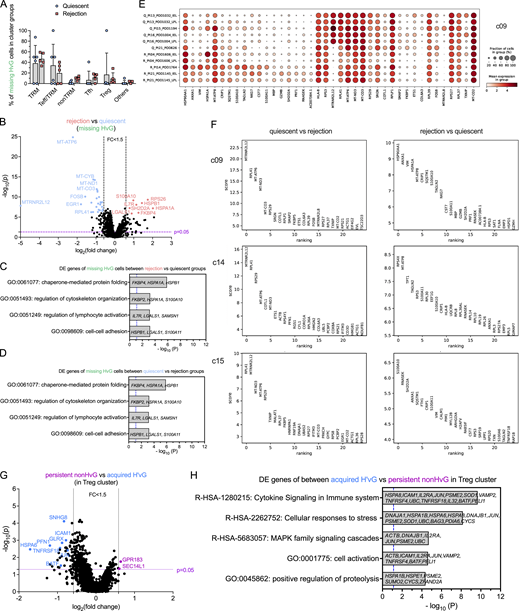
Transcriptomic profiling of missing HvG cells in quiescent versus rejecting ileal grafts, DE genes in minority UMAP clusters, and among persistent non-HvG versus acquired H’vG cells in Treg cluster. (A) Fractions of missing HvG cells detectable in TRM, Teff/TRM, nonTRM, Tfh, Treg or other clusters within each sample in quiescent (n = 6) and rejection (n = 5) groups. Two-way ANOVA followed by Tukey’s multiple comparisons test was performed to determine statistical significance (*P < 0.05, **P < 0.01, ***P < 0.05, ****P < 0.0001). (B–D) Volcano plot of DE gene analysis among missing HvG cells in rejection (n = 5) versus quiescent (n = 6) groups. P < 0.05 and fold change >1.5 were applied at each direction to identify DE genes for downstream GO term analysis. GO term analysis identified up to four top nonredundant T cell–relevant biological processes that contributed by DE genes when comparing rejection (n = 5) versus quiescent (n = 6) groups (C) and quiescent (n = 6) versus rejection (n = 5) groups (D) among missing HvG clones. P < 0.05 (−log10 P > 1.122) is considered to be statistically significant, where −log10 P = 1.122 is labeled by blue dashed vertical lines in both plots. See Table S7 for sequence counts and cell counts. DE gene analysis between cells in quiescent and rejecting samples in minority clusters. (E) Dot feature plot of top-ranking DE genes in c09 between cells in quiescent (“Q,” n = 6) and rejecting (“R,” n = 5) samples. (F) Top-ranking DE genes in c09, c14 and c15 between quiescent (n = 6) versus rejecting (n = 5) samples (left panels) or rejecting (n = 5) versus quiescent (n = 6) samples (right panels). (G) Volcano plot of DE gene analysis among persistent non-HvG versus acquired H’vG cells in Treg cluster. P < 0.05 and fold change >1.5 were applied in each direction to identify DE genes for downstream GO term analysis. (H) GO term analysis identified up to five top nonredundant T cell–relevant biological processes contributed by DE genes when comparing persistent non-HvG versus acquired H’vG cells in the Treg cluster. P < 0.05 (−log10 P > 1.122) is considered to be statistically significant, where −log10 P = 1.122 is labeled by a blue dashed vertical line. See Table S7 for sequence counts and cell counts.
Transcriptomic profiling of missing HvG cells in quiescent versus rejecting ileal grafts, DE genes in minority UMAP clusters, and among persistent non-HvG versus acquired H’vG cells in Treg cluster. (A) Fractions of missing HvG cells detectable in TRM, Teff/TRM, nonTRM, Tfh, Treg or other clusters within each sample in quiescent (n = 6) and rejection (n = 5) groups. Two-way ANOVA followed by Tukey’s multiple comparisons test was performed to determine statistical significance (*P < 0.05, **P < 0.01, ***P < 0.05, ****P < 0.0001). (B–D) Volcano plot of DE gene analysis among missing HvG cells in rejection (n = 5) versus quiescent (n = 6) groups. P < 0.05 and fold change >1.5 were applied at each direction to identify DE genes for downstream GO term analysis. GO term analysis identified up to four top nonredundant T cell–relevant biological processes that contributed by DE genes when comparing rejection (n = 5) versus quiescent (n = 6) groups (C) and quiescent (n = 6) versus rejection (n = 5) groups (D) among missing HvG clones. P < 0.05 (−log10 P > 1.122) is considered to be statistically significant, where −log10 P = 1.122 is labeled by blue dashed vertical lines in both plots. See Table S7 for sequence counts and cell counts. DE gene analysis between cells in quiescent and rejecting samples in minority clusters. (E) Dot feature plot of top-ranking DE genes in c09 between cells in quiescent (“Q,” n = 6) and rejecting (“R,” n = 5) samples. (F) Top-ranking DE genes in c09, c14 and c15 between quiescent (n = 6) versus rejecting (n = 5) samples (left panels) or rejecting (n = 5) versus quiescent (n = 6) samples (right panels). (G) Volcano plot of DE gene analysis among persistent non-HvG versus acquired H’vG cells in Treg cluster. P < 0.05 and fold change >1.5 were applied in each direction to identify DE genes for downstream GO term analysis. (H) GO term analysis identified up to five top nonredundant T cell–relevant biological processes contributed by DE genes when comparing persistent non-HvG versus acquired H’vG cells in the Treg cluster. P < 0.05 (−log10 P > 1.122) is considered to be statistically significant, where −log10 P = 1.122 is labeled by a blue dashed vertical line. See Table S7 for sequence counts and cell counts.
Cells classified as missing HvG (HvG in pre-Tx MLR and not detected in post-Tx MLR or unstimulated samples) were enriched for TRM and Teff/TRM clusters and showed overall comparable proportional distributions for both quiescent and rejecting grafts (Fig. S5 A). However, missing HvG cells in rejecting allografts showed significantly increased expression of genes related to cell activation, cytokine response, apoptosis, and Teff functions compared with those in quiescent allografts, reflected by gene ontology (GO) term analysis (Fig. S5, B and C). Missing HvG cells in quiescent allografts showed significantly increased expression of genes related to oxidative phosphorylation and cellular response to stress and hormones compared with those in rejecting allografts (Fig. S5, B and D).
Cells classified as putative de novo H’vG (undetectable in pre-Tx MLR and unstimulated cells but H'vG in post-Tx MLR) were significantly enriched for Teff/TRM clusters and showed overall comparable proportional distribution for both quiescent and rejecting grafts (Fig. 6 G). However, putative de novo H’vG cells in rejecting allografts showed significantly increased expression of genes related to cell activation, allograft rejection, and cytotoxic Teff functions compared with those in quiescent allografts, reflected by the following top ranked biological terms: cell activation, interferon signaling, regulation of immune effector process, allograft rejection, immune effector process, and regulation of inflammatory response (Fig. 6, H and J). Putative de novo H’vG cells in quiescent allografts showed significantly increased expression of genes related to translation, response to calcium ion, and signaling by receptor tyrosine kinases compared with those in rejecting allografts (Fig. 6, H and I). Collectively, these data indicate that tolerant HvG cells join the intestinal TRM pool and suggest that missing HvG and putative de novo H’vG cells participate in rejection in rejecting grafts, whereas they are less likely to have effector function in quiescent grafts.
We observed clonal expansion with predominant TRM and Tfh transcriptional profiles among tolerant HvG clones and several clonotypes showed both transcriptional phenotypes in quiescent samples (MJ001 and MJ006). Furthermore, among putative de novo H’vG cells, dominant Teff/TRM transcriptional profiles were detected in rejecting samples, with a minority TRM profile observed for some members of the same clones (MJ018 and MJ019) (Fig. 7 and Table S8). The top three dominant clones constituted 48–87% of each designated repertoire (Fig. 7). Within each of the top five de novo H’vG clones in rejecting sample MJ018 (Fig. 7 C), a majority of cells had Teff/TRM phenotypes, while only a small fraction of cells maintained the TRM phenotype. Collectively, these results demonstrate the interchangeability between effector and tissue-resident memory function for individual T cell clones in human intestines.
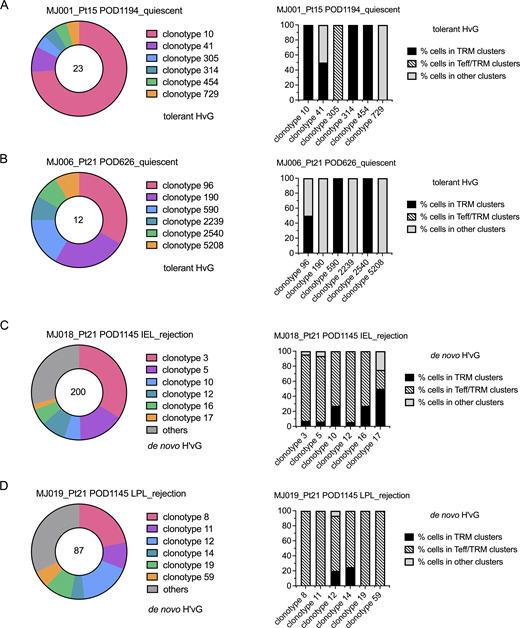
Clonal distribution of tolerant HvG and putative de novo H’vG cells. (A–D) Clonotype distribution of tolerant HvG cells in MJ001_Pt15 POD1194_quiescent (A) and MJ006_Pt21 POD626_quiescent (B) samples, and of putative de novo H’vG cells in MJ018_Pt21 POD1145 IEL_rejection (C) and MJ019_Pt21 POD1145 LPL_rejection (D) samples. Total number of cells in designated categories (tolerant HvG or de novo H’vG) is labeled in the center of the pie chart in the left panels. For the top six clonotypes within each sample, percentages of cells in TRM clusters, Teff/TRM clusters, and other clusters (including Tfh) are shown in the right panels. For tolerant HvG cells in MJ006_Pt21 POD626_quiescent sample, the percentage of cells in other clusters is dominated by Tfh phenotypes. V and J genes and nucleotide sequences of the CDR3 region for TCRα (TRA) and TCRβ (TRB) chains are summarized in Table S8.
Clonal distribution of tolerant HvG and putative de novo H’vG cells. (A–D) Clonotype distribution of tolerant HvG cells in MJ001_Pt15 POD1194_quiescent (A) and MJ006_Pt21 POD626_quiescent (B) samples, and of putative de novo H’vG cells in MJ018_Pt21 POD1145 IEL_rejection (C) and MJ019_Pt21 POD1145 LPL_rejection (D) samples. Total number of cells in designated categories (tolerant HvG or de novo H’vG) is labeled in the center of the pie chart in the left panels. For the top six clonotypes within each sample, percentages of cells in TRM clusters, Teff/TRM clusters, and other clusters (including Tfh) are shown in the right panels. For tolerant HvG cells in MJ006_Pt21 POD626_quiescent sample, the percentage of cells in other clusters is dominated by Tfh phenotypes. V and J genes and nucleotide sequences of the CDR3 region for TCRα (TRA) and TCRβ (TRB) chains are summarized in Table S8.
Within minority clusters c09, c14, and c15 that had high expression of mitochondrial genes, possibly indicating dying cells (Ilicic et al., 2016), very few cells were annotated for the six functional categories defined by the integration of pre- and post-Tx MLRs (Fig. 2 A and Fig. 5 A). DE gene GO term analyses reveal transcriptomic profiles for c09 that include the immune effector process, TCR signaling pathway, and regulation of protein kinase activity. DE genes for c14 include mitotic cell cycle and DNA replication, while those for c15 include response to metal ions and intracellular chemical homeostasis. Furthermore, cells in c09 from rejecting samples showed higher expression of genes related to cytotoxic Teff function (NKG7, GZMB, PRF1, GZMH, CST7), autophagy (SQSTM1) (Kumar et al., 2022), and anti-inflammatory responses (ANAX1) (Yang et al., 2013) compared with those from quiescent samples, which were enriched for anti-apoptotic (MTRNR2L12) (Bodzioch et al., 2009), Teff expansion restraining (TXNIP) (Muri et al., 2021), immune synapse enhancing (COTL1) (Kim et al., 2014), and T cell activation and survival (ETS-1) (Muthusamy et al., 1995) genes (Fig. S5, E and F). Similar DE genes were also detected between rejecting and quiescent samples within c14 (MKI67+) and c15 clusters (Fig. S5 F).
VIPER and STRING analyses identified inferred protein regulon networks for effector and tolerant T cell functions
To further understand the immune regulatory networks for effector and tolerant T cell functions on the protein level, we applied VIPER (Virtual Inference of Protein-activity by Enriched Regulon) (Alvarez et al., 2016) and STRING (Search Tool for the Retrieval of Interacting Genes/Proteins) (Szklarczyk et al., 2023) analyses to our scRNA-seq dataset (Figs. 8 and 9). VIPER implements a dedicated algorithm specially formulated to estimate regulon activity, which considers the regulator mode of action, the regulator–target gene interaction confidence, and the pleiotropic nature of each target gene regulation. This robust VIPER pipeline for scRNA-seq analysis by protein activity inference has been validated to be able to recapitulate spectral flow cytometry and quantitative, multispectral immunofluorescence data, overcoming scRNA-seq–related gene dropout (Obradovic et al., 2021a). A total of four VIPER clusters (vc0, vc1, vc2, vc3) were identified (Fig. 8 A) based on the DE regulons for each cluster (Fig. 8 B and Fig. 9). The projection of clusters from the single cell GEX transcriptomics onto the VIPER UMAP is shown in Fig. 8 A, lower panel. Vc3 tends to identify a small transitioning cluster of regulons that are universally highly expressed in all cells and is not discussed further (Fig. 8 B). Vc1 was mainly associated with GEX clusters 3, 4, 7, and 9, and was highly enriched for regulons accounting for Teff function (GO: 0002252; GO: 0002699; GO: 0051251: TBX21, EOMES, RUNX3, STAT4, IFNG, NR4A3, NR4A2, FOXP4), integrated stress response signaling (GO: 0140467: CEBPA, CEBPB, CEBPD), and response to TGF-β (GO: 0071559: SMAD5, SMAD7, ID1, NR3C1, RUNX3, ZFP36L1), consistent with the three protein–protein association networks identified by STRING analysis (Fig. 8, A and B; and Fig. 9 A). Among all annotated cells, de novo H’vG cells were more dominantly distributed in vc1 compared with other categories of cells (Fig. 8, C and D). Within vc1, de novo H’vG cells were significantly enriched compared with other categories of cells in rejecting samples (Fig. 8, E and F). Therefore, inferred protein networks controlling the Teff/TRM phenotypic transition of de novo H’vG cells during rejection have been identified.

VIPER analysis identifies inferred protein regulons for effector and tolerant T cells. (A) Upper panel: UMAP of VIPER clusters: vc0, vc1, vc2, and vc3. Lower panel: Projection of GEX clusters (1–15) onto VIPER UMAP. The VIPER UMAP was generated by the VIPER algorithm and pipeline that involves T cell reclustering compared to the GEX UMAP shown in Fig. 2 A. (B) Heatmap of representative DE regulons in each VIPER cluster. Biologically meaningful differential regulon expression in each VIPER cluster considers not only the adjusted P value (<0.05) from Seurat FindAllMarkers command, but also the dominant presence of the regulon within the cluster (a minimum fractional expression threshold of 0.45: pct.1 ≥ 0.45) and a log fold change threshold of 1 (ave_logFC ≥ 1). (C) UMAP of VIPER clusters with cell annotation of six functional categories defined by integration of pre- and post-Tx MLRs. (D) Left panel: Distribution pie charts of de novo H’vG cells and the other five categories of T cells in vc1 and other VIPER clusters. Right panel: Distribution pie charts of tolerant HvG cells and the other five categories of cells in vc2 and other VIPER clusters. Total number of cells in designated populations is labeled in the center of each pie chart. Statistical significance was determined by Fisher’s test (*P < 0.05; ****P < 0.0001). (E) Split UMAPs of VIPER clusters for each scRNA-seq sample in quiescent (left panel, n = 6) versus rejecting (right panel, n = 5) groups. (F) Left panel (in vc1): Distribution pie charts of de novo H’vG cells and the other five categories of cells in quiescent versus rejecting groups. Right panel (in vc2): Distribution pie charts of tolerant HvG cells and the other five categories of cells in quiescent versus rejecting groups. Total number of cells in designated populations is labeled in the center of each pie chart. Statistical significance was determined by Fisher’s test (***P < 0.001; ****P < 0.0001).
VIPER analysis identifies inferred protein regulons for effector and tolerant T cells. (A) Upper panel: UMAP of VIPER clusters: vc0, vc1, vc2, and vc3. Lower panel: Projection of GEX clusters (1–15) onto VIPER UMAP. The VIPER UMAP was generated by the VIPER algorithm and pipeline that involves T cell reclustering compared to the GEX UMAP shown in Fig. 2 A. (B) Heatmap of representative DE regulons in each VIPER cluster. Biologically meaningful differential regulon expression in each VIPER cluster considers not only the adjusted P value (<0.05) from Seurat FindAllMarkers command, but also the dominant presence of the regulon within the cluster (a minimum fractional expression threshold of 0.45: pct.1 ≥ 0.45) and a log fold change threshold of 1 (ave_logFC ≥ 1). (C) UMAP of VIPER clusters with cell annotation of six functional categories defined by integration of pre- and post-Tx MLRs. (D) Left panel: Distribution pie charts of de novo H’vG cells and the other five categories of T cells in vc1 and other VIPER clusters. Right panel: Distribution pie charts of tolerant HvG cells and the other five categories of cells in vc2 and other VIPER clusters. Total number of cells in designated populations is labeled in the center of each pie chart. Statistical significance was determined by Fisher’s test (*P < 0.05; ****P < 0.0001). (E) Split UMAPs of VIPER clusters for each scRNA-seq sample in quiescent (left panel, n = 6) versus rejecting (right panel, n = 5) groups. (F) Left panel (in vc1): Distribution pie charts of de novo H’vG cells and the other five categories of cells in quiescent versus rejecting groups. Right panel (in vc2): Distribution pie charts of tolerant HvG cells and the other five categories of cells in quiescent versus rejecting groups. Total number of cells in designated populations is labeled in the center of each pie chart. Statistical significance was determined by Fisher’s test (***P < 0.001; ****P < 0.0001).

STRING analysis identifies inferred protein regulon networks for each VIPER cluster by K means clustering (n = 3). (A–C) Inferred networks are coded by red, light green, and cyan blue colors for vc01 (A), vc2 (B), and vc0 (C). Network nodes represent proteins and edges represent protein–protein associations. Dotted lines indicate edges between clusters. Solid gray lines (A and B) indicate predicted interactions with thicker lines associated with stronger data support of interactions. Color-coded solid lines (C) represent different types of interactions, including curated databases determined, experimentally determined, predicted based on gene neighborhood, gene fusions or gene co-occurrence, or textmining.
STRING analysis identifies inferred protein regulon networks for each VIPER cluster by K means clustering (n = 3). (A–C) Inferred networks are coded by red, light green, and cyan blue colors for vc01 (A), vc2 (B), and vc0 (C). Network nodes represent proteins and edges represent protein–protein associations. Dotted lines indicate edges between clusters. Solid gray lines (A and B) indicate predicted interactions with thicker lines associated with stronger data support of interactions. Color-coded solid lines (C) represent different types of interactions, including curated databases determined, experimentally determined, predicted based on gene neighborhood, gene fusions or gene co-occurrence, or textmining.
Interestingly, vc2 was mainly associated with GEX cluster 1 and was highly enriched for regulons accounting for T cell tolerance, as demonstrated by STRING analysis (Fig. 8 B and Fig. 9 B), showing a protein–protein association network consisting of NR4A1 (Odagiu et al., 2021), EGR3 (Collins et al., 2008), and BTG2 (Hwang et al., 2020), in line with previous reports. GO term analysis provides more details for potential biological processes, including negative regulation of cell cycle (GO: 0045786: NR4A1, PPP1R10, BTG2), positive regulation of apoptotic process (GO: 0043065: NR4A1, ID3, PLAGL2), and cellular response to growth factor stimulus (GO: 0071363: EGR1, EGR3, NR4A1, ID1, STAT5B). Vc2 is mostly enriched with non-HvG cells (58% of all annotated cells in the cluster; Fisher’s test P = 0.003) but also included tolerant HvG cells (Fig. 8 C). In fact, among all annotated cells, tolerant HvG cells were more dominantly distributed in vc2 compared to other categories of cells (Fig. 8, C and D), and within vc2, tolerant HvG cells were significantly enriched in quiescent samples compared to other categories of cells (Fig. 8, E and F). This observation suggests that induction of tolerant HvG cells could occur via different protein regulatory networks, one of which seems shared with a population of persistent non-HvG cells in vc2. Other features of quiescence included the Tfh-enriched germinal center environment in vc0 (Fig. 8 B and Fig. 9 C), which was mainly associated with GEX clusters 2, 5, 6, 8 and 10, and was enriched for regulons such as ZC3H12D (Minagawa et al., 2009), a G1/S phase cell cycle inhibitor, and multifunctional BACH2 (Yang et al., 2019), a central negative regulator of Tfh cells, a regulator for Treg maintenance, and an inducer of apoptosis. Taken together, inferred protein regulon network analyses identified upstream regulators that accounted for T cell effector function and tolerant features.
Discussion
Emerging studies in the field of TRM biology have revealed phenotypic plasticity with the capacity for recirculation among long-term resident T cells in NLTs (Beura et al., 2018; Collins et al., 2016; Fonseca et al., 2020; Fu and Sykes, 2022; Gratz and Campbell, 2020; Klicznik et al., 2019; Künzli and King, 2020). Remaining questions include whether these are features of all TRMs or if they apply to only a fraction or a specific subset of TRMs. Given that recirculating ex-TRMs undergo changes in GEX (Fu and Sykes, 2022), such as downregulation of TRM markers (CD69 or CD103) and transient upregulation of exit signals (CD62L), compared with TRMs in NLTs, it is possible that such modulation might lead to a transitional stage locally before translocation to the circulation. However, the Teff/TRM transition has not been demonstrated for individual clones with known antigen recognition (in this case for donor alloantigens) in NLTs. Our study provides a new insight into the interchangeability between effector and tissue-resident memory function for T cells at the single-cell level in the human intestine using rare patient material.
Our scRNA-seq study provides novel evidence in human Tx that clonally defined alloreactive (HvG) and non-alloreactive (non-HvG) T cells in intestinal allografts can distribute in different clusters and acquire multiple functional phenotypes, including TRM and Teff/TRM. Our strategy identified a significantly greater contribution of tolerant HvG T cells with TRM features in quiescent grafts compared with rejecting grafts. Consistently, tolerant HvG clones tend to persist long-term in the intestinal mucosa of patients with little or no rejection. Of particular interest, the cytotoxic interchangeable Teff/TRM cluster showed the least phenotypic stability and contained many HvG cells that developed de novo after Tx or were too rare to be detected before Tx, referred to as putative de novo H’vG cells. DE gene analysis indicates a more activated and cytotoxic phenotype of de novo H’vG clones in rejecting compared with quiescent allografts. RNA velocity analysis further demonstrated that the trajectory from TRM to Teff/TRM clusters correlates with rejection.
VIPER (Alvarez et al., 2016; Obradovic et al., 2021a) and STRING (Szklarczyk et al., 2023) analyses identified protein regulon networks that accounted for T cell effector and tolerant functions, providing novel insights into key immunological processes in an allogeneic setting. FOXP4 has been shown to be dispensable for T cell development but necessary for normal T cell cytokine recall responses to antigens following pathogenic infection (Wiehagen et al., 2012). Our data suggest its participation in controlling Teff/TRM features of de novo H’vG cells during rejection and its possible interaction with regulons that accounted for the immune effector process and stress response signaling. Our data also revealed divergent roles of members from the same family that contribute to Teff function or tolerance. For instance, we found that NR4A1 positively controls immune tolerance in vc02, while NR4A2 and NR4A3 promote Teff function in vc01. These data are consistent with previous reports showing that NR4A1 suppresses Teff GEX while NR4A2 positively contributes to the expression of cytokine genes and Th17 polarization (Doi et al., 2008; Odagiu et al., 2021). However, the result challenges the role of the less studied family member NR4A3, where functional redundancy of NR4A1 and NR4A3 has been reported in T cell apoptosis (Cheng et al., 1997). Similarly, we found that BTG2 positively controls immune tolerance in vc02, while BTG1 promotes Teff function in vc01, in contrast to a previous report identifying both BTG1 and BTG2 as factors responsible for T cell quiescence in mice and claiming their functional redundance (Hwang et al., 2020). Future studies in humans are needed for a deeper understanding of the potentially divergent roles among such family members of immune regulons.
Given that most of our recipients were children and demonstrated recent thymic emigrants in their circulation later after Tx (Fu et al., 2019), we favor the hypothesis that de novo H’vG cells developed in the thymus late after Tx and failed to be centrally tolerized to the donor due to the loss or absence of antigen-presenting cell (APC) chimerism in the thymus (Fu et al., 2019, 2021b; Zuber et al., 2015). In support of this hypothesis, de novo H’vG sequences that were highly enriched in both IELs and LPLs of late rejecting graft explants from Pt21 were not detected in multiple earlier post-Tx PBMC samples (POD11/23) or early intestinal biopsies (POD23) and only became detectable at a later stage POD109/262/626. If correct, this mechanism strengthens the rationale for developing a therapeutic strategy to induce durable mixed hematopoietic chimerism with the expectation of a persistent presence of donor APCs in the recipient thymus to maintain long-term deletional tolerance to the donor, preventing the generation of de novo H’vG cells.
Beyond the TRM and Teff/TRM phenotypes, graft-infiltrating HvG-reactive T cells identified by either pre- or post-Tx MLRs also include Tfh, Tregs, and, to a lesser extent, nonTRM cells, demonstrating a previously unknown level of functional heterogeneity among alloreactive T cells in human organ grafts. Our data suggest that a subset of donor-reactive recipient T cells may enter into lymphoid follicles in graft mucosa and become Tfh cells, some of which acquire tolerant features. VIPER analysis suggests that the regular Tfh function within these tolerant HvG cells may be repressed by BACH2, a central negative regulator of Tfh cells, and other potential regulons, such as ZC3H12D, a negative regulator of the G1/S transition, both of which are highly enriched in vc0. An understanding of the role of these HvG Tfh will require future investigation of samples with enriched Tfh cells from more patients covering both the pediatric and adulthood periods, given that young pediatric donors have significantly more isolated lymphoid follicles in the small intestine compared to adults (Senda et al., 2019). It is noteworthy that acquired H’vG clones were identified in the Treg cluster in the late rejecting Pt21 graft, but not in an early quiescent graft. Among all acquired H’vG cells, 64% (16 out of 25) were identified in the Treg cluster compared with 9.75% (62 out of 636) of persistent non-HvG cells (P < 0.0001 by Fisher’s test). Interestingly, we found higher expression in acquired H’vG cells compared with persistent non-HvG cells in the Treg cluster of genes that are related to cellular response to stress, cytokine stimulus, T cell activation, and effector function (Fig. S5, G and H), suggesting that a transitioning stage of Teff/Treg may contribute to rejection, possibly similar to that reported in autoimmune responses (Brown et al., 2020).
ITx patients require life-long immunosuppression to control high rates of rejection and experience frequent complications (Dasyam et al., 2023). Even patients with minimal acute rejection are threatened by repetitive infections and chronic rejection, which may lead to graft loss. The gut microbiome adds additional complexity, playing important roles in the training of host immunity while regulating metabolism and neurological signaling (Lynch and Pedersen, 2016). Our studies in the past decade (Fu et al., 2019, 2021b; Weiner et al., 2017; Zuber et al., 2015, 2016) investigating the bidirectional alloimmune responses longitudinally in both the circulation and the graft have provided insights into the relationship between graft-versus-host and HvG reactivity, chimerism in the blood, bone marrow, and allograft and have opened the window for development of novel immunological biomarkers for rejection diagnosis and optimization of immunosuppression after ITx. The multiomic approach will permit future investigations to clarify the interplay between the gut microbiome and alloresponses in this setting.
Our previous (Fu et al., 2021b; Zuber et al., 2016) and current data provide the following unprecedented insights into graft-infiltrating recipient T cells and their participation in rejection and tolerance in human organ Tx: (1) Circulating recipient HvG-reactive Teff cells primed by donor APCs populate the graft mucosa early after Tx. Following a rejection episode, HvG clones persist longer and at higher levels in the intestinal mucosa than in the circulation. (2) These recipient Teff cells gradually acquire a TRM phenotype during quiescence. They lack effector function and seed the entire gut, including the native colon (Zuber et al., 2016). Their circulating counterparts may become tolerant of the donor. (3) Some of these recipient TRM cells persist long-term in the allograft and can regain Teff features with interchangeable Teff/TRM phenotypes and participate in late rejection. Our current data, to our knowledge, provide the first demonstration of the interchangeability of TRM and effector phenotypes in human NLT at the clonal level. (4) A subset of HvG-reactive recipient T cells may enter lymphoid follicles and become Tfh cells. (5) Alloreactive recipient TRM, Teff/TRM, and/or Tfh persisting in the graft may pose a constant risk of recurrent rejection and/or become tolerized (tolerant HvG). (6) De novo post Tx–generated HvG-reactive T cells (de novo H’vG) and recipient-derived Tregs with acquired effector function may be major effectors of rejection after ITx.
Our study, like many studies on human patient materials, has inherent limitations. First, the differentiation trajectories between TRM and Teff/TRM cells are inferred from single-cell transcriptomic data, and experimental proof of such interchangeability will be important to pursue in future investigations when sufficient clinical materials become available. Second, our findings are most pronounced in one quiescent patient (Pt15) and another patient with early quiescence and late rejection episodes (Pt21), from whom we had relatively higher numbers of tolerant HvG cells and de novo H’vG cells to study, respectively. The inherent variability in results also reflects the complexity and diversity of natural biological processes between human individuals, highlighting the need for precision medicine and translational research to bring preclinical findings to real-world patient-oriented treatments.
Collectively, our data provide an understanding at the single cell level in the intestinal mucosa of human TRM T cell tissue residency, phenotypic plasticity, and alloreactivity. VIPER and STRING analyses further identify upstream regulons that control the induction and maintenance of alloreactive T cell tolerance and effector functions, opening opportunities for future translational studies to target these regulons to induce immune tolerance and overcome rejection.
Materials and methods
Human subject recruitment and clinical protocols
The study was approved by the Columbia University Institutional Review Board (IRB# AAAJ5056, AAAF2359, and AAAS7927). All subjects or legal guardians provided their written, informed consent and assent when appropriate. Protocol graft biopsies were obtained in the initial post-ITx period as described previously (Fu et al., 2021b; Zuber et al., 2016) and additional biopsies were performed for cause. Ileal stoma tissues were obtained during stoma revision or closure surgeries. Ileal explant tissues were obtained during graft removal surgeries. Acute rejection and chronic rejection were determined based on the pathologic histology changes, as reported previously (Ruiz et al., 2004; Remotti et al., 2012; Swanson et al., 2013). The grade of acute rejection was determined by the histological changes detected from serial surveillance ileum biopsies, such as the counts of crypt apoptotic bodies and maintenance of crypt and villous structures (Ruiz et al., 2004). Chronic rejection primarily involves vessels of the submucosa, serosa, and mesentery, reflected by submucosal fibrosis and arteriopathy with concentric intimal thickening. However, some mucosal alterations are corelative with chronic rejection, such as crypt epithelial mucin loss (Swanson et al., 2013). Blood samples were collected up to four times during the first month after Tx and thereafter at least once per month if available. All of the patients received anti-thymocyte globulin induction therapy (total dose: 6–10 mg/kg) followed by a maintenance regimen that included long-term tacrolimus and steroids. Tacrolimus was initiated on day 1, adjusted for a target trough level of 15–20 ng/ml during the first month after Tx, and gradually tapered down to a maintenance level of 10–15 ng/ml from 2 to 6 mo after Tx and further tapered down to 7–10 ng/ml thereafter. Patients received a tapering dose of corticosteroids (methylprednisolone/prednisone) from day 0 to day 5 after Tx. Day 0 dose for pediatrics was 20 mg/kg (maximum dose of 1 g) and for adults it was 1 g. Day 5 dose for pediatrics was 1 mg/kg every 12 h (maximum 40 mg/days) and for adults it was 30 mg every 12 h. Day 5 dose was maintained until indicated by the transplant team and tapered off by 6–12 mo. Allograft rejections were treated with augmented immunosuppression based on the severity of rejection. A summary of clinical data on each patient sampled for scRNA-seq, including the level of immunosuppressive medication used, and the longitudinal status of infection and rejection is provided (Data S1). All patients in our cohort were treated according to the same clinical protocol of immunosuppression for induction, maintenance, and treatment of rejection and infection. Pt16 was retransplanted on POD786 following the first transplant. Pt16′ represents the first transplant (LITx) and Pt16″ represents the second transplant (MVTx) in that patient. Pt21 was retransplanted on POD1145 following the first transplant. Control non-transplanted ileum was obtained from a pediatric organ donor (D251) through a collaboration and research protocol with LiveOnNy, the organ procurement organization for the New York metropolitan area as previously described (Carpenter et al., 2018). The use of deceased organ donor tissues is not human subjects research, as confirmed by the Columba University IRB.
IEL and LPL isolations
IEL and LPL were separated either from graft biopsy specimens or surgically obtained graft specimens at the time of stoma closure/revision or graft removal, according to a protocol adapted from previous reports (Binda et al., 2009) and described previously (Fu et al., 2019, 2021b; Long and Fu, 2023; Zuber et al., 2016). In brief, the specimens were treated for 20 min at 37°C with 2 mmol/L dithiothreitol followed by two 30-min incubations with 0.5 mmol/L EDTA with continuous stirring in a water bath at 37°C. LPLs were isolated from the remaining tissue, digested, and stirred in a collagenase-containing medium (RPMI 1640, 1 mg/ml collagenase D, 100 I.U/ml penicillin-streptomycin). DNAse (0.1 mg/ml) was added to the EDTA and collagenase D medium when large specimens were processed.
HLA-specific staining and cellular staining
Candidate monoclonal HLA class I allele-specific antibodies (mAb) were screened for the ability to discriminate donor and pre-Tx recipient cells based on clinically available molecular HLA typing information. FITC, PE, APC, or biotin-conjugated HLA-specific mAb were purchased from One Lambda, BD Biosciences, or Miltenyi Biotech. Each HLA-specific mAb was used in combination with pan-HLA-ABC-APC or PE or BV786 antibody and QC tested for specificity. Those that readily distinguished the donor from the pre-Tx recipient PBMCs were included in lineage-specific panels of antibodies, as reported previously (Fu et al., 2019, 2021b; Long and Fu, 2023; Zuber et al., 2015).
Pre- and post-Tx MLRs and cell sorting
These assays were performed as described (Fu et al., 2019, 2021b; Morris et al., 2015; Zuber et al., 2016). Briefly, HvG MLRs were set up using thawed pre-Tx recipient cells as responders and irradiated pre-Tx donor cells as stimulators. 200,000 CFSE-labeled responder cells and 200,000 violet dye–labeled irradiated (35 Gy) stimulators were plated in each well of a round-bottom 96-well plate in MLR medium (AIM-V supplemented with 5% AB heat-inactivated human serum, 0.01 M Hepes, and 50 µm 2-mercaptoethanol). MLR cultures were harvested after incubation at 37°C for 6 days. Cells were stained with anti-CD45, CD3, CD4, and CD8 before FACS sorting on a BD Influx cell sorter to isolate two discrete violet dye–negative cell populations (CD45+CD3+CD4+CFSElow, CD45+CD3+CD8+CFSElow), representing the CD4+ and CD8+ recipient-anti-donor-reactive T cells (pre-Tx “stim”). For unstimulated cell populations, pre-Tx recipient cells harvested from spleen or lymph nodes were thawed and stained with anti-CD45, CD3, CD4, and CD8, and then FACS-sorted into CD45+CD3+CD4+ and CD45+CD3+CD8+ populations (pre-Tx “unstim”).
Post-Tx MLRs were set up using post-Tx recipient PBMCs or splenocytes (isolated from splenectomy pre-second Tx) as responders (Fig. S1 F), and irradiated donor pre-Tx splenocytes or third-party PBMCs as stimulators. 200,000 CFSE-labeled responder cells and 200,000 violet dye–labeled irradiated (35 Gy) stimulators were plated in each well of a round-bottom 96-well plate in MLR medium. MLR cultures were harvested after incubation at 37°C for 6 days. Cells were stained with anti-recipient HLA, CD45, CD3, CD4, and CD8 before FACS sorting on a BD Influx cell sorter to isolate two discrete violet dye–negative recipient HLA-positive cell populations (CD45+CD3+CD4+CFSElow, CD45+CD3+CD8+CFSElow), representing the CD4+ and CD8+ recipient-anti-donor-reactive T cells (post-Tx “stim”). For post-Tx unstimulated cell populations, post-Tx recipient PBMCs were harvested, thawed, and stained with anti-recipient HLA, CD45, CD3, CD4, and CD8, and then FACS-sorted into recipient HLA+CD45+CD3+CD4+ and recipient HLA+CD45+CD3+CD8+ populations (post-Tx “unstim”).
TCRβ CDR3 DNA sequencing
For Pts4–21, genomic DNA was isolated from sorted cell populations using the QIAGEN DNeasy Blood and Tissue Kit. DNA was frozen at −20°C and shipped on dry ice to Adaptive Biotechnologies for high-throughput TCRβ sequencing. For Pts22–24, targeted cell populations were sorted directly into cell lysis buffer (Cat# 158906; QIAGEN) and shipped at room temperature to the University of Pennsylvania. Genomic DNA was isolated from sorted cell populations using the QIAGEN Gentra Puregene Kit (Cat. No. 158388; Qiagen). The libraries for sequencing on the Illumina MiSeq platform were prepared using a cocktail of 23 Vβ families from framework region 2 (FR2) forward primers, and 13 Jβ region reverse primers, modified from the BIOMED2 primer series (van Dongen et al., 2003). Primer sequences and detailed PCR and library preparation protocols were described previously (Fu et al., 2021b).
TCRβ CDR3 data processing and analysis
The TCR sequencing data for Pts4–21 were retrieved from Adaptive Biotechnologies’ ImmunoSEQ software. For Pts22–24, raw sequences were quality filtered as described previously (Fu et al., 2021b; Meng et al., 2017; Rosenfeld et al., 2018) and clone assemblies were processed with MiXCR (Bolotin et al., 2015) (v.3.0.7) and VDJtools (Shugay et al., 2015) (v.1.2.1). Long CDR3 sequences that contained nucleotides after the end of the J-gene were truncated to adhere to IMGT numbering. Bulk TCR-seq analysis and alloreactive clone determination were performed using the integrated analysis toolset as previously described (Obradovic et al., 2021b): CD8 versus CD4 sorting errors were corrected by removing ambiguous sequences present in both populations at a high- to low-frequency ratio <5:1. Donor and recipient shared CDR3s at nucleotide levels were also removed. After this, separate CD4 and CD8 tables containing clonal frequencies in pre-Tx unstimulated samples, CFSElow stimulated cells, and biopsies were compiled and renormalized. Pre-Tx alloreactive clones (CD4 HvG, CD8 HvG) were defined by twofold or greater expansion in stimulated compared with unstimulated pre-Tx cells, and by minimum frequency of 0.001% in CFSElow populations when using read counts or 0.002% in CFSElow populations when using template counts, which serves to ensure 85% repeatability, as determined by power analysis (Morris et al., 2015). Similarly, post-Tx alloreactive clones (CD4 H’vG, CD8 H’vG) were defined by twofold or greater expansion in stimulated compared with unstimulated post-Tx cells and by minimum frequency of 0.001% in CFSElow populations when using read counts or 0.002% in CFSElow populations when using template counts. “Recipient mappable clones” refer to clones that were detectable in sequenced “unstim” and/or “stim” T cell populations from the recipient. “Cumulative frequency” was calculated as a percentage of all sequences weighted by copy numbers in designated populations.
scRNA-seq and data processing
scRNA-seq was performed using the 10x Genomics platform for simultaneous measurement of mRNA expression and paired V(D)J TCR α and β sequences at the single-cell level. To facilitate navigation of our results, Fig. S2 A illustrates the integrated sequencing platform, and Fig. S2 B presents a flow diagram to illustrate how the data are presented and what comparisons are being made for scRNA-seq analyses in related figures. For scRNA-seq analysis, intestinal T cells isolated from IEL and LPL were thawed, washed, and sorted separately or combined for viable recipient HLA+CD45+CD3+ T cells using the BD Influx cell sorter. Cells were then mixed with 10x Chromium 5′ RT reagents and loaded into a Chromium microfluidics chip and controller for droplet formation, with each productive droplet containing one single cell and one single 10x barcoded primer bead. Full-length first-strand cDNAs were synthesized in individual droplets from polyadenylated mRNAs and labeled with a unique 10x cell-bead barcode. For 5′GEX-seq, cDNAs were amplified and Illumina-compatible sequencing libraries were prepared and sequenced on an Illumina NovaSeq 6000 Sequencer. For TCR-seq, target enrichments were performed using TCR-specific outer and inner primers, followed by Illumina-compatible library preparation and sequencing on an Illumina NextSeq 550 Sequencer. FASTQ files were processed using the 10x Genomics Cell Ranger software (v.3.1.0–v.7.0.1) with GRCh38 transcriptome as the reference.
scRNA-seq QC and integration were performed in reference to the Seurat pipeline (Butler et al., 2018; Hao et al., 2021; Stuart et al., 2019). Briefly, for each dataset, cells were filtered out if their unique feature counts were >Q3 + 1.5 * IQR or <Q1 − 1.5 * IQR (Q1: first quartile; Q3: third quartile; IQR: interquartile range, Q3−Q1). Cells were further removed if they had more than 15% mitochondrial counts. Feature expression was then normalized by the total expression within each cell, multiplying by a scale factor (10,000) with a log10-transformation of the scaled feature expression. 2,000 highly variable features based on pipeline default were selected to calculate the principal components. After normalization and identification of variable features for each dataset independently, data integration was performed to generate combined and split UMAP plots with a random downsampling process to include up to 6,400 cells per sample to reduce cell number discrepancy across multiple samples. Annotated alloreactive and non-alloreactive cells based on MLR-defined TCR sequences as described below were always included for integrated analysis, and downsampling was performed for the remaining non-annotated cells to include up to 6,400 cells in total. Additionally, SignacFast R script (https://cran.r-project.org/web/packages/SignacX/vignettes/SignacFast-Seurat_AMP_RA.html), which integrates SignacX (Chamberlain et al., 2021, Preprint) with Seurat for cell type identification, was applied to exclude non-T cells. Anchor-based analysis (Stuart et al., 2019), where “anchors” were defined as cross-dataset pairs of cells in a matched biological state, was performed to correct technical differences between datasets (i.e., batch effect correction) and generate comparative transcriptome data across experimental conditions. UMAP plot and heatmap of DE genes were generated accordingly by running the standard Seurat workflow for clustering and visualization. RNA velocity analysis was performed using the previously described scVelo Python package (Bergen et al., 2020; Wolf et al., 2019) to predict cell fate via the projection of embedded streamline, pseudotime, and PAGA to integrated UMAPs. For pseudotime analysis, we applied “inferred root cells,” which were computed from the velocity-inferred transition matrix for each sample (Bergen et al., 2020). The computation of a transition matrix from velocities involves calculating changes in GEX, applying cosine similarity to these changes and the velocity vectors to identify likely transitions, creating a velocity graph from this similarity matrix, converting cosine correlations into transition probabilities, and finally aggregating these probabilities into a transition matrix. The PAGA analysis was only applied to TRM (c01/02) and Teff/TRM (c03/c04/c07) clusters based on our assumption from transcriptomic data that TRM and Teff/TRM cluster groups are interchangeable. The directionality of PAGA projected to UMAPs reconciles clustering with trajectory inference, reflecting the underlying biology of different directions of phenotypic transition during quiescence and rejection.
Our published protocol (Morris et al., 2015; Zuber et al., 2016) using pre-Tx MLR combined with Adaptive Biotechnologies’ TCRβ bulk DNA-seq to identify HvG and non-HvG TCRβ repertoires was applied and single-cell TCRβ sequences of FACS-sorted recipient T cells from recipient ileal graft specimens were mapped to these pre-Tx sequence sets to allow us annotate each cell with their alloreactivity, such as CD4 or CD8 HvG or non-HvG clone or undetectable in pre-Tx recipient repertoires. Similarly, post-Tx MLR combined with TCRβ bulk DNA-seq to identify H’vG and non-H’vG TCRβ repertoires was applied and single-cell TCRβ sequences of FACS-sorted recipient T cells from recipient ileal graft specimens were additionally mapped to these post-Tx sequence sets to allow us to annotate each cell with their alloreactivity, such as CD4 or CD8 H’vG or non-H’vG clone or undetectable in post-Tx recipient repertoires. Alloreactive and non-alloreactive TCR annotation was performed on each scRNA-seq sample independently. For integrated UMAP visualization, all annotated cells by pre- and/or post-Tx MLRs were included.
VIPER and STRING analyses for inferred protein regulon networks
VIPER allows computational inference of protein activity, on an individual sample basis, from GEX profile data (Alvarez et al., 2016; Obradovic et al., 2021a). It uses the expression of genes that are most directly regulated by a given protein, such as the targets of a transcription factor, as an accurate reporter of its activity. VIPER analysis requires loading of the pre-built ARACNe (algorithm for the reconstruction of accurate cellular networks) network that is run with 100 bootstrap iterations using 1,785 transcription factors, 668 transcriptional cofactors, 3,455 signaling pathway–related genes, and 3,620 surface markers as previously described (Obradovic et al., 2021a). ARACNe is an information-theoretic algorithm that has been experimentally validated in multiple tissue contexts, with a >70% accuracy in target identification (Basso et al., 2005). Protein activity for T cells in our cohort was inferred by running the metaVIPER algorithm with all CD45-positive ARACNe networks on the SCTransform-scaled and Anchor-Integrated GEX signature of single cells from the combined Seurat Object. VIPER-inferred Protein Activity matrices were then projected into a two-dimensional visualization space as a UMAP. Biologically meaningful differential regulon expression in each VIPER cluster considers not only the adjusted P value (<0.05) from Seurat FindAllMarkers command but also the dominant presence of the regulon within the cluster (a minimum fractional expression threshold of 0.45: pct.1 ≥ 0.45) and the log fold change threshold of 1 (ave_logFC ≥ 1). STRING (Szklarczyk et al., 2023) is a database of known and predicted protein–protein interactions. The interactions include direct (physical) and indirect (functional) associations; they stem from computational prediction, knowledge transfer between organisms, and interactions aggregated from other (primary) databases. We applied STRING analysis on the DE regulons identified by VIPER for each VIPER cluster (pct.1 ≥ 0.45, ave_logFC ≥ 1) to identify protein regulon networks by K means clustering (n = 3).
Software and statistical analysis
Analysis of TCRβ repertoire bulk DNA-seq data was performed in R and Rstudio using our previously published scripts (Fu et al., 2019, 2021b; Obradovic et al., 2021b; Zuber et al., 2016). Analysis of scRNA-seq data was performed in R, Rstudio, and Python, with scripts partially adapted from the Seurat v4 pipeline (Butler et al., 2018; Hao et al., 2021; Stuart et al., 2019). RNA velocity analysis was performed using the Python package scVelo (Bergen et al., 2020; Wolf et al., 2019). Metascape (Zhou et al., 2019) was used to perform gene enrichment analysis of biological GO terms. In GO term analysis, P value is the probability or chance of seeing at least x number of genes out of the total n genes in the list annotated to a particular GO term, given the proportion of genes in the whole genome that are annotated to that GO term. Additional statistics and figures were generated using GraphPad Prism (GraphPad Software). Student’s paired t test was used to compare blood versus biopsy samples at matched post-Tx time periods for designated patients and to compare anti-donor versus anti-third party responses in MLRs within each patient at designated time points. Student’s unpaired t test was used to compare the detection rate of HvG cells defined by pre- and post-Tx MLRs in quiescent versus rejecting samples and to compare normalized AUC values in ileum, PBMC, and ileum versus PBMCs in quiescent versus rejecting samples. The Mann–Whitney nonparametric distribution-free U test was performed to compare the mean ranks of one parameter in two independent samples. The Kruskal–Wallis test by ranks followed by Dunn’s multiple comparisons test was performed to determine significant differences of one parameter among three or more groups. Two-way ANOVA followed by Tukey’s multiple comparisons test was performed to determine the statistical significance of two parameters among three or more groups. Fisher’s exact test was performed in the analysis of contingency tables. P < 0.05 is considered to be a statistically significant difference.
Online supplemental material
Fig. S1 shows the expansion and persistence of HvG clones in intestinal allografts and peripheral blood over time, and hyporesponsiveness to donor antigens among post-Tx recipient T cells in patients with or without macrochimerism. Fig. S2 shows the pipeline for integrated analysis at the transcriptomic and alloreactive clonal levels and a flow diagram of experimental design and data analysis related to scRNA-seq. Fig. S3 shows IHC staining of T, B, and plasma cells in quiescent and rejecting ileal grafts. Fig. S4 shows RNA velocity analysis for indicated scRNA-seq samples and H&E staining for paired ileal stoma and regular ileal biopsies in two patients. Fig. S5 shows transcriptomic profiling of missing HvG cells in quiescent versus rejecting ileal grafts, DE genes in minority UMAP clusters, and among persistent non-HvG versus acquired H’vG cells in Treg cluster. Table S1 shows HvG clones in post-Tx blood and ileum biopsies. Table S2 shows a sample collection table and performance metrics of scRNA-seq based on 10x Cell Ranger outputs. Table S3 shows DE genes in each UMAP cluster group. Table S4 shows a summary of cell numbers in scRNA-seq assays. Table S5 shows the unique sequence or total cell number of CD4 or CD8, alloreactive or non-alloreactive clones defined by pre- and post-Tx MLRs, or identifiable in quiescent versus rejecting 10x scRNA-seq samples. Table S6 shows the calculation of the odds ratio of detecting HvG over non-HvG clones among recipient mappable repertoire by cell number or by unique sequences in ileal graft by normalizing the chance of detecting HvG over non-HvG clones in pre- or post-Tx MLRs in quiescent versus rejecting conditions. Table S7 shows a summary of cell numbers and unique sequences in six functional categories. Table S8 shows TRA and TRB clonotype distribution of tolerant HvG cells in two quiescent samples, and of putative de novo H’vG cells in two rejecting samples. Data S1 shows a summary of clinical data on each patient sampled for scRNA-seq, including the level of immunosuppressive medication used and longitudinal status of infection and rejection.
Data availability
Raw TCRβ bulk DNA-seq data for Pts4–21 are freely accessible at https://doi.org/10.21417/JF2023JEM. Raw TCRβ bulk DNA-seq data in FASTA format are available for Pts22–24 at the Sequence Read Archive (https://www.ncbi.nlm.nih.gov/sra) under accession number PRJNA578087. The code used to analyze TCRβ bulk DNA-seq data and related to pre-Tx MLR-determined alloreactivity is previously published (Fu et al., 2021b) and available in the GitHub repository at https://github.com/Aleksobrad/Fu-J-et-al.-LGVHR-manuscript. The codes used to analyze TCRβ bulk DNA-seq data and related to post-Tx MLR-determined alloreactivity, as well as VIPER analysis are available in the GitHub repository at https://github.com/jfccti/10x-TRM-manuscript. The general pipeline for VIPER analysis of scRNA-seq data is available as an actively maintained and updated R package at https://github.com/califano-lab/PISCES. The codes used to analyze 5′GEX-seq and TCRαβ scRNA-seq data and integrate scRNA-seq with bulk DNA-seq by identifying nucleotide sequences of TCRβ CDR3, v, and j are available in the GitHub repository at https://github.com/princello/scRNA-seq-TRM-paper.git. Raw scRNA-seq data have been deposited at SRA under accession number PRJNA922954. Requests to transfer human biospecimens outside of the organization must be submitted for Columbia’s IRB review and approval.
Acknowledgments
We thank Ms. Julissa Cabrera for assistance with the submission of the manuscript and Drs. Eline T. Luning Prak, Benjamin Izar, and Arnold Han for helpful review of the manuscript. We also thank Monica Velasco and Dr. Shilpa Ravella for their care of intestinal transplant recipients. We thank the Flow Cytometry Core and Human Studies Core at Columbia Center for Translational Immunology (CCTI) for their excellent services. We thank the Human Immune Monitoring Core and the Genome Center at Columbia University for their service and support on scRNA-seq–related study and the Human Immunology Core of the University of Pennsylvania for their assistance with TCR Vb gene rearrangement sequencing. We gratefully acknowledge the generosity of the donor families, our ITx patients, and their families for making this study possible.
The study is part of a Program Project Grant P01 AI106697, funded by the National Institute of Allergy and Infectious Diseases, and supported by a Congressionally Directed Medical Research Program Discovery Award W81XWH-20-1-0159 funded by the Department of Defense. Research reported here was performed in the CCTI Flow Cytometry Core, supported in part by the Office of the Director, National Institutes of Health awards S10RR027050 and S10OD020056.
Author contributions: J. Fu and M. Sykes designed the study. J. Fu, W. Jiao, K. Frangaj, R. Jones, X.V. Guo, Y. Zhang, W.-I. Kuo, and J. Zuber performed the experiments. J. Fu, M. Martinez, K. Frangaj, R. Jones, C. Bay Muntnich, A. Prada Rey, K. Rogers, and J. Weiner coordinated the clinical sample and data collection. M. Miron and D.L. Farber coordinated the deceased donor tissue collection. T. Kato and J. Weiner performed the ITx, stoma revision/closure, and graft removal surgeries. M. Martinez and J. Weiner performed the routine endoscopy and patient care. H.M. Ko and A. Iuga performed the pathology review. J. Fu, Z. Wang, A. Obradovic, W. Jiao, C. Bay Muntnich, A. Prada Rey, J. Zuber, W. Ma, Y. Shen, and M. Sykes performed data analysis. Z. Wang wrote the codes to integrate scRNA-seq data with bulk TCR-seq–defined alloreactivity to annotate each single cell and performed the statistical analyses of scRNA-seq data. A. Obradovic and Y. Shen wrote the codes to identify and track alloreactive clones. A. Obradovic wrote the codes to perform VIPER analysis. J. Fu and M. Sykes wrote the final report. All authors contributed to the editing of the final report. All authors agree to all the content of the submitted manuscript.

