


Pervasive neuroinflammation occurs in many neurodegenerative diseases, including Alzheimer’s disease (AD). SPI1/PU.1 is a transcription factor located at a genome-wide significant AD-risk locus and its reduced expression is associated with delayed onset of AD. We analyzed single-cell transcriptomic datasets from microglia of human AD patients and found an enrichment of PU.1-binding motifs in the differentially expressed genes. In hippocampal tissues from transgenic mice with neurodegeneration, we found vastly increased genomic PU.1 binding. We then screened for PU.1 inhibitors using a PU.1 reporter cell line and discovered A11, a molecule with anti-inflammatory efficacy and nanomolar potency. A11 regulated genes putatively by recruiting a repressive complex containing MECP2, HDAC1, SIN3A, and DNMT3A to PU.1 motifs, thus representing a novel mechanism and class of molecules. In mouse models of AD, A11 ameliorated neuroinflammation, loss of neuronal integrity, AD pathology, and improved cognitive performance. This study uncovers a novel class of anti-inflammatory molecules with therapeutic potential for neurodegenerative disorders.

Introduction
Alzheimer’s disease (AD; Alzheimer, 1907) is a devastating neurological condition characterized by tau and β-amyloid aggregation in brain tissue, progressive neurodegeneration, and loss of cognitive and bodily functions. Current treatment options are limited by modest efficacy and can be accompanied by serious side effects. Previously approved inhibitors of N-methyl-D-aspartate receptors and of acetylcholine esterase only ameliorate symptoms (Alzheimer’s Association, 2014). Recent trials targeting β-amyloid have shown promising results, ameliorating cognitive decline in AD patients (van Dyck et al., 2023). However, multiple previous drug candidates that successfully cleared β-amyloid were abandoned prematurely due to adverse effects, lack of efficacy in cognitive tests, or both (Doody et al., 2013; Egan et al., 2018; Honig et al., 2018). These outcomes indicate the complex nature of AD and the urgent need for novel strategies in addition to targeting β-amyloid for the treatment of AD (Huang and Mucke, 2012).
Widespread neuroinflammation is a common feature of AD and may present a potential treatment target (Koutsodendris et al., 2021). A majority of AD risk genes identified through genome-wide association studies are highly expressed in microglia, the brain’s innate immune cells, suggesting a key role in microglial dysfunction (Kummer et al., 2021; Penney et al., 2020; Teipel et al., 2022). In brain tissue from human AD patients, microglia display the morphology (Heppner et al., 2015) and gene expression profile (Gjoneska et al., 2015; Mathys et al., 2019) characteristic of an activated cell state and cluster around β-amyloid plaques. While microglial activation can help clear pathogenic molecules from the brain, it can also lead to chronic or excessive inflammation that exacerbates neurodegeneration (Mathys et al., 2017).
Current clinical intervention against inflammation includes inhibition of the cyclooxygenase enzymes COX1 or COX2 with aspirin and other nonsteroidal anti-inflammatory drugs (NSAIDs), such as ibuprofen and naproxen, to prevent the generation of inflammatory mediators such as prostaglandin and thromboxanes (Dinarello, 2010). Epidemiological studies associated NSAID use with a lower risk of developing AD (Rivers-Auty et al., 2020). However, all subsequent AD trials with NSAIDs were unsuccessful in improving cognition and caused gastrointestinal and cardiovascular side effects (Dinarello, 2010). Glucocorticoid receptor agonists that block the production of proinflammatory prostaglandins and leukotrienes are an alternative anti-inflammatory treatment (Dinarello, 2010). However, glucocorticoid signaling is associated with exacerbated AD pathology (Gräff et al., 2012; Green et al., 2006). Why exactly anti-inflammatories have not yet shown benefit for AD patients remains unclear. Novel inflammation modulators currently being explored for AD include inhibitors of TNFα (Zhou et al., 2020a) and antibodies activating TREM2 (Wang et al., 2020).
The transcription factor PU.1 is a lineage-specifying transcription factor that is most highly expressed in peripheral myeloid cells and constitutively in microglia in the brain, where it can drive inflammatory gene expression together with other transcription factors such as the IFN regulatory factors (IRFs) and NF-κB (Gupta et al., 2009). Increased PU.1 expression levels are associated with AD (Gjoneska et al., 2015; Huang et al., 2017; Rustenhoven et al., 2018) and Huntington’s disease (Crotti et al., 2014), while polymorphisms in the PU.1 gene SPI1 that reduce PU.1 expression levels lower the risk of AD (Cao et al., 2022) and delay AD onset (Huang et al., 2017). To date, two small-molecule screens targeting PU.1 have been published (Munde et al., 2014; Rustenhoven et al., 2018). One described molecules that intercalate into the DNA at PU.1 motifs and show therapeutic potential in models of leukemia (Antony-Debré et al., 2017) and fibrosis (Wohlfahrt et al., 2019). The other study analyzed gene expression in AD patient brain tissue and identified the HDAC inhibitor vorinostat as capable of lowering expression of PU.1 itself, thereby reducing the expression of AD-associated PU.1 target genes in cultured microglia (Rustenhoven et al., 2018). However, potent, brain-penetrant, and selective inhibitors of PU.1 are still lacking. While total inhibition of PU.1 activity could adversely interfere with myeloid differentiation (Iwasaki et al., 2005), an inhibitory modulator of PU.1 activity that limits microglial hyperactivity during inflammation may be an ideal therapeutic.
Here, we describe the discovery of a new class of small molecules that moderate the inflammatory response in human induced pluripotent stem cell (iPSC)–derived microglia-like cells (iMGLs) by downregulating inflammatory PU.1-target gene expression without affecting hematopoiesis. Our lead molecule, A11, is well tolerated in mice, preferentially localizes to the brain over plasma after systemic injection, reduces neuropathology, and improves cognitive performance in multiple mouse strains that model AD-like pathology, including β-amyloid deposition, tauopathy, and neurodegeneration. A11 stimulates the recruitment of MECP2, HDAC1, and other co-repressor molecules to PU.1 target genes, such as IL1B and CD14, without affecting PU.1 expression levels, thus representing a novel treatment modality for AD.
Results
Validating PU.1 as an AD drug target
We confirmed a key role of PU.1 in the neuroinflammatory response to AD by analyzing published single-cell gene expression datasets of immune cells from AD patients (Grubman et al., 2019; Lau et al., 2020; Mathys et al., 2019; Morabito et al., 2021; Xu and Jia, 2021; Zhou et al., 2020b) and mouse models (Keren-Shaul et al., 2017; Mathys et al., 2017; Fig. 1 a). We found 1,246 and 2,032 differentially expressed genes (DEGs) in the AD datasets for humans and mice, respectively. To uncover the transcription factors regulating the DEGs, we performed motif analysis and found a strong enrichment for ETS (E26/erythroblast transformation-specific), IRF, bHLH (basic helix-loop-helix), and bZIP (basic leucine zipper) motifs. This suggested a central role for PU.1, a member of the ETS family and known binding partner of other ETS proteins, and IRF, bHLH, and bZIP transcription factors (Gupta et al., 2009). These motifs were not enriched in a randomized sample of 1,500 human and 2,500 mouse genes detected, but not differentially expressed between AD and control samples (Table S1). Notably, AD risk alleles were recently shown to be enriched in PU.1-binding motifs (Novikova et al., 2021). We sought to confirm our findings by performing chromatin immunoprecipitation (ChIP) with an anti-PU.1 antibody followed by next-generation sequencing (ChIP-Seq) in an AD mouse model. We used bitransgenic CK-p25 mice (Cruz et al., 2003) that harbor the neurotoxic CDK5 activator p25 under the control of an inducible promoter specific for excitatory neurons. These mice develop profound neuroinflammation by around 2 wk (Mathys et al., 2017) and wide-spread neurodegeneration and cognitive impairment by 6 wk after induction (Gjoneska et al., 2015). The ChIP-Seq revealed that PU.1 binding was strongly increased in the hippocampus of male 6-wk induced CK-p25 mice, with more than 40% of all PU.1 ChIP peaks showing increased occupancy and only 0.1% showing decreased occupancy (Fig. 1 b). The genes associated with the PU.1 ChIP peaks were enriched for gene ontology pathways of inflammatory immune responses, confirming a central role for PU.1 in AD-associated inflammatory gene expression.

Small molecule targeting of AD-associated transcriptional regulators in immune cells. (a) Motif analysis of published datasets of single cell or nucleus RNA sequencing using HOMER software at ± 2,000 bp from the transcription start site of DEGs detected in single cell/nucleus RNA sequencing of microglia/immune cells from human AD patients (1,246 genes) and from mouse models of AD (CK-p25 and 5XFAD mice, 2,032 genes). Circle size indicates the percentage of DEGs harboring the motif. The list shows the 14 most significant motifs. Padj represents Benjamini corrected q-values. Pie charts represent all detected motifs with a Padj ≤ 0.05 for the human (top) and mouse (bottom) datasets. (b) Top: Pie chart shows the percent of PU.1 ChIP-Seq peaks that were unchanged, decreased, or increased in hippocampal tissue of CK-p25 mice after a 6-wk p25 induction. Bottom: Gene ontology analysis of genes with increased PU.1 ChIP-Seq peaks. (c) Effect of induced PU.1 knockout in the hippocampus of 6-wk male p25-induced CK-p25 mice. Left: RT-qPCR quantification of hippocampal tissue, normalized to Actb. Right: Confocal micrographs of the hippocampal CA1 region, stained above for microglial cell bodies (IBA1) and nuclei (Hoechst) and below for neuronal nuclei (NeuN) and cell bodies of excitatory neurons (p25-GFP). Quantification to the right. n = 3 for PU.1WT/WT (CK-p25:CX3CR1CreERT2/+:PU.1WT/WT) and 4 for PU.1fl/fl (CK-p25:CX3CR1CreERT2/+:PU.1fl/fl) mice. Student’s unpaired, two-sided t test; *P ≤ 0.05, n = 4 for all conditions. Bars are mean ± SEM; each data point represents a well. Scale bar, 50 µm. (d) Illustration of the reporter construct. Insertion of five tandem tracks of the PU.1-binding motif λB (5XλB) into a pGL4.23 luciferase plasmid, subcloning into the pROSA26-1 plasmid, and integration into the Rosa26 locus of BV2 microglia. The resulting “BV2 PU.1-Luciferase” cells were plated in 384-well plates, incubated with molecules for 2 d, and then subjected to luminescence and Hoechst signal quantification. (e) Hits from the primary screen; yellow indicates a Z-score ≤ −2.5. (f) Validation of the top six hits, titrated from 600 pM to 10 µM in twelve 1:2 dilution steps. (g) Relationship between EC50 (concentration at which half-maximal luminescence inhibition occurs, calculated using Hill’s equation) and “effective AUC” (AUC for luminescence inhibition minus AUC for Hoechst signal reduction, measuring PU.1 inhibition not due to cell death). Results in this panel were repeated in three separate batches of experiments. (h) Molecular structure of the most potent hit A11.
Small molecule targeting of AD-associated transcriptional regulators in immune cells. (a) Motif analysis of published datasets of single cell or nucleus RNA sequencing using HOMER software at ± 2,000 bp from the transcription start site of DEGs detected in single cell/nucleus RNA sequencing of microglia/immune cells from human AD patients (1,246 genes) and from mouse models of AD (CK-p25 and 5XFAD mice, 2,032 genes). Circle size indicates the percentage of DEGs harboring the motif. The list shows the 14 most significant motifs. Padj represents Benjamini corrected q-values. Pie charts represent all detected motifs with a Padj ≤ 0.05 for the human (top) and mouse (bottom) datasets. (b) Top: Pie chart shows the percent of PU.1 ChIP-Seq peaks that were unchanged, decreased, or increased in hippocampal tissue of CK-p25 mice after a 6-wk p25 induction. Bottom: Gene ontology analysis of genes with increased PU.1 ChIP-Seq peaks. (c) Effect of induced PU.1 knockout in the hippocampus of 6-wk male p25-induced CK-p25 mice. Left: RT-qPCR quantification of hippocampal tissue, normalized to Actb. Right: Confocal micrographs of the hippocampal CA1 region, stained above for microglial cell bodies (IBA1) and nuclei (Hoechst) and below for neuronal nuclei (NeuN) and cell bodies of excitatory neurons (p25-GFP). Quantification to the right. n = 3 for PU.1WT/WT (CK-p25:CX3CR1CreERT2/+:PU.1WT/WT) and 4 for PU.1fl/fl (CK-p25:CX3CR1CreERT2/+:PU.1fl/fl) mice. Student’s unpaired, two-sided t test; *P ≤ 0.05, n = 4 for all conditions. Bars are mean ± SEM; each data point represents a well. Scale bar, 50 µm. (d) Illustration of the reporter construct. Insertion of five tandem tracks of the PU.1-binding motif λB (5XλB) into a pGL4.23 luciferase plasmid, subcloning into the pROSA26-1 plasmid, and integration into the Rosa26 locus of BV2 microglia. The resulting “BV2 PU.1-Luciferase” cells were plated in 384-well plates, incubated with molecules for 2 d, and then subjected to luminescence and Hoechst signal quantification. (e) Hits from the primary screen; yellow indicates a Z-score ≤ −2.5. (f) Validation of the top six hits, titrated from 600 pM to 10 µM in twelve 1:2 dilution steps. (g) Relationship between EC50 (concentration at which half-maximal luminescence inhibition occurs, calculated using Hill’s equation) and “effective AUC” (AUC for luminescence inhibition minus AUC for Hoechst signal reduction, measuring PU.1 inhibition not due to cell death). Results in this panel were repeated in three separate batches of experiments. (h) Molecular structure of the most potent hit A11.
Next, we tested whether a reduction in PU.1 activity could ameliorate neuropathology in CK-p25 mice. Thus, we crossed CK-p25 mice with CX3CR1:CreERT2:PU.1fl/fl mice to enable conditional ablation of the PU.1 gene in a majority of myeloid cells, including most microglia (Auffray et al., 2009; Wolf et al., 2013), through induction of Cre expression. Ablation of the PU.1 gene led to a 33% reduction in microgliosis, a feature of neuroinflammation, in the hippocampi of male 6-wk induced CK-p25 mice (P = 0.0209; Fig. 1 c). PU.1 ablation also reduced neurodegeneration in 6-wk induced CK-p25 mice as evidenced by a 1.7-fold increase in the number of intact excitatory neuronal cell bodies, detectable through p25-GFP expression, in the granule layer of the hippocampus (P = 0.0318; Fig. 1 c). These results endorse PU.1 as a promising therapeutic target for AD and prompted us to screen for novel chemical inhibitors of PU.1 activity.
High-throughput screen for PU.1 inhibitors
We created a luminescence-based reporter of PU.1 activity—the “BV2 PU.1-Luciferase” cell line—by inserting five tandem copies of the PU.1-binding motif λB (Eisenbeis et al., 1993; Munde et al., 2014) followed by the luciferase gene into the Rosa26 locus of the immortalized mouse microglial cell line BV2 (Fig. 1 d and Table S2). PU.1 dependence of luciferase expression was demonstrated by a luminescence reduction of 96.1 ± 1.2% upon PU.1 silencing with shRNAs (P ≤ 0.0069); a luminescence increase of 664 ± 71.7% when overexpressing PU.1 (P ≤ 0.0001; Tables S3 and S4); and a luminescence reduction of 11.8 ± 22.3% in the presence of the PU.1-motif intercalator DB2313 (Antony-Debré et al., 2017; Munde et al., 2014; P ≤ 0.0001; Table S5). DB2313 did not affect PU.1-independent luciferase expression in HEK293 cells with CMV-driven luciferase (HEK CMV-Luciferase, P ≥ 0.05; Table S5). The non-specific luciferase quencher 119113 reduced luminescence by ∼90% in both BV2 PU.1-Luciferase and HEK CMV-Luciferase cells (P ≤ 0.0001; Table S5). We then screened 58,100 small molecules from three separate libraries, containing either Food and Drug Administration–approved drugs or novel chemical structures, with the BV2 PU.1-Luciferase line (Table S6). Each molecule was screened twice at 3.3 µM for both luminescence and cytotoxicity (measured by loss of Hoechst signal). A positive “hit” was defined as having a mean luminescence Z-score of less than or equal to −2.5 (yellow data points; Fig. 1 e) and a mean Hoechst signal Z-score between −2 and 2 (see Table S7 for Z′ calculations). The primary screen yielded 264 hits that were subject to four additional filters for inhibition of PU.1 activity. First, we removed molecules that reduce PU.1-independent luminescence by titrating the molecules from 600 pM to 2.5 µM and comparing their effect size (effective area under the curve [AUC]) in the HEK CMV-Luciferase line. The effective AUC is defined as the area under the luminescence-inhibition curve minus the area under the Hoechst-signal curve. This gives us a measure of luminescence inhibition not due to cell death. 64 molecules with an effective AUC significantly larger than DMSO (P ≤ 0.05) in the HEK CMV-Luciferase line were excluded (Fig. S1 a). Second, 100 hits were removed due to poor efficacy after titration in BV2 PU.1-Luciferase cells, as their effective AUC was not larger than that of DMSO (P > 0.05; Fig. S1 b). Third, 57 molecules that did not reduce Luciferase mRNA levels versus DMSO (P > 0.05) in reverse transcriptase quantitative PCR (RT-qPCR) were removed (Fig. S1 c). Fourth, non-specific luminescence quenchers that affected the luminescence signal (P ≤ 0.05) in cell lysates from the BV2 PU.1-Luciferase or HEK CMV-Luciferase line were excluded. The final hit rate was 0.07%, corresponding to 43 hits (Fig. S1 d) that were ranked according to effective AUC plotted against potency (EC50; the concentration generating half-maximal luminescence reduction; Fig. 1, f and g). Six molecules (A11, B03, D09, D06, 2H5, and 2H2) were selected primarily for potency and efficacy but also for regulating additional PU.1 target genes Tyrobp, Trem2, Il1b, and Apoe (Huang et al., 2017; Fig. S1 c), for maximal structural diversity between molecules, and for the exclusion of frequent hits in previous screens listed on PubChem and the Institute of Chemistry and Cell Biology database Screensaver. With an EC50 of 2.5 nM, A11 (Fig. 1, g and h) was >16-fold more potent in the BV2 reporter assay than any other hit. Notably, A11 shared core structural elements with 12 of the 43 validated hits, indicating a structure–activity relationship (see “A11 core” in the “Cluster” column of Fig. S1 c). We ruled out batch effects in the BV2 PU.1-Luciferase line with A11 obtained from multiple sources (Fig. S2, a and b).

Four rounds of validation applied to the hits from the primary screen. (a) Left: Table details the number of molecules, primary screen hits, and hit rate represented in Fig. 1 e, for each library included in the high-throughput drug screen. Middle: The subsequent elimination of false-positive luciferase quenchers using the HEK CMV-Luciferase cell line by calculating the effective AUC between 600 pM and 2.5 µM in twelve 1:2 dilution steps for luminescence inhibition, in the first round of validation. Molecules with a P value ≤0.05 (ANOVA, Dunnett’s post hoc test versus DMSO) were considered non-specific luciferase quenchers and were eliminated. The remaining hits are listed in the far-right table. Results in this panel were repeated in three separate batches of experiments. (b) The second round of validation based on effective AUC between 600 pM and 2.5 µM for luminescence inhibition in BV2 PU.1-Luciferase cells. Molecules with a P value ≤0.05 were considered validated for efficacy (ANOVA, Dunnett’s post hoc test versus DMSO). The remaining hits after the second round of validation are listed in the far-right table. The results in this panel were repeated in two separate batches of experiments. (c) In round 3, only molecules that reduced luciferase mRNA in BV2 PU.1-Luciferase cells in RT-qPCR experiments (P value ≤0.05, Student’s unpaired, two-sided t test versus DMSO, n ≥ 3 for all molecules) were retained. The RT-qPCR results in this panel were repeated in two separate batches of experiments. Table lists each molecule (column 1), grouped according to RT-qPCR results (column 2) with each color indicating mRNA fold change after a 2-d, 1.25-µM treatment normalized to Actb (columns 3–8). The bottom part of the table shows the hits from the Selleck library, grouped according to known mechanism of action. Columns 9–14 show originating library, EC50 (calculated using Hill’s equation), Emax (maximal percentage of luminescence inhibition), effective AUC, subdivision of molecules into clusters using maximum common substructure analysis with the Pipeline Pilot (Dassault Systèmes), respectively. Retained hits are listed in the far-right table. (d) Fourth and final validation round, testing for luminescence reduction in lysates of BV2 PU.1-Luciferase and HEK CMV-Luciferase cells with all the molecules listed in the table in panel c, using the known luciferase quencher 119113 used as the positive control. ANOVA, Dunnett’s post hoc test versus DMSO; ****P ≤ 0.0001, n ≥ 3 for all molecules. Bars are mean ± SEM. The results in this panel were repeated in two separate batches of experiments. Final results and remaining hits are shown in the bottom table.
Four rounds of validation applied to the hits from the primary screen. (a) Left: Table details the number of molecules, primary screen hits, and hit rate represented in Fig. 1 e, for each library included in the high-throughput drug screen. Middle: The subsequent elimination of false-positive luciferase quenchers using the HEK CMV-Luciferase cell line by calculating the effective AUC between 600 pM and 2.5 µM in twelve 1:2 dilution steps for luminescence inhibition, in the first round of validation. Molecules with a P value ≤0.05 (ANOVA, Dunnett’s post hoc test versus DMSO) were considered non-specific luciferase quenchers and were eliminated. The remaining hits are listed in the far-right table. Results in this panel were repeated in three separate batches of experiments. (b) The second round of validation based on effective AUC between 600 pM and 2.5 µM for luminescence inhibition in BV2 PU.1-Luciferase cells. Molecules with a P value ≤0.05 were considered validated for efficacy (ANOVA, Dunnett’s post hoc test versus DMSO). The remaining hits after the second round of validation are listed in the far-right table. The results in this panel were repeated in two separate batches of experiments. (c) In round 3, only molecules that reduced luciferase mRNA in BV2 PU.1-Luciferase cells in RT-qPCR experiments (P value ≤0.05, Student’s unpaired, two-sided t test versus DMSO, n ≥ 3 for all molecules) were retained. The RT-qPCR results in this panel were repeated in two separate batches of experiments. Table lists each molecule (column 1), grouped according to RT-qPCR results (column 2) with each color indicating mRNA fold change after a 2-d, 1.25-µM treatment normalized to Actb (columns 3–8). The bottom part of the table shows the hits from the Selleck library, grouped according to known mechanism of action. Columns 9–14 show originating library, EC50 (calculated using Hill’s equation), Emax (maximal percentage of luminescence inhibition), effective AUC, subdivision of molecules into clusters using maximum common substructure analysis with the Pipeline Pilot (Dassault Systèmes), respectively. Retained hits are listed in the far-right table. (d) Fourth and final validation round, testing for luminescence reduction in lysates of BV2 PU.1-Luciferase and HEK CMV-Luciferase cells with all the molecules listed in the table in panel c, using the known luciferase quencher 119113 used as the positive control. ANOVA, Dunnett’s post hoc test versus DMSO; ****P ≤ 0.0001, n ≥ 3 for all molecules. Bars are mean ± SEM. The results in this panel were repeated in two separate batches of experiments. Final results and remaining hits are shown in the bottom table.

Validating A11 sourced from multiple vendors, in multiple cell lines, and in time course experiments. (a) Column 1 lists the vendor of A11. (b) Columns 2–7 shows colored coding of mRNA fold change in RT-qPCR experiments after A11 treatment (2 d, 1.25 µM), normalized to Actb, in the microglial cell line listed in column 8. Column 9 lists EC50 for luminescence inhibition between 600 pM and 2.5 µM, also shown in panel b, fitted to Hill’s equation. The results in this panel were repeated in two separate batches of experiments. (c) Time course of effects of A11 for luminescence reduction and mRNA reduction of Luciferase and Il1b expression normalized to Actb. Results were repeated in two separate batches of experiments. (d) Karyotyping of the iPSC (AG09173) and ES line (WA09), left and right panels, respectively, obtained from two female donors. (e) Purity of microglia cultures assessed with flow cytometry on iMGLs (left panel) and ES iMGLs (right panel) for CD11b versus NeuN, as well as for microglial markers IBA1, TMEM119 and PU.1, and counterstained with Hoechst in the blue channel. Scale bar, 50 µm. Ordinate and abscissa values are defined as signals above background as determined using non-labeled negative control cells. Laser intensities were selected so that the data points of the labeled samples fall within the linear range. The results in this panel were repeated in three separate batches of experiments. (f) Titration from 600 pM to 2.5 µM in twelve 1:2 dilution steps of the top six hits: flow cytometry experiments in iMGLs measuring inhibition of uptake of either Zymosan A bioparticles (left panel) or mouse myelin (right panel) fitted to Hill’s equation. The results in this panel were repeated in three separate batches of experiments. (g) RT-qPCR experiment shows concentration-dependent efficacy of A11, as measured by IL1B mRNA reduction in iMGLs (% of maximal possible inhibition, blue line). Toxicity was measured using the caspase 3/7-Glo luminescence (black line) and propidium iodide uptake assay (red line; percent of 1-d media starved microglia in DPBS only), fitted to Hill’s equation. The right panel shows epifluorescent micrographs of iMGLs in the propidium iodide assay, counterstained with Hoechst in the blue channel. n ≥ 3 for all data points. Scale bar, 100 µm. The results in this panel were repeated in three separate batches of experiments. (h) Left: RT-qPCR for IL1B mRNA normalized to ACTB. Right: ELISA for IL1β protein in cell culture supernatant after a 2-d, 25 ng/ml treatment with either IFNγ, LPS, or TNFα in black and open blue bars for iMGLs and ES iMGLs, respectively, and in yellow and filled blue bars when co-applied with A11 treatment (20 nM), for iMGLs and ES iMGLs, respectively. Student’s unpaired, two-sided t test; ***P ≤ 0.001, **P ≤ 0.01, *P ≤ 0.05, n ≥ 3 for all data points. Bars are mean ± SEM; each data point represents a well. The results in this panel were repeated in two separate batches of experiments.
Validating A11 sourced from multiple vendors, in multiple cell lines, and in time course experiments. (a) Column 1 lists the vendor of A11. (b) Columns 2–7 shows colored coding of mRNA fold change in RT-qPCR experiments after A11 treatment (2 d, 1.25 µM), normalized to Actb, in the microglial cell line listed in column 8. Column 9 lists EC50 for luminescence inhibition between 600 pM and 2.5 µM, also shown in panel b, fitted to Hill’s equation. The results in this panel were repeated in two separate batches of experiments. (c) Time course of effects of A11 for luminescence reduction and mRNA reduction of Luciferase and Il1b expression normalized to Actb. Results were repeated in two separate batches of experiments. (d) Karyotyping of the iPSC (AG09173) and ES line (WA09), left and right panels, respectively, obtained from two female donors. (e) Purity of microglia cultures assessed with flow cytometry on iMGLs (left panel) and ES iMGLs (right panel) for CD11b versus NeuN, as well as for microglial markers IBA1, TMEM119 and PU.1, and counterstained with Hoechst in the blue channel. Scale bar, 50 µm. Ordinate and abscissa values are defined as signals above background as determined using non-labeled negative control cells. Laser intensities were selected so that the data points of the labeled samples fall within the linear range. The results in this panel were repeated in three separate batches of experiments. (f) Titration from 600 pM to 2.5 µM in twelve 1:2 dilution steps of the top six hits: flow cytometry experiments in iMGLs measuring inhibition of uptake of either Zymosan A bioparticles (left panel) or mouse myelin (right panel) fitted to Hill’s equation. The results in this panel were repeated in three separate batches of experiments. (g) RT-qPCR experiment shows concentration-dependent efficacy of A11, as measured by IL1B mRNA reduction in iMGLs (% of maximal possible inhibition, blue line). Toxicity was measured using the caspase 3/7-Glo luminescence (black line) and propidium iodide uptake assay (red line; percent of 1-d media starved microglia in DPBS only), fitted to Hill’s equation. The right panel shows epifluorescent micrographs of iMGLs in the propidium iodide assay, counterstained with Hoechst in the blue channel. n ≥ 3 for all data points. Scale bar, 100 µm. The results in this panel were repeated in three separate batches of experiments. (h) Left: RT-qPCR for IL1B mRNA normalized to ACTB. Right: ELISA for IL1β protein in cell culture supernatant after a 2-d, 25 ng/ml treatment with either IFNγ, LPS, or TNFα in black and open blue bars for iMGLs and ES iMGLs, respectively, and in yellow and filled blue bars when co-applied with A11 treatment (20 nM), for iMGLs and ES iMGLs, respectively. Student’s unpaired, two-sided t test; ***P ≤ 0.001, **P ≤ 0.01, *P ≤ 0.05, n ≥ 3 for all data points. Bars are mean ± SEM; each data point represents a well. The results in this panel were repeated in two separate batches of experiments.
Functional and transcriptomic effect of A11 in iMGLs
We tested the inhibitory effects of the top six hits on phagocytic activity and inflammatory response in human microglia-like cells derived from either iPSCs or embryonic stem cells (ES iMGLs; Fig. S2, d and e). Increased PU.1 levels stimulate microglial uptake of fluorescently labeled Zymosan A–coated bioparticles and mouse myelin (Huang et al., 2017). Thus, the ability of our hits to reduce microglial uptake of these substrates, as determined by flow cytometry, served as a measure of PU.1 inhibition. A11 again stood out as the most potent inhibitor of Zymosan A bioparticle and myelin uptake in iMGLs (EC50 < 35 nM; Fig. S2 f), and we, therefore, focused on subsequent experiments on A11.
A11 showed a toxicity index (TC50) of 163 and 177 nM, as measured by caspase activity and nuclear propidium iodide accumulation, respectively (Fig. S2 g). The TC50 was ∼50 times higher than the EC50 (3 nM) for mRNA reduction of the PU.1 target gene IL1B (Fig. S2 g). Based on the TC50, the EC50 in BV2 PU.1-Luciferase cells (Fig. 1 f) and iMGLs (Fig. S2 f), and on time course experiments (Fig. S2 c), we proceeded with A11 treatment conditions of 20 nM for 2 d for all subsequent experiments, unless stated otherwise. We investigated the anti-inflammatory potential of A11 by first applying either A11 or vehicle, and then one of the inflammatory molecules IFNγ, LPS, or TNFα to two lines of iMGLs. Coapplication of A11 lowered IL1β mRNA (P ≤ 0.0478) and protein levels (P ≤ 0.0406; Fig. S2 h) and reduced the increase in cell body size (P ≤ 0.0406, Fig. 2 a) and accumulation of BODIPY-stained lipids (P ≤ 0.0011; Fig. 2 b), suggesting that A11 moderates microglial activation in iMGLs.

Functional and transcriptomic analysis of A11. (a) Left: Epifluorescence micrographs of the cellular membrane of iMGLs labeled with Vybrant DiI, counterstained with Hoechst. Effect of a 2-d treatment with DPBS (10 µl/ml) or 25 ng/ml of either IFNγ, LPS, or TNFα with co-application of vehicle or A11. Scale, bar 10 µm. Quantification: Total Vybrant-positive (red channel) surface area divided by the number of Hoechst-positive cells per field of view with the “+DPBS +Veh.” condition set as baseline (“ctrl.”). Results in this panel were repeated in two separate batches of experiments. (b) Epifluorescence micrographs of intracellular neutral lipid aggregates in iMGLs, stained with BODIPY (green channel). Effect of a 2-d treatment with DPBS (10 µl/ml) or 25 ng/ml of either IFNγ or TNFα with co-application of vehicle of A11. Scale bar, 10 µm. Quantification: percentage of cells with >2 aggregates per cell. Quantification of panels a and b: Student’s unpaired, two-sided t test; ****P ≤ 0.0001, ***P ≤ 0.001, **P ≤ 0.01, *P ≤ 0.05, n = 6 for all conditions. Bars are mean ± SEM; each data point represents a well. Results in this panel were repeated in two separate batches of experiments. (c) Volcano plot of DEGs (Padj ≤ 0.05; calculated with apeglm [Zhu et al., 2019]; bulk RNA sequencing) of iMGLs treated with A11 (20 nM, 2 d) compared to treatment with vehicle (1% DMSO in DPBS, 2 d). (d) Motif analysis of the DEGs in panel c using HOMER software ±2,000 bp from the transcription start site. Padj represents Benjamini corrected q-values. (e) Gene ontology analysis of the up- and downregulated genes from panel c with (Padj ≤ 0.05, −1 > log2(fold change) > 1) using Toppgene, accessed November 11, 2022. Padj represents Bonferroni corrected P values. (f) Bars show the number of DEGs (3,740 unique genes in total) after A11 co-treatment in cells treated with 25 ng/ml for 2 d with either IFNγ, LPS, TNFα, or TGFβ. Cut-off for inclusion was set at Padj ≤ 0.05, log2(fold change) > ±0.2. (g) Motif analysis of the 3,740 DEGs from panel f using Homer software ± 2,000 bp from the transcription start site. Padj represents Benjamini corrected q-values. Circle size indicates the percentage of DEGs harboring the motif. Circles are then subdivided into pie sections. The black and red section indicates DEGs regulated in the opposite or same direction, respectively, after A11 co-treatment with inflammatory treatment (average fold change caused by IFNγ, LPS, TNFα, or TGFβ treatment compared to co-treatment with A11). Genes were extracted from datasets with the GEO accession numbers GSM537988 (PU.1), GSM1167584 (MITF), GSM1370276 (SPIB), GSM1057024 (IRF1), GSM970261 (IRF2), GSE36030 (USF2), GSE21521 (PU.1); ENCODE accession numbers ENCFF624RGO (ENCODE, ETV4) and ENCFF444VWF (ENCODE, Sp2); and GEO accession numbers GSM558677 (ETV1) and GSE33912 (ATF3) using input files as control file when available, otherwise “blacklisted” regions were extracted from ENCODE for the relevant genome build (Amemiya et al., 2019). Cut-off for inclusion in the heat map was set at log2(fold change) > ±0.2. (h) The AD-associated genes from Fig. 1 a were compared for fold change, directionality, and gene ontology in iMGLs after treatment as in panel f. Fold change minimum and the maximum was set to ±0.5, and the color scheme is relative to each row, using the minimum and maximum values in each row to convert values to colors. Cut-off for inclusion in the heat map was set at log2(fold change) > ±0.2.
Functional and transcriptomic analysis of A11. (a) Left: Epifluorescence micrographs of the cellular membrane of iMGLs labeled with Vybrant DiI, counterstained with Hoechst. Effect of a 2-d treatment with DPBS (10 µl/ml) or 25 ng/ml of either IFNγ, LPS, or TNFα with co-application of vehicle or A11. Scale, bar 10 µm. Quantification: Total Vybrant-positive (red channel) surface area divided by the number of Hoechst-positive cells per field of view with the “+DPBS +Veh.” condition set as baseline (“ctrl.”). Results in this panel were repeated in two separate batches of experiments. (b) Epifluorescence micrographs of intracellular neutral lipid aggregates in iMGLs, stained with BODIPY (green channel). Effect of a 2-d treatment with DPBS (10 µl/ml) or 25 ng/ml of either IFNγ or TNFα with co-application of vehicle of A11. Scale bar, 10 µm. Quantification: percentage of cells with >2 aggregates per cell. Quantification of panels a and b: Student’s unpaired, two-sided t test; ****P ≤ 0.0001, ***P ≤ 0.001, **P ≤ 0.01, *P ≤ 0.05, n = 6 for all conditions. Bars are mean ± SEM; each data point represents a well. Results in this panel were repeated in two separate batches of experiments. (c) Volcano plot of DEGs (Padj ≤ 0.05; calculated with apeglm [Zhu et al., 2019]; bulk RNA sequencing) of iMGLs treated with A11 (20 nM, 2 d) compared to treatment with vehicle (1% DMSO in DPBS, 2 d). (d) Motif analysis of the DEGs in panel c using HOMER software ±2,000 bp from the transcription start site. Padj represents Benjamini corrected q-values. (e) Gene ontology analysis of the up- and downregulated genes from panel c with (Padj ≤ 0.05, −1 > log2(fold change) > 1) using Toppgene, accessed November 11, 2022. Padj represents Bonferroni corrected P values. (f) Bars show the number of DEGs (3,740 unique genes in total) after A11 co-treatment in cells treated with 25 ng/ml for 2 d with either IFNγ, LPS, TNFα, or TGFβ. Cut-off for inclusion was set at Padj ≤ 0.05, log2(fold change) > ±0.2. (g) Motif analysis of the 3,740 DEGs from panel f using Homer software ± 2,000 bp from the transcription start site. Padj represents Benjamini corrected q-values. Circle size indicates the percentage of DEGs harboring the motif. Circles are then subdivided into pie sections. The black and red section indicates DEGs regulated in the opposite or same direction, respectively, after A11 co-treatment with inflammatory treatment (average fold change caused by IFNγ, LPS, TNFα, or TGFβ treatment compared to co-treatment with A11). Genes were extracted from datasets with the GEO accession numbers GSM537988 (PU.1), GSM1167584 (MITF), GSM1370276 (SPIB), GSM1057024 (IRF1), GSM970261 (IRF2), GSE36030 (USF2), GSE21521 (PU.1); ENCODE accession numbers ENCFF624RGO (ENCODE, ETV4) and ENCFF444VWF (ENCODE, Sp2); and GEO accession numbers GSM558677 (ETV1) and GSE33912 (ATF3) using input files as control file when available, otherwise “blacklisted” regions were extracted from ENCODE for the relevant genome build (Amemiya et al., 2019). Cut-off for inclusion in the heat map was set at log2(fold change) > ±0.2. (h) The AD-associated genes from Fig. 1 a were compared for fold change, directionality, and gene ontology in iMGLs after treatment as in panel f. Fold change minimum and the maximum was set to ±0.5, and the color scheme is relative to each row, using the minimum and maximum values in each row to convert values to colors. Cut-off for inclusion in the heat map was set at log2(fold change) > ±0.2.
Next, we explored the transcriptomic effects of A11 in iMGLs. In the absence of inflammatory stimuli, only 3.2% of detected iMGL transcripts were differentially expressed following A11 treatment (Fig. 2 c and Data S1). As expected, based on our high-throughput screening criteria, these transcripts were enriched for ETS (0.0007 ≤ adjusted P value [Padj] ≤ 0.0085) and IRF (0.0098 ≤ Padj ≤ 0.0116) motifs (Fig. 2 d). Notably, gene ontology analysis of the downregulated genes (Padj ≤ 0.05, log2(fold change) < −1) mapped to pathways of immune responses to foreign organisms (6 × 10⁻¹⁰ ≤ Padj ≤ 0.008) and IFN signaling (0.0002 ≤ Padj ≤ 0.03; Fig. 2 e), matching the pathways enriched in PU.1-ChIP-Seq experiments in induced CK-p25 mice (Fig. 1 b), suggesting that A11 moderates microglial gene expression changes related to neuroinflammation. The downregulated genes showed enrichment for “structural constituent of chromatin” (Padj = 4.9 × 10⁻¹⁸), “nucleosome assembly” (Padj = 7.4 × 10⁻⁸), and “protein dimerization activity” (1.2 × 10⁻⁷ ≤ Padj ≤ 9.3 × 10⁻⁵), suggesting that A11 activity involves protein–DNA interactions.
To test the effect of A11 on gene expression in iMGL in different states of activation, we applied IFNγ, LPS, TNFα, or TGFβ one at a time, and subsequently A11 or vehicle, and identified DEGs linked to each condition (Fig. 2 f and Data S2). We then averaged the expression levels of the DEGs in the activation states as compared to untreated cells and compared this to the DEGs after activation and A11 co-treatment. The DEGs affected by A11 were enriched for ETS (0.01 ≤ Padj ≤ 0.045), IRF (Padj = 0.01), bHLH (0.01 ≤ Padj ≤ 0.045), bZIP (0.019 ≤ Padj ≤ 0.045), and zinc finger (0.03 ≤ Padj ≤ 0.045) motifs (Fig. 2 g). Depending on the motif, 74–79% of the DEGs in the activated iMGLs were regulated in the opposite direction by A11 co-treatment. Hence, the presence of A11 caused gene expression in activated iMGLs to more closely resemble that of untreated iMGLs. Among the 1,246 immune genes identified as dysregulated in AD patient samples (see Fig. 1 a), ∼66% had their direction of expression in activated iMGL reversed upon A11 co-treatment. Gene ontology analysis of genes downregulated by A11 mapped to MHC class II protein binding (Padj = 2.7 × 10⁻¹³), including the AD risk gene HLA-DRB1 and other HLA genes (Fig. 2 h). The genes upregulated by A11 were involved in GTPase activity (Padj = 2.5 × 10⁻⁹), suggesting that A11 treatment could affect inflammation-induced changes in microglial adhesion and motility (Socodato et al., 2020).
Investigating the mechanism of action of A11
To understand the molecular mechanism underlying the effects of A11, we directly investigated its effect on transcription factor binding to the PU.1 motif using two different assays. First, the electrophoretic mobility shift assay (EMSA), which detects protein binding to a biotinylated DNA probe with a PU.1 motif on a native polyacrylamide gel based on slower migration of the protein-bound relative to the unbound probe, and second, biotin pulldown of probe-bound proteins, which allows protein detection by Western blotting (Fig. S3 and SourceData FS3). In EMSA experiments, co-incubation of nuclear lysates from iMGLs with either a single λB DNA PU.1 motif probe (1XλB), a tandem probe (2XλB), or an PU.1-IRF motif probe (“ETS-IRF”; Eisenbeis et al., 1993) resulted in a mobility shift of the probes toward larger molecular size (see “Probe shift” lane of Fig. 3 a and SourceData F3 a). The shift only occurred with nuclear lysates from iMGLs and not from other cell types, suggesting the involvement of PU.1 binding to the λB probe (Fig. S3 a and SourceData FS3 b), confirmed by Western blot after probe pulldown (Fig. S3, b and c; and SourceData FS3 c) and by a supershift seen for the PU.1 motif probes in the presence of an anti-PU.1 antibody (Fig. S3, d and e; and SourceData FS3 d). Recombinant PU.1 alone did not bind the λB probe (Fig. S3 c and SourceData FS3 e), which requires posttranslational modifications of PU.1 (Eisenbeis et al., 1993). Adding A11 to the binding reactions prevented the appearance of a mobility shift for the PU.1 motif probes in a concentration-dependent manner, without affecting the EBNA probe which lacks the PU.1 motif (lanes 5–14; Fig. 3, a and b), and diminished the PU.1 signal detected after staining for PU.1 (see “Non-denatured sample”; Fig. 3, c and d; and SourceData F3 f). The total amount of PU.1 protein in the presence of A11 was unchanged, as seen after SDS-denaturing the EMSA sample before gel loading, followed by Western blotting for PU.1 (see “SDS-denatured sample”; Fig. 3, c and d). These results can be interpreted in two ways: A11 either abolishes PU.1 binding to the probe or it mediates the binding of additional proteins from the lysate to the probe, causing a mobility shift so large that it prevents the probe from ever migrating into the gel. We tested whether PU.1 motif binding was reduced by measuring the amount of PU.1 and IRF8 pulled down from iMGL lysates by the biotinylated probe using streptavidin beads. A11 did not affect the amounts of PU.1 (P = 0.2249) or IRF8 (P = 0.9100) protein bound to the probe (compare lanes 4 and 5; Fig. 3 e and SourceData F3 g). We then tested whether A11 recruits additional proteins by Western blotting the pulldown samples for a number of PU.1-binding partners (Takahashi, 2011; Fig. 3 e). Pulldown of NONO (Hallier et al., 1996) was reduced by ∼31% after A11 treatment (P = 0.0368), while the pulldown of MECP2 (Gregoricchio et al., 2022; Hallier et al., 1996) was increased by ∼150% (P = 0.0050). We also saw an ∼266% increase in HDAC1 (P = 0.0012), an ∼267% increase in SIN3A (P = 0.0171) and an ∼124% increase in DNMT3A (P = 0.0358) pulldown. The proteins MECP2, HDAC1, SIN3A, and DNMT3A that were increased after A11 treatment belong to transcriptional co-repressor complexes known to interact with PU.1 (Gregoricchio et al., 2022; Hallier et al., 1996). We sought to confirm the effect of A11 by investigating the proteins bound to a small subset of PU.1 target genes in ChIP-qPCR experiments. We first probed for MECP2, a well-known repressor of gene expression with a wide range of binding partners (Gulmez Karaca et al., 2019). A11 treatment (20 nM for 2 d, in iMGLs) increased the presence of MECP2 protein at IL1B (primer pair 1: P = 0.0425, and primer pair 2: P = 0.0399), CD14 (P = 0.0489), CCL2 (P = 0.043), CD300E (primer pair 1: P = 0.0001, and primer pair 2: P = 0.0425), and SCHBP1 (primer pair 1: P = 0.0335, and primer pair 2: P = 0.0151; Fig. 3 f). This finding supports our suggested mechanism by which A11 reduces PU.1-dependent expression by enabling MECP2-dependent repression at PU.1 motifs. We repeated the ChIP-qPCR experiments with an HDAC1 antibody and found an increased presence of HDAC1 protein at many of the same genes, CD14 (P = 0.0506), CD300E (primer pair 1: P = 0.0351, primer pair 2: P = 0.0446), and SCHBP1 (primer pair 1: P = 0.0139, primer pair 2: P = 0.0296; Fig. 3 f).
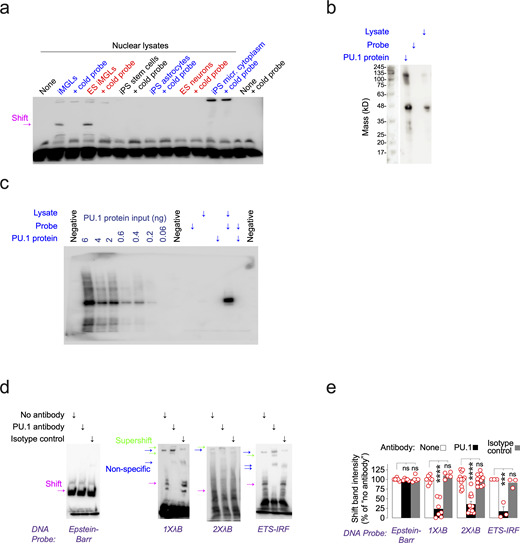
DNA-binding control experiments. (a) Lysates from different iPSC-derived cell types were compared on the basis of whether they could generate a shift in the EMSA. The results in this panel were repeated in two separate batches of experiments. (b) PU.1 Western blot on recombinant PU.1 protein, λB DNA probe and iMGL lysate added alone. The results in this panel were repeated in two separate batches of experiments. (c) Lanes 2–7 show the dilution of recombinant PU.1 protein loaded onto the gel, and lanes 10–14 show under what conditions the pulldown of PU.1 with the λB probe was possible. (d) EMSA experiments with the addition of PU.1 antibody, added to generate supershifts (indicated with green arrows) in instances where the shift (indicated with magenta arrows) involved PU.1 protein. Non-specific bands are indicated with blue arrows and are defined as being present in the “No antibody” and/or “Isotype control” condition. The results in this panel were repeated in three separate batches of experiments. Shifts are quantified in panel e. ANOVA, Dunnett’s post hoc test versus no antibody condition, two-sided t test; ****P ≤ 0.0001, ***P ≤ 0.001. For the Epstein-Barr probe, n = 6 (no antibody), n = 5 (PU.1 antibody), n = 5 (IgG control). For the 1XλB probe, n = 7 (no antibody), n = 7 (PU.1 antibody), n = 5 (IgG control). For the 2XλB probe, n = 14 (no antibody), n = 12 (PU.1 antibody), n = 11 (IgG control). For the ETS-IRF probe, n = 3 (no antibody), n = 3 (PU.1 antibody), n = 3 (IgG control). Bars are mean ± SEM; each data point represents a well. Source data are available for this figure: SourceData FS3.
DNA-binding control experiments. (a) Lysates from different iPSC-derived cell types were compared on the basis of whether they could generate a shift in the EMSA. The results in this panel were repeated in two separate batches of experiments. (b) PU.1 Western blot on recombinant PU.1 protein, λB DNA probe and iMGL lysate added alone. The results in this panel were repeated in two separate batches of experiments. (c) Lanes 2–7 show the dilution of recombinant PU.1 protein loaded onto the gel, and lanes 10–14 show under what conditions the pulldown of PU.1 with the λB probe was possible. (d) EMSA experiments with the addition of PU.1 antibody, added to generate supershifts (indicated with green arrows) in instances where the shift (indicated with magenta arrows) involved PU.1 protein. Non-specific bands are indicated with blue arrows and are defined as being present in the “No antibody” and/or “Isotype control” condition. The results in this panel were repeated in three separate batches of experiments. Shifts are quantified in panel e. ANOVA, Dunnett’s post hoc test versus no antibody condition, two-sided t test; ****P ≤ 0.0001, ***P ≤ 0.001. For the Epstein-Barr probe, n = 6 (no antibody), n = 5 (PU.1 antibody), n = 5 (IgG control). For the 1XλB probe, n = 7 (no antibody), n = 7 (PU.1 antibody), n = 5 (IgG control). For the 2XλB probe, n = 14 (no antibody), n = 12 (PU.1 antibody), n = 11 (IgG control). For the ETS-IRF probe, n = 3 (no antibody), n = 3 (PU.1 antibody), n = 3 (IgG control). Bars are mean ± SEM; each data point represents a well. Source data are available for this figure: SourceData FS3.
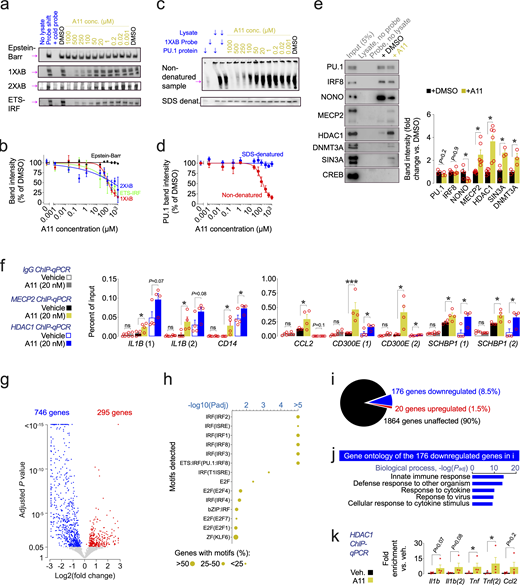
Mechanism of action of A11. (a) EMSA using 20 fmol of biotinylated DNA probes, or 4 pmol non-biotinylated “cold” probes as negative control. The “Probe shift” condition of lane 2 represents the presence of lysate and biotinylated probe, whereas lane 1 lacks the lysate and lane 3 has a cold probe added in excess. Lanes 4–15 are identical to probe shift but with either DMSO or different concentrations of A11 added. Probes contained no PU.1 motif (Epstein-Barr), a single PU.1 motif (λB; sequence shown in Fig. 1 d), a double PU.1 motif (2XλB), or a previously published ETS-IRF motif (Eisenbeis et al., 1993). EMSA was repeated in four separate batches of experiments. (b) Quantification of band intensity versus DMSO, fitted to Hill’s equation. (c) Shift-western: EMSA Western blots were generated under native or SDS-denatured conditions and stained with a PU.1 antibody. Lane 1 shows only 0.5 ng of recombinant PU.1 protein. Lane 2 shows only probe. Lane 3 shows lysate and PU.1 protein. Lane 4 shows lysate and probe added. Lanes 5–15 are identical to lane 4 but with either DMSO or A11 added at different concentrations. Results in this panel were repeated in three separate batches of experiments. (d) Quantification of band intensity versus DMSO (indicated by magenta arrow for non-denatured sample), fitted to Hill’s equation. (e) Pulldown of the biotinylated λB motif using streptavidin beads, followed by SDS-denaturing before gel loading and then Western blotting with antibodies for various binding partners of PU.1. Lane 1 sample contains 5% input (iMGL lysate) only. Lane 2 sample contains iMGL lysate without biotinylated probe. Lane 3 contains biotinylated probe but no lysate. Lanes 4 and 5 contain biotinylated probe and iMGL lysates, in addition to DMSO and 500 µM A11. Band intensity quantification to the right, with DMSO set as 1. Student’s unpaired, two-sided t test. Bars are mean ± SEM; each data point represents a well. Results in this panel were repeated in three separate batches of experiments. (f) ChIP using a MECP2 antibody and HDAC1 antibody, followed by qPCR for several PU.1 target genes. (1) and (2) after the gene name denotes that two separate primer pairs used. Student’s unpaired, two-sided t test; ***P ≤ 0.001, *P ≤ 0.05, n = 4 for all conditions. Bars are mean ± SEM; each data point represents a well. (g) Volcano plot of DEGs (Padj ≤ 0.05; calculated with apeglm (bulk RNA sequencing) of mouse microglia isolated by FACS from mice treated with A11 (0.3 mg/kg intraperitoneally, every day, for 2 wk) compared to treatment with vehicle (1% DMSO in DPBS). (h) Motif analysis of the DEGs in g using HOMER software ± 2,000 bp from the transcription start site. Padj represents Benjamini corrected q-values. (i) Effect of A11 on the 2060 PU.1 target genes upregulated in CK-p25 mice (from Fig. 1 b). (j) Gene ontology analysis of the downregulated genes from panel i with (Padj ≤ 0.05, −1 > log2(fold change) > 1) using Toppgene, accessed March 4, 2023. Padj represents Bonferroni corrected P values. (k) ChIP using a HDAC1 antibody, followed by qPCR for several PU.1 target genes. (1) and (2) after the gene name denotes that two separate primer pairs are used. Student’s unpaired, two-sided t test; *P ≤ 0.05, n = 4 for all conditions. Bars are mean ± SEM; each data point represents a well. Source data are available for this figure: SourceData F3.
Mechanism of action of A11. (a) EMSA using 20 fmol of biotinylated DNA probes, or 4 pmol non-biotinylated “cold” probes as negative control. The “Probe shift” condition of lane 2 represents the presence of lysate and biotinylated probe, whereas lane 1 lacks the lysate and lane 3 has a cold probe added in excess. Lanes 4–15 are identical to probe shift but with either DMSO or different concentrations of A11 added. Probes contained no PU.1 motif (Epstein-Barr), a single PU.1 motif (λB; sequence shown in Fig. 1 d), a double PU.1 motif (2XλB), or a previously published ETS-IRF motif (Eisenbeis et al., 1993). EMSA was repeated in four separate batches of experiments. (b) Quantification of band intensity versus DMSO, fitted to Hill’s equation. (c) Shift-western: EMSA Western blots were generated under native or SDS-denatured conditions and stained with a PU.1 antibody. Lane 1 shows only 0.5 ng of recombinant PU.1 protein. Lane 2 shows only probe. Lane 3 shows lysate and PU.1 protein. Lane 4 shows lysate and probe added. Lanes 5–15 are identical to lane 4 but with either DMSO or A11 added at different concentrations. Results in this panel were repeated in three separate batches of experiments. (d) Quantification of band intensity versus DMSO (indicated by magenta arrow for non-denatured sample), fitted to Hill’s equation. (e) Pulldown of the biotinylated λB motif using streptavidin beads, followed by SDS-denaturing before gel loading and then Western blotting with antibodies for various binding partners of PU.1. Lane 1 sample contains 5% input (iMGL lysate) only. Lane 2 sample contains iMGL lysate without biotinylated probe. Lane 3 contains biotinylated probe but no lysate. Lanes 4 and 5 contain biotinylated probe and iMGL lysates, in addition to DMSO and 500 µM A11. Band intensity quantification to the right, with DMSO set as 1. Student’s unpaired, two-sided t test. Bars are mean ± SEM; each data point represents a well. Results in this panel were repeated in three separate batches of experiments. (f) ChIP using a MECP2 antibody and HDAC1 antibody, followed by qPCR for several PU.1 target genes. (1) and (2) after the gene name denotes that two separate primer pairs used. Student’s unpaired, two-sided t test; ***P ≤ 0.001, *P ≤ 0.05, n = 4 for all conditions. Bars are mean ± SEM; each data point represents a well. (g) Volcano plot of DEGs (Padj ≤ 0.05; calculated with apeglm (bulk RNA sequencing) of mouse microglia isolated by FACS from mice treated with A11 (0.3 mg/kg intraperitoneally, every day, for 2 wk) compared to treatment with vehicle (1% DMSO in DPBS). (h) Motif analysis of the DEGs in g using HOMER software ± 2,000 bp from the transcription start site. Padj represents Benjamini corrected q-values. (i) Effect of A11 on the 2060 PU.1 target genes upregulated in CK-p25 mice (from Fig. 1 b). (j) Gene ontology analysis of the downregulated genes from panel i with (Padj ≤ 0.05, −1 > log2(fold change) > 1) using Toppgene, accessed March 4, 2023. Padj represents Bonferroni corrected P values. (k) ChIP using a HDAC1 antibody, followed by qPCR for several PU.1 target genes. (1) and (2) after the gene name denotes that two separate primer pairs are used. Student’s unpaired, two-sided t test; *P ≤ 0.05, n = 4 for all conditions. Bars are mean ± SEM; each data point represents a well. Source data are available for this figure: SourceData F3.
We investigated the targeting of PU.1 by A11 in vivo by simultaneously inducing p25 and injecting female CKp25 mice intraperitoneally with 0.3 mg/kg of A11, daily, for 2 wk. The whole brain of the mice was then dissected, enzymatically dissociated, and purified for microglia with FACS using an antibody for the microglial marker CD11b. The FACS analysis revealed a significant (P = 0.0459; data not shown) reduction of the microglia population from 2.6 ± 0.42% to 1.8 ± 0.46% after A11 treatment, indicating a reduced microglial density. We bulk RNA sequenced the microglia and identified 746 downregulated and 295 upregulated genes by A11 treatment (Fig. 3 g and Data S3). These genes were enriched for IRF (0.00009 ≤ Padj ≤ 0.0375) as well as PU.1 (Padj < 0.0001; Fig. 3 h) motifs. We then investigated the degree to which A11 reversed the upregulation of PU.1 target genes that we previously observed in CK-p25 mice (see Fig. 1 b). Of the 2,060 upregulated PU.1 target genes, A11 reduced the expression of 8.5% of the genes. In comparison, only 1.5% were further upregulated, suggesting that A11 predominantly ameliorates the activation of PU.1 target genes in CK-p25 mice (Fig. 3 i). Gene ontology analysis of the downregulated genes revealed pathways of innate immune responses and (Padj = 1.6 × 10⁻¹⁴) and response to cytokines (Padj = 1.3 × 10⁻¹⁰; Fig. 3 j). To address the involvement of an HDAC1-containing complex in inhibiting inflammation, we performed ChIP-qPCR using an HDAC1 antibody on whole brain homogenate from the injected CK-p25 mice. We found strong trends or significant increases in HDAC1 signal for the PU.1 target genes Il1b (P ≤ 0.08), Tnf (P ≤ 0.04), and Ccl2 (P < 0.2; Fig. 3 k).
A11 reduces neuropathology and improves cognitive performance in transgenic mice modeling the AD hallmarks of β-amyloid deposition, tauopathy, and neurodegeneration
In mice, microglial Mecp2 inhibits inflammation in part through the TNFα pathway and is critical for survival in a model of Rett syndrome (Cronk et al., 2015; Derecki et al., 2012). We sought to assess the therapeutic potential of A11 in various mouse strains modeling different hallmarks of AD pathology. We first assessed A11’s pharmacokinetic properties by investigating its metabolic stability in hepatocytes from mice, rats, dogs, cynomolgus monkeys, and humans (Martignoni et al., 2006). Across species, A11 exhibited high intrinsic clearance (CLint; e.g., human CLint = 44.5 ml/min/kg; Fig. S4 a). To assess absorption and potential for brain penetration, we measured the permeability of A11 across monolayers of Madin-Darby canine kidney (MDCK) cells, either wild-type or expressing MDR1, which encodes the P-glycoprotein transporter (Horio et al., 1989). A11 exhibited permeability (Papp = 34.4 × 10⁻⁶/cm × s−1) comparable with the highly permeable compound metoprolol (Papp = 35.7 × 10⁻⁶/cm × s−1; Fig. S4 b) and was not effluxed by the P-glycoprotein transporter (Fig. S4 c). Additionally, A11 scores 4.8 out of 6 on the central nervous system multiparameter optimization (CNS MPO; Wager et al., 2016) desirability index, indicating favorable structural properties for CNS drug development (Fig. S4 d). These data suggest that A11 should have promising distribution in the brain while being cleared rapidly from plasma. We directly assessed the in vivo distribution of A11 following a single systemic injection of A11 (0.3 mg/kg, intraperitoneally) in male C57BL/6J wild-type mice, followed by collection and high-performance liquid chromatography–mass spectrometry analysis of plasma, peripheral fat, and cerebral cortex at multiple time points after injection (Fig. 4 a). Strikingly, A11 was barely detected in plasma, and while present at similar peak concentrations in peripheral fat and brain (cmax = 131 and 103 nM, respectively), A11 was eliminated three times faster from peripheral fat compared with the brain (t1/2 = 1.1 and 3.7 h, respectively; Fig. 4 a). Thus, A11 readily crosses the blood–brain barrier and is rapidly eliminated from blood and peripheral fat, concentrating its exposure to brain-resident cells.

Physiochemical properties of A11. (a) Hepatocytes from different species (mouse, rat, dog, cynomolgus monkey, and human) were incubated with A11 and compared with verapamil, the slowly metabolized diclofenac and the rapidly metabolized testosterone, for 120 min. Results in this panel were repeated in two separate batches of experiments. (b) MDCK cells were used to assess the permeability of A11 with metoprolol as a highly permeable control, atenolol as lowly permeable control, and quinidine as a P-gp transporter effluxed control. All compounds were added at 5 µM for 90 min at 37°C. Papp = 100 × (VA/(area × time) × ([drug]acceptor/[drug]initial, donor) × dilution factor), where VA is the volume of the acceptor well, area is the surface area of the membrane and time is total transport time in seconds. Recovery (%) = 100 × ([total drug]donor,90min × dilution factor + [total drug]receiver,90min)/([total drug]donor,0min × dilution factor). Transepithelial/transendothelial electrical resistance value of wild-type MDCK monolayers from randomly selected wells was 1,654 ± 35 Ω × cm2 (mean ± SD). Results in this panel were repeated in two separate batches of experiments. (c) Same as in panel b but using MDR1 cells that express the P-gp transporter on the basolateral (B) side. Transepithelial/transendothelial electrical resistance value of MDR1-MDCK monolayers from randomly selected wells was 453 ± 18 Ω × cm2 (mean ± SD). Experiments were performed in duplicates. (d) CNS MPO characteristics of A11 calculated with Chemdraw (PerkinElmer). Results in this panel were repeated in two separate batches of experiments.
Physiochemical properties of A11. (a) Hepatocytes from different species (mouse, rat, dog, cynomolgus monkey, and human) were incubated with A11 and compared with verapamil, the slowly metabolized diclofenac and the rapidly metabolized testosterone, for 120 min. Results in this panel were repeated in two separate batches of experiments. (b) MDCK cells were used to assess the permeability of A11 with metoprolol as a highly permeable control, atenolol as lowly permeable control, and quinidine as a P-gp transporter effluxed control. All compounds were added at 5 µM for 90 min at 37°C. Papp = 100 × (VA/(area × time) × ([drug]acceptor/[drug]initial, donor) × dilution factor), where VA is the volume of the acceptor well, area is the surface area of the membrane and time is total transport time in seconds. Recovery (%) = 100 × ([total drug]donor,90min × dilution factor + [total drug]receiver,90min)/([total drug]donor,0min × dilution factor). Transepithelial/transendothelial electrical resistance value of wild-type MDCK monolayers from randomly selected wells was 1,654 ± 35 Ω × cm2 (mean ± SD). Results in this panel were repeated in two separate batches of experiments. (c) Same as in panel b but using MDR1 cells that express the P-gp transporter on the basolateral (B) side. Transepithelial/transendothelial electrical resistance value of MDR1-MDCK monolayers from randomly selected wells was 453 ± 18 Ω × cm2 (mean ± SD). Experiments were performed in duplicates. (d) CNS MPO characteristics of A11 calculated with Chemdraw (PerkinElmer). Results in this panel were repeated in two separate batches of experiments.

Effect of A11 in mouse models of AD-related neurodegeneration, tauopathy, and β-amyloid deposition. (a) Pharmacokinetic analysis: Wild-type mice had their blood plasma, brain (cerebral cortex), and peripheral ingual fat collected at various timepoints after injection of 0.3 mg/kg of A11. HPLC results were fitted to a log-normal distribution with half-life (t1/2) and maximal concentration (cmax) calculated with the equation: Y = (A/x)*e^(−0.5*(ln(x/GeoMean)/ln(GeoSD))^2), where x represents a time point after injection in hours. For brain, blood, and fat, A = 282.7, 9.8, and 118.1, respectively; GeoMean = 4.4, 0.7, and 2, respectively; and GeoSD = 2.6, 1.3, and 3.5, respectively. Data points represent mean ± SEM. The pharmacokinetic results were repeated in four separate batches of experiments. (b–d) CK-p25 mice induced for 2 wk were injected daily with 0.3 mg/kg A11, intraperitoneally. Confocal micrographs of the dentate gyrus of the hippocampus and signal quantification after staining for panel b microglial inflammation markers PU.1, IBA1, or C1q; (c) astroglial GFAP; and (d) neuronal Tubulin β3 (in the CA1 region), and NeuN and GFP nuclei (in the granule layer). C1q images were converted to 8-bit and colorized with the ImageJ Lookup table Fire. Nuclei were counterstained with Hoechst. Quantification shows dose-response in CK-p25 mice (blue circles) injected with either vehicle or 0.1, 0.3, or 1 mg/kg A11 (n = 4, 4, 5, 4, respectively) and in CK mice (open black circles; n = 4, 3, 4, 4, respectively). ANOVA, Dunnett’s post hoc against vehicle (“0 mg/kg”) treatment. ***P ≤ 0.001, **P ≤ 0.01, *P ≤ 0.05. Scale bar, 50 µm. Results in this panel were repeated in two separate batches of experiments. (e and f) Quantification of the markers as described in panel c for 6 wk induced CK-p25 mice, and (f) 1-yr-old P301STau mice, respectively. Student’s unpaired, two-sided t test; **P ≤ 0.01, *P ≤ 0.05, n = 8 for CK-p25 mice treated with either vehicle or A11, and n = 7 and 10 for P301STau mice treated with vehicle and A11, respectively. Bars are mean ± SEM; each data point represents a mouse. Scale bar, 50 µm. Results in this panel were repeated in two separate batches of experiments. (g) Confocal micrographs of the hippocampus of 1-yr-old P301STau mice stained for tau hyperphosphorylation with two different antibodies (the AT8 and Ser404 antibodies, left and right panel, respectively), with quantification below. Statistical test and n’s as in panel f. Scale bar, 50 µm. Results in this panel were repeated in two separate batches of experiments. (h) Confocal micrograph of the hippocampus of 1-yr-old 5XFAD mice stained for β-amyloid (using the D54D2 antibody) and microglial cell body, with quantification below, statistical test as in panel f, n = 4 for vehicle and A11-treated mice. Scale bar, 50 µm. Results in this panel were repeated in two separate batches of experiments. (i and j) Mice were injected daily, intraperitoneally, with vehicle (white and gray bars, respectively) or A11, 0.3 mg/kg (black and yellow bars, respectively) for 6 wk, showing CK-p25 mice in panel i and P301STau mice in panel j. n for (genotype, treatment) = 7 (CK, vehicle), 5 (CK, A11), 8 (CK-p25, vehicle), 8 (CK-p25, A11), and 9 (wild-type, vehicle), 9 (wild-type, A11), 8 (P301STau, vehicle), and 8 (P301STau, A11), respectively. Bar plots show from left to right: novel arm preference in the Y maze per 10-min trial, time-course of average latency in the Morris water maze required to locate a submerged platform (mean of three 1-min trials) over several consecutive days, quantification of percent improvement in the Morris water maze from first to last day. In every graph, Student’s unpaired, two-sided t test was performed between vehicle and A11 treatment; bars represent mean ± SEM, and each data point represents a mouse. ***P ≤ 0.001, **P ≤ 0.01, *P ≤ 0.05. Results in this panel were repeated in two separate batches of experiments.
Effect of A11 in mouse models of AD-related neurodegeneration, tauopathy, and β-amyloid deposition. (a) Pharmacokinetic analysis: Wild-type mice had their blood plasma, brain (cerebral cortex), and peripheral ingual fat collected at various timepoints after injection of 0.3 mg/kg of A11. HPLC results were fitted to a log-normal distribution with half-life (t1/2) and maximal concentration (cmax) calculated with the equation: Y = (A/x)*e^(−0.5*(ln(x/GeoMean)/ln(GeoSD))^2), where x represents a time point after injection in hours. For brain, blood, and fat, A = 282.7, 9.8, and 118.1, respectively; GeoMean = 4.4, 0.7, and 2, respectively; and GeoSD = 2.6, 1.3, and 3.5, respectively. Data points represent mean ± SEM. The pharmacokinetic results were repeated in four separate batches of experiments. (b–d) CK-p25 mice induced for 2 wk were injected daily with 0.3 mg/kg A11, intraperitoneally. Confocal micrographs of the dentate gyrus of the hippocampus and signal quantification after staining for panel b microglial inflammation markers PU.1, IBA1, or C1q; (c) astroglial GFAP; and (d) neuronal Tubulin β3 (in the CA1 region), and NeuN and GFP nuclei (in the granule layer). C1q images were converted to 8-bit and colorized with the ImageJ Lookup table Fire. Nuclei were counterstained with Hoechst. Quantification shows dose-response in CK-p25 mice (blue circles) injected with either vehicle or 0.1, 0.3, or 1 mg/kg A11 (n = 4, 4, 5, 4, respectively) and in CK mice (open black circles; n = 4, 3, 4, 4, respectively). ANOVA, Dunnett’s post hoc against vehicle (“0 mg/kg”) treatment. ***P ≤ 0.001, **P ≤ 0.01, *P ≤ 0.05. Scale bar, 50 µm. Results in this panel were repeated in two separate batches of experiments. (e and f) Quantification of the markers as described in panel c for 6 wk induced CK-p25 mice, and (f) 1-yr-old P301STau mice, respectively. Student’s unpaired, two-sided t test; **P ≤ 0.01, *P ≤ 0.05, n = 8 for CK-p25 mice treated with either vehicle or A11, and n = 7 and 10 for P301STau mice treated with vehicle and A11, respectively. Bars are mean ± SEM; each data point represents a mouse. Scale bar, 50 µm. Results in this panel were repeated in two separate batches of experiments. (g) Confocal micrographs of the hippocampus of 1-yr-old P301STau mice stained for tau hyperphosphorylation with two different antibodies (the AT8 and Ser404 antibodies, left and right panel, respectively), with quantification below. Statistical test and n’s as in panel f. Scale bar, 50 µm. Results in this panel were repeated in two separate batches of experiments. (h) Confocal micrograph of the hippocampus of 1-yr-old 5XFAD mice stained for β-amyloid (using the D54D2 antibody) and microglial cell body, with quantification below, statistical test as in panel f, n = 4 for vehicle and A11-treated mice. Scale bar, 50 µm. Results in this panel were repeated in two separate batches of experiments. (i and j) Mice were injected daily, intraperitoneally, with vehicle (white and gray bars, respectively) or A11, 0.3 mg/kg (black and yellow bars, respectively) for 6 wk, showing CK-p25 mice in panel i and P301STau mice in panel j. n for (genotype, treatment) = 7 (CK, vehicle), 5 (CK, A11), 8 (CK-p25, vehicle), 8 (CK-p25, A11), and 9 (wild-type, vehicle), 9 (wild-type, A11), 8 (P301STau, vehicle), and 8 (P301STau, A11), respectively. Bar plots show from left to right: novel arm preference in the Y maze per 10-min trial, time-course of average latency in the Morris water maze required to locate a submerged platform (mean of three 1-min trials) over several consecutive days, quantification of percent improvement in the Morris water maze from first to last day. In every graph, Student’s unpaired, two-sided t test was performed between vehicle and A11 treatment; bars represent mean ± SEM, and each data point represents a mouse. ***P ≤ 0.001, **P ≤ 0.01, *P ≤ 0.05. Results in this panel were repeated in two separate batches of experiments.
We then tested the effect of A11 on neuropathology in three different mouse strains that model hallmarks of AD: inducible CK-p25 mouse model of neurodegeneration, which shows increased PU.1 activity, microglial activation, and neurodegeneration (Table S10); P301STau mice that carry a human Tau transgene with the P301S mutation and model the tauopathy seen in AD patients (Takeuchi et al., 2011); and 5XFAD mice, which express human APP and PSEN1 genes with a total of five different AD risk mutations and model β-amyloid deposition (Spangenberg et al., 2019). First, we evaluated the anti-neuroinflammatory and neuroprotective potential of A11 in male CK-p25 mice by simultaneously inducing p25 expression and injecting 0.1, 0.3, or 1 mg/kg of A11, daily, intraperitoneally for 2 wk, followed by immunohistochemical analysis of hippocampal tissue (Fig. 4, b–d). Control male littermates (CK mice) were injected and analyzed in parallel and appeared largely unaffected, except for a reduction in PU.1 expressing cells in mice injected with 1.0 mg/kg A11 (P = 0.0158; Table S11).
A11 reduced microglial activation in the dentate gyrus of CK-p25 mice at 0.1 mg/kg, seen as a ∼47% reduction in the number of PU.1-positive nuclei (P = 0.0152) and a ∼54% reduction in IBA1-positive surface area (P = 0.0290). In addition, the area of the inflammatory marker C1q was reduced by ∼26% at 0.3 mg/kg A11 (P = 0.0152; Fig. 4 b). A11 also ameliorated astrogliosis at 0.1 mg/kg A11, seen as a ∼46% reduction in GFAP-positive area (P = 0.0400; Fig. 4 c). Compared with vehicle-treated mice, there was ∼29% more intact GFP-positive p25-expressing neurons remaining in the granule layer after the 0.3 mg/kg A11-treatment (P = 0.0140) as well as ∼2.2-fold more tubulin β3 immunoreactivity in the pyramidal layer (P = 0.0038; Fig. 4 d). Given that A11 injected daily at 0.3 mg/kg showed robust effects in the CK-p25 mice without side effects in CK mice, we chose this dose, frequency, and administration route for all subsequent experiments. 6 wk of p25 induction causes extensive neuronal loss and memory impairment in CK-p25 mice and models later-stage neurodegenerative pathology (Fischer et al., 2005; Mathys et al., 2017). When simultaneously injecting female CK-p25 mice with A11 for 6wk, we again saw a reduction in the number of PU.1 positive nuclei by ∼25% (P = 0.0449), in IBA1 immunoreactivity by ∼28% (P = 0.0503), in C1q-positive area by ∼15% (P = 0.0534), and in GFAP-positive area by ∼25% (P = 0.0213). Neuronal structures were also preserved, as seen by an ∼1.9-fold increase of pyramidal layer tubulin β3 staining (P = 0.0440) and a ∼1.4-fold increase in intact GFP-positive cells in the granule layer (P = 0.0288; Fig. 4 e; for effect in CK mice, see Table S12). Daily A11 treatment (0.3 mg/kg, intraperitoneally) for 6 wk of 1-yr-old male P301STau mice had similar anti-inflammatory effects—reduction in the number of PU.1-positive nuclei by ∼61% (P = 0.0874), in IBA1-positive area by ∼58% (P = 0.0132), in C1q-positive area by ∼70% (P = 0.0038), in GFAP-positive area by ∼73% (P = 0.0104), and increased tubulin β3–positive area by ∼42% (P = 0.0089; Fig. 4 f; for effect in wild-type littermates, see Table S13). The P301STau mice also exhibited a reduction in phosphorylated tau of ∼56% (P = 0.0045) as measured with the AT8 antibody and ∼37% (P = 0.0138) as measured with the Ser404 antibody after A11 treatment (Fig. 4 g; for effect in littermates, see Table S13). Then, we injected A11 (0.3 mg/kg, intraperitoneally) daily for 6 wk into 1-yr-old male 5XFAD mice that exhibit extensive whole-brain β-amyloid plaque burden. A11 treatment caused a reduction in both hippocampal β-amyloid accumulation by ∼37% (P = 0.0356) and colocalization of amyloid with microglia by ∼61% (P = 0.0424; Fig. 4 h). Our results are in line with studies showing that reduced microglial colocalization with β-amyloid is associated with a reduced β-amyloid burden (D’Errico et al., 2022; Spangenberg et al., 2019).
6-wk-induced CK-p25 mice and 1-yr-old P301STau mice exhibit impairment in working and spatial memory performance (Cruz et al., 2003; Takeuchi et al., 2011). We, therefore, used these mice to investigate whether the effects of A11 treatment (for 6 wk, as in Fig. 4 e) translate into improvement in cognitive performance. Bodyweight (P ≥ 0.5546), walk speed (P ≥ 0.3215), and swim performance (P ≥ 0.2348) were not affected (Table S14). On the other hand, A11 treatment improved performance of CK-p25 mice in the Y maze (Cruz et al., 2003; Fischer et al., 2005), increasing the novel arm preference above chance from −4.1 ± 9.4% in vehicle-injected mice to 18.7 ± 11.7% to in A11-injected mice (P = 0.0007; left panel of Fig. 4 i). No significant effect was seen in CK littermates (vehicle: 23.4 ± 10.7% and A11: 16.3 ± 11.1% above chance, P = 0.2891). Similarly, vehicle-treated P301STau mice exhibited a 7.3 ± 8.0% novel arm preference while A11 treatment resulted in a 25.7 ± 8.9% preference (P = 0.0008), without effect in wild-type littermates (vehicle: 30.2 ± 13.6% and A11: 30.7 ± 8.3% above chance, P = 0.9; left panel of Fig. 4 j). This suggested that A11 treatment can alleviate working memory deficits in AD mouse models without observable side effects. We then investigated spatial memory performance with the Morris Water Maze (Fischer et al., 2005; Takeuchi et al., 2011) in which the mice are exposed to repeated swim trials where they have to locate a submerged platform using fixed spatial cues in the experimental room. During the initial trial days, A11-treated CK-p25 mice appeared to perform similarly to the CK littermates, requiring fewer seconds to locate the submerged platform on each consecutive trial day, while vehicle-treated CK-p25 mice showed impairment (middle panel of Fig. 4 i). Performance on the final trial day, quantified as percent improvement versus the first trial day, showed a 67.4 ± 30.1% reduction in A11-treated CK-p25 mice compared with a 3.5 ± 18.3% reduction in vehicle-treated CK-p25 mice in time required to find the submerged platform, indicating that A11 treatment significantly improved spatial memory retention (P = 0.0002; right panel of Fig. 4 i). No adverse effects of A11 treatment were seen in CK littermates (vehicle: 79.4 ± 27.9% versus A11: 66.7 ± 29%; P = 0.4363; middle and right panel of Fig. 4 i). A11-treated P301STau mice also showed a significant improvement in spatial memory retention by 58.9 ± 31.0% compared with the first trial day, while vehicle-treated mice only improved by 20.6 ± 25.0% (P = 0.0168; middle and right panel of Fig. 4 j). Wild-type littermates were not affected (vehicle: 76.4 ± 16.6% versus A11: 78.2 ± 9.3%, P = 0.7827; middle and right panel of Fig. 4 j).
Since PU.1 activity is required for myeloid hematopoiesis (Iwasaki et al., 2005), we investigated the effects of A11 treatment in this process. Flow cytometry experiments showed that hematopoietic stem cell expression of CD43 (P > 0.1141), CD11b (P > 0.1868), and proliferation (P > 0.4836) were unaffected at various points throughout maturation by up to 5 d of A11 exposure (Fig. S5, a–c). We also investigated blood cells from wild-type male mice injected with A11 for 6 wk (as in Fig. 4 e), finding no change in the ratio of circulating CD45 (P = 0.6203), CD4 (P = 0.7111), or CD8-positive cells (P = 0.3722) and no abnormalities in liver or spleen histology (Fig. S5, d and e). Additionally, up to 1 µM A11 (equivalent to 500 times the cellular potency in the BV2 PU.1 luciferase assay) had no effect on the proliferation or viability of human iPSC–derived hematopoietic stem cells or in human erythroid or bone marrow-derived progenitors (EC50 > 1 µM; Fig. S5, f and g). Taken together, these findings show that A11 preferentially distributes to the brain following systemic injection and that its administration reduces neuropathology, including tau pathology and β-amyloid accumulation, and increases cognitive performance in several different mouse models of AD without observable side effects.

Assessment of human iPSC-derived hematopoietic stem cells and iMGLs, hematological side effects of A11 in C57BL/6J mice, human hematopoietic stem cells (line AG09173) and in human bone marrow–derived cells. (a) Differentiation protocol for the generation of iMGLs out of hematopoietic stem cells derived from human stem cells. (b) Flow cytometry experiments. The top panel shows results for CD43, and the bottom panel shows results for the CD11b signal. The left panel shows time course for untreated hematopoietic stem cells, y axis is in log scale, n = 418 and 630 per day in culture for CD43 and CD11b, respectively. The middle panel shows the CD43 signal in the vehicle (black bars) and A11-treated (2 d, 20 nM; yellow bars) hematopoietic stem cells. Y axis is in linear scale. Student’s unpaired, two-sided t test; n = 3 for all conditions (except, n = 5 for CD43 at day 35). Bars are mean ± SEM; each data point represents a well. The far-right panel shows the effect of a 5-d incubation with A11, starting on the 21st day in culture. Results in this panel were repeated in two separate batches of experiments. (c) The left panel shows the time course for untreated hematopoietic stem cells; y axis is in log scale; n = 1,000 per day in culture. The right panel shows EdU signal in vehicle (black bars) and A11-treated (2 d, 20 nM; yellow bars) hematopoietic stem cells, with EdU and either A11 or vehicle added on day 11 in culture. Y axis is in linear scale. Student’s unpaired, two-sided t test; n = 3, 4, 3 for days 13, 18, and 20 in culture, respectively. Bars are mean ± SEM; each data point represents a well. Results in this panel were repeated in two separate batches of experiments. (d) Flow cytometry on blood obtained by decapitation from C57BL/6J mice injected for 6 wk with either vehicle or A11, using the markers CD45, CD4, and CD8. Student’s unpaired, two-sided t test; n = 4 for vehicle (black bars) and n = 5 for A11 (yellow bars). Bars are mean ± SEM; each data point represents a mouse. Results in this panel were repeated in two separate batches of experiments. (e) 40 µm sections of liver and spleen from the mice in panel d, stained with hematoxylin and eosin. Scale bar, 50 µm. (f) A11 was incubated at concentrations between 20 nM and 1 µM in five 1:2 dilution steps in stem cell derived hematopoietic stem cells (bottom panel; n = 12, 7, 14 per bar for 1, 4 and 6-d incubation, respectively). Red bar color would indicate P ≤ 0.05, ANOVA followed by Dunnett’s post hoc test versus vehicle, no red bars are present due to lack of significant effect. Bars are mean ± SEM. Results in this panel were repeated in two separate batches of experiments. (g) CFUs of human bone marrow–derived erythroid cells (left panel) and granulocytes and macrophages right (panel). Curves were fitted with Hill’s equation. Results in this panel were repeated in two separate batches of experiments.
Assessment of human iPSC-derived hematopoietic stem cells and iMGLs, hematological side effects of A11 in C57BL/6J mice, human hematopoietic stem cells (line AG09173) and in human bone marrow–derived cells. (a) Differentiation protocol for the generation of iMGLs out of hematopoietic stem cells derived from human stem cells. (b) Flow cytometry experiments. The top panel shows results for CD43, and the bottom panel shows results for the CD11b signal. The left panel shows time course for untreated hematopoietic stem cells, y axis is in log scale, n = 418 and 630 per day in culture for CD43 and CD11b, respectively. The middle panel shows the CD43 signal in the vehicle (black bars) and A11-treated (2 d, 20 nM; yellow bars) hematopoietic stem cells. Y axis is in linear scale. Student’s unpaired, two-sided t test; n = 3 for all conditions (except, n = 5 for CD43 at day 35). Bars are mean ± SEM; each data point represents a well. The far-right panel shows the effect of a 5-d incubation with A11, starting on the 21st day in culture. Results in this panel were repeated in two separate batches of experiments. (c) The left panel shows the time course for untreated hematopoietic stem cells; y axis is in log scale; n = 1,000 per day in culture. The right panel shows EdU signal in vehicle (black bars) and A11-treated (2 d, 20 nM; yellow bars) hematopoietic stem cells, with EdU and either A11 or vehicle added on day 11 in culture. Y axis is in linear scale. Student’s unpaired, two-sided t test; n = 3, 4, 3 for days 13, 18, and 20 in culture, respectively. Bars are mean ± SEM; each data point represents a well. Results in this panel were repeated in two separate batches of experiments. (d) Flow cytometry on blood obtained by decapitation from C57BL/6J mice injected for 6 wk with either vehicle or A11, using the markers CD45, CD4, and CD8. Student’s unpaired, two-sided t test; n = 4 for vehicle (black bars) and n = 5 for A11 (yellow bars). Bars are mean ± SEM; each data point represents a mouse. Results in this panel were repeated in two separate batches of experiments. (e) 40 µm sections of liver and spleen from the mice in panel d, stained with hematoxylin and eosin. Scale bar, 50 µm. (f) A11 was incubated at concentrations between 20 nM and 1 µM in five 1:2 dilution steps in stem cell derived hematopoietic stem cells (bottom panel; n = 12, 7, 14 per bar for 1, 4 and 6-d incubation, respectively). Red bar color would indicate P ≤ 0.05, ANOVA followed by Dunnett’s post hoc test versus vehicle, no red bars are present due to lack of significant effect. Bars are mean ± SEM. Results in this panel were repeated in two separate batches of experiments. (g) CFUs of human bone marrow–derived erythroid cells (left panel) and granulocytes and macrophages right (panel). Curves were fitted with Hill’s equation. Results in this panel were repeated in two separate batches of experiments.
Discussion
In addition to β-amyloid and hyperphosphorylated tau accumulation in the brain, a major hallmark of AD is that of neuroinflammation driven by activated microglia, a phenotype shared by many other forms of neurodegeneration (Gjoneska et al., 2015). Although recent results with biotherapeutics that clear brain aggregates of β-amyloid and neurofibrillary tau have shown promising results (Day et al., 2022), targeting neuroinflammation alone or in combination with β-amyloid clearance may offer an alternative treatment modality for AD. Population genetics has revealed that AD risk variants are enriched in genes that are highly expressed in microglia (Penney et al., 2020). We found that single immune cell DEGs from AD patients are enriched for PU.1 motifs and their common binding partners in their promoter region. Given that reduced PU.1 expression is protective against AD (Cao et al., 2022; Huang et al., 2017), PU.1 activity is increased in mouse models of neurodegeneration (Crotti et al., 2014; Gjoneska et al., 2015), and PU.1-binding motifs are enriched in AD risk alleles (Novikova et al., 2021), PU.1 has emerged as a promising target for drug development.
Here, we describe how published human and mouse genomic datasets can be used to identify drug development targets for AD, including the transcription factor PU.1, a master regulator of neuroinflammation and known AD-risk locus (Cao et al., 2022; Gjoneska et al., 2015; Huang et al., 2017). Molecules engaging the target were then identified using a high-throughput drug screen for inhibitors with a PU.1 activity reporter cell line. After several rounds of validation, we discovered the novel small molecule A11, a promising therapeutic that reduced inflammation, mitigated hallmarks of AD, and improved cognitive function across multiple mouse models, without affecting peripheral hematopoiesis or causing other side effects. Transcriptomic analysis and biochemical assays revealed that A11 moderated inflammatory pathways regulated by PU.1 by stimulating the recruitment of a repressive MECP2/HDAC1/SIN3A/DNMT3A complex to a subset of PU.1 motifs. Association between PU.1 and this repressive complex has previously been suggested to represent an endogenous defense mechanism in erythroid cells that restricts leukemia-associated gene expression and survival (Gregoricchio et al., 2022; Suzuki et al., 2003). A11 represents a first-in-class molecule of drugs that converts PU.1 from a transcriptional activator to a transcriptional repressor, resulting in a controlled state of microglial inflammation. Small molecules that stabilize repressive transcription factor assemblies at gene promoters offer a promising avenue for drug development (Fontaine et al., 2017; Struntz et al., 2019).
In transgenic CK-p25 and P301STau mouse models of AD-associated neurodegeneration and tauopathy, pharmacological inhibition of PU.1 with A11 reduced microgliosis, astrogliosis, and loss of neuronal integrity in the hippocampus. Chronic A11 treatment also reduced accumulation of hyperphosphorylated tau in P301STau mice and accumulation of β-amyloid in 5XFAD mice. In addition, A11 mitigated progressive deficits in working and spatial memory tasks in CK-p25 and P301STau mice. The beneficial effects of PU.1 inhibition might come from limiting tissue damage by reducing the expansion of reactive microglia. In support of this interpretation, previous studies have shown that microglial depletion can have beneficial effects in transgenic mice that model AD hallmarks, including reduction in brain accumulation of both amyloid-β and tau (Sosna et al., 2018; Spangenberg et al., 2019). Amyloid-β–associated microglia were shown to secrete extracellular vesicles that contain phosphorylated tau and their depletion abrogated tau propagation (Clayton et al., 2021). However, in the same study, an increase in plaque-associated tau in dystrophic neurites was found, indicating that microglia play a complex role in both the spread of tau and clearance of neuronal debris associated with pathological tau. Other studies using genetic ablation of microglia have found only modest effects and trends toward tau reduction (Zhu et al., 2020) or even an exacerbation of tau spread upon microglial depletion and intracerebral tau injection (Gratuze et al., 2021). These discrepancies might be explained by the tau pathology model used. In line with our findings, studies using transgenic P301STau mice report that microglial depletion reduced neurodegeneration and the accumulation of phosphorylated tau (Johnson et al., 2023; Mancuso et al., 2019; Shi et al., 2019). With regards to amyloid-β, microglial depletion has been shown to reduce plaque burden but also alter the morphology of plaques (Casali et al., 2020). Microglia have as well been suggested to deposit plaques in non-burdened brain tissue (D’Errico et al., 2022). The complex nature of microglial activation suggests that the result of microglial response to neurodegeneration may be beneficial, neutral, or detrimental depending on the type of disease and its point of progression. The beneficial effects of A11 might stem from a reduction in PU.1 activity below a threshold that otherwise causes the microglia to acquire a detrimental and hyperinflammatory phenotype (Crotti et al., 2014; Gjoneska et al., 2015) or that helps the undoing of unresolved microglial activation (Leng and Edison, 2021). While these results suggest considerable translational potential for A11, we acknowledge that these are imperfect models of AD-related neurodegeneration. Our conclusions are limited by the degree to which our mouse models can recapitulate the multifaceted disease progression observed in AD patients. The CK-p25 mouse model exhibits rapid and inducible neurodegeneration and neuroinflammation, whereas the P301STau and 5XFAD mice reproduce tau and amyloid-β accumulation, respectively. Currently, strains that exhibit all of these hallmarks at once do not exist. We also note that transgenic mice lack the genetic diversity of human AD patients and simply cannot model the many decades that span a human lifetime. Further studies in younger mice will be needed to address whether A11 can be used preventatively and offer protection later in life. Future studies should also include an investigation of PU.1 inhibitors on brain atrophy, previously reported in AD patients and tauopathy mice (Cruz et al., 2003). Definitive answers regarding the underlying beneficial effects of A11 or other inhibitors of PU.1 activity will ultimately require carefully designed clinical studies involving human AD patients in which changes in disease-relevant biomarkers are measured over time.
An important consideration of any therapeutic targeting PU.1 is the potential for alterations in hematopoiesis. Our results show that applying A11 at concentrations up to 1 µM, far above its EC50 in vitro and in vivo, to human hematopoietic stem cells and bone marrow-derived cells, had no effect on proliferation or differentiation. Mice injected with A11 daily for 6 wk also did not show any difference in circulating peripheral CD45+, CD4+, and CD8+ cells, nor any liver or spleen anomalies. This could potentially be explained by its preferential brain accumulation, absence from the blood, and rapid overall clearance from the body (half-life of <4 h). We have also not observed any changes in the expression levels of PU.1 in our transcriptomic or biochemical analyses after A11 treatment. In addition, no hematological disorders have been described in humans carrying the G allele at rs1057233 (Huang et al., 2017) which lowers PU.1 expression levels approximately two-fold in circulating monocytes and macrophages. Furthermore, we observed no side-effects in terms of behavior or brain immunohistology in mice injected with A11 intraperitoneally at 0.3 mg/kg, daily, for up to 6 wk. Nevertheless, future studies will be required, where A11, or an improved analog of A11, is administered in long-term experiments involving not only mice, but higher organisms such as rats, dogs or primates, before hematological side-effects or other side-effects pertaining to peripheral organs can be entirely excluded.
PU.1 has emerged as a promising target for drug development. Here, we identify A11, a prototypical small molecule of a novel class of anti-inflammatories that act to recruit a repressive MECP2/HDAC1-containing complex to sites of PU.1-mediated transcription. Given that A11 acts via a distinct mechanism from existing AD therapeutics, A11 could be used alone, or in combination with approved therapeutics, to provide improved treatment options for neurodegenerative diseases (Alexianu et al., 2001; Appel et al., 1994).
Materials and methods
High-throughput small molecule drug screen
The BV2 PU.1-Luciferase reporter cell line used to screen for inhibitors of PU.1 activity was created by inserting five tandem copies of the λB motif (Munde et al., 2014)—followed by a promoter and the luciferase coding sequence from the pGL4.23 luciferase plasmid (E8411; Promega) into the pROSA26-1 plasmid (21714; Addgene). The reporter construct was then transfected into BV2 cells using TransIT-2020 (MIR 5405; Mirus) and clonal stable lines were created. To modulate Sfpi1 mRNA in BV2 cells, TransIT-2020–mediated transfection was performed with either pcDNA3 Flag PU.1 (66974; Addgene) for upregulation, PU.1 shRNA plasmids (TRCN0000009497 and TRCN0000231482; Millipore) for downregulation, or scrambled control shRNA plasmid (57822; Addgene). The high-throughput small molecule screen was performed at the Institute of Chemistry and Cell Biology–Longwood Screening Facility at Harvard Medical School. 2,000 cells in 30 µl media were plated per well in white 384-well plates (3570; Corning) for luminescence and in black 384-well plates (3764; Corning) for Hoechst staining. BV2 cells were cultured in RPMI media (R7388-500ML; Millipore), 1% PenStrep (450-201-EL; Wisent), and 10% FBS (100-106; Gemini), were under constant selection with 1% G418 (10131027; Thermo Fisher Scientific), grown in CELLSTAR flasks (82050-872; VWR), and passaged with TrypLE (12605028; Thermo Fisher Scientific). Cells were plated in 384-well plates using the Multidrop Combi Reagent Dispenser (5840300; Thermo Fisher Scientific) with accessories (24072671; Thermo Fisher Scientific). The libraries screened were Selleck Bioactive Compound Library, New England Regional Center of Excellence in Biodefense and Emerging Infectious Diseases Asinex 1 and ChemDiv 6 from ChemDiv. Library molecules were transferred using a 384-pin array (custom-made; V&P Scientific) using the Epson C3-A601S robotic arm, with washes of the pin array in PBS and 100% methanol, and sonication (Sonicor, SC-50) in 20% methanol and high-pressure air drying in between compound plates. Before adding detection reagents, plates with cells were allowed to cool to room temperature for at least 1 h. Luminescence was triggered with Bright-Glo reagents (E2650; Promega; Table 1) and immediately measured using an EnVision Multilabel Plate Reader (2105-0010; PerkinElmer). Cell number was quantified as area positive for Hoechst (H3570; Thermo Fisher Scientific) signal at 497 nm, measured with Acumen (TTPLabTech, eX3/HCI), and integrated with an automated microplate loader (ORB2001; Thermo Fisher Scientific) after fixing cells with 4% formaldehyde (H121-08; Macron) containing 10 µg/ml Hoechst for 1 h at room temperature. Compound dilution series was performed with an automated liquid handler (Agilent, Bravo) with Fluotics pipette tips (AGI-250.NS). Structure–activity relationship analysis was performed using maximum common substructure analysis with the Pipeline Pilot (Dassault Systèmes) software (Englert and Kovács, 2015). Validated small molecule hits were custom-synthesized in larger quantities by Asinex, ChemDiv, VitasM, AKoS, Mcule, and ChemSpace. DB2313 was custom-synthesized by Glixx and Aobious. HEK293 CMV-Luciferase (SC002-Puro; GenTarget) cells were cultured in DMEM/F12, 15mM HEPES (11330032; Thermo Fisher Scientific), 10% FBS, 1× non-essential amino acids (NEAA; 11140050; Thermo Fisher Scientific), and 1× antibiotic–antimycotic (15240062; Thermo Fisher Scientific). Calculations of the effective AUC were performed by taking the area under the luminescence inhibition curve minus the area under the Hoechst signal curve, which gives a measure of luminescence inhibition without the possible confounding loss of luminescence caused by cell death.
Antibodies, products, and software
| Product | Source | Catalog number |
|---|---|---|
| Anti-human CD11b-APC, 1:50 | Miltenyi | 130-113-231 |
| Anti-human NeuN-Alexa488, 1:500 | Millipore | MAB377X |
| Anti-human/mouse IBA1, 1:500 | SYSY | 234004 |
| Anti-human/mouse PU.1, 1:500 | CST | 2258S |
| Anti-human PU.1, 1:500 | CST | 2266S |
| Anti-human TMEM119, 1:500 | Novus | NBP2-76985 |
| Anti-human IRF8, 1:500 | Santa Cruz | sc-365042 |
| Anti-human NONO, 1:500 | Thermo Fisher | MA3-2024 |
| Anti-human MECP2, 1:500 | CST | 3456S |
| Anti-human MECP2, 1:10, ChIP | Diagenode | C15410052 |
| Anti-human HDAC1, 1:500 | Thermo Fisher | PA1860 |
| Anti-human HDAC1, 1:10, ChIP | Abcam | Ab7028 |
| Anti-human DNMT3A, 1:500 | Novus | NB120-13888 |
| Anti-human CREB, 1:500 | CST | 48H2 |
| Anti-human MECP2, 1:10 | Diagenode | C15410052 |
| Anti-GFP, 1:1,000 | Thermo Fisher | A11122 |
| Anti-mouse NeuN, 1:500 | SYSY | 266,004 |
| Anti-mouse GFAP, 1:500 | Abcam | Ab53554 |
| Anti-mouse Vglut1, 1:500 | SYSY | 135,316 |
| Anti-mouse Tubulin β3, 1:500 | GeneTex | GT11710 |
| Anti-mouse C1q, 1:500 | Abcam | ab182451 |
| Anti-tau AT8, 1:1,000 | Thermo Fisher | MN1020 |
| Anti-tau Ser404, 1:1,000 | CST | 20194T |
| CellTiter-Glo | Promega | G7570 |
| Propidium iodide | Thermo Fisher | 50-850-556 |
| Actinomycin D | Millipore | A1410-10MG |
| 119,113 | Millipore | 119,113-5MG |
| Software | ||
| ImageJ | National Institutes of Health | https://imagej.net/Welcome |
| Prism | GraphPad | https://www.graphpad.com |
| EthoVisionXT | Noldus | https://www.noldus.com/ethovision-xt |
| Cyberduck | Open source | https://cyberduck.io/ |
RT-qPCR
mRNA was extracted using the RNeasy Plus Mini Kit (74134; Qiagen) and converted into cDNA using the EcoDry RT PreMix reagent (639542; Takara). RT reactions were added to the SsoFast EvaGreen qPCR mastermix (1725202; Bio-Rad) with primers from Integrated DNA Technologies, plated in Hard-Shell 96-well plates (Hsp9641; Bio-Rad), sealed (MSB1001; Bio-Rad), and spun in a PCR plate spinner (C1000; Labnet) followed by gene expression quantification using a qPCR detection system (CFX96; Bio-Rad) for 44 cycles. Relative gene expression changes were calculated using the 2−ΔΔCT equation and values were normalized to Actb expression levels. Primers were designed to span exon–exon junctions with PrimerBlast (Table 2).
Primers used for RT-qPCR
| RT-qPCR primers | Species | Sequence 5′→3′ |
|---|---|---|
| TREM2-F | Human | ATGATGCGGGTCTCTACCAG |
| TREM2-R | Human | GGAACCAGAGATCTCCAGCA |
| IL1B-F | Human | GCATCCAGCTACGAATCTCC |
| IL1B-R | Human | TCGTTATCCCATGTGTCGAA |
| APOE-F | Human | CGCTTTTGGGATTACCTGCG |
| APOE-R | Human | GGGGTCAGTTGTTCCTCCAG |
| β ACTIN-F | Human | GGATGCAGAAGGAGATCACTG |
| β ACTIN-R | Human | CGATCCACACGGAGTACTTG |
| PU.1-F | Human | GCGTGCAAAATGGAAGGGTT |
| PU.1-R | Human | AGATCCGTGTCATAGGGCAC |
| TYROBP-F | Human | CCTGGCCGTGTACTTCCTG |
| TYROBP-R | Human | TCGCTGTAGACATCCGACCT |
| Trem2-F | Mouse | CTGGAACCGTCACCATCACTC |
| Trem2-R | Mouse | GACCCACAGGATGAAACCTGC |
| Il1b-F | Mouse | GAATCTATACCTGTCCTGTG |
| Il1b-R | Mouse | ATCTTGTTGAAGACAAACCG |
| Apoe-F | Mouse | ATTGCTGACAGGATGCCTAGC |
| Apoe-R | Mouse | GGTTGGTTGCTTTGCCACTC |
| β actin-F | Mouse | CTCTGGCTCCTAGCACCATGAAGA |
| β actin-R | Mouse | GTAAAACGCAGCTCAGTAACAGTCCG |
| PU.1-F | Mouse | GAGAAGCTGATGGCTTGGAG |
| PU.1-R | Mouse | GGCGAATCTTTTTCTTGCTG |
| Tyrobp-F | Mouse | GAGTGACACTTTCCCAAGATGC |
| Tyrobp-R | Mouse | CCTTGACCTCGGGAGACCA |
Human iPSC and ES-derived iMGL cultures
Unedited human iPSC (AG09173; Coriell) and ES (WA09; WiCell) cells were cultured on Matrigel (BD354277; VWR)-coated plates (62406-161; VWR) in mTeSR1 media (85850; STEMCELL) and passaged with ReLeSR (05872; STEMCELL). Karyotyping was performed by Cell Line Genetics. iPSC and ES cells were differentiated into iMGLs using an optimized version of a published protocol (McQuade et al., 2018), beginning with the STEMdiff Hematopoietic Kit (05310; STEMCELL) reagents for 11 d, followed by maintenance in DMEM/F12, HEPES, 2% ITS-G (41400045; Thermo Fisher Scientific), 2% B27 (17504044; Thermo Fisher Scientific), 0.5% N2, 1% Glutamax (17502048; Thermo Fisher Scientific), 1% NEAA, 1% PenStrep, 100 µM β-mercaptoethanol (M6250; Millipore), 25 ng/ml MCSF (200-35; PeproTech), and 100 ng/ml IL34 (200-34; PeproTech), and were considered mature between 35 and 100 d of culture (day 1 represents stem cell stage).
The purity of iMGL cultures was assessed via flow cytometry (BD, FACSAria IIu) following washes in Dulbecco’s PBS (DPBS), blocking in FcR blocking reagent (130-059-901; Miltenyi), and labeling with CD11b-APC or NeuN-488. For flow cytometry, microglia were scraped (353085; Corning) and passed through a 35-µm filter cap tube (08-771-23; Thermo Fisher Scientific). Immunocytochemistry was performed on cells plated directly on glass slides (PEZGS0816; Millipore) followed by 4% paraformaldehyde (PFA) fixation and a 1-h incubation in blocking solution (5% Normal Donkey Serum (S30-M; Millipore) and 0.3% Triton-X (T8787; Millipore) in DPBS). Cells were then incubated at 4°C with primary antibody, overnight in blocking solution, followed by three 10-min DPBS washes before incubation with secondary antibody for 30 min at room temperature, then followed by three 10-min DPBS washes with 1 µg/ml Hoechst added to the penultimate wash, coverslipped with Fluoromount-G (100502-406; VWR), and left to solidify overnight at room temperature. Confocal imaging was performed on a Zeiss (LSM, 880) microscope using a 20× Plan-Apochromat objective (421452-9880-000; Zeiss). Images were adjusted for brightness and contrast equally for the whole image for both the control and experimental samples. Images were analyzed with Imaris and ImageJ.
iMGL assays
Uptake assays were performed in clear-bottom 96-well plates (3603; VWR) with flow cytometry (FACS Celesta HTS-1; BD) with 30 µg/ml pHrodo-labeled zymosan A bioparticles (P35365; Thermo Fisher Scientific) or 30 µg/ml purified myelin from 2-mo-old C57BL/6J male mice, labeled with amine-reactive pHrodo STP Ester (P36012; Thermo Fisher Scientific), incubated with the cells for 4 h. Myelin was purified using an in-house optimized version of a published protocol (Larocca and Norton, 2007) by homogenization of the whole brain with a loose pestle (62400-595; VWR) in 0.32 M sucrose, a protease inhibitor (1183617001; Millipore), and a phosphatase inhibitor (4906845001; Millipore) for 50 strokes. The homogenate was layered on top of a 0.85 M sucrose base in Thickwall polycarbonate tubes (355631; Beckman Coulter) and spun at 24,400 rpm in a SW32Ti (369650; Beckman Coulter) rotor for 40 min in an ultracentrifuge (TLX-120K; Beckman Coulter). The interphase was added to dH2O (10977023; Thermo Fisher Scientific) and spun at 24,400 rpm for 15 min. The pellet was then washed twice in dH2O (spun at 9,800 rpm, 15 min), resuspended in 0.32 M sucrose, layered on top of 0.85 M sucrose, and spun at 24,400 rpm for 30 min. The interphase was then transferred and washed in 10 ml dH2O (spun at 24,400 rpm, 15 min) with the resulting pellet labeled with 50 µg amine-reactive pHrodo STP per 10 mg of myelin for 30 min in darkness, followed by three DPBS washes at 10,000 rpm for 15 min. All steps of the myelin extraction were performed at 4°C. ELISAs were performed on supernatants from 2.5 × 10⁵ iMGLs and ES iMGLs in 250 µl media using the IL1β Human ELISA Kit, High Sensitivity (BMS224HS; Thermo Fisher Scientific). Accumulation of neutral lipids was visualized using BODIPY labeling (D3922; Thermo Fisher Scientific) at 100 µg/ml counterstained with 10 µg/ml Hoechst in cells fixed with 4% PFA (15714-S; Electron Microscopy) and counted manually using the FITC channel of an epifluorescent microscope (EVOS, AMF4300). The surface area of the cellular membrane was determined following a 30-min incubation with Vybrant DiI (diluted 1:1,000), imaging in the TRITC channel, and analysis with ImageJ. Microglial activation was achieved by a 2-d incubation with 25 ng/ml of either IFNγ (285-IF-100; R&D Systems), LPS (L-2654; Millipore), TNFα (210-TA-005; R&D Systems), or TGFβ (100-21; Peprotech).
RNA sequencing
Libraries for RNA sequencing were generated using SMART Ultra Low RNAseq V4 (634894; Takara Bio) and Nextera XT DNA Library Prep Kit/dual index (Illumina). Libraries were sequenced on the HiSeq4000 (University of Texas MD Anderson Advanced Technology Genomics Core). Reads were aligned using Salmon v0.12.0 to human genome vGRCh38.94. We performed differential analysis using R v3.6.1 and DESeq2 v1.26.0. For each corresponding cell type and condition, differential expression was performed using only the corresponding samples.
ChIP of mouse hippocampus
Hippocampi from male mice were collected as previously described (Gjoneska et al., 2015) immediately after euthanasia. ChIP was then performed as described in Gjoneska et al. (2015). In brief, tissues were minced and crosslinked in 1% formaldehyde (28906; Thermo Fisher Scientific) for 15 min at room temperature and quenched with glycine for 5 min (g7126; Sigma-Aldrich). The samples were homogenized in cell lysis buffer containing proteinase inhibitors (C762Q77; Thermo Fisher Scientific) and chromatin was then fragmented to a size range of 200–500 bp using a digital sonifier (SFX 250; Branson). Solubilized chromatin was then diluted and incubated with 1 µg antibody (sc-352x; Santa Cruz) at 4°C overnight. Immune complexes were captured with Protein A sepharose beads (101041; Thermo Fisher Scientific), washed, and eluted. Enriched chromatin was then subjected to crosslink reversal and proteinase K (25530049; Thermo Fisher Scientific) digestion at 65°C, phenol-chloroform (17908; Thermo Fisher Scientific) extraction, and ethanol precipitation.
FACS of microglia from adult mice
Whole mouse brains were dissected from adult female CKp25 mice and washed in cold PBS with Ca2+ and Mg2+ (14287080; Thermo Fisher Scientific), placed on a Petri dish, finely diced with a razor, transferred to a MACS C Tube (130-093-237; Miltenyi), treated with the Adult Brain Dissociation Kit, mouse and rat (130-107-677; Miltenyi), and digested with a gentleMACS Octo Dissociator with Heaters (130-096-427; Miltenyi) for 30 min at 37°C. The slurry was then strained through a MACS 70 µm SmartStrainer (130-098-462; Miltenyi). Debris removal solution was then added, followed by a 3,000 ×g, 10 min, 4°C spin, discarding of two upper phases, and PBS wash step 1,000g, 10 min, 4°C spin. Cells were then labeled with CD11b antibody (130-110-554, 1:25 dilution; Miltenyi) and DAPI (D9542-1MG; Millipore) for 40 min followed by sorting into PBS with 1% BSA (700-100P; Gemini). Cells were then pelleted and subject to mRNA extraction using the RNeasy Plus Mini Kit (74134; Qiagen).
ChIP-Seq high-throughput sequencing, read mapping, and quality control (QC)
Sequencing libraries were prepared from, 1–5 ng ChIP (or input) DNA as described previously (Gjoneska et al., 2015). Gel electrophoresis was used to retain library fragments between 300 and 600 bp. Before sequencing, libraries were quantified using Qubit (Q33238; Thermo Fisher Scientific) and quality-controlled using Agilent’s Bioanalyzer. The 36-bp single-end sequencing was performed using the Illumina HiSeq 2000 platform according to standard operating procedures. Reads were mapped to the mm9 reference mouse genome using MAQv0.7.1-9 using default parameters. Reads mapping to multiple locations were discarded. Duplicates were marked and filtered using PICARD (http://picard.sourceforge.net/). All replicate data sets passed QC based on ENCODE ChIP-Seq data standards based on read quality, read mapping statistics, library complexity, and strand cross-correlation analysis to measure signal-to-noise ratios.
ChIP-qPCR
Chromatin was extracted using an Abcam chromatin extraction kit (ab117152; Abcam). 40 million iMGLs were collected per sample, washed twice in DPBS, and resuspended in 10 ml DPBS with 1% PFA for 15 min at room temperature. Subsequently, 1.1 ml of 1.25 M glycine was added, followed by two centrifugation washes in DPBS. Cells were then lysed using the kit lysis buffer including protease inhibitors and sonicated (E220; Covaris) in microTUBEs (520045; Covaris). Settings on the sonicator were optimized for 200–600 bp fragments: 430 s per tube, peak power of 175, duty factor of 10, cycles/burst were 200, and an average power of 17.5, degas function was on and stabilized for >1 h, the sonication temperature spanned 4–9°C. Pulldown was performed using the Abcam ChIP magnetic kit (ab156907). Input (5% of the sample) was stored for later use, and the IgG negative control (5% of sample, at 1:5 dilution) and anti-RNA polymerase samples (5% sample, at 1:5 dilution) were pulled down in parallel to MECP2 and HDAC1. The DNA was concentrated (ab156895; Abcam) and submitted for fragment size analysis (Agilent Bioanalyzer 2100). Size exclusion for fragments larger than 1,000 bp was performed using AMPure XP beads (A63881; Beckman Coulter). ChIP-qPCR experiments were performed using ChIP-qPCR primers (Table 3) designed with PrimerBlast and subject to qPCR as described above with negative isotype control IgG.
Primers used for ChIP-qPCR
| ChIP-qPCR primers | Species | Sequence 5′→3′ |
|---|---|---|
| IL1B-1-F | Human | AAACAGCGAGGGAGAAACTGG |
| IL1B-1-R | Human | GCTGAAGAGAATCCCAGAGCA |
| IL1B-2-F | Human | CTCAGCCTCCTACTTCTGCTTT |
| IL1B-2-R | Human | GTGCCTTGTGCCTCGAAGA |
| CD14-F | Human | GGAAGGGGGAATTTTTCTTTAGACC |
| CD14-R | Human | TCTCCTGCCACCAAATCCAA |
| CCL2-F | Human | CCCTCTGCCCGCTTTCAATA |
| CCL2-R | Human | AGTGCGAGCTTCAGTTTGAGA |
| CD300E-1-F | Human | TCCTGTTTGTGCTTGGTCCAT |
| CD300E-1-R | Human | GTAACGGAGCCTGGGTCATC |
| CD300E-2-F | Human | ATCTCAGGGGGTGACTCAAAC |
| CD300E-2-R | Human | TGGACCAAGCACAAACAGGA |
| SCHBP1-1-F | Human | TCTAATTGGTCCACGGCCTC |
| SCHBP1-1-R | Human | ATGGAGAGCTCACCTTTCTCC |
| SCHBP1-2-F | Human | CTCTAATTGGTCCACGGCCT |
| SCHBP1-2-R | Human | CATGGAGAGCTCACCTTTCTCC |
Transcriptomic analysis
Gene identifiers and mouse-to-human orthologs were gathered in RStudio (v4.1.0) with packages from Bioconductor (v3.14). Chromosome intervals were mapped to genes with BEDOPS (v2.4.40) bedmap algorithm. Motif identification was performed with HOMER (v4.11; Heinz et al., 2010) at ± 2,000 bp from the transcription start site of DEGs. Data processing was done in JupyterLab (v0.32.1) in Python v3.6.8 Anaconda Navigator. Heatmaps were generated using Morpheus (https://software.broadinstitute.org/morpheus). The reference genomes were hg38 (human) and mm19 (mouse), unless otherwise stated.
EMSA and Western blotting
Nuclear lysates were obtained using the NE-PER kit (78833; Thermo Fisher Scientific) from 5 million iMGLs in a final volume of 100 µl. The DNA binding experiments were performed using the chemiluminescent EMSA LightShift kit (20148; Thermo Fisher Scientific), with 5% (vol/vol) of Poly dI:dC (20148E; Thermo Fisher Scientific), 5 ng recombinant PU.1 protein (TP760680; OriGene), and 5% (vol/vol) of nuclear iPSC microglia lysate incubated with either DMSO, A11, or PU.1 antibody at room temperature for 30 min before adding 20% (vol/vol) of Novex loading buffer (LC6678; Thermo Fisher Scientific) and transfer to a 1.5 mm, 6% non-denaturing polyacrylamide gel (50-899-90118; Thermo Fisher Scientific) in 0.5× TBE buffer (45 mM Tris, 45 mM boric acid, 1 mM EDTA, pH 8.3). The gel was electrophoresed at 70 V for 70 min (Powerpac 1000; Bio-Rad). Transfer to a positively charged nylon membrane (11209299001; Millipore) occurred at 100 V for 1 h, followed by UV crosslinking for 2 min at 254 nm in a GelDoc XR+ (1708195; Bio-Rad). Under SDS-denaturing conditions, the buffer was TBST (150 mM NaCl, 20 mM Tris base, 0.1% Triton-X) and the gel consisted of a 10% acrylamide separating gel and a 17% acrylamide stacking gel (both containing 0.1% SDS) and was run at 100 V for 90 min followed by a 100 V, 2-h transfer to a polyvinylidene difluoride membrane (IPFL00010; Millipore). Blocking was performed in 5% non-fat dry milk (170-6404; Bio-Rad) in TBST for 1 h, followed by overnight, 4°C incubation with the primary antibody in 1% BSA (BP1605-100; Thermo Fisher Scientific). Secondary antibodies were incubated at room temperature for 1 h in 1% non-fat dry milk, followed by a chemiluminescence reaction (K-12042-D20; Advansta). The Epstein-Barr Antigen probe contained the sequence biotin-5′-...TAGCATATGCTA-3′ and was bound by the contents in lysates from Escherichia coli expressing recombinant Epstein-Barr nuclear antigen. The 1XλB (5′-CCAAATAAAAGGAAGTGAAACCAAGC-3′), 2XλB (5′-CCAAATAAAAGGAAGTGAAACCAAGCCCAAATAAAAGGAAGTGAAACCAAGC-3′), and ETS-IRF (5′-TGAAATAACCTCTGAAAGAGGAACTTGGTTAGGTA-3′) probes and their complementary sequence were purchased as 5′ biotin-labeled DNA duplexes from Integrated DNA Technologies and were added at 20 fmol final concentration. Non-biotinylated “cold probes” were added at a final concentration of 4 pmol. Membranes were imaged using the ChemiDoc MP system (12003154; Bio-Rad). Band intensity was quantified with ImageJ. The PU.1 antibody (2266S; CST) and the rabbit isotype control antibody (D6W5B; CST) were ordered as carrier-free custom formulations.
CFUs of human bone marrow–derived cells
Human hematopoiesis experiments were conducted at StemCell Technologies. In brief, normal human bone marrow light-density cells (catalog no. 2S-101D, lot no. 0000533212; Lonza) were stored at −152°C. On the day of the experiment, the cells were thawed rapidly at 37°C into DNase I (STI, cat #07900, lot #18L917303) and then diluted in 10 ml of IMDM containing 2% FBS (IMDM + 2% FBS; STI, 07700) and washed by centrifugation (1,200 rpm for 10 min at room temperature). The supernatant was discarded, and the cell pellet was resuspended in IMDM + 2% FBS. A nucleated cell count and viability assessment were performed using the Nexcelom Cellometer Auto 2000 Cell Viability Counter and ViaStain AOPI Staining Solution (CS2-0106-5 ml; Nexcelom). Cells were then treated at the indicated concentration for 14 d prior to measuring viability and differentiation.
Hepatic clearance (CLint,app) determination
The test compounds were incubated at 1 µM with hepatocytes (0.5 million cells/ml, viability >80%) in OptiIncubate media (Sekisui Xenotech) in a 37°C, CO2 (5%) incubator for 2 h. Aliquoted samples were quenched at 0, 15, 30, 60, 90, and 120 min with the addition of an equal volume of acetonitrile containing 1 µM imipramine as the internal standard. After vortex and centrifugation, the supernatants were analyzed with liquid chromatography with tandem mass spectrometry for the parent compound remaining. The hepatic clearance (CLint,app) was calculated from the equation: CLint,app (ml/min/kg) = (0.693/t1/2)/cell density (million cells/ml) × scaling factor.
MDCK cell permeability determination
The cell permeability assay using the wild-type MDCK and the human MDR1-transfected MDCK cell lines were conducted at Shanghai Chempartner. Briefly, cells were seeded on 24-well plates at 0.88 × 10⁵ cells/ml and allowed to incubate for 24 h. For the permeability experiment, the transport buffer (Hanks’ balanced salt solution, pH 7.4) was added to all receiver chambers and the test compound dose solutions (5 μM) in transport buffer containing the monolayer integrity marker lucifer yellow (5 μM) were added to the donor chambers. The permeability was examined in the apical to basolateral (A-to-B) and basolateral to apical (B-to-A) directions. At 0 and 90 min, compound concentrations in the donor and receiving compartments were determined by liquid chromatography with tandem mass spectrometry analysis. The apparent permeability (Papp) in the A-to-B and B-to-A directions, was calculated as follows: Papp (10−6 cm/s) = (VA/[area × 90 min]) × ([drug]accepter, 90-min/[drug]donor, 0-min), where VA is the volume of the solutions in the acceptor wells and [drug]acceptor, 90-min and [drug]donor, 0-min are the acceptor drug concentrations measured at 90 min and the donor drug concentrations measured at 0 min, respectively.
Mouse experiments
All experiments involving mice had approval from the Committee for Animal Care of the Division of Comparative Medicine at the Massachusetts Institute of Technology. Mice were housed on a standard 12-h light-dark cycle at 24°C, 45% relative humidity, and food (Teklad RMH 3000; Envigo) and water available ad libitum. CreERT2 mice were given the same diet containing 400 mg/kg tamoxifen (Envigo) premixed into the chow (Xu et al., 2021). CK-p25 mice were bred with CX3CR1:CreERT2:PU.1fl/fl mice to generate PU.1 ablated CK-p25 mice (CK-p25:CX3CR1CreERT2/+:PU.1fl/fl mice; for brevity, PU.1fl/fl mice) and PU.1-wild-type littermates (CK-p25:CX3CR1CreERT2/+:PU.1WT/WT mice; for brevity, PU.1WT/WT mice). All CK-p25:CX3CR1CreERT2/+ mice that were analyzed in Fig. 1 c were males. In CK-p25 mice, p25 expression is driven by the CaMKII-tTA (CK) promoter crossed to tetO-p25 mice (005706; JAX) in the absence of doxycycline, with CK mice as littermate controls. Therefore, p25 expression is suppressed by a constant 1 g/kg doxycycline diet (Bio-Rad, custom-made) and induced when mice are put on a regular diet (Teklad RMH 3000; Envigo). The pharmacokinetic experiments were performed in male, 2-mo-old C57BL/6J (000664; JAX) mice. Maximal concentration and half-life were calculated with a TI-84 Plus (Texas Instruments). Mice were injected with vehicle (1% DMSO; Millipore, D8418-50Ml in sterile DPBS (14190144; Thermo Fisher Scientific) or 0.1, 0.3, and 1.0 mg/kg of A11 intraperitoneally at 10 µl per gram bodyweight, using a 1 ml syringe (309659; BD) with a 26G needle (305110; BD). Inducible neurodegeneration was studied by use of in-house 1-yr-old CK-p25 mice (Cruz et al., 2003; and control littermate CK mice; 003010; JAX). For immunohistochemical experiments with 2-wk induced CK-p25 mice and CK littermates, only males were used. For transcriptomic experiments with 2-wk induced CK-p25 mice and CK littermates, only females were used. For experiments with 6-wk induced CK-p25 mice CK littermates, only females were used. The P301STau mice used in this study (Fig. 4, f, g, and j) were 1-yr-old male B6;C3-Tg(Prnp-MAPT*P301S)PS19Vle/J mice (008169; JAX). They were injected for 6 wk with A11, 0.3 mg/kg, every day (intraperitoneally 10 µl/g bodyweight). The 5XFAD mice used (Fig. 4 h) were 1-yr-old male B6.Cg-Tg(APPSwFlLon,PSEN1*M146L*L286V)6799Vas/Mmjax (034848-JAX). These mice were injected daily for 6 wk with A11, 0.3 mg/kg (intraperitoneally 10 µl/g bodyweight). All mice were injected daily with A11 (10 µl/g bodyweight), intraperitoneally, with a 26G needle (305110; BD) at 6 pm. CK-p25 mice that were induced (off-Dox) for 6 wk and 1-yr-old P301STau mice underwent the behavioral tasks of open field activity, Y maze, and Morris water maze (Wolf et al., 2016). The movement of the mice was recorded using a camera attached to the ceiling and analyzed automatically using EthoVision XT (Noldus) software (Table 1). Open field activity was averaged from two 10-min trials measuring the movement of the mouse in a custom-made plastic compartment measuring 40 × 40 cm. The custom-made Y maze consists of three arms of 40-cm length and 7-cm width used to quantify the propensity of the mouse to alternate into the most novel arm in a single 10-min trial. Entry (defined as the mouse having all its four paws in the arm) into the most novel arm was given a score of 1 and all other entries were given a score of 0. The Morris water maze consisted of a circular plastic tank with a diameter of 1.2 m and was filled with room temperature water until 1–2 cm above a 50-cm tall cylindrical platform with a 10-cm diameter. The water was made opaque with green (33302-GR; Kaplan) and white (33302-WH; Kaplan) non-toxic paint. Wall-mounted 1 × 1 m posters served as spatial cues with images of different shapes and colors and were displayed in the four cardinal directions. Mice were first trained in three 1-min trials on a single day, with a flag positioned on the submerged platform, and were guided to it by the experimenter if still swimming after 1 min. Once the mouse reached the platform, it remained there for 30 s, before being dried with a paper towel and returned to the home cage placed on a 37°C heating pad for 2 min. On the trial days, the flag was removed and the latency to reach the submerged platform was averaged from three 1-min trials per day.
Immunohistology in mice
Mice were deeply anesthetized with 5% isoflurane and intracardially perfused with 4°C PBS, followed by dissection of the brain and/or peripheral organs, then immersion fixation in 4% PFA overnight at 4°C, and subsequent sectioning into 40-µm coronal free-floating slices on a vibratome (VT1200S; Leica). Sections were blocked in 5% normal donkey serum and 0.3% Triton-X in DPBS for 1 h and stained in the blocking solution together with the primary antibody (Table 1) overnight with shaking at 4°C. Sections were then washed three times in DPBS for 10 min followed by a 1-h incubation with secondary antibody diluted in blocking solution, followed by three washes with DPBS with Hoechst (1:10,000) in the penultimate wash. Liver and spleen sections from male mice were stained with hematoxylin and eosin (TyrScientific). Sections were then mounted on glass slides (12-550-15; Thermo Fisher Scientific), coverslipped (631-0701; Avantor) with Fluoromount G and left to dry overnight at room temperature.
Flow cytometry on mouse blood
Blood was collected by cardiac puncture with a 23G needle from male wild-type C57BL/6J mice into a 5 ml tube with 100 µl of 0.5 M EDTA and 3 ml DPBS. Separation was performed with a 1.077 g/ml Ficoll-Paque gradient (17-1440-02; Thermo Fisher Scientific). 2 ml of Ficoll gradient was layered with 4 ml of blood and spun at 300 ×g for 30 min at room temperature. The monocyte layer was transferred to a 15-ml falcon with 14 ml DPBS, spun at 300 ×g for 5 min at room temperature, repeated once. The pellet was then stained with LIVE/DEAD stain for 30 min (L34961; Thermo Fisher Scientific) and with antibodies CD16/CD32 (“Fc-block,” 14-0161-82; Thermo Fisher Scientific), CD45-PE (553081; BD), CD4-APC (553051; BD), and CD8-FITC (553030; BD), and analyzed with the LSR II Fortessa Cell Analyzer (BD).
Pharmacokinetic analysis in mice
The concentration of A11 in blood plasma, peripheral fat, and brain of male mice was quantified using liquid chromatography with tandem mass spectrometry method on a Nextera X2 (Shimadzu) and Sciex 5500 #2 with a Supelco Ascentrix C18 Column. 25 µl of each plasma sample, including standards, QC samples, and experimental samples, were precipitated with 200 µl acetonitrile containing 250 nM imipramine as internal standard. After 10 min vortexing and centrifugation at 4,000 rpm for 10 min, 100 µl of the extract was diluted with 200 µl of water before injection. The injection volume was 3 µl. Standards and QC samples of A11 were prepared by spiking in blank mouse plasma. Brain tissue samples were homogenized using OmniBEAD Ruptor24 (OMNI International) coupled with Omni BR CRYO to make homogenate at 100 mg tissue per mL in 20% water and 80% methanol. Homogenates were centrifuged at 15,000 rpm at 4°C for 15 min. An aliquot of 50 µl of the supernatant was diluted with 150 µl of 50% water and 50% acetonitrile containing imipramine at 125 nM, vortexed for 15 s, and centrifuged at 15,000 rpm and 4°C for 5 min. Standards and QC for A11 were freshly prepared by spiking into pooled blank mouse brain homogenate.
Online supplemental material
Fig. S1 shows a detailed description of the high-throughput screen from Fig. 1 e. Fig. S2 shows control experiments with A11 in multiple cell lines, Fig. S3 shows control experiments for the EMSA and Western blot data in Fig. 3. Fig. S4 shows experiments describing stability, clearance, transport, and CNS MPO scores of A11. Fig. S5 shows experiments confirming the absence of hematopoietic side effects of A11 on non-mature iMGLs. Data S1 shows bulk RNA sequencing on iMGLs treated with A11. In Data S2, additional RNA sequencing data with treatments of iMGLs with pro-inflammatory molecules are shown. Data S3 shows bulk RNA-sequencing data of iMGLs from CK-p25 mice treated with A11. Tables S1, S2, S3, S4, S5, S6, S7, S8, S9, S10, S11, S12, S13, and S14 show additional control experiments.
Data availability
Raw files from the PU.1 ChIP in CK-p25 mice from Fig. 1 b are listed under Gene Expression Omnibus (GEO) accession number GSE117868. Raw sequence files from the transcriptomic analysis on iMGLs from Fig. 2, c and f are listed under GEO accession number GSE218513. Data in Fig. 2 g were extracted from datasets with the GEO accession numbers GSM537988 (PU.1), GSM1167584 (MITF), GSM1370276 (SPIB), GSM1057024 (IRF1), GSM970261 (IRF2), GSE36030 (USF2), GSE21521 (PU.1), ENCODE accession numbers ENCFF624RGO (ENCODE, ETV4) and ENCFF444VWF (ENCODE, Sp2), and GEO accession numbers GSM558677 (ETV1) and GSE33912 (ATF3).
Acknowledgments
The authors thank Fatema Abdurrob, Vishnu Dileep, and Hiruy Meharena at the Massachusetts Institute of Technology; and Paul Acton, Yongying Jiang, Alan Xu, Qi Wu, and Jennifer Linares at the University of Texas for the technical assistance provided.
This work was supported by the National Institutes of Health grant 1U01AG066757-01 and the Robert A. and Renee E. Belfer Family Foundation. L.-H. Tsai acknowledges support from the JPB Foundation, the Picower Institute for Learning and Memory, the Halis Family Foundation, Lester A. Gimpelson, and Jay L. and Caroll Miller. W.T. Ralvenius was supported by the Swiss National Science Foundation grants number 177920 and 171909, and Alzheimer’s Association grant AARF-19-616816. The University of Texas MD Anderson Advanced Technology Genomics Core was supported by National Cance Institute grant CA016672(ATGC). The University of Texas MD Anderson Cancer Center Science Park Next-Generation Sequencing Facility was supported by Cancer Prevention and Research Institute of Texas Core Facility support grants #RP120348 and #RP170002.
Author contributions: A.E. Mungenast, T.Z. Gillingham, W.T. Ralvenius, E. Gjoneska, and L.-H. Tsai conceived of the study. A.E. Mungenast created the reporter line. E. Gjoneska generated a conditional ablation of PU.1 in mouse models of AD. W.T. Ralvenius, A.E. Mungenast, H. Woolf, M.M. Huston, T.Z. Gillingham, S.K. Godin, J. Penney, H.P. Cam, Y.-T. Lightfoot, C.G. Fernandez, W.J. Ray, and E. Gjoneska performed the experiments and analyzed the results. W.T. Ralvenius, A.E. Mungenast, H. Woolf, M.M. Huston, T.Z. Gillingham, S.K. Godin, J. Penney, H.P. Cam, F. Gao, C.G. Fernandez, B. Czako, Y. Lightfoot, W.J. Ray, A. Beckmann, A.M. Goate, E. Marcora, C. Romero-Molina, P. Ayata, A. Schaefer, E. Gjoneska, and L.-H. Tsai contributed to writing the manuscript and designing experiments.

