


IRE1α is an endoplasmic reticulum (ER) sensor that recognizes misfolded proteins to induce the unfolded protein response (UPR). We studied cholera toxin (CTx), which invades the ER and activates IRE1α in host cells, to understand how unfolded proteins are recognized. Proximity labeling colocalized the enzymatic and metastable A1 segment of CTx (CTxA1) with IRE1α in live cells, where we also found that CTx-induced IRE1α activation enhanced toxicity. In vitro, CTxA1 bound the IRE1α lumenal domain (IRE1αLD), but global unfolding was not required. Rather, the IRE1αLD recognized a seven-residue motif within an edge β-strand of CTxA1 that must locally unfold for binding. Binding mapped to a pocket on IRE1αLD normally occupied by a segment of the IRE1α C-terminal flexible loop implicated in IRE1α oligomerization. Mutation of the CTxA1 recognition motif blocked CTx-induced IRE1α activation in live cells, thus linking the binding event with IRE1α signal transduction and induction of the UPR.
Introduction
IRE1α (encoded by the ERN1 gene) is one of three proteins that monitor protein folding in the endoplasmic reticulum (ER) of mammalian cells to regulate a key cell-protective stress response termed the “Unfolded Protein Response” (UPR) (Tirasophon et al., 1998; Wang et al., 1998). The UPR adjusts the functional capacity of the ER by modulating protein translation, and expansion of the ER, chaperone-dependent protein folding, and the machinery for retro-translocation of terminally misfolded proteins to the cytosol for ER Associated Degradation (ERAD) (Karagöz et al., 2019; Preissler and Ron, 2019). Upon sensing misfolded proteins, IRE1α forms dimers or small oligomers (Belyy et al., 2022; Bertolotti et al., 2000) that induce the UPR through a dual kinase–endonuclease cytosolic effector domain by splicing the mRNA for the transcription factor XBP1s (Calfon et al., 2002; Lee et al., 2002; Yoshida et al., 2001) and by degrading other ER-targeted mRNAs (Hollien et al., 2009; Hollien and Weissman, 2006). Deficiencies in the UPR contribute to human disease (Grootjans et al., 2016; Hetz et al., 2020; Wang and Kaufman, 2016), but exactly how IRE1α recognizes misfolded proteins to induce this adaptive response is not clear.
IRE1α has been shown to bind unfolded proteins or peptides in vitro (Amin-Wetzel et al., 2019; Karagöz et al., 2017) and in cells (Guttman et al., 2022; Sundaram et al., 2018). One hypothesis proposes that misfolded proteins bind directly to an MHC class I-like groove on the IRE1α luminal domain (IRE1αLD) surface to stabilize an active conformation that induces the UPR (Credle et al., 2005; Gardner and Walter, 2011; Karagöz et al., 2017; Korennykh et al., 2009). Other binding sites have not been ruled out (Amin-Wetzel et al., 2019; Wang et al., 2018), little is known about the structural features of misfolded proteins that may enable such recognition by IRE1α (Karagöz et al., 2017), and alternative models for IRE1α activation are equally credible (Amin-Wetzel et al., 2017, 2019; Bertolotti et al., 2000).
We addressed these problems using cholera toxin (CTx). CTx has evolved to enter the ER lumen of intestinal epithelial cells where a portion of the toxin (the enzymatically active fragment of the CTx A-subunit—termed the CTxA1 chain) unfolds to hijack ERAD and thread across the ER-limiting membrane by retro-translocation into the cytosol for activation of adenylyl cyclase (Bernardi et al., 2008; Forster et al., 2006; Fujinaga et al., 2003; Tsai et al., 2001). This induces the cAMP-dependent fluid secretion that underlies the diarrhea of cholera disease (Wernick et al., 2010). Somewhere in this process, the CTxA1 chain activates IRE1α (Cho et al., 2013, 2018; Tang et al., 2018)—thus providing a physiologic model to investigate the basis for how IRE1α senses an unfolded protein.
Results
CTx activates IRE1α in host cells
We first confirmed that CTx activates IRE1α from within the ER of affected cells (Cho et al., 2013, 2018; Tang et al., 2018). Polarized monolayers of human intestinal T84 cells treated with CTx had increased IRE1α activation as assessed by XBP1s mRNA compared with cells treated with media or the CTx B subunit (CTxB) alone (Fig. 1 A). XBP1 splicing was specific for IRE1α as it was blocked by the IRE1α endonuclease inhibitor 4μ8C (Cross et al., 2012). Similar results were found in other cell lines (Fig. S1, A and B) and mouse ileal tissue (Fig. S1 C). In all cases, the level of XBP1s produced was comparable with that produced by the expression of misfolded proteins in other model cell systems and tissues in vivo (Guttman et al., 2022) and abundant enough to induce the expression of a known downstream XBP1s-dependent gene, ERdj4 (Cho et al., 2013, 2018). Activation of IRE1α by CTx occurred within the ER lumen as a mutant toxin with an A subunit that cannot retrotranslocate from the ER into the cytosol (CTxA R192G) (Tsai et al., 2001) still induced XBP1 splicing in mouse embryonic fibroblasts (Fig. S1 D). Treatment with forskolin (FSK), which mimics the toxic effect of CTxA1 in the cytosol by maximally activating adenylate cyclase, did not induce XBP1 splicing (Fig. S1 E). These studies were important to document as after our previous publication (Cho et al., 2013), we obtained evidence that the inflammatory response attributed in that paper to CTx-induced IRE1α activation was not reproducible and the paper was withdrawn (Cho et al., 2013, 2018). The fundamental finding that CTx-activated IRE1α, however, was never in question and found again to be true as documented here.

CTxA activates IRE1α in the ER of live cells. (A) Relative expression of spliced XBP1 mRNA assayed by qPCR from polarized T84 cell monolayers treated with PBS (white bars), CTx (purple bars), or CTxB (green bars) in the absence or presence of the IRE1α inhibitor 4μ8C. Cells treated with thapsigargin (Tg, blue bars) to induce ER stress were a positive control. Symbols represent independent experiments (n = 3) and bars represent mean ± SEM. Mean values were compared by two-way ANOVA. (B) cAMP-dependent fluid secretion assayed in primary mouse colonoids. (B, left panel) Time course for change in volume of colonoids treated with PBS (negative control), CTx, CTx plus brefeldin A (BfA) to block transport into the ER (Lencer et al., 1993), CTxB, or the adenylyl cyclase agonist forskolin (FSK, positive control). Symbols represent mean ± SEM for at least 10 individual colonoids from two independent experiments. Right panels: Box plot represents the change in colonoid volume at t = 240 min compared with t = 0 min for at least 20 individual colonoids from two independent experiments. Mean values were compared by one-way ANOVA.
CTxA activates IRE1α in the ER of live cells. (A) Relative expression of spliced XBP1 mRNA assayed by qPCR from polarized T84 cell monolayers treated with PBS (white bars), CTx (purple bars), or CTxB (green bars) in the absence or presence of the IRE1α inhibitor 4μ8C. Cells treated with thapsigargin (Tg, blue bars) to induce ER stress were a positive control. Symbols represent independent experiments (n = 3) and bars represent mean ± SEM. Mean values were compared by two-way ANOVA. (B) cAMP-dependent fluid secretion assayed in primary mouse colonoids. (B, left panel) Time course for change in volume of colonoids treated with PBS (negative control), CTx, CTx plus brefeldin A (BfA) to block transport into the ER (Lencer et al., 1993), CTxB, or the adenylyl cyclase agonist forskolin (FSK, positive control). Symbols represent mean ± SEM for at least 10 individual colonoids from two independent experiments. Right panels: Box plot represents the change in colonoid volume at t = 240 min compared with t = 0 min for at least 20 individual colonoids from two independent experiments. Mean values were compared by one-way ANOVA.

CTx activates IRE1α XBP1 splicing in cell models and in vivo. (A) Relative expression of spliced XBP1 mRNA assayed by qPCR from mouse embryonic fibroblasts (MEF) treated with PBS (white bars), CTx (purple bars), or CTxB (green bars) in the absence or presence of the IRE1α inhibitor 4μ8C. Cells treated with thapsigargin (Tg, blue bars) were included as a positive control for induction of spliced XBP1 mRNA. Symbols represent independent experiments (n = 3–5), and bars represent mean ± SEM. Mean values were compared by two-way ANOVA. (B) Luciferase activity measured in HEK293 cells transfected with XBP1 splicing luciferase reporter and treated as in A. Symbols represent individual wells from two independent experiments (three wells per experiment) and bars represent mean ± SEM. Mean values were compared by two-way ANOVA. (C) Relative expression of spliced XBP1 mRNA assayed by qPCR from ileal tissue of mice treated with PBS (white bars) or CTx (purple bars). Symbols represent individual animals from two independent experiments, and bars represent mean ± SEM. Mean values were compared by unpaired t test. (D) Same as A for MEFs treated with PBS or CTx containing an A subunit with R192G mutation. Symbols represent individual experiments (n = 5), and bars represent mean ± SEM. Mean values were compared by unpaired t test. (E) Relative expression of spliced XBP1 mRNA assayed by qPCR from HEK293 cells treated with PBS, CTx, or the adenylyl cyclase agonist forskolin (FSK). Symbols represent individual experiments (n = 2), and bars represent mean ± range. Mean values were compared by one-way ANOVA.
CTx activates IRE1α XBP1 splicing in cell models and in vivo. (A) Relative expression of spliced XBP1 mRNA assayed by qPCR from mouse embryonic fibroblasts (MEF) treated with PBS (white bars), CTx (purple bars), or CTxB (green bars) in the absence or presence of the IRE1α inhibitor 4μ8C. Cells treated with thapsigargin (Tg, blue bars) were included as a positive control for induction of spliced XBP1 mRNA. Symbols represent independent experiments (n = 3–5), and bars represent mean ± SEM. Mean values were compared by two-way ANOVA. (B) Luciferase activity measured in HEK293 cells transfected with XBP1 splicing luciferase reporter and treated as in A. Symbols represent individual wells from two independent experiments (three wells per experiment) and bars represent mean ± SEM. Mean values were compared by two-way ANOVA. (C) Relative expression of spliced XBP1 mRNA assayed by qPCR from ileal tissue of mice treated with PBS (white bars) or CTx (purple bars). Symbols represent individual animals from two independent experiments, and bars represent mean ± SEM. Mean values were compared by unpaired t test. (D) Same as A for MEFs treated with PBS or CTx containing an A subunit with R192G mutation. Symbols represent individual experiments (n = 5), and bars represent mean ± SEM. Mean values were compared by unpaired t test. (E) Relative expression of spliced XBP1 mRNA assayed by qPCR from HEK293 cells treated with PBS, CTx, or the adenylyl cyclase agonist forskolin (FSK). Symbols represent individual experiments (n = 2), and bars represent mean ± range. Mean values were compared by one-way ANOVA.
We also physiologically tested the interaction between IRE1α and CTx by examining the impact of IRE1α activation on toxin-induced fluid secretion in primary mouse colon epithelial organoid cultures. Both CTx and FSK caused organoid swelling due to cAMP-induced fluid secretion (Fig. 1 B), but inhibition of IRE1α with 4μ8C affected only the swelling caused by CTx (Fig. 1 B). This result implicates IRE1α activation in the pathogenesis of Vibrio cholerae CTx-induced disease.
CTxA1 localizes in close proximity to IRE1α in live cells
To determine if CTx may activate IRE1α by direct binding, we first used a proteome-wide cell-based proximity biotin-labeling approach with ascorbate peroxidase (APEX2 [Hung et al., 2016]) fused to CTxA1 (Fig. S2). After inducing proximity biotin-labeling, biotinylated proteins were isolated and identified by liquid-chromatography-tandem mass spectrometry (LC-MS/MS) using a tandem mass tag (TMT) strategy for relative quantification. In cells expressing the ER-targeted CTxA1-APEX, IRE1α was among the ER proteins selectively enriched in biotin labeling compared with control cells expressing ER-localized APEX2 alone (Fig. 2). Substantiating this result, other ER proteins previously implicated in CTx pathophysiology were biotin-labeled at similar levels of enrichment, including components of the ERAD machinery SEL1L, ERdj5/DNAJC10, and Torsin A/TOR3A (Bernardi et al., 2008; Nery et al., 2011; Williams et al., 2013), and the ER chaperones BiP/HSPA5, PDIA4, and PDIA6 (Tsai et al., 2001; Winkeler et al., 2003) (Fig. 2 and Data S1). We note that because CTxA1-APEX-KDEL retrotranslocates from the ER lumen into the cytosol and APEX2-KDEL cannot, the proteins ranking highest in significance for selective biotinylation were proteins localized outside the ER. Those results were expected. Thus, CTxA1 partitions within the ER lumen of live cells in close proximity (<20 nm) of IRE1α, suggesting that the molecules may directly interact within the ER lumen.
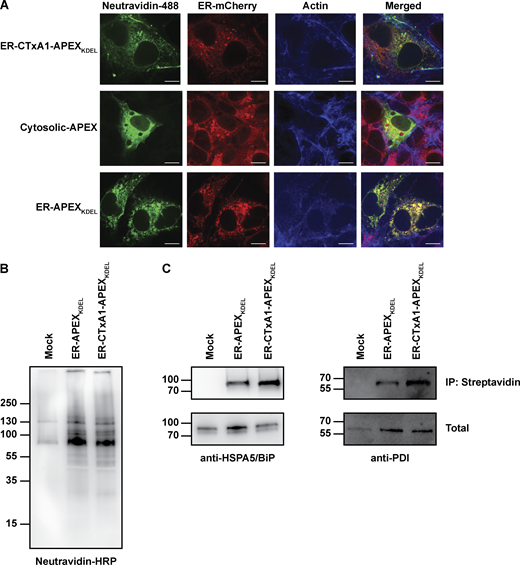
Expression of CTxA1-APEX2KDEL in ER of mammalian cells. (A) Representative micrographs of COS-7 cells expressing ER-CTxA1-APEX2KDEL, Cytosolic-APEX, or ER-APEX2KDEL. Cells were co-transfected with an ER-mCherry construct to label the ER. Cells were stained for biotinylated proteins and actin. Note, the co-localization of biotinylated proteins (neutravidin-488 staining) with ER-mCherry for only cells expressing ER-CTxA1-APEXKDEL and ER-APEXKDEL (not Cytosolic-APEX), indicating biotinylation of proteins within the ER. The scale bar represents 10 μm. (B and C) Immunoblot of biotin-labeled proteins from cells expressing no APEX, ER-APEXKDEL, and ER-CTxA1-APEXKDEL. Biotinylated proteins were enriched by immunoprecipitation with streptavidin-coated beads followed by immunoblotting with (B) neutravidin-HRP, (C left panel) anti-HSPA5/BiP, or (C right panel) anti-PDI. Source data are available for this figure: SourceData FS2.
Expression of CTxA1-APEX2KDEL in ER of mammalian cells. (A) Representative micrographs of COS-7 cells expressing ER-CTxA1-APEX2KDEL, Cytosolic-APEX, or ER-APEX2KDEL. Cells were co-transfected with an ER-mCherry construct to label the ER. Cells were stained for biotinylated proteins and actin. Note, the co-localization of biotinylated proteins (neutravidin-488 staining) with ER-mCherry for only cells expressing ER-CTxA1-APEXKDEL and ER-APEXKDEL (not Cytosolic-APEX), indicating biotinylation of proteins within the ER. The scale bar represents 10 μm. (B and C) Immunoblot of biotin-labeled proteins from cells expressing no APEX, ER-APEXKDEL, and ER-CTxA1-APEXKDEL. Biotinylated proteins were enriched by immunoprecipitation with streptavidin-coated beads followed by immunoblotting with (B) neutravidin-HRP, (C left panel) anti-HSPA5/BiP, or (C right panel) anti-PDI. Source data are available for this figure: SourceData FS2.

CTxA1 is in proximity to IRE1α in live cells. Volcano plot showing enrichment of biotinylated proteins for cells expressing CTxA1-APEXKDEL compared with cells expressing APEXKDEL. ER proteins known to be involved in CTx pathophysiology and ER stress sensors are shown as purple symbols. The line represents an adjusted P value of 0.01.
CTxA1 is in proximity to IRE1α in live cells. Volcano plot showing enrichment of biotinylated proteins for cells expressing CTxA1-APEXKDEL compared with cells expressing APEXKDEL. ER proteins known to be involved in CTx pathophysiology and ER stress sensors are shown as purple symbols. The line represents an adjusted P value of 0.01.
CTxA1 directly binds IRE1αLD in vitro
To test for a direct interaction between CTxA1 and IRE1α, we purified recombinant IRE1αLD (S24-D443), CTxA1, and CTxB and measured their binding in solution by microscale thermophoresis (MST). At 23°C, increasing concentrations of CTxA1 resulted in a change in the MST response (ΔFnorm), but only at high concentrations indicating a very weak interaction (Fig. 3 A). Since CTxA1 becomes progressively destabilized at physiologic temperatures (Pande et al., 2007), we also measured binding at 37°C, which approximates the melting temperature (TM) for CTxA1 as assessed by differential scanning fluorimetry using Sypro Orange (TM = 38°C, Fig. 3 B). Under these conditions, CTxA1 bound IRE1α with an apparent affinity of 8 μM (6–11 μM 95% confidence interval (CI) range; Fig. 3 C and Data S2). This apparent affinity was similar to that measured for other unstable proteins that bind IRE1αLD (Guttman et al., 2022; Karagöz et al., 2017). These results were validated using a fluorescence anisotropy assay, where we found that IRE1αLD bound CTxA1 at 37°C with an apparent affinity of 17 μM (8–40 μM 95% CI range; Fig. 3 D and Data S2). Such binding in vivo is biologically plausible given the mass of CTx expected to enter the ER of host cells expressing even just modest levels of the toxin’s glycosphingolipid receptor GM1 (see Materials and methods for calculations and assumptions). The CTxB subunit, however, which carries CTxA1 into the ER lumen, did not bind IRE1αLD in either assay (Fig. 3, A, C, and D)—demonstrating specificity for the CTxA1–IRE1αLD interaction. Thus, the IRE1αLD directly and selectively binds to an unstable conformation of CTxA1 in vitro.

CTxA1 binds directly to IRE1α LD in vitro. (A) Response curves for binding of (purple symbols) CTxA1 or (green symbols) CTxB to IRE1αLD measured by microscale thermophoresis at 23°C. Symbols represent mean ± SEM of four independent measures and lines represent nonlinear fit of one-site binding model. (B) Thermal denaturation profile for CTxA1 measured by differential scanning fluorimetry with Sypro Orange. Data are shown as the first derivative of the fluorescence intensity versus temperature, with peak representing melting transition. (C) Same as in A but measured at 37°C. (D) Response curve for binding of IRE1αLD to fluorescently labeled (purple symbols) CTxA1 or (green symbols) CTxB measured by fluorescence anisotropy at 37°C. Symbols represent mean ± range from two independent experiments. Lines represent nonlinear fit of a one-site binding model.
CTxA1 binds directly to IRE1α LD in vitro. (A) Response curves for binding of (purple symbols) CTxA1 or (green symbols) CTxB to IRE1αLD measured by microscale thermophoresis at 23°C. Symbols represent mean ± SEM of four independent measures and lines represent nonlinear fit of one-site binding model. (B) Thermal denaturation profile for CTxA1 measured by differential scanning fluorimetry with Sypro Orange. Data are shown as the first derivative of the fluorescence intensity versus temperature, with peak representing melting transition. (C) Same as in A but measured at 37°C. (D) Response curve for binding of IRE1αLD to fluorescently labeled (purple symbols) CTxA1 or (green symbols) CTxB measured by fluorescence anisotropy at 37°C. Symbols represent mean ± range from two independent experiments. Lines represent nonlinear fit of a one-site binding model.
IRE1αLD detects a metastable region of CTxA1 that locally unfolds
We next asked if the global unfolding of CTxA1 was required for recognition by IRE1αLD. At physiologic temperatures, the conformation of CTxA1 is stabilized in the intact holotoxin by assembly with the C-terminal fragment of the A-subunit (termed the CTxA2 peptide) (Pande et al., 2007) and the CTxB subunit (Goins and Freire, 1988). Consistent with previous results (Goins and Freire, 1988), we found that CTxA in the intact holotoxin had a melting temperature of ∼50°C (Fig. 4 A). This was 12°C higher than the melting temperature observed for the CTxA1 subunit alone (Fig. 3 B), indicating a more stable folded conformation. As such, we hypothesized that if global unfolding of purified CTxA1 was required for binding to IRE1α at 37°C, stabilization of the CTxA1-fold by assembly in the holotoxin would impair binding. We found, however, that the CTx holotoxin was able to bind IRE1αLD at low micromolar apparent affinity, similar to that of the CTxA1-chain alone (Fig. 4 B). We note that in this study, the MST changes measured at high holotoxin concentrations likely reflect an element of non-specific binding as evidenced by a better fit to a one-site binding model that includes a non-specific contribution (Data S2). The results show that the global unfolding of CTx cannot be required for recognition by IRE1α.

Global unfolding of CTxA1 is not required for binding to IRE1α LD . (A) Thermal denaturation profiles for CTx (purple line) and CTxB (green line) measured by differential scanning fluorimetry with Sypro Orange. Data are shown as the first derivative of the fluorescence intensity versus temperature, with peaks representing melting transitions. (B) The response curve for CTx holotoxin binding to IRE1αLD measured by MST at 37°C. Symbols represent mean ± range from two independent experiments and lines represent nonlinear fit of a (solid line) one-site binding model with no non-specific binding and (dashed line) one-site binding model with a linear non-specific binding contribution.
Global unfolding of CTxA1 is not required for binding to IRE1α LD . (A) Thermal denaturation profiles for CTx (purple line) and CTxB (green line) measured by differential scanning fluorimetry with Sypro Orange. Data are shown as the first derivative of the fluorescence intensity versus temperature, with peaks representing melting transitions. (B) The response curve for CTx holotoxin binding to IRE1αLD measured by MST at 37°C. Symbols represent mean ± range from two independent experiments and lines represent nonlinear fit of a (solid line) one-site binding model with no non-specific binding and (dashed line) one-site binding model with a linear non-specific binding contribution.
To determine if any portion of the CTx holotoxin undergoes localized unfolding, we monitored the thermal denaturation of CTx by intrinsic tryptophan fluorescence. The intrinsic fluorescence of tryptophan (Trp) sidechains is quenched upon exposure to solvent, and this enables Trp residues to serve as site-specific probes for regional protein unfolding. CTx had a Trp melting transition below 37°C (Fig. 5 A), suggesting that there is at least one Trp sidechain that becomes solvent-exposed (i.e., unfolded) at physiologic temperatures in the intact holotoxin. While we did not experimentally resolve which Trp residue was involved, we noted that W127 resides in an edge strand of a β-sheet adjacent to a flexible loop that extends along the outer surface of the A1 subunit. This region was previously implicated in binding to the mouse IRE1α lumenal domain (Cho et al., 2013, 2018). To test if this segment bound IRE1αLD, we generated fluorescently labeled peptides of CTxAI124-R141 and sequences surrounding this site (Fig. 5 B). As measured by fluorescence anisotropy, IRE1αLD bound the CTxAI124-L141 peptide with an apparent affinity of 54 μM (43–68 μM 95% CI range; Fig. 5 C and Data S2). IRE1αLD did not appreciably bind other peptides surrounding this site. In subsequent studies discussed below, we further localized the binding determinant to a smaller peptide fragment of the edge β-strand containing Trp127, CTxAI124-F132. This segment is buried in the CTxA1 structure and as such would have to dissociate from the β-sheet (i.e., locally unfold) to bind IRE1αLD. Such local unfolding would be consistent with the observed temperature-dependence of Trp-fluorescence (Fig. 5 A). These results indicate that IRE1αLD detects a metastable region of CTxA1 that locally unfolds.

IRE1α LD detects a region of CTxA1 that locally unfolds. (A) Thermal denaturation profile is shown for intrinsic tryptophan fluorescence intensity (lex = 290; lem = 350 nm) measured for CTx as a function of temperature. Thermal transitions with approximate midpoints of 22.5 and 57.5°C are indicated by dashed lines. (B) Close-up view of CTxA1 ribbon diagram from the crystal structure (PDB accession no. 1xtc [Zhang et al., 1995]) indicating CTxA1 peptides tested for binding to IRE1αLD. (C) Response curves for binding of IRE1αLD to fluorescently labeled CTxA1 peptides measured by fluorescence anisotropy. Symbols represent mean ± SEM from three independent experiments, and the lines represent nonlinear fit of a one-site binding model to the experimental data.
IRE1α LD detects a region of CTxA1 that locally unfolds. (A) Thermal denaturation profile is shown for intrinsic tryptophan fluorescence intensity (lex = 290; lem = 350 nm) measured for CTx as a function of temperature. Thermal transitions with approximate midpoints of 22.5 and 57.5°C are indicated by dashed lines. (B) Close-up view of CTxA1 ribbon diagram from the crystal structure (PDB accession no. 1xtc [Zhang et al., 1995]) indicating CTxA1 peptides tested for binding to IRE1αLD. (C) Response curves for binding of IRE1αLD to fluorescently labeled CTxA1 peptides measured by fluorescence anisotropy. Symbols represent mean ± SEM from three independent experiments, and the lines represent nonlinear fit of a one-site binding model to the experimental data.
CTxA1 binds IRE1αLD at a site distinct from the MHC-like groove
To determine where CTxA1 binds on IRE1αLD, we first tested the MHC-like groove where misfolded proteins are thought to bind (Fig. 6 A). Mutation of residues in the groove (K121A, Y161A, and Y179A) previously implicated in peptide binding for yeast Ire1p (Credle et al., 2005) destabilized the recombinant human IRE1αLD, and this undermined their use for our in vitro binding studies. As an alternative approach, we expressed and purified the IRE1αLD D123P mutant that disrupts IRE1αLD dimerization and assembly of the MHC-like groove (Zhou et al., 2006). IRE1αLD D123P eluted later than WT IRE1αLD on gel filtration, consistent with impaired dimerization (Fig. 6 B). However, the D123P mutation did not impair binding to CTxA1 (Fig. 6 C, left panel) or to the CTxAI124-R141 peptide (Fig. 6 C, right panel). Thus, CTxA1 does not appear to bind IRE1αLD within the MHC-like groove.

Disruption of IRE1α LD dimerization interface and MHC-like groove does not impair binding of CTxA1. (A) Cartoon of IRE1αLD crystal structure (PDB accession no. 2hz6 [Zhou et al., 2006]). The dimerization interface, MHC-like groove, and resolved segment (residues 358–368) of C-terminal flexible loop and tail domain are indicated. (B) Gel filtration profiles for WT (dark purple) and D123P (light purple) IRE1αLD were measured by the absorbance at 280 nm (A280). Chromatograms are shown as the normalized absorbance relative to the maximum within the trace. (C) Left panel: Response curves for CTxA1 binding to WT (dark purple symbols) and D123P (light purple symbols) IRE1αLD measured by MST at 30°C. Symbols represent mean ± range for two independent measures, and lines represent nonlinear fit of a one-site binding model. (C) Right panel: Response curves for binding of IRE1αLD(D123P) to indicated CTxA1 peptides measured by fluorescence anisotropy. Symbols represent measures from a single experiment, and lines represent nonlinear fit of a one-site binding model.
Disruption of IRE1α LD dimerization interface and MHC-like groove does not impair binding of CTxA1. (A) Cartoon of IRE1αLD crystal structure (PDB accession no. 2hz6 [Zhou et al., 2006]). The dimerization interface, MHC-like groove, and resolved segment (residues 358–368) of C-terminal flexible loop and tail domain are indicated. (B) Gel filtration profiles for WT (dark purple) and D123P (light purple) IRE1αLD were measured by the absorbance at 280 nm (A280). Chromatograms are shown as the normalized absorbance relative to the maximum within the trace. (C) Left panel: Response curves for CTxA1 binding to WT (dark purple symbols) and D123P (light purple symbols) IRE1αLD measured by MST at 30°C. Symbols represent mean ± range for two independent measures, and lines represent nonlinear fit of a one-site binding model. (C) Right panel: Response curves for binding of IRE1αLD(D123P) to indicated CTxA1 peptides measured by fluorescence anisotropy. Symbols represent measures from a single experiment, and lines represent nonlinear fit of a one-site binding model.
To identify alternative sites where CTxA1 might bind, we inspected the IRE1αLD crystal structure. We noted a resolved segment of IRE1α (residues 358-YWLLIGHHETP-368) of the otherwise unresolved C-terminal flexible loop (308–357) and tail (369–390) that was docked within a pocket on the lumenal domain distal from the primary dimerization interface and MHC-like groove (Fig. 6 A, PDB accession nos. 2hz6 and 6shc) (Amin-Wetzel et al., 2019; Zhou et al., 2006). Residues Y358–P368 adopted an extended conformation anchored by backbone hydrogen bonds to a β-hairpin formed by T281-H301 (G363-NH:V286-O, G363-O:V286-NH, H364-O:V307-NH, H365-NH:L284-O, and H365-O:L284-NH) and by the side chains of I362, H364, H365, and P368, which occupied surface pockets or indentations (Fig. 7 A). When tested in vitro, IRE1αLD bound a synthetic peptide of this segment (IRE1αY358-L369) with an apparent affinity of 240 μM (180–330 μM 95% CI range; Fig. 7 B and Data S2), which was substantially weaker than the apparent affinity for the CTxA1 subunit or CTxA1 peptides binding to IRE1α. Mutations predicted to disrupt backbone hydrogen bonding (G363P/H365P) and side chain interactions (I362G/H364G/P368G) of the IRE1αY358-L369 segment with the IRE1αLD pocket impaired binding (Fig. 7 B).

CTxA1 binds a protected pocket on the C-terminus of IRE1α LD distal from the dimerization interface and MHC-like groove. (A) Left and middle panels: Close-up structural representations of the interactions between IRE1α residues Y358-P368 with a pocket on the lumenal domain. (Right panel: Schematic illustrating the hydrogen bonding and side chain interactions. (B) Response curves for binding of IRE1αLD to fluorescently labeled IRE1αY358-L369 peptides measured by fluorescence anisotropy; darker and lighter shade symbols represent binding to peptides with wild-type and mutant sequences, respectively. Symbols represent mean ± SEM for three independent measures, and lines represent nonlinear fit of a one-site binding model. (C) Ribbon diagram shows a structural model predicted with AlphaFold2 Multimer for how CTxAI124-F132 may bind core IRE1αLD(S24-V307). (D) Response curves for binding of IRE1αLD to fluorescently labeled CTxAI124-F132 and CTxAH131-L139 peptides measured by fluorescence anisotropy; darker and lighter shade symbols represent binding to peptides with wild-type and mutant sequences, respectively. Symbols represent mean ± SEM for three independent measures, and lines represent nonlinear fit of a one-site binding model. (E) Response curves for the change in anisotropy of CTxAI124-F132 bound to IRE1αLD by displacement with unlabeled WT or mutant IRE1αY358-L369 peptides. Data are presented as the difference in anisotropy for CTxAI124-F132+IRE1αLD and CTxAI124-F132 alone. Symbols represent mean ± SEM for 3–4 independent experiments, and lines represent best fit to either an inhibitor versus response model or a horizontal line. (F) Left panel: Response curves for CTxA1 binding to WT (dark purple symbols) and Δ308–357 (light purple symbols) IRE1αLD measured by MST at 30°C. Symbols represent mean ± range for two independent measures (WT) or individual measures with all data points shown from two independent experiments (Δ308–357), and lines represent nonlinear fit of a one-site binding model. Right panel: Response curves for WT and Δ308–357 IRE1αLD binding to fluorescently labeled CTxAI124-R141 peptides. Symbols represent a single measurement, and lines represent nonlinear fit of a one-site binding model.
CTxA1 binds a protected pocket on the C-terminus of IRE1α LD distal from the dimerization interface and MHC-like groove. (A) Left and middle panels: Close-up structural representations of the interactions between IRE1α residues Y358-P368 with a pocket on the lumenal domain. (Right panel: Schematic illustrating the hydrogen bonding and side chain interactions. (B) Response curves for binding of IRE1αLD to fluorescently labeled IRE1αY358-L369 peptides measured by fluorescence anisotropy; darker and lighter shade symbols represent binding to peptides with wild-type and mutant sequences, respectively. Symbols represent mean ± SEM for three independent measures, and lines represent nonlinear fit of a one-site binding model. (C) Ribbon diagram shows a structural model predicted with AlphaFold2 Multimer for how CTxAI124-F132 may bind core IRE1αLD(S24-V307). (D) Response curves for binding of IRE1αLD to fluorescently labeled CTxAI124-F132 and CTxAH131-L139 peptides measured by fluorescence anisotropy; darker and lighter shade symbols represent binding to peptides with wild-type and mutant sequences, respectively. Symbols represent mean ± SEM for three independent measures, and lines represent nonlinear fit of a one-site binding model. (E) Response curves for the change in anisotropy of CTxAI124-F132 bound to IRE1αLD by displacement with unlabeled WT or mutant IRE1αY358-L369 peptides. Data are presented as the difference in anisotropy for CTxAI124-F132+IRE1αLD and CTxAI124-F132 alone. Symbols represent mean ± SEM for 3–4 independent experiments, and lines represent best fit to either an inhibitor versus response model or a horizontal line. (F) Left panel: Response curves for CTxA1 binding to WT (dark purple symbols) and Δ308–357 (light purple symbols) IRE1αLD measured by MST at 30°C. Symbols represent mean ± range for two independent measures (WT) or individual measures with all data points shown from two independent experiments (Δ308–357), and lines represent nonlinear fit of a one-site binding model. Right panel: Response curves for WT and Δ308–357 IRE1αLD binding to fluorescently labeled CTxAI124-R141 peptides. Symbols represent a single measurement, and lines represent nonlinear fit of a one-site binding model.
We then noted in the crystal structure of CTx that the CTxAI124-F132 sequence (124-IYGWYRVHR-132) formed part of an extended sheet-like structure of the CTxA1 chain that could mimic the backbone and side chain interactions of the endogenous IRE1αY358-P368 (YWLLIGHHETP) fragment. We tested this idea computationally using AlphaFold2 Multimer (Evans et al., 2021, Preprint; Mirdita et al., 2022) and found that a CTxAI124-F132 peptide was predicted to associate with the core IRE1αLD (S24-V307) in a similar manner as the endogenous IRE1αY358-P368 fragment (Fig. 7 C). To test this prediction experimentally, we first used truncated peptides to localize CTxA1 binding to CTxAI124-F132 (Fig. 7 D). We then introduced the GPGPxxG mutations in CTxAI124-F132 peptide, and this abolished binding (Fig. 7 D). Furthermore, mutation of just the central W127–Y128 residues in CTxAI124-F132 to glycine to remove the side chains predicted to occupy pockets of IRE1αLD below and above the strand also abolished binding (Fig. 7 D). These results imply that CTxA1 binds to the same pocket normally occupied by the endogenous IRE1αY358-P368 fragment and located distally from the MHC-like groove.
Two approaches were taken to substantiate that interpretation. First, we performed a competition assay to test the prediction that the endogenous IRE1αY358-P368 fragment should inhibit the binding of labeled CTxAI124-F132 to IRE1αLD. Titration of unlabeled IRE1αY358-L369 peptide resulted in an IRE1αLD-dependent loss of fluorescence anisotropy for labeled CTxAI124-F132 (Fig. 7 E, left panel), consistent with the IRE1αY358-L369 peptide competing with CTxAI124-F132 for binding IRE1αLD. However, the interpretation of the competition data was potentially confounded by a substantial increase in CTxAI124-F132 anisotropy upon titration of unlabeled IRE1αY358-L369 peptide into the binding reaction in the absence of IRE1αLD (Fig. S3). This suggests that the two peptides interact, which on its own could, in principle, inhibit the binding of CTxAI124-F132 to IRE1αLD through a mechanism distinct from competitive inhibition at the proposed binding site. That possibility, however, we find unlikely as the peptide-to-peptide interaction displayed at least a 10-fold weaker affinity compared with either peptide alone binding to IRE1αLD (Fig. S3, left panel, and Fig. 7, B and D). The mutated IRE1αY358-L369 peptide (lacking binding affinity for IRE1αLD) did not interact with CTxAI124-F132 alone, and the mutant peptide had no apparent competitive effect on CTxAI124-F132 binding to IRE1αLD as predicted (Fig S3, right panel and Fig. 7 E, right panel).

Endogenous IRE1α peptide IRE1αY358-L369 displaces CTxAI124-F132 from IRE1αLD and interacts with CTxAI124-F132. Fluorescence anisotropy measured for labeled CTxAI124-F132 (50 nM) in the (dark purple) presence or (light purple) absence of IRE1αLD (50 μM) and the indicated concentrations of unlabeled IRE1αY358-L369 peptides. The left panel was with WT IRE1α peptide, and the right panel was with GPGPxxG mutant IRE1α peptide. Symbols represent mean ± SEM for four experiments.
Endogenous IRE1α peptide IRE1αY358-L369 displaces CTxAI124-F132 from IRE1αLD and interacts with CTxAI124-F132. Fluorescence anisotropy measured for labeled CTxAI124-F132 (50 nM) in the (dark purple) presence or (light purple) absence of IRE1αLD (50 μM) and the indicated concentrations of unlabeled IRE1αY358-L369 peptides. The left panel was with WT IRE1α peptide, and the right panel was with GPGPxxG mutant IRE1α peptide. Symbols represent mean ± SEM for four experiments.
In a second and alternative approach, we mutated the IRE1αLD to remove the C-terminal flexible loop (residues 308–357) immediately adjacent to the IRE1αY358-P368 fragment. Although the structure of this loop (308–357) has not been experimentally determined, it can be expected that its removal may affect how the adjacent IRE1αY358-P368 fragment will assemble with the IRE1αLD. We found that the IRE1αLDΔ308–357 mutant bound to both CTxA1 and the CTxAI124-R141 peptide with higher apparent affinity (i.e., stronger binding) compared with wild-type IRE1αLD (Fig. 7 E and Data S2)—consistent with exposure of the binding site normally occupied by the IRE1αY358-P368 fragment.
From these computational predictions and experimental results, we conclude that the CTxAI124-F132 peptide binds IRE1αLD in a similar way as the endogenous IRE1αY358-P368 fragment and at the same site, which is distal from the MHC-like groove and normally occupied (and protected) by the endogenous IRE1αY358-P368 fragment.
Binding of CTxA1 is linked to IRE1α activation in live cells
To test if the binding of CTxA1 leads to activation of IRE1α in live cells, we expressed and purified a mutant CTx with a single Y128G substitution predicted to disrupt the CTxAI124-F132 binding motif. This mutant was studied as we were unable to obtain sufficient yields of toxins with the GPGPxxG or W127G/Y128G mutations. Validating this approach, we found that the CTxA binding fragment containing the single Y128G mutation had ∼10-fold lower apparent affinity for binding to IRE1αLD in vitro as compared with the WT CTxAI124-F132 fragment (Fig. 8 A). When applied to human T84 intestinal cell monolayers, the CTxA Y128G mutant toxin failed to activate IRE1α as assessed by XBP1 splicing and expression of the XBP1-target gene ERDJ4 compared with cells treated with WT CTx (Fig. 8 B). The same results were obtained using human embryonic kidney HEK293 cells (Fig. 8 C). Thus, binding of CTxA1 to IRE1αLD via the CTxAI24-F132 motif activates IRE1α in intact cells.

Binding of CTxA1 is linked to IRE1α activation in live cells. (A) Response curve for binding of IRE1αLD to CTxAI124-F132 peptide with WT sequence, GPGPxxG mutation, and Y128G mutation. Symbols represent mean ± range from two independent experiments (error bars are smaller than the size of the symbols), and lines represent nonlinear fit of a one-site binding model to the experimental data. (B and C) Bar graph shows the relative expression of (B) spliced XBP1 mRNA and ERdj4 mRNA in T84 cells and (C) spliced XBP1 mRNA in HEK293 cells treated with PBS, WT CTx, or CTx with Y128G mutation in A subunit. Symbols represent mean values from independent experiments (each with two to four replicate samples within an experiment). Bars represent mean ± SEM, and mean values were compared by one-way ANOVA.
Binding of CTxA1 is linked to IRE1α activation in live cells. (A) Response curve for binding of IRE1αLD to CTxAI124-F132 peptide with WT sequence, GPGPxxG mutation, and Y128G mutation. Symbols represent mean ± range from two independent experiments (error bars are smaller than the size of the symbols), and lines represent nonlinear fit of a one-site binding model to the experimental data. (B and C) Bar graph shows the relative expression of (B) spliced XBP1 mRNA and ERdj4 mRNA in T84 cells and (C) spliced XBP1 mRNA in HEK293 cells treated with PBS, WT CTx, or CTx with Y128G mutation in A subunit. Symbols represent mean values from independent experiments (each with two to four replicate samples within an experiment). Bars represent mean ± SEM, and mean values were compared by one-way ANOVA.
Other proteins implicated in IRE1α activation contain a structural motif similar to CTxA1
To test if the features of CTxAI124-F132 and IRE1αY358-L369 that bind IRE1α reflect a general rule for a recognition motif, we searched for similar sequences in other proteins that activate IRE1α signaling. By manual inspection, we found similar sequences in other microbial proteins, such as heat-labile enterotoxin from Escherichia coli, which is structurally and functionally related to CTx (LTx: 124-IYGWYRVNF-132), and the ORF8 accessory protein of SARS-CoV2 (ORF8: 39-IHFYSKWYIR-48)—both of which activate IRE1α in cells (Echavarría-Consuegra et al., 2021; Lu et al., 2017; Rashid et al., 2021). The LTx (apparent affinity 31 μM [13–78 μM 95% CI range]) and ORF8 (apparent affinity 32 μM [17–63 μM 95% CI range]) peptides bound IRE1αLD with similar affinities as CTxAI124-F132, and introduction of the GPGPxxG mutations disrupted binding (Fig. 9, A and B and Data S2). Furthermore, both peptides were predicted by AlphaFold2 Multimer to interact with the core IRE1αLD in a similar manner as CTxAI124-F132 (Fig. S4).

Other proteins implicated in IRE1α activation have structural motifs similar to CTxA1. (A–D) Cartoon representation of crystal structure and response curve for IRE1αLD binding to fluorescently labeled peptides derived from (A) heat-labile enterotoxin (LTx), (B) SARS-CoV2 ORF8, (C) human IgG light chain variable domain (VL), and (D) human myelin oligodendrocyte glycoprotein (MOG) as measured by fluorescence anisotropy. The peptides sequences tested are indicated and shaded on the crystal structure. Symbols represent mean ± SEM for two to three independent measures, and lines represent nonlinear fits of one-site binding models or straight lines to experimental data.
Other proteins implicated in IRE1α activation have structural motifs similar to CTxA1. (A–D) Cartoon representation of crystal structure and response curve for IRE1αLD binding to fluorescently labeled peptides derived from (A) heat-labile enterotoxin (LTx), (B) SARS-CoV2 ORF8, (C) human IgG light chain variable domain (VL), and (D) human myelin oligodendrocyte glycoprotein (MOG) as measured by fluorescence anisotropy. The peptides sequences tested are indicated and shaded on the crystal structure. Symbols represent mean ± SEM for two to three independent measures, and lines represent nonlinear fits of one-site binding models or straight lines to experimental data.

Peptides from proteins that activate IRE1α are predicted to bind at the same site on IRE1α LD as CTxA I124-F132 . Structural models predicted using AlphaFold for binding of peptides from E. coli heat-labile enterotoxin (LTxA), SARS-CoV2 ORF8, human IgG light chain variable domain (VL), and human myelin oligodendrocyte glycoprotein (MOG) bound to human IRE1αLD(S24-V307).
Peptides from proteins that activate IRE1α are predicted to bind at the same site on IRE1α LD as CTxA I124-F132 . Structural models predicted using AlphaFold for binding of peptides from E. coli heat-labile enterotoxin (LTxA), SARS-CoV2 ORF8, human IgG light chain variable domain (VL), and human myelin oligodendrocyte glycoprotein (MOG) bound to human IRE1αLD(S24-V307).
To determine if any human proteins contain a putative IRE1α recognition motif, we performed a blast search of the CTxA1 sequence IYGWYRVHF against all non-redundant human protein sequences. The main hits identified were sequences from immunoglobulin heavy and light chain junction regions, myelin oligodendrocyte glycoprotein (MOG), and titin. An IgG light chain variable domain (VL) with sequence YLAWYQQKP similar to CTxAI124-F132 and the endogenous IRE1αY358-P368 peptide bound IRE1αLD with an apparent affinity of 219 mM (155–337 mM 95% CI)—similar to the binding affinity for the endogenous IRE1αY358-P368 fragment (Fig. 9 C and Data S2). A peptide from MOG (64-MEVGWYRSPFS-74) did not bind appreciably to IRE1αLD (only a very small change in anisotropy was observed), but a longer peptide containing this sequence had a more substantial change in anisotropy consistent with binding to IRE1αLD (Fig. 9 D and Data S2). Interestingly, the VL, MOG, and ORF8 sequences all localized to an edge strand (strand C) of β-sheets in Ig or Ig-like folds.
Discussion
These results support a mechanism of IRE1α activation that involves direct binding between metastable regions of substrate proteins and the IRE1αLD. It is notable that CTxA1 does not bind in the MHC-like groove that extends across the IRE1αLD dimer interface (Credle et al., 2005). This is consistent with an interpretation of the human IRE1α crystal structure where the opening of the groove is constrained (Zhou et al., 2006). Although an allosteric mechanism to overcome the structural constraint has been proposed (Karagöz et al., 2017), introduction of an intermolecular disulfide to covalently close the groove did not block binding of a peptide derived from myelin protein 0 (MPZ) (Amin-Wetzel et al., 2019) shown previously to bind IRE1αLD (Karagöz et al., 2017), suggesting that, at least in some cases, binding sites on IRE1αLD other than the MHC-like groove are needed to detect misfolded proteins.
Our results also define the structural motif contained within the CTxAI124-F132 peptide and in other enterotoxins and viral products co-opting the ER to induce disease that binds IRE1αLD directly. In the case of CTx, this motif activates IRE1α and UPR signal transduction. Notably, the CTxAI124-F132 peptide binds to a β-hairpin on IRE1αLD located in a pocket distal from the dimerization interface responsible for the assembly of the MHC-like groove. Being derived from a β-strand in the folded toxin, the CTxAI124-F132 peptide could in principle pair with the β-hairpin on IRE1αLD to form an extended β-sheet within the pocket. The binding pocket, however, as resolved in the crystal structures of IRE1αLD, is normally occupied by the IRE1αY358-P368 peptide, which contains the same structural elements defining the CTxA1 binding motif. Thus, as part of the IRE1αLD C-terminal flexible loop and the tail, the IRE1αY358-P368 fragment may gate access of CTxA1, and other metastable substrates, to the β-hairpin pocket. This would necessitate CTxA1 competing for and/or displacing the flexible loop to bind IRE1αLD. We find this biologically plausible as CTxA1 has ∼10-fold higher apparent affinity for binding IRE1αLD than the endogenous IRE1αY358-P368 peptide.
The binding of such misfolded/metastable proteins to the protected pocket on IRE1αLD is also supported by a crystal structure of the closely related sensor PERK/EIF2AK3. That structure revealed an exogenous peptide (P16) bound to a similar site on PERKLD (Fig. S5 [Wang et al., 2018]). The peptide occupying the PERK binding pocket, however, lacks the IRE1α recognition motif, and we found that it did not bind IRE1αLD when tested in vitro (Fig. S5)—implying differences in specificity for substrate recognition by the IRE1α and PERK ER-stress sensors. We emphasize here that other sequences or structural motifs may bind different sites on IRE1αLD, including within the MHC-like groove.

A peptide binds PERKLD at a similar site distal from the dimerization interface but does not bind IRE1αLD. (A) Cartoon representation of crystal structure of PERK lumenal domain (PDB accession no. 5v1d). Location of the dimer interface and the exogenous P16 peptide (in red) are indicated. (B) Response curve for binding of IRE1αLD to P16, CTxAI124-R141, and CTxAP13-Y30 peptides measured by fluorescence anisotropy. Symbols represent mean values from two independent experiments (CTxA peptides) or measures from a single experiment (P16 peptide).
A peptide binds PERKLD at a similar site distal from the dimerization interface but does not bind IRE1αLD. (A) Cartoon representation of crystal structure of PERK lumenal domain (PDB accession no. 5v1d). Location of the dimer interface and the exogenous P16 peptide (in red) are indicated. (B) Response curve for binding of IRE1αLD to P16, CTxAI124-R141, and CTxAP13-Y30 peptides measured by fluorescence anisotropy. Symbols represent mean values from two independent experiments (CTxA peptides) or measures from a single experiment (P16 peptide).
The sequences we found to bind IRE1αLD were derived from edge strands of β-sheets, suggesting that IRE1α may serve as a sensor of metastable unpaired β-strands containing the recognition motif. This must be true for CTx, where the motif locates to the edge strand of a metastable β-sheet fold that must locally unfold to expose the CTxAI124-F132 motif for binding to IRE1αLD. We hypothesize that the toxin may have evolved, at least in part, for this edge strand to readily dissociate at physiologic temperatures from the rest of the β-sheet for recognition by IRE1α and induction of the UPR, thus enhancing the chances for CTx retro-translocation to the cytosol by amplifying ERAD. This model would apply generally to other enterotoxins and viruses (like SARS-CoV-2 ORF8) co-opting ERAD or other functions of the ER to invade the host cell.
In the case of endogenous proteins synthesized in the ER, we also found the recognition motif in the edge strand of certain Ig domains, including those of antibodies. The motif located to regions of Ig domains that are dynamic and relatively unstable (Mukherjee et al., 2017; Weber et al., 2018). And given the sheet topology of Ig domains, strand C containing the IRE1α recognition motif must emerge in the ER lumen initially unpaired—pending synthesis of the neighboring strands, which are distant in sequence. Thus, IRE1α may recognize these strands to prevent their aggregation during translation, or to signal upregulation of protein folding capacity, or both. This would have important functional and evolutionary implications for immune cell types, especially antibody-producing plasma cells. IRE1α is highly expressed in plasma cells (Human Protein Atlas, https://proteinatlas.org; Karlsson et al., 2021), and IRE1α-XBP1s signaling is required for plasma cell maturation (Iwakoshi et al., 2003; Reimold et al., 2001; Shaffer et al., 2004).
Though we define a binding motif and identify a binding pocket leading to activation of IRE1α, our results do not address how binding to this site leads to activation of the IRE1α endonuclease domain. Activation of IRE1α likely involves a variety of oligomeric states required for autophosphorylation and physiologic signaling (Belyy et al., 2022). The decisive factors driving oligomeric assembly originate in IRE1αLD as they respond to lumenal factors in the ER, and the region immediately adjacent to the IRE1αLD recognition motif is implicated in regulating the oligomeric state—likely by providing a second intermolecular interface mediated in some way by residues 359-WLLI-362 (Belyy et al., 2022; Karagöz et al., 2017). We have not tested how the binding of CTxAI124-F132 affects this interface. One possibility is that CTxAI124-F132 displaces IRE1αY358-P368 from its binding pocket, which enables the formation of higher-order oligomers mediated by IRE1αW359-I362 and the preceding flexible loop region.
Of special note is that the ER chaperone BiP/HSPA5 binds the IRE1αLD flexible loop (residues 308–357) immediately adjacent to the IRE1αY358-P368 fragment that appears to gate access of unfolded substrates to the IRE1αLD binding pocket. BiP has been shown to bind this loop and restrain IRE1α in an inactive state (Amin-Wetzel et al., 2017, 2019; Bakunts et al., 2017; Bertolotti et al., 2000; Preissler and Ron, 2019; Vitale et al., 2019). In an alternative model for the mechanism of IRE1α activation, when misfolded proteins accumulate, BiP dissociates from IRE1α to chaperone client proteins, and this has been shown to enable dimerization and activation of IRE1α (Bertolotti et al., 2000). Thus, it is possible that substrate binding to the IRE1α pocket may displace the flexible loop and enable the release of BiP as a necessary step in dimer/oligomer assembly required for IRE1α activation. Alternatively, in response to unfolded protein load, dissociation of BiP from the loop may enable misfolded proteins containing the β-strand binding motif to displace residues Y358-P368 from the binding pocket, thus freeing the loop and tail domain to mediate assembly of the enzymatically active IRE1α configurations. Such mechanisms of action would integrate the two leading models for the regulation of IRE1α signal transduction.
Materials and methods
Cell culture experiments
All cell lines were grown at 37°C and 5% CO2. MEF and HEK293 cell lines were maintained in Dulbecco’s modified Eagle’s medium (DMEM) supplemented with 10% Fetal Bovine Serum (FBS). Human intestinal epithelial T84 cells were maintained in 1:1 DMEM/F12 media supplemented with 6% newborn calf serum. T84 cells were plated on 0.33 cm2 Transwell inserts (3 μm pore size polyester membranes; Corning) and allowed to polarize for 7 days. A volt/Ohm meter (World Precision instrument; EVOM) was used to measure transepithelial electrical resistance to assess monolayer formation. Treatments were applied both in the apical and basolateral compartments. Cells were pretreated with 50 μM 4μ8c or DMSO for 30 min prior to treatment with wild-type or mutant CTx (3–30 nM as indicated in figure legends), CTxB (3–30 nM), thapsigargin (Tg, 0.2–3 μM), or forskolin (FSK, 10 μM) for 4 h. Cells were washed with ice-cold PBS and used for RNA extraction.
To estimate the amount of CTx that enters the ER of polarized T84 cells, we considered treating a 0.33 cm2 monolayer with 167 μl of 20 nM toxin. This corresponds to 3.34 pmol of toxin. If we assume there are 50,000 cells per monolayer and 10% of the toxin gets taken up by the cells (due to saturating GM1 receptors), this corresponds to 0.00668 fmol toxin per cell. Furthermore, if we assume that only 10% of the molecules traffic to the ER, this further reduces the amount of toxin to 0.000668 fmol toxin per cell in the ER. If the volume of a columnar epithelial cell is estimated as 2,000 μm3 (20 × 10 × 10 μm) and the ER is estimated as occupying minimally 10% of the cell, this would give 0.000668 fmol in 200 μm3 (200 fl), which is equal to 3 μM of toxin in the ER of intoxicated cells.
In vivo experiments in mice
All experimental procedures involving mice were approved by Boston Children’s Hospital Institutional Animal Care and Use committee. WT C57BL/6 mice were orally gavaged with PBS (150 μl) or CTx (50 μg in 150 μl PBS). After 4 h, mice were euthanized and the ileum was excised and flushed with ice-cold PBS. The washed ileum was opened longitudinally, cut into several small pieces, and washed several times in PBS for RNA extraction.
XBP1-luciferase reporter assay
XBP1 splicing reporter plasmid (pCAX-HA-2xXBP1-Luc-F) (Iwawaki and Akai, 2006) was provided by T. Iwawaki (Kanazawa Medical University, Uchinada, Japan). pRL SV40 Renilla luciferase reporter vector is available commercially from Promega. HEK293 cells were seeded at 0.5 × 10⁵ cells/well in 96-well clear bottom white plates (Corning) and transfected with inducible luciferase reporter vectors (50 ng pCAX-HA-2xXBP1-Luc-F, 1 ng pRL-SV40-Renilla, and pcDNA4 empty vector), with 100 ng total DNA per well using polyethyleneimine (PEI; linear 25 kDa; Polysciences) at a DNA/PEI mass ratio of 1:3. A non-transfected control was included for correction of background luminescence. At 18–24 h after transfection, cells were pretreated with 4μ8c or DMSO for 30 min before treatment with 3 μM Tg, 3 nM CTx, 3 nM CTxB, or media. At 6 h after treatment, cells were lysed using the Dual-Glo Luciferase Assay System (Promega). Luminescence was measured using a Spark 10M plate reader (Tecan).
Expression analysis by qPCR
RNA was extracted from cells and tissue using RNeasy Mini Kit (Qiagen) with on-column DNA digest (Qiagen) according to the manufacturer’s protocol. Total RNA concentration and quality were assessed by absorbance at 260 nm and the 260/280 nm ratio, respectively. Isolated RNA (500 ng) was reverse transcribed with iScript cDNA Synthesis Kit (BioRad). qPCR was performed using primers (Table S1) and Sso Advanced Universal SYBR Green Supermix (BioRad). Samples were processed as technical triplicates with the number of independent experimental replicates reported in the figure legends. Threshold cycle (Cq) values were measured using the CFX384 Real-Time System (BioRad). The mean expression ratio of the test sample compared with the control sample was calculated by applying the 2−ΔΔCt method. The Cq values for targets were analyzed relative to the geometric mean of the HPRT1, PPIA, and GAPDH housekeeping genes.
Mouse colonoid swelling assay
All housing and procedures involving live vertebrate animals were reviewed and approved by the Boston Children’s Hospital Institutional Animal Care and Use committee. Primary mouse colonoids were generated from Ern1+/+;Ern2−/− mice (C57BL/6 background) as previously described (Grey et al., 2020, 2022). Ern2-deficient mice were used as the epithelial-specific paralogue. IRE1β (ERN2) inhibits IRE1α endonuclease activity (Grey et al., 2020). Briefly, mice were euthanized, the colon excised, lumenal contents were gently removed, and the tissue flushed with ice-cold PBS. The tissue was cut open longitudinally and then into several (2–3 mm) pieces and washed several times in ice-cold PBS. Washed tissue was incubated in PBS with 10 mM EDTA for 45 min with end-over-end rotation. Epithelial cells were dissociated by vigorous shaking for 5–7 min, and the supernatant containing the dissociated crypts was collected and diluted twofold with base media (Advanced DMEM/F12 supplemented with 20% FBS, 10 mM Hepes, 1X Glutamax, 1X penicillin/streptomycin). Collected cells were passed through a 100-μm strainer and filtered through a 40-μm strainer. Intact colon crypts retained on the 40-μm filter were washed and resuspended in base media and pelleted at 300 × g for 3 min. Crypts were resuspended in Matrigel (Corning) on ice and plated in 30-μl drops in 24-well plates. Colonoids were maintained at 37°C and 5% CO2 in complete media (base media supplemented with 50% WRN-conditioned media prepared from L cells expressing Wnt/R-spondin/Noggin (Miyoshi and Stappenbeck, 2013) and 10 μM Y-27632). Media was replaced every other day and cultures were passaged by dissolving the Matrigel using Cell Recovery Solution (Corning), mechanically disrupting by pipetting, pelleting, and resuspending cells in 1.5 to 2-fold more Matrigel.
For experiments, Ern1+/+;Ern2−/− colonoids were pretreated with 50 μM 4μ8c, 5 μg/ml BFA, or DMSO for 30 min prior to treatment with 10 nM CTx, 10 nM CTxB, 100 mM FSK, or media. Organoid swelling was monitored using a BioTek Cytation 5 automated microscopy plate reader set at 37°C and 5% CO2. Brightfield images (2.5× objective) were collected in a 5 × 4 grid over each Matrigel drop every 15 min. Images were processed with ImageJ. Colonoids with a starting volume <2 × 104 pixels3 were analyzed for swelling by measuring the change in diameter of the largest cross-section at each time point.
APEX2 proximity labeling assay
Expression of APEX constructs in HEK293T cells
APEX2 was fused to the C-terminus of the CTxA1 chain containing a signal sequence for expression in the ER and a KDEL motif for retention in the ER. As a negative control, we used an ER-targeted APEX2 construct with a C-terminal KDEL motif. Constructs were expressed by transient transfection in HEK293T or COS7 cells. Localization of both constructs to the ER was verified by confocal microscopy using ER-mCherry to label the ER (Fig. S2 A). Cells were imaged on a Zeiss Axiovert Spinning Disc confocal microscope using a 63X objective. For experiments, constructs were expressed for 24 h, incubated with phenol–biotin for 30 min, and then exposed to H2O2 for 1 min to activate APEX2 and induce proximity biotin-labeling. Lysis and streptavidin pull-down steps were performed, as previously described (Hung et al., 2016). An additional desalting step was performed to remove excess biotin from the lysate before addition to streptavidin magnetic beads (#PI88817; Thermo Fisher Scientific). Samples of the lysate and streptavidin eluate fractions were separated by SDS-PAGE, transferred to nitrocellulose membranes, and probed with neutravidin-HRP (#31030; Thermo Fisher Scientific), anti-HSPA5/BIP (#3177S; Cell Signaling Technologies), and anti-PDI (#2446S; Cell Signaling Technologies) primary antibodies, and HRP-conjugated anti-rabbit IgG secondary antibody (A6154; Sigma-Aldrich). Membranes were developed using SuperSignal West Femto Maximum Sensitivity Substrate (#34096; Thermo Fisher Scientific).
On-bead trypsin digestion of biotinylated proteins
Samples collected and enriched with streptavidin magnetic beads were washed with 200 μl of 50 mM Tris-HCl buffer (pH 7.5) and with 2x 200 μl of 50 mM Tris (pH 7.5) buffer. Samples were incubated in 0.4 mg trypsin in 80 μl of 2 M urea/50 mM Tris buffer with 1 mM DTT for 1 h at room temperature while shaking at 1,000 rpm. Following predigestion, 80 μl of each supernatant was transferred into new tubes. Beads were then incubated in 80 μl of the same digestion buffer for 30 min while shaking at 1,000 rpm. The supernatant was transferred to the tube containing the previous elution. The beads were washed twice with 60 μl of 2 M urea/50 mM Tris buffer, and these washes were combined with the supernatant. The eluates were spun down at 5,000 × g for 30 s and the supernatant was transferred to a new tube. Samples were reduced with 4 mM DTT for 30 min at room temperature with shaking. Following reduction, samples were alkylated with 10 mM iodoacetamide for 45 min in the dark at room temperature. An additional 0.5 mg of trypsin was added, and samples were digested overnight at room temperature while shaking at 700 × g. Following overnight digestion, samples were acidified (pH < 3) with neat formic acid (FA) to a final concentration of 1% FA.
TMT labeling and fractionation
Desalted peptides were labeled with TMT10 reagents (Thermo Fisher Scientific). Peptides were resuspended in 80 μl of 50 mM HEPES and labeled with 20 μl 25 mg/ml TMTpro18 reagents in ACN. Samples were incubated at RT for 1 h with shaking at 1,000 rpm. TMT reaction was quenched with 4 μl of 5% hydroxylamine at room temperature for 15 min with shaking. TMT-labeled samples were combined, dried to completion, reconstituted in 100 μl of 0.1% FA, and desalted on StageTips. TMT-labeled peptide sample was fractionated by SCX StageTips to create three final fractions as previously described (Li et al., 2020). Eluted peptides were dried to completion.
Liquid chromatography and mass spectrometry
All peptide samples were separated with an online nanoflow Proxeon EASY-nLC system (Thermo Fisher Scientific) and analyzed on an Orbitrap Lumos mass spectrometer (Thermo Fisher Scientific). Each sample was injected onto an inhouse packed 20 cm × 75 μm internal diameter C18 silica picofrit capillary column (1.9 μm ReproSil-Pur C18-AQ beads, Dr. Maisch GmbH, r119.aq; PicoFrit 10 μm tip opening, New Objective, PF360-75-10-N-5). The mobile phase flow rate was 200 nl/min, comprised of 3% acetonitrile/0.1% formic acid (Solvent A) and 90% acetonitrile/0.1% formic acid (Solvent B). The 110-min LC–MS/MS method used the following gradient profile: (min:%B) 0:2, 1:6; 85:30; 94:60; 95:90; 100:90; 101:50; 110:50 (the last two steps at 500 nl/min flow rate). Data acquisition was done in the data-dependent mode acquiring HCD MS/MS scans (r = 50,000) after each MS1 scan (r = 60,000) using a top-speed approach (cycle time 2 s) to trigger MS/MS. The maximum ion time utilized for MS/MS scans was 105 ms; the HCD-normalized collision energy was set to 38; the dynamic exclusion time was set to 45 s; and charge exclusion was enabled for charge states that were unassigned, 1 and >6.
Analysis of mass spectrometry data (peptide level, protein level)
Mass spectrometry data was processed using Spectrum Mill v 7.08 (https://proteomics.broadinstitute.org). For all samples, extraction of raw files retained spectra within a precursor mass range of 750–6,000 Da and a minimum MS1 signal-to-noise ratio of 25. MS1 spectra within a retention time range of ±60 s or within a precursor m/z tolerance of ±1.4 m/z were merged. MS/MS searching was performed against a human Uniprot database containing APEX2 construct sequences and common laboratory contaminants. Digestion parameters were set to “trypsin allow P” with an allowance of four missed cleavages. The MS/MS search included fixed modification of carbamidomethylation on cysteine. TMT10 was searched using the “TMT10-Full-Lys” option. Variable modifications were acetylation and oxidation of methionine. Restrictions for matching included a minimum matched peak intensity of 30% and a precursor and product mass tolerance of ± 20 ppm.
Peptide spectrum matches (PSMs) were validated using a maximum false discovery rate (FDR) threshold of 1.2% for precursor charges two through six within each LC-MS/MS run. Protein polishing autovalidation was further applied to filter the PSMs using a target protein–level FDR threshold of zero. TMT10 reporter ion intensities were corrected for isotopic impurities in the Spectrum Mill protein/peptide summary module using the afRICA correction method which implements determinant calculations according to Cramer’s Rule. We required fully quantified unique human peptides for protein quantification. We used the Proteomics Toolset for Integrative Data Analysis (Protigy, v1.0.4, Broad Institute, https://github.com/broadinstitute/protigy) to calculate moderated t test P values for regulated proteins.
Expression and purification of recombinant proteins
All plasmids were constructed using standard restriction enzyme-based molecular cloning. In most cases, insert DNA was synthesized as gene blocks with 5′ and 3′ restriction sites added (IDT). Inserts and plasmids were digested with restriction enzymes (New England BioLabs), gel purified (GeneJet Gel Extraction Kit; Thermo Fisher Scientific), and ligated (Quick Ligation Kit; New England BioLabs). Ligated products were transformed into NEB5alpha cells and grown on LB Agar plates with appropriate antibiotic selection. Positive clones were identified by restriction digest and sequencing. Mutations were introduced by either including the mutation in the synthesized DNA insert or by site-directed mutagenesis (Agilent).
GST-IRE1αLD (S24-D443) was expressed from pGEX-TEV vector in BL21(DE3) pLysS E.coli (Invitrogen). Expression was induced in log-phase cultures (OD600 = 0.6–1.0) with 0.4 mM IPTG and incubation at 16°C for 16–20 h. Cultures were harvested by centrifugation at 5,000 × g for 10 min at 4°C. The pellet was resuspended in 1X PBS, 0.5% Triton X-100, and 1x Complete protease inhibitor (Sigma-Aldrich), and then homogenized using Emulsiflex C5 homogenizer (Avestin) at 5,000 psi. Lysate was cleared by centrifugation at 15,000 × g for 10 min, and the supernatant was collected. GST-IRE1αLD was bound to glutathione agarose (GoldBio) for 1 h at 4°C. The slurry was transferred to Econo-Pac chromatography column (BioRad) and washed three times with 20 ml wash buffer (1X PBS). IRE1αLD was eluted using TEV protease diluted in 2x TEV buffer (50 mM Tris pH 8, 1 mM EDTA, 2 mM DTT) overnight at 4°C. In some cases, the sample was further purified by anion exchange chromatography. Samples were dialyzed into 50 mM Tris pH 8.0, loaded onto a HiTrap Q HP column (Cytiva), equilibrated with buffer A (50 mM Tris pH 8.0, 5 mM β-mercaptoethanol), and eluted with buffer B (buffer A with 1 M NaCl). Fractions containing IRE1αLD were identified by reducing SDS-PAGE and Coomassie staining (Fisher), pooled, concentrated (Amicon Ultra 4 and 0.5 ml 10 kDa; Millipore), and injected on a Superdex 200 10/300 (Cytiva) gel-filtration column equilibrated with running buffer (1X PBS pH 7.4, 1 mM DTT). Fractions containing protein were identified by reducing SDS-PAGE, and the bands were excised for protein identification by mass spectrometry (Taplin Mass Spectrometry Facility, Harvard Medical School).
His6-IRE1αLD and His6-CTxA1 constructs were expressed from the pET28a vector in BL21(DE3) E. coli. Expression was induced in log-phase cultures with 0.4 mM IPTG and incubation at 16°C for 16–20 h. Bacteria cells were isolated and lysed as described above. His-tagged proteins were affinity purified by binding to cobalt resin (GoldBio) equilibrated in 1X PBS. His-tagged constructs were eluted from resin with 50 mM Tris pH 8.0, 150 mM NaCl, and 250 mM imidazole. Samples were further purified by anion exchange chromatography, and gel filtration chromatography as described above for GST-IRE1αLD.
CTxB was expressed from the pET28a vector in Shuffle T7 Express E. coli (New England BioLabs). Protein expression, harvesting, and cell lysis were performed as described above. CTxB was affinity-purified by binding to cobalt resin and elution with 50 mM Tris pH 8.0, 150 mM NaCl, and 250 mM imidazole. Following affinity purification, CTxB was further purified by cation exchange chromatography on a HiTrap SP HP column (Cytiva) equilibrated with buffer A (5 mM Na2PO4 pH 7.0). The bound sample was eluted with a linear gradient with buffer B (5 mM Na2PO4 pH 7.0, 1 M NaCl). CTxB-containing fractions were pooled, concentrated, and further purified by gel filtration on Superdex 200 in 1X PBS pH 7.4.
Intact CTx holotoxins (WT, CTxA R192G, and CTxA Y128G) were prepared by expression of CTxA and CTxB from a bicistronic insert in the pBAD expression vector. Both A and B subunits had a heat-labile enterotoxin signal peptide at the N-terminus to target expressed protein to the periplasm. Expression was induced in DH10b cells using 0.5% arabinose for 3 h at 37°C, or 16–20 h at room temperature. Cultures were harvested by centrifuging at 5,000 × g for 10 min at 4°C. The cell pellet was resuspended in 50 mM NaHPO4, 300 mM NaCl, pH 7.0, and 1X Complete Protease Inhibitor, and treated with 0.5 mg/ml polymyxin b sulfate for 1 h at room temperature to disrupt the outer membrane and release proteins from the periplasmic space. The periplasmic fraction was isolated by centrifugation at 15,000 × g for 10 min, and the supernatant was collected. Intact holotoxin was affinity-purified by binding to cobalt resin for 1 h at 4°C, transferring to an Econo-Pac chromatography column, washing three times with 20 ml wash buffer (50 mM Na2HPO4, 300 mM NaCl, and 10 mM imidazole), and elution with 300 mM imidazole in wash buffer. Eluted protein was buffer exchanged into 50 mM Tris pH 8.5, loaded on a HiTrapQ column, and eluted with a linear gradient with 50 mM Tris pH 8.5, 1 M NaCl. Pooled fractions containing both CTxA and CTxB were concentrated and loaded on a Superdex 200 gel filtration column and eluted with 1X PBS pH 7.3 to separate intact holotoxin (CTxA + CTxB) from free CTxB.
Thermal stability assays
The thermal stability of CTx was assayed by circular dichroism (CD) spectroscopy and differential scanning fluorimetry (DSF). CD experiments were performed on a J-810 spectrometer (Jasco). Measurements were performed on 300 μl of 1 μM CTx in PBS. Spectra were recorded from 200 to 280 nm at temperatures of 18–65°C, and samples were equilibrated for 10 min at each temperature before measurement. The global unfolding of CTx was monitored by DSF using Sypro Orange (Thermo Fisher Scientific) on a CFX96 Real-time qPCR instrument (BioRad). Melting curves were collected in a 96-well plate with 1 μM CTxA1, CTx, or CTxB, and 5X Sypro Orange dye in PBS pH 7.4 (20 μl reaction volume). Fluorescence was measured using the FRET channel at temperatures of 25–95°C in 0.5°C increments and averaged over four independent samples. Melting transitions were identified as the peaks of the first derivative of fluorescence intensity as a function of temperature. The localized unfolding of CTx was assayed by DSF using intrinsic tryptophan fluorescence measured on a Fluorlog-3 spectrofluorometer (Horiba) equipped with a Peltier thermostatted cuvette holder. Samples contained 1 μM CTx or CTxB in 250 μl of PBS. Tryptophan fluorescence was measured by excitation at 295 nm with emission scans from 300 to 500 nm at temperatures of 10–78°C in increments of 5°C, and samples were equilibrated for 10 min at each temperature step. Fluorescence intensity at 350 nm was averaged over three independent measures and plotted as a function of temperature. Melting transitions were estimated by the first derivative of fluorescence intensity at 350 nm as a function of temperature.
In vitro binding by microscale thermophoresis (MST)
IRE1αLD was labeled using the Monolith NT protein labeling Kit Red-Maleimide (NanoTemper). The concentration of the labeled IRE1αLD was kept constant at 10 nM and an equal volume of the non-labeled binding partner (CTxA1, CTxB, or CTx) was added as a twofold serial dilution. The final buffer composition was 1X PBS, 1 mM DTT, 2.5% glycerol, and 0.05% Tween-20. The samples were loaded into Monolith NT.115 Premium Capillaries (NanoTemper Technologies) and incubated at 23, 30, or 37°C. The MST measurement was performed using the Monolith NT.115 Pico-red (NanoTemper Technologies) at 5% LED power and medium MST power. Binding was analyzed by nonlinear fitting of a one-site binding model to the experimental data.
In vitro binding by fluorescence anisotropy
His6-CTxA1 was labeled using Monolith NT His-Tag Labeling Kit RED-tris-NTA (NanoTemper). CTxB labeled with Alexa Fluor 647 (Invitrogen) was used as a negative control. Binding reactions were measured in 384-well black flat-bottomed assay plates in 20-μl reactions containing 50 nM of labeled protein and varying concentrations of GST-IRE1αLD in 1X PBS, 1 mM DTT, 2.5% glycerol, and 0.05% Tween-20. Anisotropy was measured on a Spark 10M plate reader (Tecan) with excitation at 640 nm and emission at 685 nm and averaged over a 20-min time course. A well containing only the buffer was included for background correction. Response curves were analyzed by nonlinear fitting of a one-site binding model to the experimental data.
Peptides were synthesized with an N-terminal 5-carboxyfluorescien (5-FAM) at >85% purity (GenScript); peptides used for competition studies did not have 5-FAM. Peptides were reconstituted in DMSO and further diluted in a binding buffer. Binding reactions were measured in 384-well black flat-bottomed assay plates with 20 μl volume containing 50 nM of labeled peptide and varying concentrations of His6-IRE1αLD in 1X PBS, 1 mM DTT, 2.5% glycerol, and 0.05% Tween-20. Binding reactions were equilibrated at room temperature for 20 min. Fluorescence anisotropy was measured on a Spark 10M plate reader (Tecan) with excitation at 485 nm and emission at 525 nm and averaged over a 20-minute time course. A well containing only the buffer was included for background correction. Response curves were analyzed by nonlinear fitting of a one-site binding model to the experimental data.
Competition assays were performed by titrating varying concentrations of unlabeled IRE1αY358-L369 peptides in reactions containing 50 nM labeled CTxAI124-F132 peptide. An equal volume of 100 µM IRE1αLD or binding buffer was added to peptides and equilibrated for 20 min. The final buffer composition was 1X PBS, 1 mM DTT, 2.5% glycerol, and 0.05% Tween-20. Anisotropy was measured as described above.
Structural modeling using AlphaFold2 multimer
Structural models of peptides bound to the core IRE1αLD (S24-307) were generated using AlphaFold2-multimer (Evans et al., 2021, Preprint) as implemented in ColabFold (Mirdita et al., 2022). In each case, templates were identified using pdb100, and five structures were generated.
Statistical analysis
All analyses were performed using Prism (GraphPad). The number of independent experiments is indicated in the figure legends. Figures include all independent measures shown as mean value ± SEM. Expression data is represented as fold changes (e.g., treatment compared with control) with mean values compared using unpaired t test, one-way ANOVA, or two-way ANOVA as appropriate with correction for multiple comparisons. Data distribution was assumed to be normal, but this was not formally tested. Significance is indicated by asterisks (*P < 0.05; **P < 0.01; ***P < 0.001; ****P < 0.0001).
Online supplemental material
Fig. S1 shows cholera toxin activates IRE1α in cell lines and in vivo. Fig. S2 shows that the expression of CTxA1-APEX2KDEL in the ER of mammalian cells induces biotinylation of ER chaperones involved in CTx pathophysiology. Fig. S3 shows endogenous IRE1α peptide IRE1αY358-L369 displaces CTxAI124-F132 from IRE1αLD and interacts with CTxAI124-F132. Fig. S4 shows that peptides from proteins that activate IRE1α are predicted to bind at the same site on IRE1αLD as CTxAI124-F132. Fig. S5 shows that a peptide binds PERKLD at a similar site distal from the dimerization interface but does not bind IRE1αLD in vitro. Data S1 shows biotinylated proteins isolated from cells expressing CTxA1-APEX2KDEL and APEX2KDEL identified by mass spectrometry. Data S2 shows the summary of non-linear curve fitting for the binding of proteins and peptides to IRE1αLD. Table S1 lists the primers used for expression analysis by qPCR.
Data availability
All data are available in the main text or the supplementary materials. All plasmids for expression of recombinant proteins will be made available upon request. The original mass spectra, peptide spectrum match results, and the protein sequence databases used for searches have been deposited in the public proteomics repository Mass Spectrometry Interactive Virtual Environment (MassIVE) hosted by the Center for Computational Mass Spectrometry at the University of California San Diego. Data can be accessed using the MassIVE identifier MSV000091745.
Acknowledgments
We thank members of the Lencer Lab and Ineke Braakman (Utrecht University) for feedback throughout the course of this project; the Harvard Digestive Disease Center for services and instrumentation provided by the Epithelial Cell and Mucosal Immunology Core and the Microscopy and Histopathology Core; the Center for Macromolecular Interactions (Harvard Medical School) for access to microscale thermophoresis instrumentation; the Taplin Mass Spectrometry Facility (Harvard Medical School) for identification/validation of purified proteins, and Francesca Massi (University of Massachusetts Chan School of Medicine) for access to the Fluorlog-3 spectrofluorometer.
Funding was provided by National Institutes of Health grants R01DK048106 (W.I. Lencer, M.J. Grey), K01DK119414 (M.J. Grey), and P30DK034854 (W.I. Lencer), and Boston Children’s Hospital-Broad Institute Collaboration Grant (W.I. Lencer, P. Luong, N.D. Udeshi, S.A. Carr).
Author contributions: Conceptualization: M.S. Simpson, M.J. Grey, W.I. Lencer; Methodology: M.S. Simpson, P. Luong, S.S. Schmieder, S.A. Carr, M.J. Grey, and W.I. Lencer; Investigation: M.S. Simpson, H. De Luca, S. Cauthorn, P. Luong, N.D. Udeshi, T. Svinkina, S.S. Schmieder, S.A. Carr, and M.J. Grey; Visualization: M.S. Simpson, N.D. Udeshi, M.J. Grey, and W.I. Lencer; Funding acquisition: M.J. Grey and W.I. Lencer; Project administration: M.S. Simpson, M.J. Grey, and W.I. Lencer; Supervision: M.J. Grey and W.I. Lencer; Writing—original draft: M.S. Simpson, M.J. Grey, and W.I. Lencer; Writing—review and editing: all authors.

