


The centromere is a fundamental higher-order structure in chromosomes ensuring their faithful segregation upon cell division. Centromeric transcripts have been described in several species and suggested to participate in centromere function. However, low sequence conservation of centromeric repeats appears inconsistent with a role in recruiting highly conserved centromeric proteins. Here, we hypothesized that centromeric transcripts may function through a secondary structure rather than sequence conservation. Using mouse embryonic stem cells (ESCs), we show that an imbalance in the levels of forward or reverse minor satellite (MinSat) transcripts leads to severe chromosome segregation defects. We further show that MinSat RNA adopts a stem-loop secondary structure, which is conserved in human α-satellite transcripts. We identify an RNA binding region in CENPC and demonstrate that MinSat transcripts function through the structured region of the RNA. Importantly, mutants that disrupt MinSat secondary structure do not cause segregation defects. We propose that the conserved role of centromeric transcripts relies on their secondary RNA structure.
Introduction
Correct chromosome segregation ensures equivalent distribution of genetic material in mitosis and meiosis (Marston, 2014; Tanaka and Hirota, 2016). The centromere is the primary constriction of mitotic chromosomes and a platform for kinetochore formation and spindle attachment (Westhorpe and Straight, 2014). Defects in centromere formation result in aberrant chromosome segregation, micronuclei formation, and chromosomal defects (Barra and Fachinetti, 2018). However, our understanding of the mechanisms ensuring faithful centromere formation across cell types remains limited.
Genetically, mammalian centromeres are composed of pericentric and centric domains. While the former is heterochromatic and the centric domain is euchromatic, both are transcriptionally active (Bury et al., 2020; Chan et al., 2012). In mammals, RNA polymerase II binds to centromeric DNA during mitosis (Bury et al., 2020; Chan et al., 2012). Unlike pericentric heterochromatin enriched in H3K9me3, core centromeres are characterized by CENPA nucleosomes and H3K4me2 (Barnhart et al., 2011; Black and Cleveland, 2011; Cleveland et al., 2003; Fachinetti et al., 2013; Bergmann et al., 2011, 2012; Gopalakrishnan et al., 2009; Sullivan and Karpen, 2004). Non-coding centromeric transcripts have been linked to the role of CENPA chaperone, HJURP. In addition, centromeric transcripts have pivotal roles in kinetochore assembly and centromere stability (Chan and Wong, 2012; Djupedal et al., 2005; Ferri et al., 2009).
Transcription and transcripts from the core centromeric regions (centromere transcripts, cenRNA) play a role in recruiting kinetochore components such as chromosomal passenger complex (CPC complex) and inner kinetochore proteins CENPA and CENPC (Blower, 2016; Bobkov et al., 2018; Bouzinba-Segard et al., 2006; Chan et al., 2012; Ferri et al., 2009; Grenfell et al., 2016; Ideue et al., 2014; Jambhekar et al., 2014; McNulty et al., 2017; Quénet and Dalal, 2014; Rošić et al., 2014). Accordingly, a regulatory role of cenRNAs in initiating and/or maintaining functional kinetochore complexes has been proposed. However, how cenRNAs regulate centromere function remains unclear.
In mice, cenRNAs are transcribed from minor satellite (MinSat) repeats, which are stretches of highly similar units of ∼120 bp (Bouzinba-Segard et al., 2006; Hörz and Altenburger, 1981). Studies in various model organisms have indicated that cenRNAs may guide centromeric proteins to the centromeric region (Bobkov et al., 2018; Ferri et al., 2009; Ideue and Tani, 2020; Jambhekar et al., 2014; Quénet and Dalal, 2014; Rošić et al., 2014; Wong et al., 2007). Remarkably, however, centromeric sequences differ greatly between species and are one of the rapidly evolving elements in the genome (Henikoff et al., 2001). At the DNA level, a CENPB box with a consensus motif for the binding of CENPB is present in multiple species (Alkan et al., 2011; Masumoto et al., 1989). However, at the RNA level, the poor sequence similarity across species is insufficient to explain a shared mechanism of action.
Considering that conserved functions of non-coding RNAs emerge primarily from secondary structures rather than nucleotide sequences (Diederichs, 2014; Johnsson et al., 2014), we hypothesized that a conserved function for cenRNAs may be explained by structural conservation. Here, we investigated the molecular function of cenRNAs in chromosome segregation. We show that both, forward and reverse mouse MinSat transcripts affect chromosome segregation in murine embryonic stem cells (ESCs). MinSat RNA functions through a specific stem-loop secondary structure, which is conserved between human and mouse cenRNAs. Accordingly, human α-satellite expression in mouse ESCs also results in chromosome segregation defects. Our data indicate that RNA secondary structure, specifically a stem-loop around the CENPB box sequence, is a conserved key feature of cenRNA transcripts. We propose that the conserved role of cenRNA in centromere function relies, at least partly, on its secondary RNA structure.
Results and discussion
Expression of mouse minor satellite transcripts leads to chromosome segregation errors
To investigate the basis of cenRNAs in centromere function, we investigated whether MinSat transcripts affect chromosome segregation in mouse ESCs. Since MinSat regions generate cenRNAs from both strands (Blower, 2016; Bury et al., 2020; Rošić et al., 2014), we asked whether forward, reverse, or both MinSat transcripts have functional roles in mitosis. First, we characterized MinSat transcripts using RT-qPCR to quantify non-strand specific (Fig. S1 A) as well as forward- and reverse-strand (Fig. S1 B) transcripts. Absolute threshold cycle (Ct)-values indicate that cenRNAs are expressed in non-synchronized ESCs (Fig. S1 B). To address whether MinSat transcripts are expressed throughout the cell cycle we used an ESC line harboring the Fucci system (Sakaue-Sawano et al., 2008) (Fig. S1 C). RT-qPCR analyses indicated that MinSat transcript levels increase during G2/M (Fig. 1, A and B), in agreement with previous observations in other cell types (Ferri et al., 2009). However, in mouse ESCs steady state MinSat RNA levels are maintained until G1 and decline during S phase (Fig. 1, A and B). This could be due to the known shorter G1 in ESCs (Coronado et al., 2013). We observed the same cell cycle pattern for both forward and reverse MinSat transcripts (Fig. 1, A and B), but reverse transcripts displayed consistently lower Ct values, suggesting higher abundance than the forward ones.

RT-qPCR analysis of MinSat transcripts, flow cytometry of Fucci reporter cells and overexpression of MinSat in mouse embryonic fibroblasts. (A) Raw Ct values of PCR amplification for β-actin and MinSat after reverse transcription with oligo dT and random hexamers. Solid line, mean of N = 3 independent experiments; error bars, standard deviation. (B) Raw Ct values of PCR amplification after reverse transcription with primers specific for β-actin, MinSat forward, and MinSat reverse RNA, respectively. Solid line, mean of N = 3 (MinSat) or N = 6 (β-actin) experiments; error bars, standard deviation. (C) Representative gating strategy for fluorescence-activated cell sorting (FACS) of ESCs harboring the Fucci reporter. Red, G1 phase; green, S phase; yellow, G2/M phase. (D) Quantification of strand-specific MinSat RNA levels in ESCs after transfection of the pCAG plasmids containing forward or reverse MinSat repeats using RT-qPCR analysis. Bars, mean values of N = 3 independent experiments (dots) normalized to β-actin mRNA and empty pCAG vector control (Ctrl); error bars, standard deviation. Top panel, qPCR for forward strand transcripts; lower panel, qPCR for reverse strand transcripts. (E) Representative images of missegregation events in MEFs after transfection with a single repeat of MinSat forward or empty pCAG vector control (Ctrl), respectively. Cells were immunostained with α-tubulin (green) and DAPI (magenta). Scale bars, 5 µm. (F) Percentage of chromosome missegregation events in total anaphase to telophase cells. Bars, mean; error bars, standard deviation; pair-wise comparisons with control (empty pCAG vector) P values ** ≤ 0.01. The number of biological replicates (N) and the total number of mitotic figures analyzed (n) are indicated. (G) Flow cytometry analysis of cell cycle distribution after MinSat RNA overexpression using PI. Ctrl, empty pCAG vector. Bars indicate mean percentages of the respective cell cycle phase from three independent experiments; error bars, standard deviation.
RT-qPCR analysis of MinSat transcripts, flow cytometry of Fucci reporter cells and overexpression of MinSat in mouse embryonic fibroblasts. (A) Raw Ct values of PCR amplification for β-actin and MinSat after reverse transcription with oligo dT and random hexamers. Solid line, mean of N = 3 independent experiments; error bars, standard deviation. (B) Raw Ct values of PCR amplification after reverse transcription with primers specific for β-actin, MinSat forward, and MinSat reverse RNA, respectively. Solid line, mean of N = 3 (MinSat) or N = 6 (β-actin) experiments; error bars, standard deviation. (C) Representative gating strategy for fluorescence-activated cell sorting (FACS) of ESCs harboring the Fucci reporter. Red, G1 phase; green, S phase; yellow, G2/M phase. (D) Quantification of strand-specific MinSat RNA levels in ESCs after transfection of the pCAG plasmids containing forward or reverse MinSat repeats using RT-qPCR analysis. Bars, mean values of N = 3 independent experiments (dots) normalized to β-actin mRNA and empty pCAG vector control (Ctrl); error bars, standard deviation. Top panel, qPCR for forward strand transcripts; lower panel, qPCR for reverse strand transcripts. (E) Representative images of missegregation events in MEFs after transfection with a single repeat of MinSat forward or empty pCAG vector control (Ctrl), respectively. Cells were immunostained with α-tubulin (green) and DAPI (magenta). Scale bars, 5 µm. (F) Percentage of chromosome missegregation events in total anaphase to telophase cells. Bars, mean; error bars, standard deviation; pair-wise comparisons with control (empty pCAG vector) P values ** ≤ 0.01. The number of biological replicates (N) and the total number of mitotic figures analyzed (n) are indicated. (G) Flow cytometry analysis of cell cycle distribution after MinSat RNA overexpression using PI. Ctrl, empty pCAG vector. Bars indicate mean percentages of the respective cell cycle phase from three independent experiments; error bars, standard deviation.
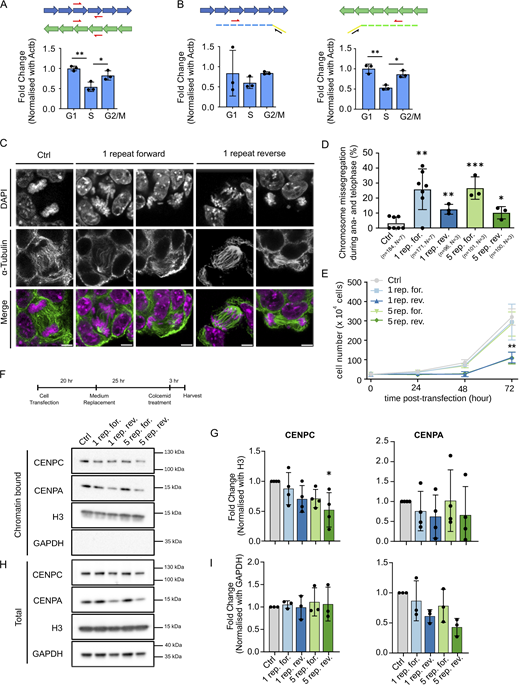
Ectopic expression of forward and reverse minor satellite transcripts leads to chromosome segregation defects in ESCs. (A and B) RT-qPCR analysis of total (A) and forward and reverse (B) MinSat transcripts in G1-, S-, and G2/M-phase populations of ESCs harboring the Fucci cell cycle reporter system. The schematics on top indicate the position of the PCR primers used and the strategy for the analysis of strand-specific transcripts. Bars, mean value of N = 3 independent experiments (individual dots), normalized to β-actin mRNA and control sample; error bars, standard deviation; P values * ≤ 0.05, ** ≤ 0.01. We note that reverse transcripts consistently displayed lower Ct values (∼24.5) than forward transcripts (∼26). (C) α-Tubulin immunofluorescence and DAPI staining of ESCs expressing one repeat MinSat RNAs. Ctrl, empty pCAG vector control. Scale bars, 5 µm. (D) Percentage of chromosome missegregation events after MinSat expression in total anaphase to telophase cells. Bars, mean; error bars, standard deviation; pair-wise comparisons with control (empty pCAG vector) P values * ≤ 0.05, ** ≤ 0.01, *** ≤ 0.001. The number of biological replicates (N) and the total number of mitotic figures analyzed (n) are indicated. (E) Growth curves of ESCs after MinSat RNA expression. Lines indicate the mean of three independent biological replicates; error bars, standard deviation; P value ** ≤ 0.01. (F) Timeline diagram for sample collection and representative immunoblot for the chromatin fraction of ESCs after expression of one or five repeats of forward or reverse MinSat RNAs, or empty pCAG vector control (Ctrl). Cells were synchronized by colcemid treatment before harvesting as indicated. The WB was repeated three or four times with independent lysates, corresponding to the datapoints on the quantification (G). (G) Immunoblot quantification. Values are fold changes normalized to histone H3 and control group in each individual replicate. Bars, mean; error bars, standard deviation; * P value ≤ 0.05. Statistical test: ANOVA. (H) Representative immunoblot for the total lysate of ESCs after expression of one or five repeats of forward or reverse MinSat RNAs, or empty pCAG vector control (Ctrl). Cells were synchronized by colcemid treatment before harvesting as indicated. The WB was repeated three or four times with independent lysates, corresponding to the datapoints on the quantification (I). (I) Immunoblot quantification. Values are fold changes normalized to GAPDH and control group in each individual replicate. Bars, mean; error bars, standard deviation. Statistical test: ANOVA. Source data are available for this figure: SourceData F1.
Ectopic expression of forward and reverse minor satellite transcripts leads to chromosome segregation defects in ESCs. (A and B) RT-qPCR analysis of total (A) and forward and reverse (B) MinSat transcripts in G1-, S-, and G2/M-phase populations of ESCs harboring the Fucci cell cycle reporter system. The schematics on top indicate the position of the PCR primers used and the strategy for the analysis of strand-specific transcripts. Bars, mean value of N = 3 independent experiments (individual dots), normalized to β-actin mRNA and control sample; error bars, standard deviation; P values * ≤ 0.05, ** ≤ 0.01. We note that reverse transcripts consistently displayed lower Ct values (∼24.5) than forward transcripts (∼26). (C) α-Tubulin immunofluorescence and DAPI staining of ESCs expressing one repeat MinSat RNAs. Ctrl, empty pCAG vector control. Scale bars, 5 µm. (D) Percentage of chromosome missegregation events after MinSat expression in total anaphase to telophase cells. Bars, mean; error bars, standard deviation; pair-wise comparisons with control (empty pCAG vector) P values * ≤ 0.05, ** ≤ 0.01, *** ≤ 0.001. The number of biological replicates (N) and the total number of mitotic figures analyzed (n) are indicated. (E) Growth curves of ESCs after MinSat RNA expression. Lines indicate the mean of three independent biological replicates; error bars, standard deviation; P value ** ≤ 0.01. (F) Timeline diagram for sample collection and representative immunoblot for the chromatin fraction of ESCs after expression of one or five repeats of forward or reverse MinSat RNAs, or empty pCAG vector control (Ctrl). Cells were synchronized by colcemid treatment before harvesting as indicated. The WB was repeated three or four times with independent lysates, corresponding to the datapoints on the quantification (G). (G) Immunoblot quantification. Values are fold changes normalized to histone H3 and control group in each individual replicate. Bars, mean; error bars, standard deviation; * P value ≤ 0.05. Statistical test: ANOVA. (H) Representative immunoblot for the total lysate of ESCs after expression of one or five repeats of forward or reverse MinSat RNAs, or empty pCAG vector control (Ctrl). Cells were synchronized by colcemid treatment before harvesting as indicated. The WB was repeated three or four times with independent lysates, corresponding to the datapoints on the quantification (I). (I) Immunoblot quantification. Values are fold changes normalized to GAPDH and control group in each individual replicate. Bars, mean; error bars, standard deviation. Statistical test: ANOVA. Source data are available for this figure: SourceData F1.
To examine whether cenRNAs regulate chromosome segregation, we expressed one or five MinSat repeats in the forward or reverse orientation in ESCs (Fig. S1 D). We quantified chromosome bridges and lagging chromosomes in anaphase and telophase after confirming that the expression of both forward and reverse MinSat transcripts was efficient and specific (Fig. S1 D). Ectopic expression of MinSat transcripts led to a 10–20% increase in chromosome segregation defects (Fig. 1, C and D). The forward transcripts induced a higher proportion of errors compared with the reverse transcripts (26% ± 14 for one repeat forward and 13% ± 3 for one repeat reverse). Expression of the forward MinSat repeat also led to increased chromosome segregation errors in mouse embryonic fibroblasts (MEFs) (Fig. S1, E and F). The effect on chromosome segregation was similar for one or five copies of MinSat repeats (Fig. 1 D). We observed a significant reduction of cell proliferation upon expression of reverse transcripts, for both one and five copies (Fig. 1 E). Importantly, we did not observe changes in the cell cycle in any condition (Fig. S1 G). Thus, an increase in MinSat transcript levels leads to chromosome segregation defects. Because the MinSat repeats are expressed from a heterologous promoter, which is unlikely to undergo genomic integration during the time frame of our experiments (Lim et al., 2023), the effects of MinSat transcripts in centromere function can occur, at least partly, in trans.
To investigate the potential mechanism whereby MinSat transcripts affect chromosome segregation, we asked whether ectopic expression affects the chromatin association of kinetochore proteins CENPA and CENPC. We isolated the chromatin fraction of cells arrested in mitosis and quantified chromatin-bound CENPC and CENPA normalized against H3 (Fig. 1, F and G). We did not detect consistent changes in chromatin association of CENPA (Fig. 1, F and G) but chromatin levels of CENPC were significantly reduced upon the expression of five reverse MinSat repeats (Fig. 1 G). Expression of either one repeat reverse or five repeats forward also led to a mild reduction of CENPC chromatin association, which was consistent across experiments but not statistically significant (Fig. 1 G). These observations suggest that CENPC binding to chromatin during mitosis is reduced upon expression of MinSat reverse transcripts. We did not observe changes in CENPC upon MinSat expression in whole cell lysates (Fig. 1 H), suggesting that the effect of MinSat transcripts is specific to the chromatin association of CENPC. Interestingly, we observed reduced total cellular levels of CENPA after overexpression of reverse MinSat transcripts and, to a lesser extent with the one repeat forward (Fig. 1 I). While this reduction was not statistically significant, we observed the strongest effect upon expression of one and five reverse repeats suggesting a potential role of MinSat RNAs in modulating cellular CENPA levels. Thus, we concluded that forward and reverse cenRNAs can function during mitosis in mouse ESCs and that MinSat expression, particularly the reverse transcript, affects CENPC association with mitotic chromatin.
Forward and reverse minor satellite transcripts are required for fidelity of chromosome segregation
We next asked if endogenous MinSat transcripts also regulate centromere function. We depleted specifically forward or reverse transcripts, or both, using antisense oligos (ASOs). The reverse ASO strongly reduced global MinSat transcript levels, similar to combined forward and reverse ASOs (Fig. 2 A). However, the forward ASO did not significantly change global MinSat transcript levels (Fig. 2 A), but it did significantly reduce the forward transcript levels (Fig. 2 B). Interestingly, strand-specific targeting of MinSat with ASOs led to a slight increase in transcript levels of the opposite strand (Fig. 2, B and C), particularly in the case of the reverse ASO, which led to a 1.32 (±0.3)-fold increase in forward MinSat transcripts (Fig. 2 B). These results explain the apparent unchanged global MinSat transcript levels in response to the forward ASO transfection (Fig. 2 A). This points toward a feedback loop between cenRNAs. In addition, since the downregulation effect of the forward ASO on the forward transcripts is masked by the levels of the reverse MinSat, these results suggest that reverse MinSat transcripts are more abundant than the forward transcripts.
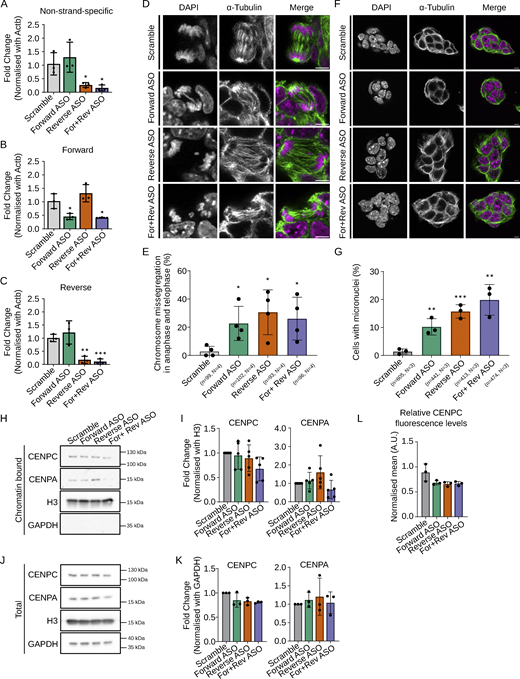
Depletion of forward or reverse MinSat transcripts impairs chromosome segregation. (A–C) RT-qPCR analysis of total (A), forward (B), and reverse (C) MinSat transcripts in mouse ESCs transfected with ASO against forward (green), reverse (orange), or both strands (purple), respectively. Scramble (gray), non-targeting ASO control; bars, mean values of N = 3 independent experiments (dots), normalized to β-actin mRNA and control samples; error bars, standard deviation; P values * ≤ 0.05, ** ≤ 0.01, *** ≤ 0.001. (D) Representative images showing ESCs stained with α-tubulin and DAPI. Cells were transfected with ASOs against MinSat RNAs. Scale bars, 5 µm. (E) Quantification of chromosome missegregation events in mouse ESCs transfected with the indicated ASOs. Bars, mean percentage of aberrant chromosome segregation (dots indicate individual experiments); error bars, standard deviation; P values * ≤ 0.05 (pair-wise comparisons to control samples). The number of biological replicates (N) and total number of mitotic events analyzed (n) is indicated. (F) Representative images showing ES cells stained with α-tubulin and DAPI. Cells were transfected with ASOs against MinSat RNAs. The presence of micronuclei was analysed in interphase cells. Scale bars, 5 µm. (G) Quantification of micronuclei in mouse ESCs transfected with the indicated ASOs. Bars indicate the mean percentage of micronuclei per cell (dots indicate individual experiments); error bars, standard deviation; P values ** ≤ 0.01, *** ≤ 0.001 (pair-wise comparisons to control samples). The number of biological replicates (N) and the total number of cells analyzed (n) is indicated. (H) Representative immunoblot of the chromatin fraction of ESCs after ASO-mediated knockdown of MinSat RNAs and colcemid synchronization using antibodies to detect the indicated proteins. Scramble, non-targeting ASO control. (I) Immunoblot quantification. Values are fold changes normalized to histone H3 and control in each individual replicate. Bars, mean of N = 5 independent biological replicates (dots); error bars, standard deviation. Statistical test: ANOVA. (J) Representative immunoblot of the total lysate of ESCs after ASO-mediated knockdown of MinSat RNAs and colcemid synchronization using antibodies to detect the indicated proteins. Scramble, non-targeting ASO control. (K) Immunoblot quantification. Values are fold changes normalized to GAPDH and controlled in each individual replicate. Bars, mean of N = 3 independent biological replicates (dots); error bars, standard deviation. Statistical test: ANOVA. (L) Immunofluorescent intensity quantification of CENPC. Data points are means of all sampled CENPC intensity normalized with DAPI signal in that specific Z plane. Scramble, non-targeting ASO control. Bars, mean of N = 3 independent biological replicates (dots); error bars, standard deviation. Source data are available for this figure: SourceData F2.
Depletion of forward or reverse MinSat transcripts impairs chromosome segregation. (A–C) RT-qPCR analysis of total (A), forward (B), and reverse (C) MinSat transcripts in mouse ESCs transfected with ASO against forward (green), reverse (orange), or both strands (purple), respectively. Scramble (gray), non-targeting ASO control; bars, mean values of N = 3 independent experiments (dots), normalized to β-actin mRNA and control samples; error bars, standard deviation; P values * ≤ 0.05, ** ≤ 0.01, *** ≤ 0.001. (D) Representative images showing ESCs stained with α-tubulin and DAPI. Cells were transfected with ASOs against MinSat RNAs. Scale bars, 5 µm. (E) Quantification of chromosome missegregation events in mouse ESCs transfected with the indicated ASOs. Bars, mean percentage of aberrant chromosome segregation (dots indicate individual experiments); error bars, standard deviation; P values * ≤ 0.05 (pair-wise comparisons to control samples). The number of biological replicates (N) and total number of mitotic events analyzed (n) is indicated. (F) Representative images showing ES cells stained with α-tubulin and DAPI. Cells were transfected with ASOs against MinSat RNAs. The presence of micronuclei was analysed in interphase cells. Scale bars, 5 µm. (G) Quantification of micronuclei in mouse ESCs transfected with the indicated ASOs. Bars indicate the mean percentage of micronuclei per cell (dots indicate individual experiments); error bars, standard deviation; P values ** ≤ 0.01, *** ≤ 0.001 (pair-wise comparisons to control samples). The number of biological replicates (N) and the total number of cells analyzed (n) is indicated. (H) Representative immunoblot of the chromatin fraction of ESCs after ASO-mediated knockdown of MinSat RNAs and colcemid synchronization using antibodies to detect the indicated proteins. Scramble, non-targeting ASO control. (I) Immunoblot quantification. Values are fold changes normalized to histone H3 and control in each individual replicate. Bars, mean of N = 5 independent biological replicates (dots); error bars, standard deviation. Statistical test: ANOVA. (J) Representative immunoblot of the total lysate of ESCs after ASO-mediated knockdown of MinSat RNAs and colcemid synchronization using antibodies to detect the indicated proteins. Scramble, non-targeting ASO control. (K) Immunoblot quantification. Values are fold changes normalized to GAPDH and controlled in each individual replicate. Bars, mean of N = 3 independent biological replicates (dots); error bars, standard deviation. Statistical test: ANOVA. (L) Immunofluorescent intensity quantification of CENPC. Data points are means of all sampled CENPC intensity normalized with DAPI signal in that specific Z plane. Scramble, non-targeting ASO control. Bars, mean of N = 3 independent biological replicates (dots); error bars, standard deviation. Source data are available for this figure: SourceData F2.
Having established conditions for the efficient depletion of endogenous MinSat transcripts, we next investigated effects on chromosome segregation by counting segregation errors in mitotic cells and micronuclei in interphase cells. Downregulation of either forward or reverse MinSat transcripts significantly increased chromosome segregation defects (23% ± 12 for forward ASO and 31% ± 16 for reverse ASO compared with 3% ± 4 in control ASO-treated ESCs; Fig. 2, D and E). We observed a similar phenotype when both forward and reverse ASOs were combined (Fig. 2, D and E). In interphase cells, the percentage of cells with micronuclei increased from 1% to 10–20% in ASO-treated ESCs (10% ± 3 for forward ASO and 16% ± 2 for reverse ASO, Fig. 2, F and G). These experiments indicate that endogenous MinSat transcripts are required for correct chromosome segregation.
To address whether depletion of MinSat transcripts leads to a similar molecular phenotype as upon ectopic expression, we analyzed CENPC and CENPA binding to mitotic chromatin. We did not observe consistent changes in either the binding of CENPA to chromatin (Fig. 2, H and I) or in total levels of CENPA (Fig. 2, J and K). However, we detected a consistent, albeit not statistically significant, reduction of chromatin-bound CENPC when combining both forward and reverse ASOs (Fig. 2, H and I). Global levels of CENPC were also mildly reduced in all ASO conditions (Fig. 2 K), which we confirmed by immunofluorescence (Fig. 2 L). Overall, these data reveal minor but consistent changes in CENPC association with the chromatin, suggesting that MinSat transcripts may contribute to CENPC regulation and chromatin binding. Our data suggest that a feedback mechanism between transcripts from both strands ensures their respective levels throughout the cell cycle. Together with our observations above (Fig. 1), our data suggest that a balanced level of cenRNAs is essential for faithful chromosome segregation in mouse ESCs.
Minor satellite transcripts are structured and interact with RNA-binding regions in CENPC
CENPC is a core centromere component with structural and regulatory functions during kinetochore assembly (Klare et al., 2015; Kwon et al., 2007; Przewloka et al., 2011). Depletion of CENPC negatively impacts mitosis progression (Chik et al., 2019; Milks et al., 2009; Moree et al., 2011). Although not detectable across all experimental conditions, the changes of CENPC association to mitotic chromatin upon expression and depletion of MinSat RNAs prompted us to investigate a potential relationship between CENPC and cenRNAs. Indeed, CENPC is a good candidate to mediate interactions at the interphase of centromeric DNA, RNA, and kinetochore effectors.
Human cenRNA, α-satellite, binds to human CENPC in in vitro gel shift assays (Wong et al., 2007), similar to the maize centromeric repeats, CentC (Du et al., 2010), suggesting a potential conserved binding between CENPC and cenRNAs. However, the lack of sequence similarity of centromeric DNA between species against the relatively strong CENPC conservation raises the question of whether such binding is conserved and involved in centromere function. Thus, we first tested if mouse CENPC and MinSat RNAs interact using RNA pull-down. We in vitro–transcribed and biotinylated one repeat of MinSat forward or reverse transcripts and Egfp RNA as negative control. After incubation with whole ESC lysate, we probed for CENPC with Western blotting. Our data indicate that CENPC binds to the forward transcript and to a lesser extent to the reverse transcript (Fig. 3 A), pointing to a direct interaction of the murine CENPC-cenRNA. This interaction is specific since we did not detect CENPC in the Egfp RNA pulldown (Fig. 3 A). To identify potential RNA binding region(s) within CENPC we subjected CENPC to in silico RNA binding motif prediction (catRAPID) (Livi et al., 2016). catRAPID identified 5 potential binding regions, which are numbered based on the potential RNA binding ability, with 1 corresponding to the highest (Fig. 3 B). While the catRAPID domains do not fully recapitulate known functional domains of CENPC, they do exhibit an overlap (Fig. 3 C). To test their ability for RNA binding, we prepared recombinant proteins of these regions and incubated each with in vitro transcribed forward MinSat RNA. In line with the ranking of the catRAPID prediction, regions 1, 2, and 3 display RNA binding activity in the micromolar range, whereas no binding is observed in regions 4 and 5 (Fig. 3 D). Incubating increasing protein concentrations indicated that region 1 has the highest RNA binding affinity (Fig. 3 D). This region is uncharacterized but overlaps with the central domain previously characterized in human CENPC (Carroll et al., 2010; Kato et al., 2013) and with the RNA-binding region that interacts with α-satellite transcripts based on amino acid sequence similarity (Fig. 3 C and Fig. S2 A) (Wong et al., 2007). Thus, we conclude that mouse CENPC interacts with MinSat RNA.
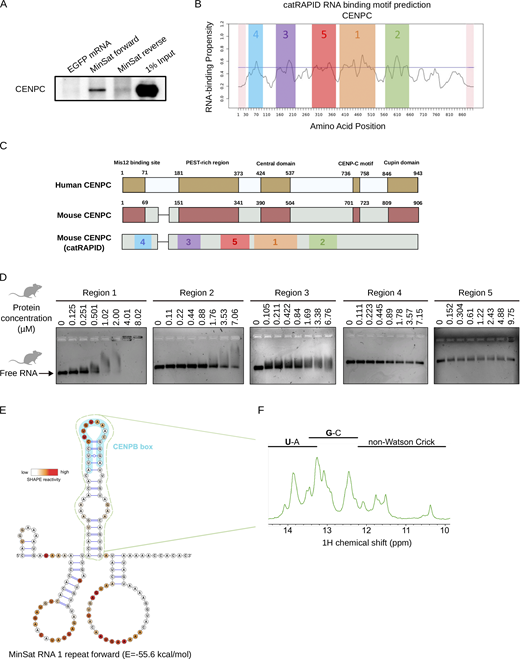
Minor satellite transcripts interact with RNA-binding regions of CENPC and are structured. (A) Immunoblot for CENPC after RNA pull-down from whole cell lysate of ESCs using biotin-labeled RNAs. The biotinylated RNAs used are indicated on top of the gel image, EGFP was used as negative control. (B) Prediction of RNA binding regions in CENPC using CatRapid. The X axis represents amino acid sequence position. The predicted RNA binding regions are highlighted in color and are ranked correspondingly to their predicted RNA binding ability, as indicated by numbers. (C) Schematic of the functional domains characterized in human CENPC and their correspondence in mouse CENPC, which we assigned based on the alignment of Fig. S2 A. (D) EMSA of the predicted RNA binding regions in CENPC and 1 repeat of forward MinSat RNA. Protein concentrations are indicated on the top. (E) Secondary structure of 1 repeat of forward MinSat RNA obtained using SHAPE. SHAPE reactivity is revealed using color gradient on the top left. The green outlined stem-loop (position 51–96) is predicted as a thermodynamically stable region. The light blue outlined region corresponds to the CENPB box motif (position 65–81). The numbers indicate the nucleotide position relative to the start of the primer extension reaction. (F) 1D imino NMR spectrum of the MinSat RNA stem-loop (corresponding to the green dotted-lined region in Fig. 3 D). Source data are available for this figure: SourceData F3.
Minor satellite transcripts interact with RNA-binding regions of CENPC and are structured. (A) Immunoblot for CENPC after RNA pull-down from whole cell lysate of ESCs using biotin-labeled RNAs. The biotinylated RNAs used are indicated on top of the gel image, EGFP was used as negative control. (B) Prediction of RNA binding regions in CENPC using CatRapid. The X axis represents amino acid sequence position. The predicted RNA binding regions are highlighted in color and are ranked correspondingly to their predicted RNA binding ability, as indicated by numbers. (C) Schematic of the functional domains characterized in human CENPC and their correspondence in mouse CENPC, which we assigned based on the alignment of Fig. S2 A. (D) EMSA of the predicted RNA binding regions in CENPC and 1 repeat of forward MinSat RNA. Protein concentrations are indicated on the top. (E) Secondary structure of 1 repeat of forward MinSat RNA obtained using SHAPE. SHAPE reactivity is revealed using color gradient on the top left. The green outlined stem-loop (position 51–96) is predicted as a thermodynamically stable region. The light blue outlined region corresponds to the CENPB box motif (position 65–81). The numbers indicate the nucleotide position relative to the start of the primer extension reaction. (F) 1D imino NMR spectrum of the MinSat RNA stem-loop (corresponding to the green dotted-lined region in Fig. 3 D). Source data are available for this figure: SourceData F3.

CENPC amino acid sequences, predicted alternative structures of single repeat MinSat RNA, and raw spectra of 2 repeats MinSat RNA. (A) Amino acid sequence alignment of human and mouse CENPC proteins. Orange and green highlighted regions are the potential RNA binding regions from human and mouse (CATRAPID 1), respectively. (B) Alternative secondary structures of MinSat RNA predicted based on SHAPE reactivity. Note the reoccurring stem-loop structure in various structure predictions (green dotted-lined). The numbers indicate the nucleotide position relative to the start of the primer extension reaction. (C) Original spectra of SHAPE analysis of 2 repeats of forward MinSat RNA. The colored underlines highlight two repetitive patterns. The Y axis shows SHAPE reactivity and the X axis represents relative nucleotide position from 3′ end to 5′ end.
CENPC amino acid sequences, predicted alternative structures of single repeat MinSat RNA, and raw spectra of 2 repeats MinSat RNA. (A) Amino acid sequence alignment of human and mouse CENPC proteins. Orange and green highlighted regions are the potential RNA binding regions from human and mouse (CATRAPID 1), respectively. (B) Alternative secondary structures of MinSat RNA predicted based on SHAPE reactivity. Note the reoccurring stem-loop structure in various structure predictions (green dotted-lined). The numbers indicate the nucleotide position relative to the start of the primer extension reaction. (C) Original spectra of SHAPE analysis of 2 repeats of forward MinSat RNA. The colored underlines highlight two repetitive patterns. The Y axis shows SHAPE reactivity and the X axis represents relative nucleotide position from 3′ end to 5′ end.
As RNAs can be structured, we next performed selective 2′-hydroxyl acylation analyzed by primer extension (SHAPE) (Merino et al., 2005) on the mouse forward core 120-nucleotide MinSat repeat. From the SHAPE-predicted structure, we identified a stem-loop in the single repeat RNA (Fig. 3 E) even in higher energy predicted structures (Fig. S2 B). This structure occurs repeatedly along the naturally repetitive MinSat sequence (Fig. S2 C). The prominent stem-loop (Fig. 3 E, green dotted) contains the CENPB box motif (Fig. 3 E, light blue), a conserved DNA sequence that provides binding specificity of CENPB to centromeric DNA (Iwahara et al., 1998; Masumoto et al., 1989; Suntronpong et al., 2016), but with no documented roles at the RNA level. Furthermore, the presence of numerous imino signals in 1D nuclear magnetic resonance (NMR) spectra of the RNA motif is consistent with the formation of a well-defined secondary structure (Fig. 3 F). We therefore conclude that MinSat transcripts are structured and that the CENPB box motif adopts a well-defined, stable RNA stem-loop structure.
Structural conservation rather than sequence motifs underlie segregation effects of MinSat RNAs
Given the presence of a stable stem-loop structure, we hypothesized that such a structural motif might provide a basis for a conserved function of cenRNAs. We first asked whether the MinSat RNA secondary structure is conserved between mouse and human cenRNA. Specifically, we used the α-satellite sequence from human chromosome 21 (hereafter referred to as ASAT), which displays only 53% of DNA sequence identity to the murine MinSat (Fig. 4 A). SHAPE on the human ASAT revealed that the forward ASAT RNA adopts a secondary structure with a 24 nt stem-loop (Fig. S3 A, green dotted) containing the CENPB box motif (Fig. 4 B and Fig. S3 A, light blue), similar to the mouse MinSat RNA. The CENPB box coincides with a highly probable loop region in the human ASAT forward transcript (Fig. 4 B). Thus, we conclude that despite their low nucleotide sequence similarity, mouse and human forward cenRNAs adopt a similar secondary stem-loop structure, suggesting structural conservation.
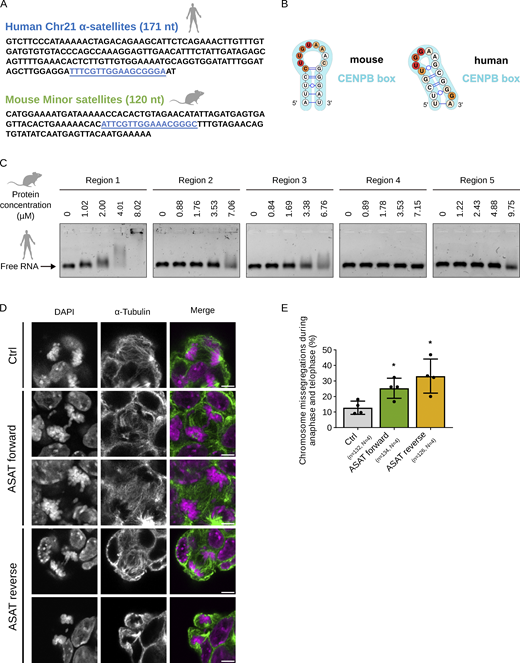
The CENPB box of both mouse MinSat and human ASAT RNAs folds into highly similar stem-loop structures. (A) Sequences of 1 repeat mouse MinSat RNA and human ASAT RNA corresponding to the human chromosome 21 (chr21) α-satellite. The blue underlined region corresponds to the CENPB box. (B) Apical loop structures of MinSat RNA and human chr21 ASAT RNA based on SHAPE analysis. Note that in both species the CENPB box motif (blue) are embedded in the apical loop structures. (C) EMSA of the predicted RNA binding regions in CENPC and 1 repeat of forward human chr21 ASAT RNA. Protein concentrations are indicated on the top. (D) Representative images of mouse ESCs stained with α-tubulin and DAPI under the indicated transfection conditions. Ctrl, empty vector control. Scale bars, 5 µm. (E) Quantification of chromosome missegregation events during mitosis in mouse ESCs transfected with a single repeat of human chr21 ASAT RNA. Ctrl, empty vector control. Bars indicate the mean percentages; error bars, standard deviation; *, P value ≤ 0.05 (pair-wise comparison to control). The number of biological replicates (N) and the total number of mitotic figures analyzed (n) are indicated. Source data are available for this figure: SourceData F4.
The CENPB box of both mouse MinSat and human ASAT RNAs folds into highly similar stem-loop structures. (A) Sequences of 1 repeat mouse MinSat RNA and human ASAT RNA corresponding to the human chromosome 21 (chr21) α-satellite. The blue underlined region corresponds to the CENPB box. (B) Apical loop structures of MinSat RNA and human chr21 ASAT RNA based on SHAPE analysis. Note that in both species the CENPB box motif (blue) are embedded in the apical loop structures. (C) EMSA of the predicted RNA binding regions in CENPC and 1 repeat of forward human chr21 ASAT RNA. Protein concentrations are indicated on the top. (D) Representative images of mouse ESCs stained with α-tubulin and DAPI under the indicated transfection conditions. Ctrl, empty vector control. Scale bars, 5 µm. (E) Quantification of chromosome missegregation events during mitosis in mouse ESCs transfected with a single repeat of human chr21 ASAT RNA. Ctrl, empty vector control. Bars indicate the mean percentages; error bars, standard deviation; *, P value ≤ 0.05 (pair-wise comparison to control). The number of biological replicates (N) and the total number of mitotic figures analyzed (n) are indicated. Source data are available for this figure: SourceData F4.

SHAPE of human ASAT RNA and RT-qPCR of human ASAT overexpression in ESCs. (A) SHAPE-derived secondary structures of 1 repeat human chr21 ASAT forward transcripts. SHAPE reactivity is indicated by the color key as indicated on the left. Note the prominent CENPB box stem-loop structure in the forward transcript, labeled in light blue. The green-dotted line indicates the 24 nt-long stem-loop structure conserved between mouse and human transcripts. The numbers indicate the nucleotide position relative to the start of the primer extension reaction. (B) RT-qPCR for human chr21 ASAT RNA in ESCs transfected with forward (left panel) or reverse (right panel) chr21 ASAT expressing plasmids using strand-specific primers. Ctrl, empty pCAG vector control; solid line, mean Ct values of N = 3 independent experiments (dots) normalized to β-actin mRNA and control; error bars, standard deviation, pair-wise comparisons with control (empty pCAG vector) P values *** ≤ 0.001, **** ≤ 0.0001.
SHAPE of human ASAT RNA and RT-qPCR of human ASAT overexpression in ESCs. (A) SHAPE-derived secondary structures of 1 repeat human chr21 ASAT forward transcripts. SHAPE reactivity is indicated by the color key as indicated on the left. Note the prominent CENPB box stem-loop structure in the forward transcript, labeled in light blue. The green-dotted line indicates the 24 nt-long stem-loop structure conserved between mouse and human transcripts. The numbers indicate the nucleotide position relative to the start of the primer extension reaction. (B) RT-qPCR for human chr21 ASAT RNA in ESCs transfected with forward (left panel) or reverse (right panel) chr21 ASAT expressing plasmids using strand-specific primers. Ctrl, empty pCAG vector control; solid line, mean Ct values of N = 3 independent experiments (dots) normalized to β-actin mRNA and control; error bars, standard deviation, pair-wise comparisons with control (empty pCAG vector) P values *** ≤ 0.001, **** ≤ 0.0001.
We reasoned that if this newly identified structural motif underlies the cenRNA–CENPC interaction, we could formulate three predictions. First, human ASAT RNA should be able to interact with mouse CENPC. We incubated human ASAT RNA with mouse CENPC catRAPID regions 1–5. Similar to mouse MinSat, we observed a clear mobility shift when human ASAT RNA was incubated with the high-affinity binding region 1 (Fig. 4 C). The affinity of the human ASAT RNA for the other catRAPID regions was lower compared with region 1 (Fig. 4 C). These data indicate that human cenRNAs can interact with mouse CENPC protein and that this interaction is mediated by a specific region in CENPC.
Second, ectopic expression of the human ASAT RNA in mouse cells should lead to similar chromosome segregation phenotypes as mouse MinSat. We expressed one repeat of the forward or the reverse ASAT transcripts in mouse ESCs and confirmed efficient expression (Fig. S3 B). In line with our hypothesis, we observed an increase in chromosome segregation errors upon expression of both forward (28% ± 8) and reverse (33% ± 11) ASAT RNA compared with empty vector (Fig. 4, D and E). However, our result that the reverse ASAT transcript induces a similar phenotype suggests that, while the secondary structure contributes to the role of cenRNAs in centromere function, it may not be the sole determinant. Alternatively, it is possible that the reverse and/or forward ASAT transcripts compete for interaction with additional potential effectors.
Third, mutations that affect the structure but not necessarily the CENPB box, should elicit chromosome segregation defects. We generated three different mutants: (1) a stem-loop without the CENPB box motif (del); (2) a stem-loop in which we replaced the apical loop with a GNRA tetraloop (GNRA). and (3) a stem-loop in which we swapped the CG base pairing in the stem region of the stem-loop (swap) (Fig. 5 A). The mutants are thus as follows: (1) with both the CENPB box motif and the stem-loop structure disrupted (del); (2) with CENPB box intact but the apical loop structure disrupted (GNRA), and (3) with the stem-loop structure maintained but without the CENPB box motif (swap) (Fig. 5 B). We expressed each mutant individually in mouse ESCs with comparable expression levels (Fig. 5 C). From the three stem-loop mutants we tested, only the swap mutant led to chromosome segregation errors to a similar extent as the wild-type transcript (Fig. 5, D and E). The MinSat mutants in which the CENPB box sequence is removed or replaced by an alternative sequence capable of adopting a loop structure behave similarly to control ESCs (Fig. 5, D and E). Thus, only the MinSat RNA which retains the apical loop structure led to increased chromosome missegregation. Of note, the essential nucleotides known to be important for CENPB box function and highly conserved at the DNA level (Suntronpong et al., 2016; Tanaka and Hirota, 2016) are fully replaced in the swap construct (Fig. 5 A). This implies that rather than functioning as a potential consensus RNA sequence, the CENPB box motif contributes to the formation of the apical loop structure through base pairing. Hence, we conclude that the apical loop in the stem-loop that we characterized is important for cenRNA function in chromosome segregation.

Structural conservation rather than sequence motifs determines effects o f MinSat RNAs on chromosome segregation. (A) Sequence comparison of the various MinSat RNA constructs used: wild type: single repeat of consensus forward MinSat RNA sequence; Deletion: deletion of central loop sequence; GNRA tetraloop: replacement of the loop with a smaller stable tetraloop sequence; Swap: swapped CG base pairing in the stem region. The yellow highlighted region indicates the CENPB box motif, blue-colored nucleotides are an integral part of the CENPB box motif and red-colored nucleotides are positions that were mutated within the CENPB box motif in our constructs. (B) Predicted structures of wild-type, deletion, GNRA tetraloop, and swap RNAs using mFold (Zuker, 2003). The yellow highlighted region depicts the CENPB box motif in wild-type sequence and red-colored nucleotides correspond to the mutated positions as depicted in A. (C) Quantification of MinSat RNA levels in ESCs after transfection of the pCAG plasmids containing different mutants of MinSat using RT-qPCR analysis. Bars, mean values of N = 3 independent experiments (dots) normalized to β-actin mRNA and empty pCAG vector control (Ctrl); error bars, standard deviation. (D) Representative images of mouse ESCs transfected with plasmids expressing empty plasmid, wild-type, or different mutants. Cells were immunostained with α-tubulin and DAPI. Scale bars, 5 µm. (E) Quantification of chromosome missegregation events in anaphase and telophase mouse ESCs after overexpression of the structural RNA mutants, wild-type, or empty pCAG vector as control (Ctrl), respectively. Bars indicate the mean percentage of N = 3 independent experiments (dots); error bars, standard deviation; *, P value ≤ 0.05 (pair-wise comparison to control).
Structural conservation rather than sequence motifs determines effects o f MinSat RNAs on chromosome segregation. (A) Sequence comparison of the various MinSat RNA constructs used: wild type: single repeat of consensus forward MinSat RNA sequence; Deletion: deletion of central loop sequence; GNRA tetraloop: replacement of the loop with a smaller stable tetraloop sequence; Swap: swapped CG base pairing in the stem region. The yellow highlighted region indicates the CENPB box motif, blue-colored nucleotides are an integral part of the CENPB box motif and red-colored nucleotides are positions that were mutated within the CENPB box motif in our constructs. (B) Predicted structures of wild-type, deletion, GNRA tetraloop, and swap RNAs using mFold (Zuker, 2003). The yellow highlighted region depicts the CENPB box motif in wild-type sequence and red-colored nucleotides correspond to the mutated positions as depicted in A. (C) Quantification of MinSat RNA levels in ESCs after transfection of the pCAG plasmids containing different mutants of MinSat using RT-qPCR analysis. Bars, mean values of N = 3 independent experiments (dots) normalized to β-actin mRNA and empty pCAG vector control (Ctrl); error bars, standard deviation. (D) Representative images of mouse ESCs transfected with plasmids expressing empty plasmid, wild-type, or different mutants. Cells were immunostained with α-tubulin and DAPI. Scale bars, 5 µm. (E) Quantification of chromosome missegregation events in anaphase and telophase mouse ESCs after overexpression of the structural RNA mutants, wild-type, or empty pCAG vector as control (Ctrl), respectively. Bars indicate the mean percentage of N = 3 independent experiments (dots); error bars, standard deviation; *, P value ≤ 0.05 (pair-wise comparison to control).
cenRNAs have been mainly investigated as co-factor for the activity of enzymes such as Aurora kinase B (Blower, 2016; Ferri et al., 2009; Jambhekar et al., 2014), or as interactor of centromeric proteins (Bobkov et al., 2018; Bouzinba-Segard et al., 2006; Chan and Wong, 2012; Grenfell et al., 2016; Ideue et al., 2014; McNulty et al., 2017; Quénet and Dalal, 2014; Rošić et al., 2014). Depleting centromeric transcripts is sufficient to interfere with mitotic progression. Because centromeric DNA sequences share little similarity (Bensasson et al., 2008; Henikoff et al., 2001; Suzuki et al., 2020), investigating centromeric RNAs may inform on the conserved function. We found both cenRNA strands expressed in mouse ESCs and consistently observed higher expression for the reverse transcript. Transcript overexpression led to slightly different phenotypes: the forward strand transcript resulted in a more severe mitotic phenotype but only the reverse transcript impacted cell proliferation and reduced levels of chromatin-bound CENPC. Aurora B and the CPC complex interact with the forward, but not with the reverse MinSat transcripts (Ferri et al., 2009). While we cannot exclude additional effects, for instance through modulation of chromatin structure, we favor the interpretation that these observations reflect the contribution of several feedback loops underlying the homeostasis of cenRNAs. In such a “feedback” model the different affinities for the MinSat transcripts could modulate the amount of “free” CENPC. Binding to a lower affinity (e.g., reverse) transcript, could enable CENPC to bind instead to other protein partners (such as the CPC complex). Such feedback loops could be mediated, for example, by processing by DICER (Kanellopoulou et al., 2005), by the activity of transcription factors regulating their expression (Ishikura et al., 2021), and/or by secondary structures such as R-loops. Indeed, R-loop formation at centromeres can activate ATR in human cancer cells to ensure faithful chromosome segregation (Kabeche et al., 2018). It is thus possible that either transcript strand is prone to form R-loops thus blocking the transcription of the opposite strand. We envision such feedback loops can contribute to a correct balance in the proportion of forward versus reverse MinSat transcripts. Indeed, altering such balance leads to chromosome segregation errors albeit CENPC association to chromatin is only reduced when the reverse transcript is overexpressed. Our RNA pull-down experiments indicate that the forward transcript, though comprising the lower MinSat fraction, associates more strongly with CENPC than the reverse transcript. We thus speculate that under overexpression conditions transcripts “compete” for CENPC binding. This is in line with our observations that CENPC binding to chromatin is only affected when both endogenous forward and reverse transcripts are knocked down and suggests that a balance of the forward and reverse transcripts is important for CENPC association with mitotic chromatin. Thus, it is possible that the forward transcripts affect chromosome segregation through the mislocalization of Aurora B, for example. Yet stem cells are known to tolerate aneuploidy and to uncouple apoptosis in spite of spindle check point activation (Mantel et al., 2007) and thus a cell proliferation phenotype would be less severe. Reverse transcripts, on the other hand, could potentially compete with the endogenous forward transcripts for CENPC binding, which could in turn lead to a reduction of CENPC and CENPA in centromeric chromatin, thereby leading to a defect in cell division and to cell death (Kalitsis et al., 1998; Tomkiel et al., 1994), resulting in a greater proliferation phenotype. From a broader perspective, this would imply that the defective binding or misincorporation of CENPC and CENPA leads to a stronger cell proliferation phenotype in ESCs than aneuploidy resulting from potential spindle defects. Overall, our observations substantiate the notion that homeostasis of cenRNAs is critical for chromosome segregation. We found that the MinSat forward transcript is structured. Remarkably, we identified a similar stem-loop structure in the human ASAT RNA. Taken together, we posit that the stem-loop structure of cenRNA found in the vicinity of the CENPB box is an important feature for the functional evolution of mammalian cenRNAs, potentially by mediating binding to centromeric proteins. In the future, it will be interesting to investigate whether other transcripts capable of recruiting CENPC, such as the Y-chromosome satellites or the long non-coding RNAs PCAT2 and CCTT, which do not contain CENPB motifs, function in a similar way (Arunkumar et al., 2022; Zhang et al., 2022). These considerations could explain how even highly divergent DNA sequences may generate transcripts able to interact with less rapidly evolving protein partners.
Materials and methods
Cell culture
Mouse E14 ESCs and Fucci (Nakatani et al., 2022) cells were grown in Dulbecco’s modified Eagle’s medium (DMEM) with GlutaMAX (31966-021; Invitrogen) containing 15% fetal calf serum (Lot P-10397, Cat P30-3302; PAN-Biotech), 2× leukemia inhibitory factor (IGBMC), penicillin-streptomycin (15140122; Invitrogen), 0.1 mM 2-mercaptoethanol (31350010; Invitrogen), 3 μM CHIR99021 (13122-25, Cayman Chemical), and 1 μM PD0325901 (13034; Cayman Chemical) on gelatin (P06-20410; PAN-Biotech)-coated plates. MEFs were cultured in DMEM with 10% fetal calf serum and penicillin-streptomycin.
Plasmid transfection
2.5 µg pCAG plasmid DNA containing centromeric sequences was first incubated with 5 µl lipofectamine 2000 (11668019; Thermo Fisher Scientific) in 500 µl Opti-MEM (31985062; Thermo Fisher Scientific) for 15 min. For each condition, a total of 250,000 ESCs were transfected in suspension in a single well of 6-well plates. Cells were harvested or fixed 48 h after transfection.
Knockdown of MinSat RNAs
MinSat RNA knockdown was performed with 2′-O-MOE modified antisense oligo (Integrated DNA Technologies). The ASOs are listed in Table S1. Transfection of ASOs was performed using lipofectamine RNAiMAX (13778075; Thermo Fisher Scientific) according to the manufacturer’s protocol. A total amount of 200 µmol (100 μmol each) ASOs were used at a final concentration of 100 µM in the 2 ml final mixture. 250,000 ESCs were transfected in a well of a 6-well plate for each condition and assayed after transfection 24 or 48 h.
Total RNA extraction and Real-Time qPCR
Cells were first lysed in TRIzol reagents (15596018; Invitrogen) following the manufacturer’s instructions. Each 10 µg of total RNA was treated with 2 U of TURBO DNase for 1 h. A second round of TRIzol RNA extraction was performed to remove DNase and buffer. 1 µg of total RNA was used for cDNA synthesis by applying GoScript Reverse Transcriptase (A5001; Promega). For strand-specific reverse transcription, sequence-specific primers (Table S2) were used to discriminate between strands of transcripts. The expression level was determined by using GoTaq qPCR Master Mix (A6002; Promega) on a LightCycler 96 Real-time PCR system (Roche). The qPCR primers are listed in Table S2.
Immunofluorescence
The transfected cells were cultured on gelatin-coated coverslips for 48 h. Cells were fixed with 4% PFA in BRB80 buffer (to preserve tubulin structure) or PBS (for staining of centromeric proteins), respectively, for 10 min at room temperature. After fixation, cells were washed twice with DPBS (14190-144; Gibico) and permeabilized with 0.3% Triton-X100 in DPBS for 10 min at room temperature. Blocking was performed with 3% BSA and 0.1% Triton-X100 in DPBS for 20 min. For antibody hybridization, primary antibodies were incubated overnight at 4°C, washed four times with a wash buffer (1% BSA, 0.1% Triton-X100 in DPBS) followed by incubation for 1 h with secondary antibodies at room temperature. All the antibodies used are listed in Table S3. Then, the samples were washed again four times with wash buffer and three times DPBS. Mowiol was used for sample mounting. Images were acquired on a Leica TCS SP8 confocal microscope with Leica Application Suite X (LASX 3.5.7) with a 63× plan-apochromate NA 1.4 oil immersion objective using photomultiplying tubes (PMTs) and hybrid detectors (HyDs). Pixel (px) size was typically set to 70–80 nm/px and optical sections were acquired every 300 nm.
Image analysis
To measure CENPC intensities in mouse ESCs, we manually selected mitotic cells in micrographs and hand-placed individual points over CREST-labeled foci, which we used as a proxy for kinetochores. Using a Fiji macro, the CENPC mean intensity in a 5-px radius at each selected point was recorded and normalized to the DAPI intensity in the same area to account for decaying fluorescence intensity along the Z axis. The datapoints collected per cell were further aggregated to determine the mean intensity per cell using R, and the mean per experiment was calculated from all mitotic cells.
Chromatin extraction and Western blot analysis
Cells were first synchronized with 100 ng/ml KaryoMAX Colcemid for 3 h. Next, cells were trypsinized and washed twice with cold DPBS. A million cells were lysed in 100 µl Triton Extraction Buffer (PBS containing 0.5% Triton-X100 and protease inhibitor mix (80-6501-23; cytiva) on ice for 10 min. Nuclei were collected by centrifuging at 6,500 g for 10 min at 4°C and washed with 50 µl Triton Extraction Buffer. After washing, nuclei were then treated with 20 µl 0.2 N HCl overnight. The supernatant was transferred and neutralized with 2 M NaOH at 1/10 of vol of the supernatant the next day. For SDS-PAGE, 1 μg of chromatin extract was used for each sample. Protein gel was then transferred to a PVDF membrane. The following antibodies were applied for immunoblotting: CENPA (2048; Cell Signaling), INCENP (ab12183; Abcam), CENPC (ab193666; Abcam), histone H3 (ab1791; Abcam), and GAPDH (MAB374; Millipore).
After antibody hybridization, membranes were washed four times with TBST buffer and imaged with ChemiDoc Touch Imaging System (BioRad). Immunoblots were quantified in Fiji (Schindelin et al., 2012) by measuring band intensities within predefined rectangular regions and further processed after subtracting the local background intensity of the immunoblot membranes.
Cell proliferation assay
Cell proliferation is performed starting with 250,000 cells along with transfection. Cells were trypsinized and hand-counted using a cell counting chamber (8100104; Hirschmann). The cell numbers were documented every 24 h for 3 days.
Flow cytometry analysis of cell cycle distribution
Cells were first trypsinized and washed with DPBS twice. Cold absolute ethanol was used for cell fixation on ice for 30 min. After fixation, cells were treated with 250 µg/ml (Invitrogen) RNase for 5 min at room temperature. Propidium iodide (PI) was then added to the cell mixture at a final concentration of 50 µg/ml and stained for 30 min on ice. For flow cytometry data analysis, Flowjo 10 software was used. Cell cycle analysis is calculated by fitting the Dean-Jett-Fox model.
3′end biotinylated RNA pulldown assay
We in vitro–transcribed RNA using mMESSAGE mMACHINE T7 Transcription Kit (Invitrogen). Then, equimolar (20 µmol) RNAs were labeled with biotin following the manufacturer’s protocol of Pierce RNA 3′ End Biotinylation Kit. After RNA clean-up with RNAClean XP (Beckman Coulter) beads, we heated the RNA at 70°C for 10 min and cooled it down gradually until reaching room temperature. 107 cells were harvested and lysed on ice in Pierce IP Lysis Buffer (Thermo Fisher Scientific) containing RNasin Ribonuclease Inhibitor (Promega) and PMSF. Dynabeads MyOne Streptavidin C1 (Invitrogen) were incubated with biotin-labeled RNA. We next centrifuged the cell lysate at 20,000 rcf for 20 min, and the supernatant was precleared with Dynabeads for 1 h at 4°C. The RNA-conjugated beads were then added into the cell lysate and incubated at 4°C on a rotor for 3 h. The RNA–protein complexes were then washed twice with NT2, NT2-middle, NT2-high, and NT2-KSCN buffer. Finally, all samples were boiled in SDS-PAGE sample buffer (Biorad) and processed by immunoblotting as described above.
RNA transcription and purification
RNA-encoding DNA templates (possessing the T7 promoter sequence) were either prepared using polymerase chain reaction (PCR; primers ordered from Eurofins Genomics) or ordered as single-stranded DNA templates from Eurofins Genomics. PCR reactions were carried out with the Phusion polymerase (New England Biolabs [NEB]) according to manufacturer instructions. RNAs were in vitro–transcribed using in house–prepared T7 polymerase. Briefly, 50 µl transcriptions containing 0.64 μM DNA (supplemented with 0.64 μM T7 top primer for single-stranded DNA templates), 20–80 μM MgCl2, 8 mM of each rNTP, 5% PEG 8000, 1× transcription buffer (5 mM Tris, pH 8, 5 mM spermidine, 10 mM DTT), and 0.6 mg of T7 polymerase were incubated at 37°C for 1 h. Following transcription, the RNAs were purified on urea-denaturing polyacrylamide gels, followed by extraction of the RNA from the gel using the crush and soak method (Mörl and Schmelzer, 1993). Extracted RNAs were equilibrated against water and stored at −20°C until further use.
Selective 2′ hydroxyl acylation analyzed by primer extension (SHAPE)
RNAs possessing 5′ (5′-GGAACAACAAGGCCGGAGUACGGCCAAA-3′) and 3′ (5′-AAAAGCAGCGAGUAGCUGCAACAAAAGAAACAACAACAACAAC-3′) SHAPE cassettes and a universal primer binding site were diluted to 1 μM and SHAPE was carried out as previously described (Wilkinson et al., 2006). Briefly, RNA was snap-cooled (95°C for 3 min, followed by 5 min on ice) in a buffer containing 200 mM NaCl, 100 mM HEPES, pH 8, 0.2 mM EDTA, followed by folding at 37°C (30 min) in a buffer containing 100 mM NaCl, 50 mM HEPES, pH 8, and 16.5 mM MgCl2. RNA was then treated with 1.65, 3.2, or 6.4 mM 1M7 for 5 min at 37°C followed by purification using Poly(A) purist magnetic beads (Invitrogen) according to manufacturer instructions. Purified RNAs were reverse transcribed using the Superscript III reverse transcriptase (Invitrogen) and a 5′ Fam labeled primer (Eurofins Genomics) according to manufacturer instructions, followed by purification using magnetic beads. Fam-labeled cDNA fragments were dissolved in HiDi formamide and sequenced using a SeqStudio Fragment Analyzer. Data were analyzed using HiTRACE (Yoon et al., 2011).
NMR
RNAs were prepared and equilibrated in a buffer containing 15 mM NaCl, 25 mM sodium phosphate, pH 6.4. The RNA was snap-cooled (95°C for 3 min, 4°C for 5 min) and 1D and 1H NOESY NMR spectra were recorded at 278 K on a 1.2 GHz NMR spectrometer equipped with a cryogenic TCI probe.
CatRAPID prediction of RNA binding ability
RNA binding regions of the CenpC protein were identified using CatRAPID (Livi et al., 2016) signature.
Protein expression and purification
DNA encoding for the CENPC protein (amino acids 1–906) was ordered as a codon-optimized GBlock from Integrated DNA Technologies (IDT). Primers (containing NcoI and KpnI enzyme restriction sites) corresponding to the terminal ends of each CatRAPID fragment were ordered from Eurofins Genomics. PCRs were performed using the Phusion polymerase (NEB) according to manufacturer instructions. CatRAPID PCR fragments were double digested with NcoI (NEB) and KpnI (NEB) according to manufacturer instructions, and ligated into a NcoI, KpnI double-digested pETM-11 cloning vector using the NEB Quick Ligase kit. Mini-prepped DNA (obtained from transformations of ligated plasmids into DH10b E. coli competent cells) was sequenced and then transformed into BL21 E. coli competent cells. Colonies were grown up in 1 liter of lysogeny broth at 37°C and induced with 1 M isopropyl β-D-1-thiogalactopyranoside (IPTG) at 18°C. Cells were lysed using a French press in a buffer containing 500 mM NaCl, 10 mM imidazole, 50 mM Tris, pH 8, and 5 mM β-mercaptoethanol. Protein (possessing an N-terminal His6-tag followed by a tobacco enterovirus (TEV) protease cleavage site) was purified by IMAC against an increasing imidazole concentration gradient. The N-terminal His6-tag was cleaved using in house–prepared TEV protease, followed by size exclusion chromatography on a Superdex S75 purification column and eluted in buffer containing 300 mM NaCl, 50 mM Tris pH 7.5, and 5 mM DTT. Protein quality was assessed by SDS PAGE.
Binding shift assays
RNAs were diluted to 0.250 µmol and incubated with increasing concentrations of protein as indicated in the figures. Samples were loaded onto a 1% TBE agarose gel supplemented with DNA Stain G (Serva) and run for 40 min at 70 V at room temperature. Gels were imaged on a GelDoku imager.
Statistical analyses
We used Prism (GraphPad software) and R for statistical analysis. Statistical tests were performed as indicated in the figure legends. For most experiments, we used a paired t test for statistical evaluation, unless otherwise stated in the figure legends. For multiple treatments in immunoblotting experiments, we used the “multcomp” package in R on an ANOVA model, evaluating control to treatment conditions. For t test, we assumed normal distribution, but this was not formally tested.
Online supplemental material
Fig. S1 shows the RT-qPCR analysis of MinSat expression and the controls for the FUCCI sorting and the data upon expression of MinSat in mouse embryonic fibroblasts. Fig. S2 shows the comparison of human and mouse CENPC and the predicted alternative structures of MinSat repeats by SHAPE. Fig. S3 shows the SHAPE-derived structure of the human chromosome 21 ASAT forward transcript and the RT-qPCR controls for the expression of human ASAT in ESCs. Table S1 shows includes the sequence of the antisense oligos used for the MinSat knockdown experiments. Table S2 shows the sequence of the primers used for RT-qPCR analysis of MinSat expression and β-actin control. Table S3 shows the list of all the primary and secondary antibodies used in the manuscript.
Data availability
All data generated are available in the published article and its online supplemental material. The raw data are available from the corresponding author upon reasonable request.
Acknowledgments
This work has been funded primarily by a grant from the German Research Foundation (DFG) to A. Ettinger (ET-124/2-1) with support from funding to M.-E. Torres-Padilla through the Helmholtz Association and the DFG SFB 1064 (project-ID 213249687 to. M.-E. Torres-Padilla) and TRR 267 (project-ID 403584255 to M. Sattler). We acknowledge access to NMR measurement time at the Bavarian NMR Center and Arie Geerlof, Helmholtz Munich protein expression and purification facility, for T7 polymerase and TEV protease.
Author contributions: Y.-L. Chen, A.N. Jones, and A. Ettinger performed and analyzed the experiments; A. Crawford performed experiments for the revised manuscript; M. Sattler, A. Ettinger, and M.-E. Torres-Padilla conceived, designed, and supervised the study. All authors contributed to manuscript preparation and read, commented on, and approved the manuscript.

