


Subcortical heterotopia is a cortical malformation associated with epilepsy, intellectual disability, and an excessive number of cortical neurons in the white matter. Echinoderm microtubule-associated protein like 1 (EML1) mutations lead to subcortical heterotopia, associated with abnormal radial glia positioning in the cortical wall, prior to malformation onset. This perturbed distribution of proliferative cells is likely to be a critical event for heterotopia formation; however, the underlying mechanisms remain unexplained. This study aimed to decipher the early cellular alterations leading to abnormal radial glia. In a forebrain conditional Eml1 mutant model and human patient cells, primary cilia and centrosomes are altered. Microtubule dynamics and cell cycle kinetics are also abnormal in mouse mutant radial glia. By rescuing microtubule formation in Eml1 mutant embryonic brains, abnormal radial glia delamination and heterotopia volume were significantly reduced. Thus, our new model of subcortical heterotopia reveals the causal link between Eml1’s function in microtubule regulation and cell position, both critical for correct cortical development.
Introduction
Cortical development is finely regulated to result in the formation of a functional cerebral cortex required for advanced cognitive functions such as perception and language. At the onset of neurogenesis, neuroepithelial cells (NECs) give rise to apical progenitors named radial glial cells (RG), which become the predominant neuronal progenitor cell type, able to self-renew and also give birth to postmitotic neurons directly or indirectly via basal progenitors (intermediate progenitors or basal RG) (Götz and Barde, 2005; Noctor et al., 2001, 2004; Borrell and Götz, 2014). They are highly polarized cells with a short apical process that faces the ventricle and terminates in an enlarged apical domain where a primary cilium (PC), docked to a basal body (modified centrosome), protrudes into the embryonic cerebrospinal fluid (eCSF) to act as a signaling hub, sensing secreted molecules. RG also possess a long basal process that crosses the entire cortical wall and acts as a support for neuronal migration before terminating at the pial surface (Rakic, 1972). RG somata are restricted to the ventricular zone (VZ) and exhibit interkinetic nuclear migration (INM), a process that defines the cell cycle-dependent movement of the nucleus within the VZ. More precisely, nuclei move in G1 to reach the more basal part of the VZ to undergo S-phase and then redescend apically in G2 to undergo mitosis at the ventricular surface (Sauer and Walker, 1959). INM relies on the actin and microtubule (MT) cytoskeletons, as well as motor proteins such as kinesin and dynein (Spear and Erickson, 2012; Tsai et al., 2010). Genetic mutations can alter RG in different ways, affecting cortical development and leading to cortical malformations (Romero et al., 2018; Stouffer et al., 2016).
Mutations in MT associated proteins can cause cortical malformations (Romero et al., 2018; Stouffer et al., 2016). We and others have identified Echinoderm microtubule-associated protein like 1 (EML1, also known as EMAPL1) mutations associated with human ribbon-like Subcortical heterotopia (SH) (Kielar et al., 2014; Shaheen et al., 2017). Patients with compound heterozygous or homozygous mutations in EML1 exhibit large clusters of abnormally positioned neurons within the white matter (Kielar et al., 2014; Shaheen et al., 2017). Patients may also present hydrocephalus, polymicrogyria, megalencephaly, and corpus callosum pathology (Kielar et al., 2014; Markus et al., 2021; Oegema et al., 2019; Shaheen et al., 2017). Defects are associated with severe epilepsy, intellectual disability, and/or psychomotor developmental delay (Kielar et al., 2014; Oegema et al., 2019). Eml1 mutations were also originally identified in a spontaneously arisen Heterotopic Cortex (HeCo) mouse model (Kielar et al., 2014). To our knowledge, Eml1/EML1 is the only known gene found mutated in both human patients and rodent models with an SH phenotype (Bizzotto and Francis, 2015; Collins et al., 2019; Grosenbaugh et al., 2020; Kielar et al., 2014; Uzquiano et al., 2019). The EML1 protein, a member of the EMAP family, binds to MTs and has an N-terminal domain with a coiled-coil motif and a C-terminal region with a tandem β-propeller structure (Richards et al., 2015). However, its role during neurodevelopment has remained elusive.
In the HeCo mouse, the spontaneous mutation in Eml1 resulted from an insertion of a retrotransposon in an intron toward the end of the gene, leading to the absence of full-length transcripts and the presence of small quantities of chimeric transcripts (Kielar et al., 2014). In this model, it was shown that RG distribution is abnormal during cortical development. Many of these cells were found in basal locations in the cortex (e.g., the intermediate zone and cortical plate), hence proliferating outside the VZ and unable to act as a proper support for neuronal migration from the VZ (Kielar et al., 2014). RG detachment may hence be the primary event leading to heterotopia formation. It is important to further understand why Eml1 mutant RG detach, especially since similar mechanisms may contribute to basal radial glia (bRG) production in gyrencephalic brains (Borrell and Götz, 2014; Penisson et al., 2019).
Previously, apical extremity defects were revealed in HeCo RG, notably the PC did not form correctly, shown in both mutant murine and human progenitor cells (Bizzotto et al., 2017; Jabali et al., 2022; Markus et al., 2021; Uzquiano et al., 2019). We showed that Eml1 full knockout reproduces heterotopia in mice, as well as RG detachment, but some lethality was observed, as well as hydrocephalus (Collins et al., 2019). In this study, we produced Eml1 conditional knockout (cKO) mice with a forebrain-specific inactivation of Eml1, also revealing severe heterotopia but without hydrocephalus. In this new model, we focused on subcellular and cellular RG alterations in early and mid-corticogenesis to understand pathogenic mechanisms that may lead to heterotopia formation. Assessing centrosomes in vitro and in brain sections, we determined that their structure is affected in both human and mouse RG, impacting MT nucleation. This important phenotype may precede PC defects and RG apical detachment in early corticogenesis. By artificially stabilizing MT in embryonic brains at the early stages of corticogenesis, we were able to partially inhibit RG delamination and reduce heterotopia volume, demonstrating a causal relationship between MT physiology, ectopic RG, and heterotopia formation. With these data, we reveal new roles for Eml1 in early cortical development, whilst unveiling key cellular patho-mechanisms contributing to the early onset of SH formation.
Results
Ectopic RG detachment and PC defects occur during early embryonic cortical development in Eml1 cKO mouse brains
To study the role of Eml1 in RG detachment linked to heterotopia formation, we generated a forebrain-specific Eml1 cKO mouse model (Fig. S1 A). By crossing homozygote Eml1-Flox mice (Eml1 fl/fl) with Eml1-Flox mice also heterozygote for Emx1-Cre (Gorski et al., 2002), homozygote forebrain-specific Eml1 cKO (Eml1 fl/fl Emx1-Cre/+) animals were obtained. Controls were Cre-negative Eml1 fl/fl animals. 100% of Eml1 cKO mice exhibit SH, as shown with cresyl violet staining at 8 wk (Fig. S1 B), as well as Satb2 staining at embryonic stage E18.5 and 3D visualization of the heterotopia (Fig. 1 C; and Videos 1 and 2). Eml1 protein was shown to be absent by western blot (WB, Fig. S1 D).
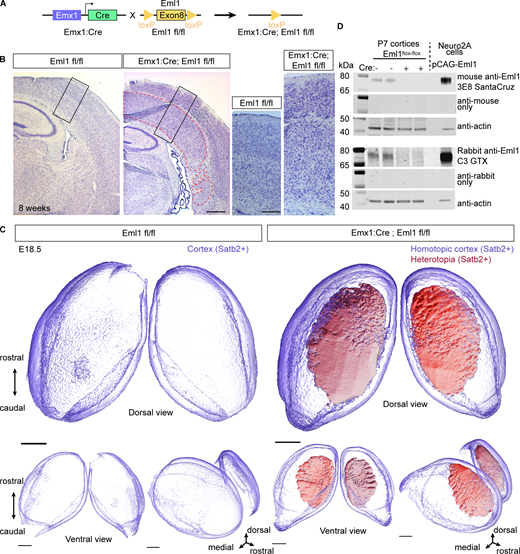
Forebrain inactivation of Eml1 leads to subcortical heterotopia in mouse. (A) Schematic representation of the alleles used to generate Eml1 cKO animals. (B) Cresyl violet staining of individual brains at 8 wk showing SH (red outline) in homozygote mutant animals. (C) Representative images of SatB2 immunofluorescence in 3D visualized by light-sheet microscopy in a control E18.5 embryo compared to an Eml1 cKO. No heterotopia can be detected in the control. The homotopic cortex is depicted in transparency (purple) and the heterotopia is shown with a solid rendering (red). Three different angles are shown. (D) Western blot analyses showing that Eml1 expression is lost in P7 cortices. Specific anti-Eml1 antibodies 3E8 are shown in upper panels, and C3GTX in lower panels. Scale bars (equivalent for WT and cKO): 250 µm in B (main); 100 µm in B inset; 500 µm in C. Source data are available for this figure: SourceData FS1.

Forebrain inactivation of Eml1 leads to subcortical heterotopia in mouse. (A) Schematic representation of the alleles used to generate Eml1 cKO animals. (B) Cresyl violet staining of individual brains at 8 wk showing SH (red outline) in homozygote mutant animals. (C) Representative images of SatB2 immunofluorescence in 3D visualized by light-sheet microscopy in a control E18.5 embryo compared to an Eml1 cKO. No heterotopia can be detected in the control. The homotopic cortex is depicted in transparency (purple) and the heterotopia is shown with a solid rendering (red). Three different angles are shown. (D) Western blot analyses showing that Eml1 expression is lost in P7 cortices. Specific anti-Eml1 antibodies 3E8 are shown in upper panels, and C3GTX in lower panels. Scale bars (equivalent for WT and cKO): 250 µm in B (main); 100 µm in B inset; 500 µm in C. Source data are available for this figure: SourceData FS1.

Pax6+ cells start to detach during early corticogenesis with PC defects observed earlier in the Eml1 cKO mouse model. (A) Representative images of immunolabelling for Pax6 in WT and Eml1 cKO embryonic brain coronal sections from E12.5 to E15.5. (B and C) Quantifications of Pax6+ cell counts per region of interest (ROI of 200 µm width) and C proportion of detached Pax6+ cells above the VZ, expressed as mean ± SEM. (D) Quantifications of cortical wall thickness (CW), ventricular zone thickness (VZ), and the ratio of VZ/CW in percentage, represented as mean ± SEM. Analyses performed at least on three individuals from two different litters and two sections per individual for each genotype and age. (E) Representative images of immunolabeling for Arl13b at the ventricular surface at E12.5 for WT and Eml1 cKO. (F and G) Quantification of cilia mean size and number at E12.5, expressed as mean ± SEM. (H–J) Similar analyses performed at E15.5 with five individuals per genotype and age, analyzed from three different litters. Test and significance: Two-way ANOVA, Sidak’s multiple comparison (Pax6 analyses, CW and VZ thickness [data distribution was assumed to be normal but this was not formally tested]), Mann-Whitney (Arl13b analyses). P value <0.05 *, <0.01 **, <0.001 ***, <0.0001 ****. Scale bars (equivalent for WT and cKO): 30 µm in A, 20 µm in E and 10 µm in H.
Pax6+ cells start to detach during early corticogenesis with PC defects observed earlier in the Eml1 cKO mouse model. (A) Representative images of immunolabelling for Pax6 in WT and Eml1 cKO embryonic brain coronal sections from E12.5 to E15.5. (B and C) Quantifications of Pax6+ cell counts per region of interest (ROI of 200 µm width) and C proportion of detached Pax6+ cells above the VZ, expressed as mean ± SEM. (D) Quantifications of cortical wall thickness (CW), ventricular zone thickness (VZ), and the ratio of VZ/CW in percentage, represented as mean ± SEM. Analyses performed at least on three individuals from two different litters and two sections per individual for each genotype and age. (E) Representative images of immunolabeling for Arl13b at the ventricular surface at E12.5 for WT and Eml1 cKO. (F and G) Quantification of cilia mean size and number at E12.5, expressed as mean ± SEM. (H–J) Similar analyses performed at E15.5 with five individuals per genotype and age, analyzed from three different litters. Test and significance: Two-way ANOVA, Sidak’s multiple comparison (Pax6 analyses, CW and VZ thickness [data distribution was assumed to be normal but this was not formally tested]), Mann-Whitney (Arl13b analyses). P value <0.05 *, <0.01 **, <0.001 ***, <0.0001 ****. Scale bars (equivalent for WT and cKO): 30 µm in A, 20 µm in E and 10 µm in H.
3D visualization of Satb2 staining (in green) of a cortex from a wild type E18 embryo, with corresponding surfacing. No heterotopia was observed. The speed is 24 frames per second.
3D visualization of Satb2 staining (in green) of a cortex from a wild type E18 embryo, with corresponding surfacing. No heterotopia was observed. The speed is 24 frames per second.
3D visualization of Satb2 staining of a cortex from an Eml1 cKO E18 embryo, with corresponding surfacing. The homotopic cortex is depicted in green whereas the heterotopia is shown in pink. The speed is 24 frames per second.
3D visualization of Satb2 staining of a cortex from an Eml1 cKO E18 embryo, with corresponding surfacing. The homotopic cortex is depicted in green whereas the heterotopia is shown in pink. The speed is 24 frames per second.
After confirming the presence of heterotopia in adult Eml1 cKO animals, RG were characterized during development. Performing immunolabeling for Pax6, a transcription factor marker of RG (Englund et al., 2005), on embryonic coronal brain sections at different developmental stages, the distribution of cells was analyzed throughout the cortical regions. At E12.5, no differences in the total count of Pax6 positive (+) cells neither in the proportion of detached RG (outside the VZ) were observed in Eml1 cKO brains (Fig. 1, A–C) compared with controls. From E13.5, the proportion of detached Pax6+ cells was increased in Eml1 cKO embryonic brains, as well as the total number of Pax6+ cells (Fig. 1, A–C). This suggests that RG begin to detach from E12.5 to E13.5 in the absence of Eml1. Cortical wall thickness (CW) was unchanged until E15.5 when it was thicker in the Eml1 cKO condition (Fig. 1 D). VZ thickness compared to CW thickness was significantly reduced at E14.5 and E15.5 suggesting that the progenitor pool in the VZ is depleted over time (Fig. 1 D).
Previously PC defects were observed in HeCo Eml1 mutants (Bizzotto et al., 2017; Uzquiano et al., 2019), we hence assessed if they were defective at early- and mid-corticogenesis in Eml1 cKO brains. Arl13b (a marker of PC) was immunodetected, revealing a puncta at the ventricular surface. At E12.5, the total number of Arl13b+ puncta was not changed, but the mean length of PC was reduced in mutants (Fig. 1, E–G). At E15.5, PC mean size was not significantly different, although a tendency for reduction was observed. However, the number of Arl13b+ puncta was decreased (Fig. 1, H–J). These data suggest that PC defects are present before observation of detached RG and that they are consistently observed in all Eml1 mouse models.
Thus, these data suggest that Pax6+ cells start to detach from E12.5 to E13.5 when an overall increased number of Pax6+ RG is observed. Detachment correlates with a depletion of the VZ pool of RG during corticogenesis.
We further tested if RG detach in a stage-specific manner in Eml1 mutant conditions. In utero electroporation (IUE) was performed to introduce the BLBP-GFP plasmid into RG at the ventricular surface at different stages. One day after IUE, embryos were sacrificed and immunolabeling for Pax6 was performed to assess the percentage of electroporated RG in the VZ versus those outside the VZ (detached or ectopic progenitors). In the Eml1 cKO, an increased percentage of BLBP-GFP+ Pax6+ cells was found outside the VZ compared with the WT after IUE at E12.5 and sacrifice at E13.5 (Fig. 2, A and B). There were correspondingly fewer cells observed in the VZ. From E14.5 to E15.5, a proportion of BLBP-GFP+ Pax6+ cells outside the VZ was observed but this was not significantly different from WT (Fig. 2, C and D). This suggests that in the Eml1 cKO, more RG delaminate early, relative to mid-corticogenesis.

Abnormal detachment of RG occurs at early but not mid-corticogenesis. (A and B) Representative images and, Quantification of the distribution of GFP+Pax6+ cells in the VZ or outside the VZ between WT and Eml1 cKO brains 1 day post-IUE, at E13.5. (C and D) Representative images and Quantification of the distribution of GFP+Pax6+ cells in the VZ or outside the VZ between WT and Eml1 cKO brains 1 day post-IUE, at E15.5. Histograms show mean ± SEM. Boxes with dotted lines indicate the areas of higher magnification images displayed. Arrows indicate GFP+Pax6+ double positive cells. N = 5 for each condition from 3 to 4 litters. Test and significance: Two-way ANOVA, Sidak’s multiple comparison test. Data passed normality test. P value <0.0001 ****. Scale bars (A and C, equivalent for WT and cKO): 50 µm (for main and insets).
Abnormal detachment of RG occurs at early but not mid-corticogenesis. (A and B) Representative images and, Quantification of the distribution of GFP+Pax6+ cells in the VZ or outside the VZ between WT and Eml1 cKO brains 1 day post-IUE, at E13.5. (C and D) Representative images and Quantification of the distribution of GFP+Pax6+ cells in the VZ or outside the VZ between WT and Eml1 cKO brains 1 day post-IUE, at E15.5. Histograms show mean ± SEM. Boxes with dotted lines indicate the areas of higher magnification images displayed. Arrows indicate GFP+Pax6+ double positive cells. N = 5 for each condition from 3 to 4 litters. Test and significance: Two-way ANOVA, Sidak’s multiple comparison test. Data passed normality test. P value <0.0001 ****. Scale bars (A and C, equivalent for WT and cKO): 50 µm (for main and insets).
Based on the progenitor abnormalities detected, we decided to investigate if progenitors exhibit cell cycle defects in the absence of Eml1.
Eml1 cKO induces stage-specific cell cycle alterations in VZ RG at E12 and E15
We first investigated the cell cycle using a method of staggered injection of dual thymidine analogs in pregnant females at E12.5 and E15.5 (adapted from Harris et al. [2018] and schematized in Fig. 3 A). Briefly, EdU+, BrdU+, and Edu+BrdU+ cells (labeled with red, green, and white fluorescence) were counted, allowing a calculation of S-phase and cell cycle length for apical RG (Pax6+) (Martynoga et al., 2005; Nowakowski et al., 1989).

Cell cycle analyses of Pax6+ cells in E12.5 and E15.5 WT and Eml1 cKO brains. (A) Schematic representation of EdU and BrdU injections performed for cell cycle analyses and related formulae to calculate duration of S-phase and the cell cycle. (B) Representative images of EdU/BrdU/Pax6 labeling of E12.5 coronal brain slices from WT and Eml1 cKO. (C) Quantifications of S-phase length (Ts), cell cycle length (Tc), G1+G2+M length in hours at E12.5, expressed as mean ± SEM. (D) Distribution of cells in the E12.5 cortical wall divided into six identical bins. Distributions are shown for cells entering in S-phase, maintained in S-phase and for those that exit S-phase, expressed as mean ± SEM. (E and F) Similar analyses performed at E15.5, comparing mutant cells in the VZ and outside. (G) Schematic representation of cell cycle phase lengths for results obtained at E12.5 and E15.5 in WT and Eml1 cKO embryos. Analysis was performed on five individuals from 3 litters per genotype and two ROI were analyzed per individual. Test and significance: Mann-Whitney, Two-way ANOVA, Dunn’s post test (distribution analyses: data passed normality test). P value <0.05 *, <0.01 **. Scale bars (equivalent for WT and cKO): 15 μm at E12.5 and 30 μm at E15.5.
Cell cycle analyses of Pax6+ cells in E12.5 and E15.5 WT and Eml1 cKO brains. (A) Schematic representation of EdU and BrdU injections performed for cell cycle analyses and related formulae to calculate duration of S-phase and the cell cycle. (B) Representative images of EdU/BrdU/Pax6 labeling of E12.5 coronal brain slices from WT and Eml1 cKO. (C) Quantifications of S-phase length (Ts), cell cycle length (Tc), G1+G2+M length in hours at E12.5, expressed as mean ± SEM. (D) Distribution of cells in the E12.5 cortical wall divided into six identical bins. Distributions are shown for cells entering in S-phase, maintained in S-phase and for those that exit S-phase, expressed as mean ± SEM. (E and F) Similar analyses performed at E15.5, comparing mutant cells in the VZ and outside. (G) Schematic representation of cell cycle phase lengths for results obtained at E12.5 and E15.5 in WT and Eml1 cKO embryos. Analysis was performed on five individuals from 3 litters per genotype and two ROI were analyzed per individual. Test and significance: Mann-Whitney, Two-way ANOVA, Dunn’s post test (distribution analyses: data passed normality test). P value <0.05 *, <0.01 **. Scale bars (equivalent for WT and cKO): 15 μm at E12.5 and 30 μm at E15.5.
S-phase duration was increased in Eml1 cKO RG at E12.5 compared with WT (4.98 h in WT; 9 h in cKO) (Fig. 3, B, C, and G). The cell-cycle duration was also lengthened (8.716 h in WT; 15 h in Eml1 cKO). G1+G2+M duration was not significantly different, although there was a tendency for a longer duration in cKO cells (Fig. 3 C). We also looked at the distribution of the cells in the S-phase by dividing the cortical wall into six identical bins. In the Eml1 cKO cortical wall, there was an increased proportion of cells entering in S-phase apically (e.g., bin 2) and an inversed tendency for those exiting (Fig. 3 D).
At E15.5, the cell cycle duration was calculated for Eml1 cKO RG in the VZ, Eml1 cKO RG outside the VZ (ectopic RG), compared with WT RG in the VZ. The total cell cycle duration was shorter in Eml1 cKO RG in the VZ (20.67 h in WT; 11.05 h in VZ cKO RG, and 15.99 h in basal ectopic cKO RG) associated with a shortening of G1+G2+M phase (Fig. 3, E–G). S-phase length was not altered significantly at this time point. Eml1 cKO RG outside the VZ exhibited an intermediate phenotype between WT and Eml1 cKO RG in the VZ (Fig. 3, E–G). Cell cycle phase and length durations did not differ significantly from the WT nor from cKO RG in the VZ.
With the dual injection method, it was not possible to determine the duration for G1 and G2/M separately, so we additionally performed coimmunolabeling of Ki67 and PCNA, associating cells to a cell cycle phase based on their labeling pattern (protocol adapted from Fousse et al. [2019], Fig. S2 A). At E12.5, the proportion of S-phase cells was greater in Eml1 cKO RG, indicating that the relative duration of S-phase is longer, as also shown with the dual injection method (Fig. S2, B and C). At E15.5, in Eml1 cKO cells in the VZ, the S-phase proportion of cells was unchanged compared with WT, whereas G1-phase cells were reduced, and G2/M cells were increased, suggesting a relative lengthening of G2/M and shortening of G1 duration. Ectopic RG showed no significant differences compared with WT (Fig. S2, D and E). Thus, there is overlap between the results of the two methods, revealing robust defects in S-phase at E12.5 and pinpointing alterations in G1, G2/M in Eml1 cKO RG in the VZ at E15.5. In the absence of Eml1, it is clear that progenitors exhibit stage-specific cell cycle alterations. Based on these and the PC results, we were interested in assessing the possible upstream subcellular and molecular mechanisms that might help explain the defects.

Altered proportion of cells in cell cycle phases in Eml1 mutant conditions. (A) Examples of PCNA and Ki67 labeling patterns (cropped nuclei) for different cell cycle phases, punctate Ki67, or PCNA are indicated with a red arrow. (B) Representative images for PCNA and Ki67 labeling at E12.5 in WT and Eml1 cKO cells in the VZ. (C) Quantification for the percentage of proliferating cells in S, G1, or G2/M phases of the cell cycle expressed as mean ± SEM. n = 6 individuals per genotype at E12.5. (D and E) Similar analyses were performed at E15.5, with n = 5 individuals per genotype. Test and significance: Two-way ANOVA, Sidak’s multiple comparison (E12.5), Tukey’s post-test at (E15.5). Data passed normality test. P value <0.05 *, <0.001 *** Scale bar (equivalent for WT and cKO): 30 µm.

Altered proportion of cells in cell cycle phases in Eml1 mutant conditions. (A) Examples of PCNA and Ki67 labeling patterns (cropped nuclei) for different cell cycle phases, punctate Ki67, or PCNA are indicated with a red arrow. (B) Representative images for PCNA and Ki67 labeling at E12.5 in WT and Eml1 cKO cells in the VZ. (C) Quantification for the percentage of proliferating cells in S, G1, or G2/M phases of the cell cycle expressed as mean ± SEM. n = 6 individuals per genotype at E12.5. (D and E) Similar analyses were performed at E15.5, with n = 5 individuals per genotype. Test and significance: Two-way ANOVA, Sidak’s multiple comparison (E12.5), Tukey’s post-test at (E15.5). Data passed normality test. P value <0.05 *, <0.001 *** Scale bar (equivalent for WT and cKO): 30 µm.
Eml1 interactome indicates cell cycle and microtubule proteins
To gain insight into potential perturbations of protein interactions that occur when EML1 is mutated (SH mutation EML1*T243A [Kielar et al., 2014]), BioID proximity labeling was performed. BioID uses an abortive E.coli biotin ligase (BirA) fused to a target protein to biotinylate its nearby interactors (Roux et al., 2012). Here, BirA was fused to the N-terminus of EML1 and EML1*T243A and expressed in Neuro2A cells. We carefully checked for centrosomal defects in transfected cells (in interphase and during mitosis) without identifying any obvious abnormalities (Fig. S3 A). Cell size and multinucleation defects were also not observed.
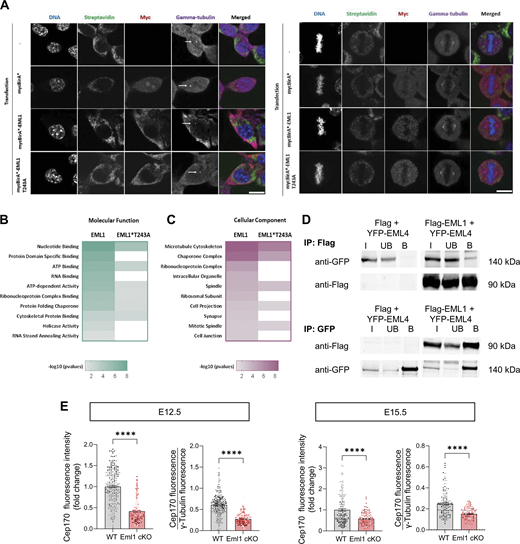
BioID and gene ontology analyses of WT and T243A Eml1 interacting partners, Cep170 cell analyses. (A) Centrosomes were carefully checked in transfected Neuro2A cells, in interphase and during mitosis. No obvious abnormalities were identified. (B and C) Gene ontology (GO) annotation grouped into molecular function (B) and cellular component (C) of EML1 and EML1*T243A proximal interactors. (D) Representative immunoblots of coimmunoprecipitation of EML1 and EML4. Mutant EML1 was not assessed. (E) Analyses of individual puncta of Cep170 fluorescence intensity at the centrosomes, also normalized to γ-tubulin intensity, expressed as mean ± SEM (n = 4 embryos from 2 litters, two ROI analyzed per embryo). Test and significance: Mann-Whitney. P value <0.0001 ****. Scale bar (equivalent all images): 10 µm. Source data are available for this figure: SourceData FS3.

BioID and gene ontology analyses of WT and T243A Eml1 interacting partners, Cep170 cell analyses. (A) Centrosomes were carefully checked in transfected Neuro2A cells, in interphase and during mitosis. No obvious abnormalities were identified. (B and C) Gene ontology (GO) annotation grouped into molecular function (B) and cellular component (C) of EML1 and EML1*T243A proximal interactors. (D) Representative immunoblots of coimmunoprecipitation of EML1 and EML4. Mutant EML1 was not assessed. (E) Analyses of individual puncta of Cep170 fluorescence intensity at the centrosomes, also normalized to γ-tubulin intensity, expressed as mean ± SEM (n = 4 embryos from 2 litters, two ROI analyzed per embryo). Test and significance: Mann-Whitney. P value <0.0001 ****. Scale bar (equivalent all images): 10 µm. Source data are available for this figure: SourceData FS3.
After the isolation of biotinylated proteins and tryptic digestion (Fig. 4 A), peptides were analyzed by LC-MS/MS. A Significance Analysis of INTeractome (SAINT) probability (SP) score (Teo et al., 2014) and fold changes were generated. Using an SP score ≥0.6 resulted in 49 and 30 proximal interactor proteins for EML1 and EML1*T243A, respectively (Fig. 4, B and C). Thus, the EML1*T243A interactome comprised fewer proteins compared with the WT. Also, when 26 common interactors for EML1 and EML1*T243A were plotted according to their SP scores (not necessarily falling below SP < 0.6), these were found reduced in the mutant (Fig. 4 D). Gene ontology (GO) analyses were performed based on molecular function, cellular compartment, and biological process (Fig. 4 E; and Fig. S3, B and C). This showed that the most enriched biological processes are organelle organization, translation, peptide biosynthetic process, peptide metabolic process, cell cycle, and MT-based processes (Fig. 4 E). The GO analyses related to the SH-associated mutant form of EML1 revealed correspondingly fewer of these biological processes. Cross-referencing the BioID hits showed that a number were also uncovered previously (e.g., [Cep170, Eml4, Dnmt1, Dhx15, Ddx3x, Nat10, Ddx6, Ruvb1, Eif2s3x, Rpl10a, Tjp1, Dnajc7, and Rpl10]) (Bizzotto et al., 2017).

Eml1 interacting partner analyses reveal centrosomal protein Cep170 as an interactor, and reduced presence at the centrosome in Eml1 mutant cells in vivo. (A) BioID workflow to identify proximal interactors of EML1 and EML1*T243A. (B) For EML1 and EML1*T243A BioID analysis, each hit is represented on the scatter plot displays by its Saint Probability (SP) score versus its fold change in the spectral count over the control. (C) Venn diagram displaying overlapping hits for EML1 and EML1*T243A with an SP ≥ 0.6. (D) Heat map showing the SP scores of EML1 and EML1*T243A proximal interactors. (E) Gene ontology (GO) annotation grouped into biological process of EML1 and EML1*T243A proximal interactors. (F) Proximal interactors of EML1 related to microtubule cytoskeleton, spindle, and organelle cellular components (underlined proteins lose interaction significance in EML1*T243A SP < 0.6). (G) Representative images of Cep170 labeling at the ventricular surface in E12.5 WT and Eml1 cKO brains. (H) Quantifications of Cep170 fluorescence intensity at the centrosomes, also normalized to γ-tubulin intensity, expressed as mean ± SEM (the P value is indicated). (I and J) Similar analyses were performed at E15.5. For BioID experiments each condition has three replicates stemming from three independent experiments. Cep170 fluorescence intensity analyzes were performed from at least four individuals per genotype from three different litters and two ROI analyzed per individual. Test and significance: Mann-Whitney. P value <0.05 *. Scale bars (equivalent for WT and cKO): 10 µm.
Eml1 interacting partner analyses reveal centrosomal protein Cep170 as an interactor, and reduced presence at the centrosome in Eml1 mutant cells in vivo. (A) BioID workflow to identify proximal interactors of EML1 and EML1*T243A. (B) For EML1 and EML1*T243A BioID analysis, each hit is represented on the scatter plot displays by its Saint Probability (SP) score versus its fold change in the spectral count over the control. (C) Venn diagram displaying overlapping hits for EML1 and EML1*T243A with an SP ≥ 0.6. (D) Heat map showing the SP scores of EML1 and EML1*T243A proximal interactors. (E) Gene ontology (GO) annotation grouped into biological process of EML1 and EML1*T243A proximal interactors. (F) Proximal interactors of EML1 related to microtubule cytoskeleton, spindle, and organelle cellular components (underlined proteins lose interaction significance in EML1*T243A SP < 0.6). (G) Representative images of Cep170 labeling at the ventricular surface in E12.5 WT and Eml1 cKO brains. (H) Quantifications of Cep170 fluorescence intensity at the centrosomes, also normalized to γ-tubulin intensity, expressed as mean ± SEM (the P value is indicated). (I and J) Similar analyses were performed at E15.5. For BioID experiments each condition has three replicates stemming from three independent experiments. Cep170 fluorescence intensity analyzes were performed from at least four individuals per genotype from three different litters and two ROI analyzed per individual. Test and significance: Mann-Whitney. P value <0.05 *. Scale bars (equivalent for WT and cKO): 10 µm.
To further investigate the BioID hits of EML1, cellular components related to the cytoskeleton, spindle, and organelles were highlighted (Fig. 4 F). Validating the BioID screen, we were able to coimmunoprecipitate EML1 with EML4 (Fig. S3 D). Also, Vcpip1 is a previously established WT Eml1 partner, for which the interaction is lost with the missense mutation (Uzquiano et al., 2019). A further interacting protein that was specifically identified with WT EML1 is Cep170. This was not identified when EML1 carried the patient mutation (T243A). Cep170 is known to be essential for centrosome maturation and is a marker of the mature centriole. We checked for Cep170 intensity at the centrosomes located at the ventricular surface of E12.5 and E15.5 WT and cKO embryonic brains and observed that its intensity was significantly decreased in the Eml1 cKO at E12.5, with a possible tendency for reduction at E15.5 (Fig. 4, G–J and Fig. S3 E). Eml1 interaction with Cep170 may thus be important for the localization of the latter to centrosomes. Eml1 could be essential for centrosome integrity during early cortical development, influencing cell cycle and PC.
Human and mouse centrosomes are defective upon EML1/Eml1 mutation and this is rescued by EpoD treatment
Along with centrosomal and PC proteins identified by BioID (e.g., Cep170, Ckap2, Cct2, Cct28), several proteins related to the Golgi apparatus were also identified (e.g., Copg2 and Vcpip1). General secretory trafficking from the Golgi apparatus was indeed shown to be delayed in Eml1 mutant RG ([Uzquiano et al., 2019] and data not shown). Cargo trafficking and Golgi-derived protein transport are key to PC formation, we therefore decided to investigate PC protein trafficking. Using primary cultures of Pax6+ cells (Sun et al., 2011), we first tested the Retention Using Selective Hook (RUSH) approach (Boncompain et al., 2012). Proteins are released from the endoplasmic reticulum (ER)/Golgi after the addition of biotin and can be monitored in fixed cells at different time points (0, 30, 60, and 90 min, as schematized in Fig. S4 A). By performing immunolabeling of GM130 to visualize the Golgi (Nakamura et al., 1995) and Arl13b to label the PC, we assessed the concentration of SSTR3 and PKD2 PC proteins in each organelle over time. In control cells, we observed that SSTR3-GFP increased in the Golgi at 30 min and in the PC at 60 min (Fig. S4, B and C). In Eml1 cKO progenitors compared with WT, SSTR3-GFP levels were lower both in the Golgi at 30 min and in the PC at 60 min (Fig. S4, B and C). For PKD2-GFP, under control conditions, we observed a small increase at the Golgi at 30 min and in the PC at 60 min, but in Eml1 cKO, a significant increase of the protein was still observed at the Golgi at 60 min with a tendency for decrease at the PC (Fig. S4 D). These abnormal profiles suggest that the anterograde trafficking of PC proteins is impaired.

Trafficking to the PC is altered in Eml1 cKO RG. (A) Schematized method of the Retention Using Selective Hook (RUSH) approach, used here for PC protein trafficking analyses in primary cultures of Pax6+ cells. (B) Representative images of GM130, Arl13b labeling, and SSTR3-GFP signal on WT and Eml1 cKO cells in culture at the different time points analyzed. (C and D) Quantifications for SSTR3 (C), PKD2 (D) RUSH construct concentration in the Golgi and in the PC over time (0, 30, 60, and 90 min) in WT and Eml1 cKO cells in culture, values represent mean ± SEM. Quantifications were performed on at least 15 cells from two independent cultures for each genotype and analyzed protein. Test and significance: Two-way ANOVA. Sidak’s multiple comparison. Data distribution was assumed to be normal but this was not formally tested. P value <0.05 *, <0.01 **, <0.001 ***. Scale bar (equivalent for WT and cKO, all time points): 5 µm.

Trafficking to the PC is altered in Eml1 cKO RG. (A) Schematized method of the Retention Using Selective Hook (RUSH) approach, used here for PC protein trafficking analyses in primary cultures of Pax6+ cells. (B) Representative images of GM130, Arl13b labeling, and SSTR3-GFP signal on WT and Eml1 cKO cells in culture at the different time points analyzed. (C and D) Quantifications for SSTR3 (C), PKD2 (D) RUSH construct concentration in the Golgi and in the PC over time (0, 30, 60, and 90 min) in WT and Eml1 cKO cells in culture, values represent mean ± SEM. Quantifications were performed on at least 15 cells from two independent cultures for each genotype and analyzed protein. Test and significance: Two-way ANOVA. Sidak’s multiple comparison. Data distribution was assumed to be normal but this was not formally tested. P value <0.05 *, <0.01 **, <0.001 ***. Scale bar (equivalent for WT and cKO, all time points): 5 µm.
The centrosome serves as the base of the PC and plays a role in assembly, maintenance, and signaling pathways. Dysfunction of the centrosome can contribute to defects in PC formation and function, resulting in a variety of diseases, including ciliopathies. Understanding the relationship between the centrosome and PC is thus important for uncovering the molecular mechanisms underlying cilia-related dysfunctions. Centrosome structure was hence assessed using electron microscopy (EM) in human cells from two EML1 patients (patient 1, compound heterozygous, R138X, T243A; patient 2, homozygous, W225R [Jabali et al., 2022]). In cortical progenitors derived from induced pluripotent stem cells (IPSCs [Jabali et al., 2022]), all patient cells examined exhibited abnormal centrosomes with poorly formed MT triplets (Fig. 5, A and B). In addition, 83.33% showed MT aggregates near the centrosomes, suggesting centriole assembly defects in patient cells (Fig. 5, A and B). Treatment with Epothilone D (EpoD, a microtubule polymerizing and stabilizing agent) was shown previously to rescue PC length defects in EML1 patient cells (Jabali et al., 2022). We therefore asked whether this treatment could also rescue centrosome defects. After EpoD treatment, 86% of EML1 patient cells showed rescued centrosomal structure and fewer cells (37.93%) showed MT aggregates in the vicinity of the centrosomes (Fig. 5, A and B). These results may indicate that centrosome defects contribute to PC formation defects in mutant cells.

Centrosomal alterations in human patient and mouse mutant cells. (A) Representative electron microscopy (EM) images of control and EML1 patient cortical progenitors. Cells are untreated or treated with Epothilone D (EpoD). (B) Quantifications (cells with defective centrosomes, black arrowhead in A, and MT aggregates, circled in A) performed on treated or non-treated human cells, values expressed as mean ± SEM. (C) Representative images of pericentrin and γ-tubulin labeling on Pax6+ cells cultured from WT and Eml1 cKO embryonic brains. Enlargement of pericentrin is shown in the right panel and the red contours show the pericentrin areas in WT and Eml1 cKO cells. (D) Quantification of the total number of centrosome puncta per cell and γ-tubulin fluorescence intensity per centrosome represented as mean ± SEM. (E) Quantification of pericentrin fluorescence intensity and pericentrin area represented as mean ± SEM. γ-Tubulin and pericentrin intensity were analyzed in 90 WT and 89 cKO cells from three independent cultures, indicated by different colors. Pericentrin area measurement was performed on 72 WT cells and 73 cKO cells. Test and significance: Mann-Whitney. P value <0.0001 ****. Scale bars: for A 0.2 µm (equivalent for all images); for C (equivalent for WT and cKO): 5 µm (for main and insets).
Centrosomal alterations in human patient and mouse mutant cells. (A) Representative electron microscopy (EM) images of control and EML1 patient cortical progenitors. Cells are untreated or treated with Epothilone D (EpoD). (B) Quantifications (cells with defective centrosomes, black arrowhead in A, and MT aggregates, circled in A) performed on treated or non-treated human cells, values expressed as mean ± SEM. (C) Representative images of pericentrin and γ-tubulin labeling on Pax6+ cells cultured from WT and Eml1 cKO embryonic brains. Enlargement of pericentrin is shown in the right panel and the red contours show the pericentrin areas in WT and Eml1 cKO cells. (D) Quantification of the total number of centrosome puncta per cell and γ-tubulin fluorescence intensity per centrosome represented as mean ± SEM. (E) Quantification of pericentrin fluorescence intensity and pericentrin area represented as mean ± SEM. γ-Tubulin and pericentrin intensity were analyzed in 90 WT and 89 cKO cells from three independent cultures, indicated by different colors. Pericentrin area measurement was performed on 72 WT cells and 73 cKO cells. Test and significance: Mann-Whitney. P value <0.0001 ****. Scale bars: for A 0.2 µm (equivalent for all images); for C (equivalent for WT and cKO): 5 µm (for main and insets).
Given these results, key centrosome proteins were assessed in primary cultures of Pax6+ cells from the Eml1 cKO mouse brain. Labeling for γ-tubulin (a marker of centrosomes) showed that the number of γ-tubulin puncta per cell was not altered significantly in mutant cells, however the intensity of γ-tubulin was decreased (Fig. 5, C and D). Also, pericentrin (pcnt), a marker of pericentriolar material (PCM), a complex of proteins surrounding centrioles, was reduced in intensity (Fig. 5, C and E). The relative dispersion of the PCM, measured from the pcnt-labeled area, may also be decreased (Fig. 5 E). Thus, EML1/Eml1 seems to contribute to centrosome integrity in human and mouse progenitors.
Eml1 is essential for the recruitment of key proteins at the centrosome
To detect centrosomes in vivo during early and mid-corticogenesis, γ-tubulin and pcnt were examined in coronal brain sections. The distribution of centrosomes along the cortical wall at E12.5 and E15.5 was revealed by labeling with γ-tubulin. At E12.5, mutant brain centrosomes were abnormally distributed with fewer γ-tubulin+ puncta in the first 10 µm above the ventricular surface and more within the 10–20 µm range compared with WT (Fig. 6, A and B). A similar trend was observed at E15.5 (Fig. 6, D and E). This suggests that centrosome distribution may be altered prior to the observation of detached RG. Overall numbers of puncta at each stage are unchanged (Fig. 5 A). We also checked for γ-tubulin intensity at the ventricular surface and observed at E12.5 a tendency for decreased fluorescence intensity in Eml1 cKO conditions, with fewer obvious changes at E15.5 (Fig. 6, C and F; and Fig. S5 B). Likewise, labeling for pcnt revealed that PCM dispersion was reduced in the cKO condition specifically at E12.5, but not at E15.5 (Fig. 6, G and H; and Fig. S5 C). These results suggest that at E12.5, γ-tubulin, and pcnt are not well recruited to the centrosomes in the absence of Eml1.

Eml1 is essential for the recruitment of key proteins at the centrosomes in early corticogenesis. (A) Representative images of immunofluorescence labelling of γ-tubulin at the ventricular surface of embryonic coronal sections at E12.5 from WT and Eml1 cKO individuals. (B) Quantifications of γ-tubulin+ puncta distribution from the 0–70 µm from the apical surface at E12.5 in WT and Eml1 cKO embryonic brain sections, expressed as mean ± SEM. (C) Quantification of γ-tubulin fluorescence intensity at E12.5 (the P value is indicated), expressed as mean ± SEM. (D–F) Similar analyses were performed at E15.5. (G) Representative images of pericentrin labeling at the ventricular surface at E12.5 in WT and Eml1 cKO brains, and quantification of pericentrin dispersion at E12.5, expressed as mean ± SEM. (H) Similar analyses were performed at E15.5 (the P value is indicated). For centrosome analyses n = 5 individuals from 3 litters were analyzed per genotype and age. Two ROI were analyzed per individual. For pericentrin area analyses: at least four individuals were analyzed from 3 litters per genotype and age. Test and significance: Two-way ANOVA, Bonferroni post tests (distribution analyses: data passed normality test), Mann-Whitney. P value <0.05 *. Scale bars (equivalent for WT and cKO): 30 µm (for A and D); 10 µm in G and H (main), 5 µm (for G and H insets).
Eml1 is essential for the recruitment of key proteins at the centrosomes in early corticogenesis. (A) Representative images of immunofluorescence labelling of γ-tubulin at the ventricular surface of embryonic coronal sections at E12.5 from WT and Eml1 cKO individuals. (B) Quantifications of γ-tubulin+ puncta distribution from the 0–70 µm from the apical surface at E12.5 in WT and Eml1 cKO embryonic brain sections, expressed as mean ± SEM. (C) Quantification of γ-tubulin fluorescence intensity at E12.5 (the P value is indicated), expressed as mean ± SEM. (D–F) Similar analyses were performed at E15.5. (G) Representative images of pericentrin labeling at the ventricular surface at E12.5 in WT and Eml1 cKO brains, and quantification of pericentrin dispersion at E12.5, expressed as mean ± SEM. (H) Similar analyses were performed at E15.5 (the P value is indicated). For centrosome analyses n = 5 individuals from 3 litters were analyzed per genotype and age. Two ROI were analyzed per individual. For pericentrin area analyses: at least four individuals were analyzed from 3 litters per genotype and age. Test and significance: Two-way ANOVA, Bonferroni post tests (distribution analyses: data passed normality test), Mann-Whitney. P value <0.05 *. Scale bars (equivalent for WT and cKO): 30 µm (for A and D); 10 µm in G and H (main), 5 µm (for G and H insets).

Centrosome and α-tubulin modifications at E12.5 and/or E15.5 in WT and Eml1 cKO brains. (A) Analyses of overall numbers of γ-tubulin puncta at each stage. (B and C) γ-tubulin intensity (B) and pcnt dispersion (C) analyses at E12.5 and E15.5 by individual puncta, expressed as mean ± SEM. For centrosome analyses n = 5 individuals from 3 litters were analyzed per genotype and age. Two ROI were analyzed per individual. For pericentrin area analyses: at least four individuals were analyzed from 3 litters per genotype and age. (D) Immunolabeling of α-tubulin on embryonic brain slices at E12.5 in WT and Eml1 cKO. (E and F) Quantifications from the ventricular surface to 100 µm height show a reduction in intensity, especially close to the ventricular surface. Quantification of α-tubulin mean intensity per ROI (47% decrease was observed in the VZ). Values represent mean ± SEM (n = 4 embryos for each case). Test and significance: Mann-Whitney (γ-tubulin and pcnt analyses), Two-way Anova (α-tubulin analyses, data distribution was assumed to be normal but this was not formally tested). P value <0.001 ***, <0.0001 ****. Scale bar (equivalent for WT and cKO): 30 µm.

Centrosome and α-tubulin modifications at E12.5 and/or E15.5 in WT and Eml1 cKO brains. (A) Analyses of overall numbers of γ-tubulin puncta at each stage. (B and C) γ-tubulin intensity (B) and pcnt dispersion (C) analyses at E12.5 and E15.5 by individual puncta, expressed as mean ± SEM. For centrosome analyses n = 5 individuals from 3 litters were analyzed per genotype and age. Two ROI were analyzed per individual. For pericentrin area analyses: at least four individuals were analyzed from 3 litters per genotype and age. (D) Immunolabeling of α-tubulin on embryonic brain slices at E12.5 in WT and Eml1 cKO. (E and F) Quantifications from the ventricular surface to 100 µm height show a reduction in intensity, especially close to the ventricular surface. Quantification of α-tubulin mean intensity per ROI (47% decrease was observed in the VZ). Values represent mean ± SEM (n = 4 embryos for each case). Test and significance: Mann-Whitney (γ-tubulin and pcnt analyses), Two-way Anova (α-tubulin analyses, data distribution was assumed to be normal but this was not formally tested). P value <0.001 ***, <0.0001 ****. Scale bar (equivalent for WT and cKO): 30 µm.
Microtubule growth is reduced in the absence of Eml1
The centrioles and the PCM contain proteins that nucleate and stabilize MTs. Indeed, centrioles act as templates for the formation of MTs that grow outward from the centrosome, providing the cell with a polarized cytoskeleton. Since we observed PC and centrosomal defects in Eml1 deficient cortical cells, we also tested how possible reduced protein complexes at the MTOC might alter MT nucleation activity. In Pax6+ cells in culture, MT regrowth was studied at 1 and 2 min after MT depolymerization, showing robust growth in WT around pericentrin+ puncta (Fig. 7, A and B). In Eml1 mutant cells, less puncta were associated with MT regrowth (Fig. 7, A and B). Among MTs surrounding centrosomes, their average length appeared unaffected (Fig. 7 C).

Microtubule regrowth at centrosomes is impaired in Eml1 mutant conditions. (A) Representative images for pericentrin+ puncta (“centrosomes”) with α-tubulin labeling (“MTs”) on WT and Eml1 cKO cells after ice recovery MT assays (1 and 2 min). (B) Quantifications of percentage (%) of centrosomes exhibiting MT regrowth after 1 or 2 min per analyzed ROI, represented as mean ± SEM. (C) Quantifications for mean length of MTs per centrosome 2 min after ice recovery, represented as mean ± SEM (n = 49 centrosomes for Eml1 cKO and 53 for WT). 16 ROI analyzed from two different cultures after 2 min and 12 ROI analyzed from two different cultures after 1 min. Different cultures are indicated by dots of different colors. Test and significance: Mann-Whitney. P value <0.01 **, <0.001 ***. Scale bars (equivalent for WT and cKO, and for 1 min, 2 min): 10 µm.
Microtubule regrowth at centrosomes is impaired in Eml1 mutant conditions. (A) Representative images for pericentrin+ puncta (“centrosomes”) with α-tubulin labeling (“MTs”) on WT and Eml1 cKO cells after ice recovery MT assays (1 and 2 min). (B) Quantifications of percentage (%) of centrosomes exhibiting MT regrowth after 1 or 2 min per analyzed ROI, represented as mean ± SEM. (C) Quantifications for mean length of MTs per centrosome 2 min after ice recovery, represented as mean ± SEM (n = 49 centrosomes for Eml1 cKO and 53 for WT). 16 ROI analyzed from two different cultures after 2 min and 12 ROI analyzed from two different cultures after 1 min. Different cultures are indicated by dots of different colors. Test and significance: Mann-Whitney. P value <0.01 **, <0.001 ***. Scale bars (equivalent for WT and cKO, and for 1 min, 2 min): 10 µm.
We next assessed MTs in brain tissue with α-tubulin labeling in coronal sections of E12.5 embryonic brains. In the VZ, assessing the distribution of fluorescence intensity from the ventricular surface to a height of 100-µm in the WT VZ, an enrichment of α-tubulin was observed at the apical surface; however, this was greatly reduced in the Eml1 cKO (Fig. S5, D and E). There was also a tendency for decreased α-tubulin fluorescence intensity in the absence of Eml1 (Fig. S5, D and F).
These combined results suggest that centrosome phenotypes, including in the VZ, may influence efficient MT formation, potentially impacting RG behavior.
RG detachment is partially rescued with EpoD treatment in vivo
Because EpoD treatment rescues centrosome and PC defects, we tested if this treatment could also rescue RG detachment in vivo. To do so, we injected EpoD intraperitoneally into pregnant females consecutively at E11.5 and E12.5 and sacrificed them at E13.5. Pax6 immunolabeling was then performed in embryonic brain slices, and results were compared with saline-injected embryos. Cortical wall and VZ thickness were compared and no significant differences were found for these parameters (Fig. 8, A and B) nor for overall cell number in the VZ, although there was a possible tendency for reduction in the cKO (upon EpoD treatment 114.08 ± 3.02 Hoechst labeled cells per ROI in control versus 104.42 ± 3.86 in Eml1 cKO). The proportion of detached Pax6+ cells in the Eml1 cKO in both saline and EpoD conditions was still increased; however, with the EpoD treatment, detachment was significantly less than in saline conditions (Fig. 8 C, right). Of note, the overall number of Pax6+ cells in the Eml1 cKO is increased under saline conditions compared with the WT but this is no longer the case after EpoD treatment (Fig. 8 C, left), suggesting that the increased number of Pax6+ cells may be linked to increased detached RG. Further verifying the cells outside the VZ, shows in the cKO that 60% of cells are Pax6+ in the cKO at this age under saline conditions and this is reduced to 32% upon EpoD treatment. Verifying the number of Pax6 negative cells outside the VZ, although the results were not significant between the conditions, a tendency for reduction in the cKO was observed compared with control under saline conditions and the trend remains the same upon EpoD treatment (133.33 ± 8.99 per ROI in control versus 101.5 ± 7.11 in Eml1 cKO under saline conditions and 122.92 ± 13.88 in control versus 103.33 ± 13.33 in Eml1 cKO under EpoD treatment). We hence do not rule out that neurogenesis is slightly reduced at this timepoint in the cKO.

Abnormal detachment and subsequent heterotopia formation is partially rescued with EpoD treatment. (A) Representative images of Pax6 labeling for WT and Eml1 cKO in saline or EpoD conditions at E13.5. (B and C) Quantification of the cortical wall and ventricular zone (VZ) thickness and total count for Pax6+ cells and distribution outside of VZ in WT and Eml1 cKO from saline and EpoD conditions represented as mean ± SEM (n = 6 individuals from 2 litters at least, indicated by dots of different colors). (D) Representative images of the heterotopia volume in 3D visualized by SatB2 immunofluorescence. The homotopic cortex is depicted in transparency (purple) and the heterotopia is shown with a solid rendering (red). Eml1 cKO embryos received saline or EpoD at E11.5 and E12.5 and were analyzed at E18.5. Three different angles are shown. (E) Quantification of the ratio between heterotopia volume and that of the homotopic cortex in Eml1 cKO with saline or EpoD, represented as mean ± SD (n = 7 embryos from 2 litters). Two independent litters are color-coded. (F) Quantification of Satb2 mean fluorescence intensity in the homotopic cortex in Eml1 cKO with Saline or EpoD, expressed as mean ± SD. Tests and significance: Two-way ANOVA, Sidak multiple comparison (Pax6 analyses, CW and VZ thickness. data passed normality test), Mann Whitney test (heterotopia volume and Satb2 analyses). n = 7 samples from 2 litters. P value <0.05*, <0.01 **, <0.001 ***, <0.0001 ****. Scale bars: 50 µm in A (equivalent for WT and cKO, all conditions) and 500 µm in D.
Abnormal detachment and subsequent heterotopia formation is partially rescued with EpoD treatment. (A) Representative images of Pax6 labeling for WT and Eml1 cKO in saline or EpoD conditions at E13.5. (B and C) Quantification of the cortical wall and ventricular zone (VZ) thickness and total count for Pax6+ cells and distribution outside of VZ in WT and Eml1 cKO from saline and EpoD conditions represented as mean ± SEM (n = 6 individuals from 2 litters at least, indicated by dots of different colors). (D) Representative images of the heterotopia volume in 3D visualized by SatB2 immunofluorescence. The homotopic cortex is depicted in transparency (purple) and the heterotopia is shown with a solid rendering (red). Eml1 cKO embryos received saline or EpoD at E11.5 and E12.5 and were analyzed at E18.5. Three different angles are shown. (E) Quantification of the ratio between heterotopia volume and that of the homotopic cortex in Eml1 cKO with saline or EpoD, represented as mean ± SD (n = 7 embryos from 2 litters). Two independent litters are color-coded. (F) Quantification of Satb2 mean fluorescence intensity in the homotopic cortex in Eml1 cKO with Saline or EpoD, expressed as mean ± SD. Tests and significance: Two-way ANOVA, Sidak multiple comparison (Pax6 analyses, CW and VZ thickness. data passed normality test), Mann Whitney test (heterotopia volume and Satb2 analyses). n = 7 samples from 2 litters. P value <0.05*, <0.01 **, <0.001 ***, <0.0001 ****. Scale bars: 50 µm in A (equivalent for WT and cKO, all conditions) and 500 µm in D.
To further analyze the effects of EpoD on heterotopia formation subsequent to RG detachment, we allowed the embryos to develop until E18.5 after being treated either by saline or EpoD consecutively at E11.5 and E12.5. Whole embryonic brains were stained for SatB2 and subsequently cleared for 3D imaging. As Satb2+ neurons form a compact layer of cells covering the whole surface of the heterotopia, we used this staining to delineate the shape of the malformation (Fig. 8 D). The volume of the heterotopia was thus quantified and normalized to the corresponding homotopic cortex. Our results suggest that EpoD treatment in early corticogenesis partially reduces the volume of the heterotopia at E18.5 (Fig. 8 E). Satb2 mean fluorescent intensities did not appear to change between conditions (Fig. 8 F). Thus, we pinpoint early MT-dependent defects in the Eml1 cKO that influence both apical RG attachment and heterotopia formation.
Discussion
With this study, we pinpoint early roles for Eml1 in cortical development by analyzing the phenotypes occurring before the heterotopia arises in a dorsal telencephalon-specific cKO. Specifically, we identified that (1) RG start to delaminate after E12.5; (2) there are cell cycle modifications that differ across the developmental window starting from this time point; (3) Eml1 is central for the centrosome function, and (4) transient MT stabilization at early stages partially rescues the Eml1 cKO defects. Altogether these novel results raise several intriguing questions.
RG detachment preferentially occurs at early but not mid-corticogenesis suggesting that there may be a critical time window in the Eml1 cKO mouse to produce ectopic RG. Thus, the early defects we detected are likely to be correlated with detachment. We checked if Eml1 expression from E12.5 to E15.5 varies using the https://www.humous.org/ database (Klingler et al., 2021) and observed that in mice the expression of Eml1 does not vary but in humans, it is enriched at early corticogenesis compared to mid-corticogenesis in RG. To further understand mouse developmental stage progenitor differences and focus on the specific alteration of γ-tubulin, pcnt, and their defects at the centrosomes, we analyzed expression in WT apical progenitors using RNA sequencing data from Telley and colleagues (Telley et al., 2019). Expression of pcnt and γ-tubulin are reduced from E12.5 to E15.5 in mice, suggesting that they could be more important in early than late stages. Cortical progenitors were shown to have different features at specific stages (Telley et al., 2019), so it is expected that they change over time. Centrosomal protein composition also varies along corticogenesis and differentiation (O’Neill et al., 2022). Our work hence further underlines that centrosome function could be critical at certain stages. These combined data may help explain specific defects occurring in particular time windows, compatible with the deregulated processes we identify. It is also of interest to note that basal RG (bRG) formation in gyrencephalic species also may occur in a defined period. In ferrets, for example, it has been shown that there is a peak of bRG production between E30 to E34 (Martínez-Martínez et al., 2016). This process may share common features with Eml1 mutant results.
We also show distinct cell cycle alterations at early and mid-corticogenesis. S-phase lengthening was observed in E12.5 Eml1 cKO RG, which may be correlated with a more proliferative behavior of these cells. Indeed, it has been shown that RG with a longer S-phase are prone to be more proliferative (Arai et al., 2011). Coherent with this, we found more Pax6+ cells in total at E13.5 but not at E12.5, suggesting an amplification of the Pax6+ cell pool. Of note, we also observe that, while Pax6+ cells increase significantly starting from E13.5, the VZ thickness does not decrease until E14.5/E15.5. It is possible that Pax6+ cells outside the VZ are the product of already detached and proliferating Pax6+ cells, and not simply those directly detached from the VZ. However, in EML1-mutant organoids, it was shown that PAX6+ cells in the VZ-like niche exhibited increased nuclear YAP1, a downstream effector of HIPPO signaling linked with proliferation and S-phase entry (Jabali et al., 2022). Pharmacological inhibition of YAP1 significantly reduced the number of ectopic neural rosettes in EML1-mutant organoids (Jabali et al., 2022). Also, positive regulators of proliferation are increased at the transcriptional level in EML1 mutant organoids. Other works show that, especially during S-phase, centrosomes can have an MT-independent role. For instance, targeting of polo kinase 1 (Plk1) to the centrosomes or γ-tubulin subcellular localization are both essential for S-phase progression (Shen et al., 2013). Thus, there may be several reasons for S-phase lengthening.
At later stages, we observed cell cycle duration shortening in the VZ, a decreased number of cells in the G1 phase, and increased numbers in G2/M. At E15.5, there are fewer cells in the VZ leading to its thinning. We can imagine that INM distance is shortened, and thus perhaps cells can advance faster through the cell cycle. It has also already been observed that recombinant Eml1 can localize to the mitotic spindle (Kielar et al., 2014) which may help explain in its absence, why there might be a longer G2/M in mutant cells, although it is unclear why this might specifically affect later stages. Moreover, at E15.5, we observed that ectopic versus VZ RG are not equally affected in terms of cell cycle. It is indeed known that human bRG are subject to a different environment compared with RG in the VZ, and they locally produce growth factors such as PDGFD (Lui et al., 2014), and require a modified extracellular matrix (ECM), in terms of components and receptors, that play a crucial role in neuronal progenitor proliferation and behavior (Ferent et al., 2020). Furthermore, bRG have less contact with the embryonic cerebrospinal fluid (eCSF) and hence less exposure to its secreted factors with an impact on signaling. These elements might help explain the differences between the two populations. Concerning the neuronal output of altered VZ progenitors, these increased cells might collectively increase the number of neurons at a later timepoint; on the other hand, VZ cells at E15.5 may also individually produce fewer neurons, as they have a shorter G1 (Takahashi et al., 1995). VZ cell composition may differ in the mutant, potentially containing a higher proportion of Pax6-negative cells than in controls, although this remains to be examined.
Because of the central role of the centrosome and PC in proliferation, we investigated protein trafficking to these organelles. Regarding the diversity of possible routes taken by ciliary proteins to reach the PC (Long and Huang, 2020), we do not yet know which of those may be exclusively or partially altered in Eml1 mutant conditions. Recently, it was shown in RG, that post-Golgi apical trafficking occurs in the direction of the MT minus ends, via the Rab6-dynein-Lis1 complex, which is required for apical localization of Crumbs3 (Brault et al., 2022), a major apical domain determinant (Bulgakova and Knust, 2009). Therefore, genetic inactivation of Rab6A/B or Lis1 induces a retraction of the RG apical process, leading to delamination and ectopic division (Brault et al., 2022). Thus, known apical trafficking defects to regions of the cell containing the centrosome and PC strongly resemble the Eml1 cKO phenotype. For example, Eml1 interacts with the Golgi protein Vcpip1, and its interaction is reduced when Eml1 has the T234A patient mutation ([Uzquiano et al., 2019] and our BioID data). Also, Golgi morphological defects were found in human and mouse cells in EML1/Eml1 mutant conditions (Uzquiano et al., 2019), suggesting that ciliary routes from this organelle could be impaired. Indeed, the increased accumulation of PKD2 in the Golgi in RUSH experiments suggests a Golgi trafficking defect. SSTR3, for which we found decreased protein in the Golgi as well as the PC, may exhibit an ER-Golgi protein transport alteration in the mutant. Recombinant EML1 exhibits a vesicular pattern on MTs, altered with T243A mutation (Kielar et al., 2014). We can hypothesize that through its ability to bind MTs, Eml1 can influence MT integrity and the trafficking of cargo including PC proteins. Eml1 can also influence centrosome MT integrity.
It is known that mutations of genes coding for tubulin proteins are associated with cortical malformations (Poirier et al., 2013). Here, we showed that during early cortical development, MTs are defective at the apical surface, and MT re-growth is impaired in Pax6+ cells in culture. It was recently shown that EML1 is involved in MT nucleation as well as associating strongly with growing MTs, with a unique pattern of accumulation toward their ends (Jijumon et al., 2022). Patient mutations alter this colocalization with MTs, quite possibly impacting MT dynamics and architecture. MT polymerization and stabilization with EpoD rescues centrosomal defects in human patient cells. EpoD treatment also partially rescued RG detachment in the Eml1 cKO, underlining the involvement of MT-dependent mechanisms in pathogenic detachment. EpoD’s effect may be by stabilization of centrosomes and nucleated MTs, even though the latter may be fewer in number in the cKO. We showed that EpoD injections in early corticogenesis not only partially rescue RG detachment at E13.5, but remarkably, can also reduce the volume of heterotopia several days later at E18.5. It would be interesting to assess if EpoD treatment rescues cell cycle parameters as well to determine their link to MT defects and the extent to which cell cycle alterations are involved in RG detachment. Further in-depth studies will address this, as our transient, early EpoD treatment clearly targets an important time window for RG manipulation. These promising results in a preclinical mouse model of heterotopia may help pinpoint future pertinent interventions for this severe disorder.
Materials and methods
Animals
Research was carried out conforming to national and international directives (directive CE 2010/63/EU, French national APAFIS n° 23424; 46509) with protocols followed and approved by the local ethical committee (Charles Darwin, Paris, France). Mice were housed with a light/dark cycle of 12 h (lights on at 07:00). Males and females were used in all analyses.
Generation of Eml1 cKO animals
The Eml1 mutant mouse line was established at the PHENOMIN MCI/ICS (Mouse Clinical Institute—Institut Clinique de la Souris, Illkirch, France; http://www-mci.u-strasbg.fr) in the framework of funding from the French Rare Disease Foundation (Collins et al., 2019). The Eml1 mutant line was generated and analyzed on the mouse genetic background C57BL/6N (B6N). LoxP sites surrounding exon 8 allowed conditional knockout. Eml1 cKO mice were generated by crossing with Emx1-Cre knock-in animals (Gorski et al., 2002). Homozygote Eml1-Flox mice (Eml1 fl/fl) were crossed with homozygote Eml1-Flox mice also heterozygote for Emx1-Cre (Gorski et al., 2002) (Eml1 fl/fl x Eml1 fl/fl, Emx1-Cre/+). All mice were housed in the IFM Institute animal facility or at the CDTA, Orléans, France.
Crosses and genotyping
Eml1 flox/flox animals were crossed with Eml1 flox/flox-Emx1Cre/+ animals. Females were placed in the male cage and the following morning the presence of a vaginal plug was observed and considered to be embryonic day 0.5 (E0.5). Embryonic brains were collected at the indicated times.
Genotyping primers used to detect Cre were:
Cre 1: 5′-GAACCTGATGGACATGTTCAGG-3′.
Cre 2: 5′-AGTGCGTTCGAACGCTAGAGCCTGT-3′.
Primers used to detect the floxed Eml1 allele were:
Primer Lf: 5′-GAAAACGTGCTTTGCTGTGTACATAGG-3′.
Primer Er: 5′-CACCCACTGAAGAAATGACTGGCAG-3′.
Antibodies
Primary antibodies used were mouse anti-BrdU (Cat# B35141, RRID:AB_2536441 MobU-1, 1:100; Thermo Fisher Scientific), rabbit anti-Pax6 (Cat# PRB-278P, RRID:AB_291612, 1:300; Covance), rabbit anti-Tbr2 (Cat# ab23345, RRID:AB_778267, 1:300; Abcam), mouse anti–Ki-67 (Cat# 556003, RRID:AB_396287, 1:200; BD Biosciences), rabbit anti-PCNA (Cat# 10205-2-AP, RRID:AB_2160330; Proteintech), mouse anti-GM130 (Cat# 610822, RRID:AB_398141, 1:300; BD Biosciences), mouse anti-Cep170 (Cat# 41-3200, RRID:AB_2533502, 1: 500; Thermo Fisher Scientific), mouse anti-γ-tubulin (Cat# T6557, RRID:AB_477584, 1:400; Sigma-Aldrich), mouse anti-α-tubulin (Cat# T9026, RRID:AB_477593, 1:500; Sigma-Aldrich), rabbit anti-Arl13b (Cat# 17711-1-AP, RRID:AB_2060867, 1:400; Proteintech), mouse anti-Eml1 3E8 (Cat# sc-100938, RRID:AB_1122523, 1:500; Santa Cruz Biotechnology), rabbit anti-Eml1 C3 (Cat# GTX100252, RRID:AB_1240763, 1:500; GeneTex), goat anti-Sox2 (Cat# sc-17320, RRID:AB_2286684, 1:500; Santa Cruz Biotechnology) and rabbit anti-GFP (Cat# A-6455, RRID:AB_221570, 1:2,000; Thermo Fisher Scientific), rabbit anti-Pericentrin (Cat# ab4448, RRID:AB_304461; Abcam), rabbit anti-Satb2 (Cat# ab92446, RRID:AB_10563678, 1:1,000; Abcam). For Neuro-2A cells: Streptavidin Alexa Fluor 488 conjugate (S32354, 1:5,000, RRID:AB_2315383; Life Technologies), Myc-tag (2278, 1:400, RRID:AB_490778; Cell Signaling), and ɣ-tubulin (T5326, 1:200, RRID:AB_532292; Sigma-Aldrich) were used.
Secondary antibodies used for immunohistochemistry and immunocytochemistry were goat anti-rabbit Alexa Fluor 555 (Cat# 4413, RRID:AB_10694110; Cell Signaling Technology), goat anti-mouse Alexa Fluor 633 (Cat# A-21052, RRID:AB_2535719; Thermo Fisher Scientific), Streptavidin-conjugated Alexa Fluor 488 (S32354; Invitrogen), goat anti-rabbit Alexa 488 (Cat#A-11008; RRID: AB_143165; Thermo Fisher Scientific), goat anti-mouse Alexa 488 (Cat#A28175; RRID: AB_2536161; Thermo Fisher Scientific), goat anti-rat Alexa 568 (Cat# A-11006; RRID: AB_141373, 1:800; Thermo Fisher Scientific), goat anti-rabbit Alexa 568 (Cat# A-11011; RRID: AB_143157; 1:800; Thermo Fisher Scientific), goat anti-mouse Alexa 633 (Cat# A-21050; RRID: AB_2535718; 1:800; Thermo Fisher Scientific), and goat anti-rabbit Alexa 633 (Cat# A-21070, RRID: AB_2535731; 1:800; Thermo Fisher Scientific). Secondaries used for western blot were Dylight anti-mouse 800 (Cat#SA5-35521; RRID: AB_2556774, 1:5,000; Thermo Fisher Scientific), anti-rabbit 680 (Cat# 35568, RRID: AB_614946, 1:5,000; Thermo Fisher Scientific), and anti-rabbit 800 (Cat#SA5-35571; RRID: AB_2556775, 1:5,000; Thermo Fisher Scientific).
Plasmids
Plasmids used were BLBP-GFP (Kielar et al., 2014) for in utero electroporation, CMV-3xFlag-EML1 (Uzquiano et al., 2019), and YFP-EML4 (Richards et al., 2015) for immunoprecipitation. For BioID, full-length mouse Eml1 and Eml1*T243A cDNAs were cloned into the pcDNA3.1 mycBioID (#35700; Addgene) vector. Retention using selective hooks (RUSH [Boncompain et al., 2012]) was performed with SSTR3-GFP (generated in Franck Perez’s lab) and PKD2-GFP (kindly provided by Dominic Norris’ lab, London, UK).
Embryonic brain collection and sectioning
Females were sacrificed by cervical dislocation and embryos were collected. Brains were fixed overnight with paraformaldehyde (PFA) 4% and then rinsed and stored with phosphate-buffered saline 1X (PBS). For vibratome sectioning, brains were placed in an inclusion of 10% sucrose and 7.5% agarose in PBS 1X. Brains were cut in 70-μm thick coronal sections using a vibrating blade microtome (Leica VT1000 S). For cryostat sectioning, brains were embedded in OCT (Ref 6502; Epredia) and frozen. Brains were cut in 20-μm thick coronal sections using a cryostat (Cryostar NX70, HOMVPD; Microm).
Cresyl-violet labeling
Cresyl violet staining was performed on sections mounted on Superfrost slides (Thermo Fisher Scientific). Sections were treated for 5 min with EtOH 100%, then 5 min with EtOH 95% and 2 min with EtOH 70%. Slices were rinsed in water and then incubated in Cresyl-Violet solution (46597MJ; Sigma-Aldrich) for 8 min and then with water (1 min), EtOH 70% (2 min), 95% (1 min) and 100% (3 min). After 5 min in xylene, they were mounted with Eukitt medium.
Sections were analyzed at room temperature with a brightfield microscope (Provis; Olympus) using a charge-coupled device (CCD) camera (CoolSNAP CF; Photometrics) with 2× (NA = 0.08), 4× (NA = 0.13) and 10× (NA = 0.30) objectives. Minimum contrasts were adjusted using Photoshop software (Adobe).
Protein lysates and dosage
Embryonic cortices were collected and lysis of each embryonic cortex was performed individually by resuspending the tissue continuously with lysis buffer for a period of 1 h at 4°C. The lysate was then centrifuged (30 min, 15,000 rcf, 4°C), the supernatant was collected, and the protein concentration was measured using the BCA protein assay kit (Thermo Fisher Scientific) and the BertholdTech Mithras ELISA microplate reader.
Western blot
Samples were denatured with 2X NuPAGE LDS Buffer (Thermo Fisher Scientific) for 10 min at 70°C. Denaturing electrophoresis was performed on a 4–12% Bis-Tris Gel with MOPS SDS running buffer for 2 h at 110 V. Proteins were transferred onto nitrocellulose membranes for 1 h at 110 V and 4°C in a Tris-Glycine transfer buffer (Tris 25 mM, Glycine 192 mM, ethanol 10%). After protein transfer, the membranes were stained with Ponceau red to check the transfer quality. The membranes were extensively washed with distilled water, followed by a 60-min incubation in 1X TBST (100 mM Tris pH 7.5, 150 mM NaCl, 10% ethanol, 0.05% Tween) + 5% non-fat milk. Incubation for 45 min in the dark with the secondary antibody (DyLight, see above) was performed to identify non-specific binding sites. The primary antibody was incubated overnight (O/N) at 4°C and abundantly washed with 1X TBST, followed by incubation with the secondary antibody (see above). After extensive washes in TBST then with 1X TBS, the membranes were scanned using an Odyssey (Li-Cor) infrared scanner with ImageStudio software.
In utero electroporation (IUE)
Timed-pregnant mice (E12.5 to E14.5) were anesthetized with isoflurane (4% during induction and 2–2.5% during surgery) and embryos were revealed within the intact uterine wall after sectioning the abdomen. Embryos were constantly hydrated with NaCl 0.9% (B. Braun). A solution containing Blbp-GFP plasmid DNA (1 µg/μl, Blbp-promoter specific for RG) and 20 % wt/vol fast green in sterile endo-free water was injected into the lateral ventricles of the embryos. Forcep electrodes (System CUY650P5 NepaGene Co) were placed around the embryo head at a 45° angle and plasmids were electroporated by discharging a 4,000-μF capacitor charged to 35 V (five electric pulses of 50 ms with 950 ms intervals) with a CUY21 NepaGene electroporator. The embryos were then placed back in the abdominal cavity for 24 h prior to subsequent analyses.
Embryonic heads were harvested and fixed overnight with 4% PFA at 4°C. Brains were extracted, washed in PBS, and cryoprotected overnight serially in 15% and 30% sucrose. Brains were embedded in an embedding chamber using cryomedium Neg-50 (Ref 6502; Epredia), frozen under isopentane and dry ice, and cryo-sectioned at 20 µm with a Cryostar NX70 (HOMVPD, Microm). Brain sections were fluorescently immunolabeled (see below) with antibodies detecting Pax6 and GFP in electroporated progenitors. Images were acquired at room temperature with a TCS Leica SP5-II confocal microscope, with analyses focused on the future somatosensory cortex. 40X (NA = 1.25–0.75) and 100 X (NA = 1.44) objectives were used and controlled by LAS-AF software for acquisition (Leica). ImageJ was used for cell counting.
EpoD treatment in mice
Females were injected intraperitoneally with 20 mg/kg Epothilone D (EpoD; Abcam) at E11.5, E12.5 and sacrificed at E13.5 (for vibratome sectioning and immunohistochemistry) or E18.5 (for 3D imaging). EpoD was stored in PBS 1X and the exact needed volume was resuspended in saline 37°C in a final volume of 200 μl. For control injections, 200 μl of saline 37°C was injected at the indicated times.
Immunohistochemistry
Immunohistochemistry for all other experiments was performed on floating brain slices. These were permeabilized with 1X PBST (0.1% Triton X-100) for 15 min. After washes, blocking was performed for 1 h at room temperature (RT) with 1X PBS containing 10% normal goat serum (NGS) and 0.1% Triton X-100 before incubation overnight (O/N) at 4°C with the primary antibody. After extensive washes, sections were incubated with the secondary antibodies for 2 h at RT protected from the light. This was followed by 10 min incubation in Hoechst stain (1:10,000; Thermo Fisher Scientific) prior to washing with 1X PBS. Brain slices were mounted using Fluoromount G (Invitrogen). Images were acquired at room temperature with a TCS Leica SP5-II confocal microscope with analyses focused on the future somatosensory cortex. Fluorochromes are as described above in the antibody section. 40X (NA = 1.25–0.75) and 100 X (NA = 1.44) objectives were used and controlled by LAS-AF software (Leica). Minimum contrast adjustment was performed using ImageJ software.
For Tbr2, Ki67, and PCNA labeling, antigen retrieval was performed by incubating the sections in sodium citrate 10 mM pH 6 at 95°C for 20 min and allowing them to cool down before blocking.
For EdU and BrdU labeling after permeabilization, DNA was denatured with hydrochloric acid (HCl) 2N treatment for 30 min at 37°C, followed by washes and blocking. EdU was labeled using a click it EdU kit 647 following the manufacturer’s instructions (C10340; Thermo Fisher Scientific).
3D visualization of the heterotopia
E18.5 embryonic brains were dissected and fixed in 4% PFA overnight. They were then incubated in PBS1X gelatin 0.2% Triton 0.5% (PBSGT) at RT for 24 h. Anti-Satb2 antibody was diluted in PBSGT containing 0.1% saponin at 37°C for at least 5 days, after which the brains were washed six times in PBSGT at RT. The next day, secondary antibodies were diluted in PBSGT+saponin and incubated at 37°C for at least 2 days. All steps were performed on a rocking platform or wheel. Immunolabeled brains were embedded in 1.5% low-melting agarose (in 1% ultrapure Tris-acetate-EDTA solution). The embedded samples were cleared according to a modified version of the original iDISCO+ protocol (Renier et al., 2016). Samples were dehydrated by consecutive treatment with increasing concentrations of methanol and finally incubated in 1 vol of methanol/2 vol of dichloromethane (DCM, 270997-12X100ML; Sigma-Aldrich). The samples were then washed twice in 100% DCM. Finally, samples were incubated in dibenzyl ether (DBE, 108014-1KG; Sigma-Aldrich) overnight. For 3D imaging, cleared samples were imaged on a light sheet microscope (LaVision Biotec) equipped with a sCMOS camera (Andor Neo). Samples were imaged at room temperature in DBE. Imspector microscope control software was used. Scans were taken at 1.25X zoom magnification. Imaris (Bitplane, http://www.bitplane.com/imaris/imaris) was used for 3D reconstruction, snapshots, and movies.
Mouse neuronal progenitor primary cell culture
The neuronal progenitor cell cultures were adapted from Sun et al. (2011) giving highly enriched populations of Pax6(+) cells. For this, 6-well cell culture plates were coated with poly-D-lysine (PDL, P6407; Sigma-Aldrich) 2 µg/cm2 in sterile 1X PBS, O/N, at 37°C and 5% CO2. The following day, the PDL was removed and the plates were coated with 1 µg/cm2 fibronectin (F1141; Sigma-Aldrich) in sterile 1X PBS. E14.5 timed-pregnant mice were sacrificed by cervical dislocation and the uterus was placed in ice-cold basal medium (DMEM/F12 Hams, 21041; Thermo Fisher Scientific, 1% Pen-Strep [Gibco], 2.9 mg/ml glucose and 1.2 mg/ml sodium bicarbonate). The embryos were collected and the cortex from both hemispheres was dissected and kept at 4°C in basal medium. The medium was removed and substituted by prewarmed sterile complete medium (basal medium complemented with 1X B27 without vitamin A (12589-010; Gibco), 20 ng/ml of EGF (E9644; Sigma-Aldrich), and 20 ng/ml of FGF (F0291; Sigma-Aldrich). The tissue was dissociated and each sample was centrifuged (3 min, 1,000 rcf). The medium was removed and substituted by fresh prewarmed complete medium followed by resuspension of the cells. 1 × 10⁵ cells were plated in coated six-well culture plates. The cells were split once at 7 days in vitro (DIV) before performing experiments. Half of the culture medium was changed by a fresh complete medium every 2 days for 1 wk. For splitting, cells were washed with prewarmed Versene (Gibco), followed by a 3 min incubation with prewarmed StemPro Accutase (Gibco) at 37°C. Cells were plated (6–8 × 10⁵) on coated 14-mm glass coverslips and cultured for 2 DIV for immunocytochemistry experiments.
Immunocytochemistry
Cells were washed in 1X PBS prior to fixation with 4% wt/vol PFA in 0.1 M phosphate buffer, pH 7.4, for 15 min at RT or fixed with methanol at −20°C. The cells were extensively washed for 15 min in PBST (Triton X-100 0.1% in 1X PBS). Incubation with blocking solution (10% NGS; Thermo Fisher Scientific, 0.1% Triton X-100 in 1X PBS) was performed for 1 h at RT and primary antibodies were applied for 2 h at RT or O/N at 4°C (see above for antibodies). The cells were extensively washed with a blocking solution and secondary antibodies were incubated for 2 h at RT in the dark. After washes, Hoechst (1:10,000; Thermo Fisher Scientific) was applied for 15 min at RT in the dark. The cells were extensively washed in PBS and the coverslips were mounted with Fluoromount G (Southern Biotechnology). Images were acquired at room temperature with a TCS Leica SP5-II confocal microscope as above.
RUSH trafficking experiments
Retention using selective hooks (RUSH [Boncompain et al., 2012]) was performed with plasmids SSTR3-GFP (lab) and PKD2-GFP. Plasmids were individually transfected in neuronal progenitor Pax6+ cells in culture using Lipofectamine 3000 (L3000-008; Invitrogen) following the manufacturer’s instructions. An avidin concentration of 0.28 µg/ml was added to block biotin already present in the DMEM F12 medium (21041025; Invitrogen) (Boncompain et al., 2021). After 24 h, biotin at a concentration of 40 µM in a new medium was added for a given time duration (0, 30, 60, and 90 min), and cells were fixed with 4% PFA at RT for 15 min. Coimmunolabeling with GM130 and Arl13b antibodies as described above was performed to assess the concentration of the RUSH protein respectively in the Golgi Apparatus (GA) and primary cilia (PC) over time. Images were acquired at room temperature with a TCS Leica SP5-II confocal microscope as above and analyzed using Image J.
Microtubule (MT) regrowth assay
Primary cultures of mouse neuronal progenitor cells were plated on coated 14-mm glass coverslips and placed directly on ice, then incubated for 40 min to allow disassembly of the MT cytoskeleton. The cells were then placed at 37°C for the indicated times (1 or 2 min) and immediately fixed with methanol at −20°C. Immunolabelling for pericentrin and α-tubulin was then performed as described above to analyze MT regrowth at the centrosomes. Images were acquired at room temperature with a TCS Leica SP5-II confocal microscope as above and analyzed using Image J.
Human cells and electron microscopy (EM)
Centrosomes were identified and analyzed in previously generated EM images of human cortical progenitors (Uzquiano et al., 2019; Jabali et al., 2022). Control cells were Ctrl1: id-number B7_028#4, female origin; Ctrl2: catalog ID GM08680, male origin. EML1 heterotopia patients were P135 (T243A compound heterozygous mutations) and P3489 (homozygous W225R mutations) (Kielar et al., 2014).
Progenitor cells were previously produced, fixed, and imaged with an electron microscope (CM100; Philips), and digitalized with a CDD camera (Gatan Orius). Images were analyzed using ImageJ. In this study, centrosome aspect and numbers were assessed.
Cell cycle analysis
EdU and BrdU injections
BrdU (10 mg/ml) and EdU (5 mg/ml) were dissolved with 1X PBS. Intraperitoneal injections of the appropriate volume of EdU and BrdU solutions were carried out for an injection of 50 mg/kg of EdU and 50 mg/kg of BrdU (1 h after the first injection). 1.5 h after the first injection, the pregnant mouse was euthanized by cervical dislocation and the brains of embryos were collected. After immunolabeling for EdU, BrdU, and Pax6 on embryonic floating coronal brain sections, RG were assessed according to their S-phase state (Harris et al., 2018; Martynoga et al., 2005): The confocal SP5 microscope was used as already mentioned above. Pax6 (+)Edu(+)BrdU(−) cells were considered to have left S-phase, Pax6(+)EdU(−)BrdU(+) cells to have entered in S-phase and Pax6(+)EdU(+)BrdU(+) to be still in S-phase.
Considering that in a population of proliferating asynchronous cells, the fraction of cells in a given phase of the cell cycle is directly proportional to the duration of that phase relative to the total duration of the cell cycle (Nowakowski et al., 1989) we could thus calculate S-phase length Ts= (EdU+;BrdU+cells/EdU+;BrdU− cells). Also, because RG are cycling cells, we could estimate their cell cycle duration using the formula Tc = Ts/(BrdU+/Pax6+cells). In more detail, the ratio between the duration of one period of the cell cycle and that of another period is equal to the ratio between the number of cells in the first period and the number of cells in the second period (Nowakowski et al., 1989). The sequential exposure of proliferating cells to EdU and BrdU allowed us to differentiate defined cell populations. Specifically, progenitors are exposed to EdU in vivo at T = 0 h so that all cells in the S phase at the start of the experiment are labeled with EdU. At T = 1 h, cells are exposed to BrdU to label all cells in the S phase at the end of the experiment. Cells still in S phase are also labeled with EdU. The interval during which cells can incorporate EdU but not BrdU (T′) is 1 h. Cells from the initial EdU-labeled S-phase cohort will leave S-phase at a constant rate during the T′ interval. This outgoing fraction will be labeled by EdU but not by BrdU. Consequently, the ratio between the number of EdU+BrdU- and EdU+BrdU+ cells is equal to the ratio between T' (which equals 1 h) and Ts (Shibui et al., 1989). Thus, Ts = number of EdU+BrdU+/EdU+BrdU− cells and Tc = Ts/(BrdU+/Pax6+cells).
Dual labeling for Ki67 and PCNA
The method was adapted from Fousse et al. (2019). The confocal SP5 microscope was used as already mentioned above. Cells with punctate PCNA in the nucleus and diffuse Ki67 were considered in S-phase. Cells with punctate Ki67 and diffuse PCNA were counted as cells in the G1 phase. Nuclei with both Ki67 and PCNA in a diffuse pattern were considered as G2/M cells. Cells were counted using the plugin cell counter in ImageJ.
BioID (Proximity dependent biotin identification)
Cloning
Full-length mouse Eml1 and Eml1*T243A cDNAs were cloned into pcDNA3.1 mycBioID (#35700; Addgene) vector using the following primers in Table 1.
BioID (proximity-dependent biotin identification) analysis
Mouse Neuro2A cells (CCL-131; ATCC) were transiently transfected 40 µg BioID constructs withp (PEI) (Cat. #23966; Polysciences Inc.) and after 24 h, cells were incubated overnight in the presence of 0.05 mM D-biotin (Cat. #B1595; Life Technologies), followed by cell lysis in a lysis buffer (150 mM NaCl, 0.5% SDS, 2% NP40, 1 mM EDTA, 10 mM IAA, 10 mM Tris pH 7.6, and protease inhibitor Cocktail, Cat.#11836170001; Roche). The lysates were centrifuged at 14,000 g for 10 min at 4°C, and the protein concentrations were measured using a bicinchoninic acid (BCA) assay (BCA Protein Assay Kit (Cat. #23225; Thermo Fisher Scientific). Equal amounts of protein lysates from different conditions were incubated with streptavidin beads (Pierce Streptavidin Plus UltraLink Resin, Cat.#53117; Thermo Fisher Scientific) overnight at 4°C. The bound proteins were washed with several wash buffers respectively for 10 min, wash buffer 1 (2% SDS), wash buffer 2 (1% Triton X-100, 2% sodium deoxycholate, 1 mM EDTA, 50 mM NaCl, 50 mM HEPES pH 7.5), wash buffer 3 (1% Triton X-100, 0.5% NP-40, 0.5% sodium deoxycholate, 1 mM EDTA, 50 mM NaCl, 10 mM Tris pH 8.1), and wash buffer 4 (50 mM NaCl, 50 mM Tris pH 7.4).
To identify biotinylated proteins by mass spectrometry (MS), on-bead digestion was performed. Proteins on the beads were reduced with 100 mM DTT in 50 mM ammonium bicarbonate buffer at 56°C for 45 min and alkylated with 100 mM iodoacetamide at RT in the dark for 30 min. MS grade trypsin (Pierce) was added to the beads for overnight digestion at 37°C. The resulting peptides were purified using C18 StageTips. Finally, the eluted peptides were analyzed by a Thermo Fisher Scientific Q-Exactive LC-MS/MS mass spectrometer. This experiment was performed three independent times.
The raw data were processed using Proteom Discoverer 2.3 (Thermo Fisher Scientific) and searched against the UniProt Mus musculus database (accessed August 2022) with Sequest HT search engine with tryptic digest specificity, allowing maximum two missed cleavage, precursor mass tolerance 15 ppm, and fragment mass tolerance 0.05 Da (Liu et al., 2020). SAINTexpress analysis was performed using three biological replicates (Teo et al., 2014). Biotinylated proteins of negative control, transfected without DNA, were analyzed to define non-specific interactions. Saint probability score ≥0.6 was used to define the proximal interactors of EML1 and EML1*T243A. The final protein lists were analyzed using the STRING v11.5 database (Szklarczyk et al., 2021) and g:Profiler annotation server (Raudvere et al., 2019). Selected protein interactions were visualized using Cytoscape 3.9.1 (Shannon et al., 2003).
Immunocytochemistry of Neuro2A cells
For immunofluorescence staining, Neuro2A cells (CCL-131; ATCC) were transfected with Lipofectamine 3000 (Invitrogen). 2 d after transfection, the cells were fixed with 4% paraformaldehyde (PFA). The antibodies and their dilutions used were as follows: Streptavidin Alexa Fluor 488 conjugate (S32354, 1:5,000, RRID:AB_2315383; Life Technologies), Myc-tag (2278, 1:400, RRID:AB_490778; Cell Signaling), and Gamma-Tubulin (T5326, 1:200, RRID:AB_532292; Sigma-Aldrich). Secondary antibodies were DAPI (359 nm), Alexa Fluor 488 (S32354; Invitrogen), Alexa Fluor 555 (4413; Cell Signaling), Alexa Fluor 633 (A21052; Invitrogen). Vectashield mounting medium was used (H-1200-10; Vector Laboratories).
After fixation, images were acquired at room temperature with a Leica DMi8/SP8 TCS DLS laser scanning confocal microscope: HyD detectors provide signal collection in channels, then acquired using a DFC365 FX camera (version FCAM2 V1.0.10). A 63× Plan Apo 1.4 NA oil-immersion objective was used controlled by LAS-X software (Leica).
Coimmunoprecipitation experiments
For coimmunoprecipitation (IP) experiments, Neuro2A cells were cotransfected with CMV-3xFlag-EML1 (Uzquiano et al., 2019) and YFP-EML4 (Richards et al., 2015) plasmids, or CMV-3xFlag vector only (Uzquiano et al., 2019) with YFP-EML4 (Richards et al., 2015). After 24 h in culture, cells reaching 70–80% confluence were transfected using a ratio of 1:3 DNA and PEI, respectively (10 μg of DNA and 30 μg of PEI, Polysciences). After 48 h, cells were recovered and washed twice with 1X PBS and lysed by rotation for 20 min at 4°C in 150 μl of RIPA buffer (50 mM Tris-HCl, pH 8, 100 mM NaCl, 1 mM EDTA, 0.1% SDS, 1% Nonidet P-40, 0.5% sodium deoxycholate and Protease inhibitor cocktail). The samples were centrifuged at 14,000 rcf. for 15 min at 4°C. Protein G Sepharose beads (Sigma-Aldrich) were diluted 1/10 in TNE buffer (50 mM Tris-HCl pH 7.4, 100 mM NaCl, 5 mM EDTA) and 60 μl of diluted beads were used for each IP experiment. The beads were extensively washed with 1 x RIPA buffer, followed by centrifugation (12,000 rcf., 4°C, 30 s). A preclearing step was performed by incubating the cell lysates with the already-washed beads on a rotating wheel at 4°C for 1 h 30 min. The samples were then centrifuged (12,000 rcf., 4°C, 30 s) and the supernatant collected. The latter was incubated with the following primary antibodies (1 μg): rabbit anti-GFP (A6455; Invitrogen), mouse anti-Flag (F1804; Sigma-Aldrich), (O/N, 4°, rotating wheel). Afterward, these samples were incubated with 100 μl of diluted washed Protein G Sepharose beads (5 h, 4°C, rotating wheel). The unbound fraction was recovered after centrifugation (12,000 rcf., 4°C, 30 s). 5× washes of the beads in 1× RIPA buffer were performed before elution with NuPAGE LDS Buffer (Thermo Fisher Scientific), 10 min at 70°C. The bound fraction was recovered after centrifugation (12,000 rcf., RT, 2 min). Western blots and immunodetection were performed as mentioned above.
Image acquisitions
As mentioned in the above methods, acquisitions of immunolabeled brain sections and plated cells were carried out using confocal microscopes Leica SP5 and SP8. For vibratome brain imaging a total of z = 10 µm was imaged and for cryostat a total of z = 20 µm was imaged. For cells, a total of z = 7 µm was imaged. Hoechst (DAPI, 359 nm), Alexa Fluor 488 (S32354; Invitrogen), Alexa Fluor 555 (4413; Cell Signaling), and Alexa Fluor 633 (A21052; Invitrogen) were used.
Image analysis
Cell and element counting (Figs. 1, 2, 3, 4, 6, 7, 8, and S2) was performed using Image J. Fluorescence intensity (Figs. 4, 5, 6, S4, and S5) was measured using ImageJ. Images were acquired the same manner, with the same parameters. For sections, the analyzed region of interest (ROI) was of 200 μm width and the total cortical wall in height, except for Ki67/PCNA analyses where the ROI was 100 μm. Imaris (Bitplane, http://www.bitplane.com/imaris/imaris) was used for 3D reconstruction, snapshots and movies (Fig. 8 and Fig. S1).
Statistical analysis
The sample size selection for experiments was based on both published and previous pilot studies considering the sensitivity of the applied approaches. When possible, data were collected and analyzed in a blind manner to the experimenter. One main experimenter performed each experiment. Statistical tests were carried out using GraphPad Prism 9. Normality and homogeneity of variances were tested using either a D’Agostino-Pearson omnibus, Shapiro-Wilk or KS normality tests, or data distribution was assumed to be normal but this was not formally tested, depending on the number of samples. Significance was established with P value <0.05. For each experiment, the statistical test used (Mann Whitney or Two-way Anova) is described in the figure legend, as well as the number of individuals analyzed. Data were collected and processed randomly.
Online supplemental material
Fig. S1 (Forebrain inactivation of Eml1 leads to subcortical heterotopia in mouse) shows initial characterization of the mouse model used throughout the study, confirming that it shows a robust heterotopia phenotype. Fig. S2 (Altered proportion of cells in cell cycle phases in Eml1 mutant conditions) complements main Fig. 3 of the manuscript showing stage-specific cell cycle alterations using an alternative approach. Fig. S3 (BioID and gene ontology analyses of WT and T243A Eml1 interacting partners, Cep170 cell analyses) supports main Fig. 4 of the manuscript, revealing the aspect of transfected cells, complementing gene ontology data and validating an interaction between Eml1 and an identified partner (Eml4). Further analyses are shown confirming reduced intensities of a centrosomal protein Cep170. Fig. S4 (Trafficking to the PC is altered in Eml1 cKO RG) shows primary cilia protein RUSH synchronized trafficking data showing abnormalities in conditional knockout cells. These data lead in to main Fig. 5. Fig. S5 (Centrosome and α-tubulin modifications at E12.5 and/or E15.5 in WT and Eml1 cKO brains) shows analyses related to centrosome-associated proteins, ɣ-tubulin, and pericentrin, as well as anomalies in α-tubulin intensity across the developing cortical wall. These data support main Figs. 6 and 7. Videos 1 and 2 also show the 3D visualizations of Satb2 staining in the cortex from a wild type E18 embryo (Video 1) compared with the cortex from an Eml1 cKO E18 embryo (Video 2). In the latter, both the homotopic cortex (green) as well as the heterotopia (pink) are easily visualized.
Data availability
The mass spectrometry proteomics data (BioID) have been deposited to the ProteomeXchange Consortium via the PRIDE partner repository (https://www.ebi.ac.uk/pride/) with the dataset identifier PXD045846. The main body of data (including images and analyses) are available in the article or online supplemental material. Source data are provided with this paper for western blots. All other source data are available from the authors upon reasonable request.
Acknowledgments
We are grateful to Dr. A. Baffet, V. Marthiens, and members of the lab for comments and discussions. We thank Dominic Norris for the RUSH PKD2 construction and Gaëlle Boncompain for aid with other RUSH constructs. We thank Anne Houllier for aid with western blots and lab members for support. We thank the IFM animal experimentation facility, and cellular and tissue imaging platforms at the Institut du Fer à Moulin, supported also by the Région Ile de France and the FRC Rotary. We also thank the TAAM (CDTA, Orléans) for aid with animal maintenance.
This project was supported by the French Agence Nationale de la Recherche (ANR) under the frame of E-Rare-3, the ERA-Net for Research on Rare Diseases (ERARE18-049, to F. Francis and N. Ozlu), and the Fondation pour la recherche medicale (FRM, Equipe FRM 2020 awarded to F. Francis EQU202003010323). Further funding was obtained from the JTC 2015 Neurodevelopmental Disorders affiliated with the ANR (for NEURON8-Full- 815-006 STEM-MCD, to F. Francis and J. Ladewig) and the Hector Stiftung II and the German research foundation project LA 2933/2-1 to J. Ladewig). F. Francis’s group were also involved in the European Cooperation on Science and Technology (COST Action CA16118), NeuroMIG project. We also thank the French Rare Diseases foundation and the PHENOMIN-ICS, France for the original Eml1 mouse model generation, as well as Dr. M. Groszer for provision of the Emx1-Cre line and Dr. K. Jones for agreement to use this. Our salaries and lab were supported by Institut National de la Santé et de la Recherche Médicale and the Centre national de la recherche scientifique. D. Zaidi was supported by an FRM grant FDT202204015115 and Sorbonne University. K. Chinnappa was supported by a Bourse Valérie Chamaillard awarded by the Fondation de France after ranking by the French Foundation for Research on Epilepsy. V. Viola was supported by Sorbonne University. J. Ferent obtained funding from the ATIP-Avenir program. The ANR project Ribocortex helped support this project (ANR-22-CE16-0025-01).
Author contributions: D. Zaidi: Conceptualization, Formal analysis, Investigation, Methodology, Project administration, Supervision, Validation, Visualization, Writing—original draft, Writing—review & editing, K. Chinnappa: Formal analysis, Investigation, Writing—review & editing, B.N. Yigit: Investigation, Visualization, V. Viola: Formal analysis, Investigation, Validation, Writing—original draft, Writing—review & editing, C. Cifuentes-Diaz: Data curation, Formal analysis, Investigation, Validation, Visualization, A.A. Jabali: Investigation, Writing—review & editing, A. Uzquiano: Conceptualization, Investigation, E. Lemesre: Resources, F. Perez: Methodology, Resources, Visualization, J. Ladewig: Funding acquisition, Investigation, Methodology, Project administration, Resources, Supervision, Validation, Writing—review & editing, J. Ferent: Formal analysis, Funding acquisition, Investigation, Methodology, Supervision, Validation, Visualization, Writing—original draft, Writing—review & editing, N. Ozlu: Investigation, Methodology, F. Francis: Conceptualization, Funding acquisition, Methodology, Project administration, Supervision, Validation, Visualization, Writing - original draft, Writing—review & editing.

