


Dendritic cell (DC) activation and function are underpinned by profound changes in cellular metabolism. Several studies indicate that the ability of DCs to promote tolerance is dependent on catabolic metabolism. Yet the contribution of AMP-activated kinase (AMPK), a central energy sensor promoting catabolism, to DC tolerogenicity remains unknown. Here, we show that AMPK activation renders human monocyte-derived DCs tolerogenic as evidenced by an enhanced ability to drive differentiation of regulatory T cells, a process dependent on increased RALDH activity. This is accompanied by several metabolic changes, including increased breakdown of glycerophospholipids, enhanced mitochondrial fission–dependent fatty acid oxidation, and upregulated glucose catabolism. This metabolic rewiring is functionally important as we found interference with these metabolic processes to reduce to various degrees AMPK-induced RALDH activity as well as the tolerogenic capacity of moDCs. Altogether, our findings reveal a key role for AMPK signaling in shaping DC tolerogenicity and suggest AMPK as a target to direct DC-driven tolerogenic responses in therapeutic settings.

Introduction
Dendritic cells (DCs) are specialized antigen-presenting cells with the ability to prime and polarize T cell responses. As such, DCs play a central role in the establishment of protective adaptive immunity following infections and after vaccination. In addition, their ability to prime regulatory T cells (Tregs) and induce anergy to host self-antigens make them critical regulators of tolerance (Kapsenberg, 2003). Hence, harnessing tolerogenic DCs (tolDCs) could be an interesting therapeutic strategy to treat inflammatory diseases. A number of clinical studies explored this concept by using ex vivo tolerized monocyte-derived (mo)DCs for adoptive cell transfer. While this has shown this approach is safe, the clinical benefits are currently limited, in part due to impaired long-lasting maintenance of the tolerogenic state (Mohammadi et al., 2023; Ness et al., 2021; Passeri et al., 2021). Novel insights into the processes that drive and shape DC tolerogenicity, in particular those of moDCs, are therefore instrumental for devising new strategies to increase efficacy of tolDC-based therapies.
DCs can be exposed to a number of different metabolic microenvironments ranging from a nutrient-deprived tumor microenvironment to nutrient-rich tissues in obese individuals. These metabolic cues and nutrient availability are expected to have a major impact on DC function and the subsequent immune response, as they impinge on intracellular metabolic pathway activity that plays a central role in shaping DC immunogenicity (Brombacher and Everts, 2020). Acquisition of an immunogenic DC phenotype is commonly associated with anabolic metabolism and underpinned by enhanced glycolysis and fatty acid synthesis (Everts et al., 2014; Krawczyk et al., 2010), while tolDCs are functionally supported by catabolism-centered metabolism, characterized by enhanced glycolysis in combination with elevated oxidative phosphorylation and fatty acid oxidation (FAO) (Malinarich et al., 2015; Møller et al., 2022; Patente et al., 2019).
Nutrient-sensing pathways connect environmental cues to changes in cellular bioenergetics and are therefore highly important for DC function. For example, DC activation is facilitated by upregulated glycolysis, which is supported by mechanistic target of rapamycin (mTOR) and counteracted by AMP-activated protein kinase (AMPK) (Krawczyk et al., 2010), two nutrient-sensing enzymes that are activated in nutrient-sufficient and -poor conditions, respectively (Snyder and Amiel, 2019; Steinberg and Hardie, 2022). While the role of mTOR in DCs has been extensively studied, less is known about the role of AMPK in DC function (Snyder and Amiel, 2019). AMPK is a central regulator of cellular metabolism, well known for its role in regulating energy homeostasis during nutrient stress. Canonical AMPK activation involves a high AMP/ADP ratio that triggers liver kinase B1 (LKB1) to activate AMPK via phosphorylation. AMPK activation inhibits fatty acid synthesis while enhancing FAO by phosphorylation of acetyl-CoA carboxylase (ACC) isoforms ACC1 and ACC2, respectively. Catabolic metabolism is further promoted by induction of autophagy and downregulating of protein synthesis through inhibition of mTORC1. AMPK also plays an important role in mitochondrial homeostasis by regulating the removal of damaged mitochondria through mitophagy and by stimulating mitochondrial biogenesis (Steinberg and Hardie, 2022; Trefts and Shaw, 2021).
There is some evidence that suggests a role for AMPK signaling in DCs in dampening an inflammatory immune response. AMPK activation in bone marrow–derived DCs (BMDCs) suppressed IL-12p40 secretion and CD86 expression (Krawczyk et al., 2010), while AMPK deficiency in BMDCs promotes secretion of proinflammatory cytokines and IFN-γ and IL-17 secretion by T cells (Carroll et al., 2013). Additionally, AMPK deficiency in CD11c-expressing cells worsened lung injury following hookworm infection through increased IL-12/23p40 production by pulmonary CD11c+ cells (Nieves et al., 2016). Interestingly, we have recently found that the tolerogenic effects of retinoic acid (RA) on DCs are AMPK dependent, suggesting that AMPK may not only dampen DC immunogenicity but can also actively contribute to the tolerogenic capacity of DCs (Patente et al., 2023, Preprint). Yet, whether AMPK activation itself is sufficient to induce DC tolerogenicity and immune tolerance and what the underlying mechanisms are remain unknown.
In the present study, we find that drug-induced AMPK activation in human moDCs is sufficient to promote their tolerogenicity, as evidenced by an enhanced ability to prime functional Treg cells through induction of retinaldehyde dehydrogenase (RALDH) activity. We further show that, mechanistically, AMPK activation boosts glycerophospholipid degradation, mitochondrial fission–induced FAO, and glucose catabolism. Interference with these metabolic alterations partly negates the tolerogenic effects of AMPK activation. Together this provides support for an important role of AMPK in rendering DCs tolerogenic through rewiring of lipid and glucose metabolism and may identify AMPK as a potential target for improving tolDC-based immunotherapies.
Results
AMPK activation renders DCs tolerogenic through promotion of RALDH activity
To study the effect AMPK activation on DC function, we treated human moDCs with 991, a direct small-molecule AMPK activator (Bultot et al., 2016). AMPK activation was rapidly and dose-dependently induced by 991, as assessed by phosphorylation on Ser79 of its downstream target ACC (Fig. S1 A) (Hardie et al., 2012). AMPK activation remained stable over time (Fig. S1 B), while simultaneously reducing mTORC1 activity, as assessed by phosphorylation of S6, a downstream target of mTORC1 (Fig. S1 C), irrespective of prior activation of DCs by LPS (Fig. 1, A and B; and Fig. S2 A). To investigate the effects of AMPK activation on DC tolerogenicity, immature moDCs (iDCs) were treated overnight with 991 before LPS stimulation (Fig. 1 A), and 24 h later, LPS-treated mature DCs (mDCs) were cocultured with allogeneic naïve T cells. As a readout for DC tolerogenicity, we evaluated the effect of 991 on their ability to prime functional Tregs. To this end, a T cell suppression assay was employed, in which T cells that have been primed by the DCs and subsequently irradiated to prevent further proliferation, are tested for their ability to suppress proliferation of bystander T cells, which is a hallmark of Tregs. Using this assay, we found that AMPK activation dose-dependently rendered DCs tolerogenic (Fig. S1 D), with 991 at a concentration of 100 µM having similar tolerogenic potential as well-known tolerogenic compound vitamin D (Fig. 1 C and Fig. S2 B). Similar results were obtained when test T cells were not irradiated prior to coculture with responder T cells (Fig. S1 E). Induction of Tregs was also observed when DCs were treated with AICA riboside (AICAR), another AMPK activator (Fig. S1, F and G). Because 991 used at concentrations of 100 µM showed the most robust tolerogenic effect, without affecting viability of both iDCs and mDCs (Fig. S1 H), this dose was used for further experiments. 991 stimulation diminished LPS-induced activation of DCs, as evidenced by reduction in several activation markers (Fig. 1 D, Fig. S1 I, and Fig. S2 C), as well as IL-10 and IL12p40 secretion (Fig. 1 E). Additionally, surface expression of TLR4 was reduced by 991 (Fig. 1 F and Fig. S2 D), which may in part explain the reduced ability of 991-conditioned DCs to upregulate maturation markers and cytokines following LPS stimulation. However, some markers increased in expression, including CD103 (Fig. 1 G and Fig. S2 E), which is also upregulated on RA-induced tolerogenic DCs, that promote Treg differentiation through RALDH-driven RA production (Coombes et al., 2007; Sun et al., 2007). Interestingly, similarly to RA, 991 treatment also promoted RALDH activity in mDCs (Fig. 1 H and Fig. S2 F).

Effects of 991 and RALDH inhibition on moDCs and T cell priming. (A and B) Phosphorylation of ACC (Ser79) as determined by flow cytometry upon (A) different concentrations of 991 and (B) at different time points after treatment with 100 µM 991. (C) Representative histogram and normalized quantification of phosphorylation of S6 (Ser240). (D) Normalized percentage of proliferation of bystander T cells after a T cell suppression assay. (E) Representative plots of irradiated and non-irradiated T cells and percentage of proliferation of bystander T cells after a T cell suppression assay with either non-irradiated or irradiated test T cells. (F) Normalized quantification of phosphorylation of ACC (Ser79) after treatment with H2O/AICAR. (G) Normalized percentage of proliferation of bystander T cells after a T cell suppression assay. (H) Percentage of live cells as % of total moDCs. (I) Normalized expression of indicated markers on moDCs. (J) Representative plots and normalized percentages of CD4+ T cells of intracellular cytokines after restimulation with PMA/ionomycin in the presence of Brefeldin A. (K) Gating strategy of Treg subsets as described in Fig. 1 I. Results are expressed as means ± SEM. Error bars represent SEM. Data are pooled from six donors from four independent experiments (A); three donors from three independent experiments (B); five donors from three independent experiments (C); three donors from one experiment (D); representative of one out of two donors from one experiment (E); four to six donors from three independent experiments (G and H); four donors from one experiment (I); and eight donors from four independent experiments (J). Statistical analyses were performed using repeated measures one-way ANOVA with Tukey’s post hoc test (A, D, and G), repeated measures two-way ANOVA with Sidak’s post-hoc test (C, E, H, and I) and paired t test (J). *P < 0.05, **P < 0.01, ***P < 0.001. geoMFI, geometric mean fluorescence intensity.
Effects of 991 and RALDH inhibition on moDCs and T cell priming. (A and B) Phosphorylation of ACC (Ser79) as determined by flow cytometry upon (A) different concentrations of 991 and (B) at different time points after treatment with 100 µM 991. (C) Representative histogram and normalized quantification of phosphorylation of S6 (Ser240). (D) Normalized percentage of proliferation of bystander T cells after a T cell suppression assay. (E) Representative plots of irradiated and non-irradiated T cells and percentage of proliferation of bystander T cells after a T cell suppression assay with either non-irradiated or irradiated test T cells. (F) Normalized quantification of phosphorylation of ACC (Ser79) after treatment with H2O/AICAR. (G) Normalized percentage of proliferation of bystander T cells after a T cell suppression assay. (H) Percentage of live cells as % of total moDCs. (I) Normalized expression of indicated markers on moDCs. (J) Representative plots and normalized percentages of CD4+ T cells of intracellular cytokines after restimulation with PMA/ionomycin in the presence of Brefeldin A. (K) Gating strategy of Treg subsets as described in Fig. 1 I. Results are expressed as means ± SEM. Error bars represent SEM. Data are pooled from six donors from four independent experiments (A); three donors from three independent experiments (B); five donors from three independent experiments (C); three donors from one experiment (D); representative of one out of two donors from one experiment (E); four to six donors from three independent experiments (G and H); four donors from one experiment (I); and eight donors from four independent experiments (J). Statistical analyses were performed using repeated measures one-way ANOVA with Tukey’s post hoc test (A, D, and G), repeated measures two-way ANOVA with Sidak’s post-hoc test (C, E, H, and I) and paired t test (J). *P < 0.05, **P < 0.01, ***P < 0.001. geoMFI, geometric mean fluorescence intensity.

AMPK activation induces tolerogenic DCs via promotion of RALDH activity. (A) Schematic overview of experimental setup. Monocytes were isolated from PBMCs and differentiated in moDCs in the presence of GM-CSF + IL-4. On day (d) 5, cells were treated with either DMSO or 100 µM 991. On day 6, 100 ng/ml of LPS was added if indicated, and 24 h later, cells were harvested for functional assays. (B) Representative histogram and normalized quantification of phosphorylation of ACC (Ser79). (C) Representative histograms and normalized percentage of proliferation of bystander T cells after co-culture with irradiated T cells primed with 991/DMSO-treated mDCs. (D) Normalized expression of indicated markers by moDCs. (E) Concentration of IL-10 and IL12p40 in the supernatants of mDCs after a 24-h stimulation. (F and G) Normalized expression of TLR4 and CD103. (H) Representative histogram and normalized quantification of RALDH activity. (I) Representative gating strategy to identify Foxp3+CD25+CD127−-induced Treg and Foxp3−CD25−CD127−LAG3+CD49b+ Tr1s. (J) Frequency of Foxp3+ Tregs and Tr1s DC–T cell co-cultures. (K) Frequency of each Treg subset expressing indicated markers. (L) Normalized expression of indicated markers by Treg subsets. (M) Representative histograms and normalized percentage of the proliferation of bystander T cells after co-culture with irradiated T cells primed with 991/DMSO-treated mDCs and in the presence or absence of RALDH inhibitor (RALDHi) bisdiamine during both mDC maturation and mDC–T cell co-culture. Results are expressed as means ± SEM. Error bars represent SEM. Data are pooled from four to six donors from three independent experiments (B–D, G, and H); representative of one out of four independent experiments (E); pooled from four donors from two independent experiments (F); and pooled from nine donors from four independent experiments (I–M). Statistical analyses were performed using repeated measures two-way ANOVA with Sidak’s post-hoc test (B, D–H, and M), one-way ANOVA for repeated measures with Sidak post-hoc test (C), or paired t test (J–L). *P < 0.05, **P < 0.01, ***P < 0.001. geoMFI, geometric mean fluorescence intensity.
AMPK activation induces tolerogenic DCs via promotion of RALDH activity. (A) Schematic overview of experimental setup. Monocytes were isolated from PBMCs and differentiated in moDCs in the presence of GM-CSF + IL-4. On day (d) 5, cells were treated with either DMSO or 100 µM 991. On day 6, 100 ng/ml of LPS was added if indicated, and 24 h later, cells were harvested for functional assays. (B) Representative histogram and normalized quantification of phosphorylation of ACC (Ser79). (C) Representative histograms and normalized percentage of proliferation of bystander T cells after co-culture with irradiated T cells primed with 991/DMSO-treated mDCs. (D) Normalized expression of indicated markers by moDCs. (E) Concentration of IL-10 and IL12p40 in the supernatants of mDCs after a 24-h stimulation. (F and G) Normalized expression of TLR4 and CD103. (H) Representative histogram and normalized quantification of RALDH activity. (I) Representative gating strategy to identify Foxp3+CD25+CD127−-induced Treg and Foxp3−CD25−CD127−LAG3+CD49b+ Tr1s. (J) Frequency of Foxp3+ Tregs and Tr1s DC–T cell co-cultures. (K) Frequency of each Treg subset expressing indicated markers. (L) Normalized expression of indicated markers by Treg subsets. (M) Representative histograms and normalized percentage of the proliferation of bystander T cells after co-culture with irradiated T cells primed with 991/DMSO-treated mDCs and in the presence or absence of RALDH inhibitor (RALDHi) bisdiamine during both mDC maturation and mDC–T cell co-culture. Results are expressed as means ± SEM. Error bars represent SEM. Data are pooled from four to six donors from three independent experiments (B–D, G, and H); representative of one out of four independent experiments (E); pooled from four donors from two independent experiments (F); and pooled from nine donors from four independent experiments (I–M). Statistical analyses were performed using repeated measures two-way ANOVA with Sidak’s post-hoc test (B, D–H, and M), one-way ANOVA for repeated measures with Sidak post-hoc test (C), or paired t test (J–L). *P < 0.05, **P < 0.01, ***P < 0.001. geoMFI, geometric mean fluorescence intensity.

AMPK activation induces tolerogenic DCs via promotion of RALDH activity. (A–I) Unnormalized data on which Fig. 1, B–H and Fig. S1 I is based. (A) Quantification of phosphorylation of ACC (Ser79). (B) Percentage of proliferation of bystander T cells after co-culture with irradiated T cells primed with 991/DMSO-treated mDCs. (C) Expression of indicated markers by moDCs. (D and E) Expression of TLR4 and CD103. (F) Quantification of RALDH activity by flow cytometry. (G–I) Percentage of CD4+ T cells expressing indicated intracellular cytokines after restimulation with PMA/ionomycin in the presence of Brefeldin A, after coculture with indicated DCs. (J) IL-10 secretion in supernatants of CD4+ T cells as determined by ELISA, harvested after a 24 h restimulation with anti-CD3 and anti-CD28, after coculture with indicated DCs. (K) Representative histograms of RALDH activity after treatment with RALDH inhibitor bisdiamine (RALDHi). Representative of four independent experiments. (L) Normalized expression of indicated markers. (M) Normalized concentration of IL-12p40 and IL-10 after a 24-h coculture with CD40L-expressing J558 cells. (N) Normalized quantification of bystander T cell proliferation after co-culture with irradiated T cells primed with 991/DMSO-treated mDCs cultured in the presence or absence of RALDH inhibitor bisdiamine (RALDHi). Results are expressed as means ± SEM. Error bars represent SEM. Data are pooled from four to six donors from three independent experiments (A, B, and D–F); eight donors from four independent experiments (G–I), nine donors from five independent experiments, representative of one out of two donors from one experiment (K); pooled from 10 to 12 donors from five independent experiments (L); five donors from three independent experiments (M); and five donors from two independent experiments (N). Statistical analyses were performed using repeated measures two-way ANOVA with Sidak’s post-hoc test (A, C–F, and K–N), one-way ANOVA for repeated measures with Sidak post-hoc test (B) or paired t test (G–J). *P < 0.05, **P < 0.01, ***P < 0.001. geoMFI, geometric mean fluorescence intensity.
AMPK activation induces tolerogenic DCs via promotion of RALDH activity. (A–I) Unnormalized data on which Fig. 1, B–H and Fig. S1 I is based. (A) Quantification of phosphorylation of ACC (Ser79). (B) Percentage of proliferation of bystander T cells after co-culture with irradiated T cells primed with 991/DMSO-treated mDCs. (C) Expression of indicated markers by moDCs. (D and E) Expression of TLR4 and CD103. (F) Quantification of RALDH activity by flow cytometry. (G–I) Percentage of CD4+ T cells expressing indicated intracellular cytokines after restimulation with PMA/ionomycin in the presence of Brefeldin A, after coculture with indicated DCs. (J) IL-10 secretion in supernatants of CD4+ T cells as determined by ELISA, harvested after a 24 h restimulation with anti-CD3 and anti-CD28, after coculture with indicated DCs. (K) Representative histograms of RALDH activity after treatment with RALDH inhibitor bisdiamine (RALDHi). Representative of four independent experiments. (L) Normalized expression of indicated markers. (M) Normalized concentration of IL-12p40 and IL-10 after a 24-h coculture with CD40L-expressing J558 cells. (N) Normalized quantification of bystander T cell proliferation after co-culture with irradiated T cells primed with 991/DMSO-treated mDCs cultured in the presence or absence of RALDH inhibitor bisdiamine (RALDHi). Results are expressed as means ± SEM. Error bars represent SEM. Data are pooled from four to six donors from three independent experiments (A, B, and D–F); eight donors from four independent experiments (G–I), nine donors from five independent experiments, representative of one out of two donors from one experiment (K); pooled from 10 to 12 donors from five independent experiments (L); five donors from three independent experiments (M); and five donors from two independent experiments (N). Statistical analyses were performed using repeated measures two-way ANOVA with Sidak’s post-hoc test (A, C–F, and K–N), one-way ANOVA for repeated measures with Sidak post-hoc test (B) or paired t test (G–J). *P < 0.05, **P < 0.01, ***P < 0.001. geoMFI, geometric mean fluorescence intensity.
We next aimed to better characterize the phenotype of the T cells co-cultured with 991-treated mDCs. The ability of mDCs to promote IFN-γ, IL-4, and IL-10 secretion by T cells was not modulated by 991 (Fig. S1 J and Fig. S2, G–J), nor—somewhat unexpectedly—to alter frequencies of classical CD127−CD25hiFoxP3+ Tregs or CD127−CD25−FoxP3−Lag3+CD49b+ Treg1 (Tr1) cells (Gagliani et al., 2013), two of the major induced Treg subsets (Fig. 1, I and J; and Fig. S1 K). Interestingly though, further phenotypic characterization revealed that the frequency of Tr1 cells specially expressing TIGIT, an important co-inhibitory molecule expressed by Tregs (Joller et al., 2014) (Fig. 1 K) as well as its expression per Tr1 cell were increased in T cell cultures from 991-stimulated mDCs (Fig. 1 L). Expression of other co-inhibitory molecules such as ICOS and CTLA4 (Boonpiyathad et al., 2020) were not different or even reduced on both Treg subsets (Fig. 1, K and L). This suggests that AMPK-activated DCs drive expansion of TIGIT+ Tr1 cells (Boonpiyathad et al., 2020; Gagliani et al., 2013; Joller et al., 2014; Zheng et al., 2013).
We next questioned whether the tolerogenic effects of AMPK activation were dependent on increased RALDH activity. mDCs were therefore treated with RALDH2 inhibitor bisdiamide during 991 treatment and subsequent LPS stimulation (Fig. S2 K). RALDH inhibition prevented 991-induced suppression in expression of HLA-DR, CD86, CD83, and CD80 to various degrees (Fig. S2 L). IL-10 and IL-12p40 secretion was further decreased upon RALDH inhibition compared to control groups (Fig. S2 M). The suppressive capacity of T cells primed with 991-treated DCs was not affected when RALDH was inhibited during DC culture alone (Fig. S2 N), but strikingly, when bisdiamide was also added during T cell co-culture, the ability of 991-stimulated mDCs to prime functional Tregs was lost (Fig. 1 M). Because T cells did not show detectable RALDH activity (Fig. S2 K), this indicates that RALDH activity in 991-stimulated mDCs during DC–T cell coculture is required for these DCs to exert their tolerogenic effect. Altogether, AMPK activation in DCs promotes their ability to prime functional Tregs through induction of RALDH activity.
AMPK activation drives catabolic glycerophospholipid metabolism
To gain insight into how AMPK activation induces DC tolerogenicity, we performed untargeted metabolomics and proteomics on DMSO- and 991-treated iDCs and mDCs. LPS treatment had clear effects on both the metabolome and the proteome of DCs. Strikingly, LPS stimulation did not lead to any of these changes in 991-treated cells (Fig. S3, A and B), supporting our earlier observations that AMPK activation counteracts LPS-induced DC maturation. 991 treatment promoted increases in several proteins and metabolites irrespective of LPS stimulation, while the downregulated hits upon 991 treatment mainly consisted of proteins and metabolites whose accumulation was induced by LPS (Fig. S3, C–E). Pathway enrichment analysis on the proteome revealed that pathways enriched upon 991 stimulation in LPS-treated mDCs were all associated with (catabolic) lipid metabolism (Fig. 2 A), in particular glycerophospholipid catabolism. Metabolomic data also indicated enhanced glycerolipid metabolism, as well as upregulation of the pentose phosphate pathway (Fig. 2 B). Integration of the proteomic and metabolomic data sets using web-service “genes and metabolites” (Sergushichev et al., 2016) created a metabolic network that additionally highlighted changes in amino acid metabolism and TCA cycle metabolites and further affirmed significant changes in lipid metabolism, including glycerophospholipid metabolism (Fig. 2 C). Additionally, most 991-specific metabolite and protein changes in glycerophospholipid metabolism occurred independently of DC maturation (Fig. 2, D and E). The proteomic/metabolic network connected an accumulation of glycerol-3-phosphate and a decrease in membrane-lipid phosphatidylcholine (Fig. 2 F) to upregulation of two proteins involved in breakdown of glycerophospholipids, namely patatin-like phospholipase domain-containing protein 6 (PNPLA6) and glycerophosphocholine phosphodiesterase 1 (GPCPD1) (Fig. 2 G). PNPLA6, also known as neuropathy target esterase, is a phospholipase that hydrolyzes phosphatidylcholine (PC), thereby releasing fatty acids and glycerophosphocholine (Van Tienhoven et al., 2002). GPCPD1, also known as GDE5, hydrolyzes glycerophosphocholine to glycerol-3-phosphate (G3P) and choline (Okazaki et al., 2010). Phosphatidylethanolamine (PE), another membrane lipid of which the abundance also decreased upon 991 treatment (Fig. 2 F), can also be hydrolyzed to G3P and ethanolamine via PNPLA6 and GPCPD1, albeit with a lower affinity (Okazaki et al., 2010; Van Tienhoven et al., 2002). We aimed to determine whether breakdown of PC and PE via PNPLA6 and GPCPD1 contributes to AMPK-induced tolerogenicity, and hence, we silenced expression of both PNPLA6 and GPCPD1 in iDCs before adding 991 and LPS with siRNA. Quantitative PCR (qPCR) analysis revealed that 991-induced PNPLA6 and GPCPD1 protein expression was mirrored at the transcriptional level (Fig. 2 H). Gene silencing strongly reduced expression of both genes, although this was less pronounced in 991-treated cells (Fig. 2 H). Expression of activation markers (Fig. S3 F) and IL-12p40 and IL-10 secretion was not affected by silencing of PNPLA6 and GPCPD1 (Fig. S3 G), while RALDH activity in silenced 991-stimulated mDCs showed a reduction in most donors (Fig. 2 I). Correspondingly, 991-driven induction of functional Tregs by mDCs was partly lost after silencing of PNPLA6 and GPCPD1 (Fig. 2 J). Altogether these data suggest that AMPK activation in mDCs promotes catabolic lipid metabolism and that breakdown of glycerophospholipids, mediated by PNPLA6 and GPCPD1, is contributing to AMPK-induced tolerogenicity.

Effects of AMPK activation on proteome and metabolome of moDCs. (A and B) Volcano plots depicting all identified (A) proteins and (B) metabolites. Blue and red dots denote the significantly down- and upregulated proteins/metabolites, respectively. (C) Venn diagrams showing the overlap between up- and downregulated proteins and metabolites upon AMPK activation in mDCs and iDCs. (D and E) Heatmaps depicting the relative expression of the 20 most up- and downregulated (D) proteins and (E) metabolites upon AMPK activation in mDCs, ranked by log2 fold change and filtered by adjusted P value <0.05. (F) Normalized expression of indicated markers. (G) The relative concentration of IL-12p40 and IL-10 in the supernatants of mDCs after co-culture with CD40L-expressing J558 cells. Results are expressed as means ± SEM. Error bars represent SEM. Data are pooled from four donors from two independent experiments (A–E); pooled from seven donors from three independent experiments (F); and five donors from two independent experiments (G). Statistical analyses were performed using repeated measures two-way ANOVA with Sidak’s post-hoc test. *P < 0.05, **P < 0.01. geoMFI, geometric mean fluorescence intensity.
Effects of AMPK activation on proteome and metabolome of moDCs. (A and B) Volcano plots depicting all identified (A) proteins and (B) metabolites. Blue and red dots denote the significantly down- and upregulated proteins/metabolites, respectively. (C) Venn diagrams showing the overlap between up- and downregulated proteins and metabolites upon AMPK activation in mDCs and iDCs. (D and E) Heatmaps depicting the relative expression of the 20 most up- and downregulated (D) proteins and (E) metabolites upon AMPK activation in mDCs, ranked by log2 fold change and filtered by adjusted P value <0.05. (F) Normalized expression of indicated markers. (G) The relative concentration of IL-12p40 and IL-10 in the supernatants of mDCs after co-culture with CD40L-expressing J558 cells. Results are expressed as means ± SEM. Error bars represent SEM. Data are pooled from four donors from two independent experiments (A–E); pooled from seven donors from three independent experiments (F); and five donors from two independent experiments (G). Statistical analyses were performed using repeated measures two-way ANOVA with Sidak’s post-hoc test. *P < 0.05, **P < 0.01. geoMFI, geometric mean fluorescence intensity.

AMPK activation drives glycerophospholipid breakdown. Proteomics and metabolomics were performed on DMSO/991-treated iDCs and mDCs. (A) GO pathway enrichment of significantly up- and downregulated proteins in AMPK-activated mDCs. (B) KEGG enrichment analysis of significantly up- and downregulated metabolites in AMPK-activated mDCs. (C) Network analysis of integrated proteomics and metabolomics data from mDCs. (D and E) Heatmap depicting relative expression of (D) proteins and (E) metabolites involved in glycerophospholipid metabolism. (F and G) Dotplots showing the abundance as determined by metabolomics or proteomics of (F) metabolites and (G) proteins involved in glycerophospholipid metabolism that are strongly affected by AMPK activation. (H) Relative gene expression of PNPLA6 and GPCPD1 72 h after electroporation with control siRNA (siCTR), or siRNA targeting PNPLA6 or GPCPD1. (I) Normalized quantification of RALDH activity. (J) Normalized percentage of proliferation of bystander T cells after a T cell suppression assay. Results are expressed as means ± SEM. Error bars represent SEM. Data are pooled from four donors from two independent experiments (A–G), three donors from two independent experiments (H), and six donors from three independent experiments (I and J). Statistical analyses were performed using repeated measures two-way ANOVA with Sidak’s post-hoc test (F–J). *P < 0.05, **P < 0.01. geoMFI, geometric mean fluorescence intensity.
AMPK activation drives glycerophospholipid breakdown. Proteomics and metabolomics were performed on DMSO/991-treated iDCs and mDCs. (A) GO pathway enrichment of significantly up- and downregulated proteins in AMPK-activated mDCs. (B) KEGG enrichment analysis of significantly up- and downregulated metabolites in AMPK-activated mDCs. (C) Network analysis of integrated proteomics and metabolomics data from mDCs. (D and E) Heatmap depicting relative expression of (D) proteins and (E) metabolites involved in glycerophospholipid metabolism. (F and G) Dotplots showing the abundance as determined by metabolomics or proteomics of (F) metabolites and (G) proteins involved in glycerophospholipid metabolism that are strongly affected by AMPK activation. (H) Relative gene expression of PNPLA6 and GPCPD1 72 h after electroporation with control siRNA (siCTR), or siRNA targeting PNPLA6 or GPCPD1. (I) Normalized quantification of RALDH activity. (J) Normalized percentage of proliferation of bystander T cells after a T cell suppression assay. Results are expressed as means ± SEM. Error bars represent SEM. Data are pooled from four donors from two independent experiments (A–G), three donors from two independent experiments (H), and six donors from three independent experiments (I and J). Statistical analyses were performed using repeated measures two-way ANOVA with Sidak’s post-hoc test (F–J). *P < 0.05, **P < 0.01. geoMFI, geometric mean fluorescence intensity.
FAO is important for AMPK-induced tolerogenicity
As our data indicate enhanced lipid catabolism upon AMPK activation and given that AMPK is known to promote mitochondrial FAO, we further investigated the effects of 991 treatment on mitochondrial metabolism and FAO. Basal mitochondrial respiration, ATP production, and spare respiratory capacity were not affected by AMPK activation (Fig. 3, A and B; and Fig. S4 A), and neither were mitochondrial mass or membrane potential (Fig. S4 B). Interestingly, 991 treatment increased the protein expression ratio between complex II and complex I of the electron transport chain (Fig. 3 C). This is a metabolic adaptation commonly associated with increased FAO, as it allows for more efficient oxidation of complex II substrate FADH2 that is generated during FAO. Hence, this AMPK-activation-driven change in the ratio may reflect increased FAO rates. Indeed, [U-13C]-palmitate tracing revealed a trend toward increased uptake and oxidation of palmitate, marked by higher abundance of labeled palmitoyl-L-carnitine (Fig. 3, D and E), and the presence of palmitate-derived carbons in acetyl-CoA, the final product of FAO (Fig. 3, F and G). Although the total levels of acetyl-CoA and palmitate-derived acetyl-CoA (M+2) tended to increase after 991 treatment, the contribution of palmitate to acetyl-CoA was low in these cells, at around 3%. AMPK activation did not change carnitine palmitoyltransferase-1A (CPT1A) protein expression (Fig. S4 C), suggesting that enhanced FAO is driven by higher CPT1A activity and/or by increased free fatty acid availability. In support of the latter, we found that AMPK activation promoted long-chain fatty acid uptake, while lipid droplet accumulation was unaffected (Fig. 3 H). Additionally, release of endogenous fatty acids from phospholipids upon AMPK activation, as shown in Fig. 2, may contribute to increasing intracellular fatty acid levels to fuel-enhanced FAO.
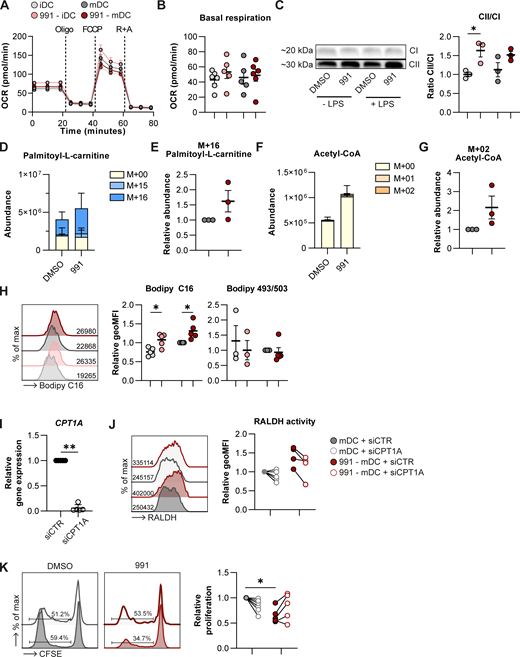
AMPK-induced tolerogenicity is driven by FAO. (A and B) Real-time OCR as measured by (A) Seahorse extracellular flux analysis and (B) quantification of basal respiration rates. R+A, rotenone + Antimycin A. (C) Western Blot of complex I (CI) and complex II (CII) of the electron transport chain and quantification of the ratio between CII and CI. (D–G) [U-13C]-palmitate tracing was performed in DMSO/991-treated mDCs. Figures show (D) total abundance of palmitoyl-L-carnitine, (E) abundance of the labeled M+16 fraction of palmitoyl-L-carnitine normalized per donor, (F) total abundance of acetyl-CoA, and (G) abundance of the labeled M+02 fraction of acetyl-CoA normalized per donor. (H) Representative histogram of Bodipy C16 uptake and normalized quantification of Bodipy C16 and Bodipy 495/503. (I) Relative gene expression of CPT1A in mDCs 72 h after electroporation with control siRNA (siCTR) or siRNA targeting CPT1A (siCPT1A). (J) Representative histogram and normalized quantification of RALDH activity. (K) Representative histograms and normalized percentage of proliferation of bystander T cells after a T cell suppression assay. Results are expressed as means ± SEM, with error bars representing SEM (B, C, E, and G–I) or means ± SD, with error bars representing SD (D and F). Data are representative of one out of three independent experiments with pooled data from two donors (A), pooled from six donors from three independent experiments (B), three donors from two independent experiments (C), three donors from one experiment (D–G), and three to five donors from three independent experiments (H–K). Statistical analyses were performed using repeated measures two-way ANOVA with Sidak’s post-hoc test (B, C, H, J, and K) or paired t tests (D–G). *P < 0.05, **P < 0.01. FCCP, fluoro-carbonyl cyanide phenylhydrazone. geoMFI, geometric mean fluorescence intensity. Source data are available for this figure: SourceData F3.
AMPK-induced tolerogenicity is driven by FAO. (A and B) Real-time OCR as measured by (A) Seahorse extracellular flux analysis and (B) quantification of basal respiration rates. R+A, rotenone + Antimycin A. (C) Western Blot of complex I (CI) and complex II (CII) of the electron transport chain and quantification of the ratio between CII and CI. (D–G) [U-13C]-palmitate tracing was performed in DMSO/991-treated mDCs. Figures show (D) total abundance of palmitoyl-L-carnitine, (E) abundance of the labeled M+16 fraction of palmitoyl-L-carnitine normalized per donor, (F) total abundance of acetyl-CoA, and (G) abundance of the labeled M+02 fraction of acetyl-CoA normalized per donor. (H) Representative histogram of Bodipy C16 uptake and normalized quantification of Bodipy C16 and Bodipy 495/503. (I) Relative gene expression of CPT1A in mDCs 72 h after electroporation with control siRNA (siCTR) or siRNA targeting CPT1A (siCPT1A). (J) Representative histogram and normalized quantification of RALDH activity. (K) Representative histograms and normalized percentage of proliferation of bystander T cells after a T cell suppression assay. Results are expressed as means ± SEM, with error bars representing SEM (B, C, E, and G–I) or means ± SD, with error bars representing SD (D and F). Data are representative of one out of three independent experiments with pooled data from two donors (A), pooled from six donors from three independent experiments (B), three donors from two independent experiments (C), three donors from one experiment (D–G), and three to five donors from three independent experiments (H–K). Statistical analyses were performed using repeated measures two-way ANOVA with Sidak’s post-hoc test (B, C, H, J, and K) or paired t tests (D–G). *P < 0.05, **P < 0.01. FCCP, fluoro-carbonyl cyanide phenylhydrazone. geoMFI, geometric mean fluorescence intensity. Source data are available for this figure: SourceData F3.

Effects of AMPK activation on mitochondrial metabolism and glucose metabolism. (A) Quantification of ATP production and maximal respiratory capacity of OCR derived from Fig. 3 A. (B) Normalized quantification of mitochondrial membrane potential (TMRM) and mitochondrial mass (Mitotracker green). (C) Expression of CPT1A derived from the proteomics data. (D) Normalized quantification of Bodipy C16 and Bodipy 493/503 staining. (E) Normalized expression of indicated markers. (F) Normalized concentration of IL-12p40 and IL-10 after a 24 h coculture with CD40L-expressing J558 cells. (G and H) Normalized abundance and normalized quantification of relative C13-glucose–labeled fraction of metabolites involved in (G) glycolysis and (H) TCA cycle, derived from Fig. 5, A and B. (I) Normalized expression of indicated markers. (J) Normalized concentration of IL-12p40 and IL-10 after a 24 h co-culture with CD40L-expressing J558 cells. G6P, fructose 1,6-biphosphate (F1,6BP), glycerol 3-phosphate (G3P), phosphoenolpyruvate (PEP). Results are expressed as means ± SEM. Error bars represent SEM. Data are pooled from six donors from three independent experiments (A), four to six donors from three independent experiments, (B), four donors from one experiment (C), five to six donors from three independent experiments (D–F), four donors from one experiment (G and H), eight donors from four independent experiments (I), and four donors from two independent experiments (J). Statistical analyses were performed using repeated measures two-way ANOVA with Sidak’s post-hoc test (A–F), paired t tests (G and H), or repeated measures two-way ANOVA with Tukey post-hoc test (I and J). *P < 0.05, **P < 0.01, ****P < 0.0001. geoMFI, geometric mean fluorescence intensity.
Effects of AMPK activation on mitochondrial metabolism and glucose metabolism. (A) Quantification of ATP production and maximal respiratory capacity of OCR derived from Fig. 3 A. (B) Normalized quantification of mitochondrial membrane potential (TMRM) and mitochondrial mass (Mitotracker green). (C) Expression of CPT1A derived from the proteomics data. (D) Normalized quantification of Bodipy C16 and Bodipy 493/503 staining. (E) Normalized expression of indicated markers. (F) Normalized concentration of IL-12p40 and IL-10 after a 24 h coculture with CD40L-expressing J558 cells. (G and H) Normalized abundance and normalized quantification of relative C13-glucose–labeled fraction of metabolites involved in (G) glycolysis and (H) TCA cycle, derived from Fig. 5, A and B. (I) Normalized expression of indicated markers. (J) Normalized concentration of IL-12p40 and IL-10 after a 24 h co-culture with CD40L-expressing J558 cells. G6P, fructose 1,6-biphosphate (F1,6BP), glycerol 3-phosphate (G3P), phosphoenolpyruvate (PEP). Results are expressed as means ± SEM. Error bars represent SEM. Data are pooled from six donors from three independent experiments (A), four to six donors from three independent experiments, (B), four donors from one experiment (C), five to six donors from three independent experiments (D–F), four donors from one experiment (G and H), eight donors from four independent experiments (I), and four donors from two independent experiments (J). Statistical analyses were performed using repeated measures two-way ANOVA with Sidak’s post-hoc test (A–F), paired t tests (G and H), or repeated measures two-way ANOVA with Tukey post-hoc test (I and J). *P < 0.05, **P < 0.01, ****P < 0.0001. geoMFI, geometric mean fluorescence intensity.
To study whether FAO is important for the AMPK-induced Treg-priming capacity of mDCs, we blocked mitochondrial import of long-chain fatty acids by silencing CPT1A (Fig. 3 I). CPT1A knockdown did not change uptake of Bodipy C16 and neutral lipid accumulation (Bodipy 493/503), nor did it restore the AMPK-induced inhibition of activation markers and IL-12p40 and IL-10 secretion (Fig. S4, D–F). However, silencing CPT1A decreased the AMPK-driven increase in RALDH activity in 991-stimulated mDCs in all donors (Fig. 3 J), as well as the suppressive capacity of T cells primed by these DCs (Fig. 3 K). Taken together, these data suggest that AMPK activation increases FAO, which promotes RALDH activity and thereby the tolerogenic capacities of moDCs.
AMPK activation drives FAO through mitochondrial fission
AMPK-induced FAO has been shown to be supported by changes in the mitochondrial fission/fusion balance (Song et al., 2021). We, therefore, evaluated mitochondrial morphology and questioned whether fission and fusion play a role in the AMPK-driven metabolic and immunological changes. We observed that in both iDCs and mDCs, AMPK activation induced fragmentation of mitochondria, indicative of increased fission (Fig. 4, A and B). Fusion can be promoted by AMPK through blocking recruitment of DRP1 to the mitochondria via phosphorylation of DRP1 (S637) (Li et al., 2015), while phosphorylation of mitochondrial fission factor (MFF) (S172), the receptor for DRP1, promotes fission (Toyama et al., 2016). 991 treatment did not induce phosphorylation of DRP1 (S637) and counteracted the LPS-induced increase of DRP1 phosphorylation, while it did promote phosphorylation of MFF (S172/S146) in mDCs (Fig. 4 C). Furthermore, expression of FIS1, a gene involved in mitochondrial fission, increased upon AMPK activation (Fig. S5 A), together providing further support for induction of mitochondrial fission following AMPK activation in moDCs.
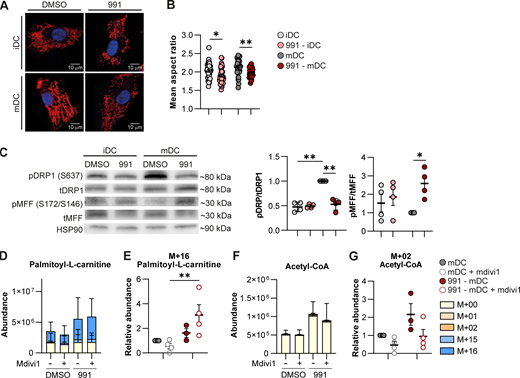
Mitochondrial fission induced by AMPK activation promotes FAO. (A) Confocal images of DMSO/991-treated iDCs and mDCs. Blue: nucleus. Red: mitochondria. (B) Quantification of the average aspect ratio of mitochondria per cell. (C) Western Blot of phosphorylated DRP1 (pDRP1), total DRP1 (tDRP1), phosphorylated MFF (pMFF), total MFF (tMFF), and HSP90 and the ratio for pDRP1/tDRP1 and pMFF/tMFF, normalized for HSP90 and relative to DMSO-treated mDCs. (D–G) [U-13C]-palmitate tracing was performed in DMSO/991-treated mDCs, with or without mdivi1. (D) Total abundance of palmitoyl-L-carnitine and (E) abundance of the labeled M+16 fraction of palmitoyl-L-carnitine normalized per donor and (F) total abundance of acetyl-CoA and (G) abundance of the labeled M+02 fraction of acetyl-CoA normalized per donor. Results are expressed as means ± SEM, with error bars representing SEM (B, C, E, and G) or means ± SD (D and F), with error bars representing SD. Data are pooled from seven donors from four independent experiments (B), four donors from two independent experiments (C), and four donors from one experiment (D–G). Statistical analyses were performed using repeated measures two-way ANOVA with Sidak’s post-hoc test. *P < 0.05, **P < 0.01. Source data are available for this figure: SourceData F4.
Mitochondrial fission induced by AMPK activation promotes FAO. (A) Confocal images of DMSO/991-treated iDCs and mDCs. Blue: nucleus. Red: mitochondria. (B) Quantification of the average aspect ratio of mitochondria per cell. (C) Western Blot of phosphorylated DRP1 (pDRP1), total DRP1 (tDRP1), phosphorylated MFF (pMFF), total MFF (tMFF), and HSP90 and the ratio for pDRP1/tDRP1 and pMFF/tMFF, normalized for HSP90 and relative to DMSO-treated mDCs. (D–G) [U-13C]-palmitate tracing was performed in DMSO/991-treated mDCs, with or without mdivi1. (D) Total abundance of palmitoyl-L-carnitine and (E) abundance of the labeled M+16 fraction of palmitoyl-L-carnitine normalized per donor and (F) total abundance of acetyl-CoA and (G) abundance of the labeled M+02 fraction of acetyl-CoA normalized per donor. Results are expressed as means ± SEM, with error bars representing SEM (B, C, E, and G) or means ± SD (D and F), with error bars representing SD. Data are pooled from seven donors from four independent experiments (B), four donors from two independent experiments (C), and four donors from one experiment (D–G). Statistical analyses were performed using repeated measures two-way ANOVA with Sidak’s post-hoc test. *P < 0.05, **P < 0.01. Source data are available for this figure: SourceData F4.

Effects of AMPK activation on mitochondrial fission. (A) Relative gene expression of genes regulating mitochondrial dynamics. (B) Real-time OCR as measured by Seahorse extracellular flux analysis. FCCP, fluoro-carbonyl cyanide phenylhydrazone. R+A, Rotenone + Antimycin A. (C) Confocal images of DMSO/991-treated mDCs with or without mdivi1 treatment. Blue: nucleus. Red: mitochondria. (D) Quantification of the average aspect ratio of mitochondria per cell. (E and F) (E) Normalized quantification of RALDH activity and (F) normalized percentage of proliferation of bystander T cells after a T cell suppression assay. (G and H) [U-13C]-glucose tracing was performed in DMSO/991-treated mDCs, with or without mdivi1. Figures show the total abundance of (labeled) metabolites involved in (G) glycolysis and (H) TCA cycle. G6P, fructose 1,6-biphosphate (F1,6BP), glycerol 3-phosphate (G3P), phosphoenolpyruvate (PEP), α-ketoglutarate (αKG). Results are expressed as means ± SEM, with error bars representing SEM (A, D, and E) or means ± SD, with error bars representing SD (F and G). Data are pooled from four donors from two independent experiments (A); representative of one out of two donors from one experiment (B); six donors from three independent experiments (D); five donors from three independent experiments (E); three donors from two independent experiments, (F); and four donors from one experiment (G and H). Statistical analyses were performed using repeated measures two-way ANOVA with Tukey post-hoc test (A, D–F, G, and H). *P < 0.05, **P < 0.01. geoMFI, geometric mean fluorescence intensity.
Effects of AMPK activation on mitochondrial fission. (A) Relative gene expression of genes regulating mitochondrial dynamics. (B) Real-time OCR as measured by Seahorse extracellular flux analysis. FCCP, fluoro-carbonyl cyanide phenylhydrazone. R+A, Rotenone + Antimycin A. (C) Confocal images of DMSO/991-treated mDCs with or without mdivi1 treatment. Blue: nucleus. Red: mitochondria. (D) Quantification of the average aspect ratio of mitochondria per cell. (E and F) (E) Normalized quantification of RALDH activity and (F) normalized percentage of proliferation of bystander T cells after a T cell suppression assay. (G and H) [U-13C]-glucose tracing was performed in DMSO/991-treated mDCs, with or without mdivi1. Figures show the total abundance of (labeled) metabolites involved in (G) glycolysis and (H) TCA cycle. G6P, fructose 1,6-biphosphate (F1,6BP), glycerol 3-phosphate (G3P), phosphoenolpyruvate (PEP), α-ketoglutarate (αKG). Results are expressed as means ± SEM, with error bars representing SEM (A, D, and E) or means ± SD, with error bars representing SD (F and G). Data are pooled from four donors from two independent experiments (A); representative of one out of two donors from one experiment (B); six donors from three independent experiments (D); five donors from three independent experiments (E); three donors from two independent experiments, (F); and four donors from one experiment (G and H). Statistical analyses were performed using repeated measures two-way ANOVA with Tukey post-hoc test (A, D–F, G, and H). *P < 0.05, **P < 0.01. geoMFI, geometric mean fluorescence intensity.
Next, we addressed whether AMPK-driven mitochondrial fission is required for FAO by inhibiting mitochondrial fission using mdivi1, an inhibitor of DRP1 (Cassidy-Stone et al., 2008). Of note, mdivi1 was also shown to inhibit complex I of the electron transport chain, but at the tested concentration in our model, mdivi1 solely affected mitochondrial morphology and not respiration (Fig. S5, B–D) (Bordt et al., 2017). [U-13C]-palmitate tracing in 991-stimulated mDCs in presence of mdivi1 revealed that inhibition of mitochondrial fission increased C16-labeled palmitoyl-L-carnitine abundance in 991-stimulated mDCs (Fig. 4, D and E), while the abundance of palmitate-derived carbon ending up in acetyl-CoA trended to be reduced (Fig. 4, F and G). Although the contribution of palmitate to acetyl-CoA is low, the combination of increased palmitoyl-L-carnitine and a trend toward lower total and labeled acetyl-CoA levels indicates lower palmitate oxidation. Together, this suggests that the AMPK-driven increase in palmitate oxidation is partly dependent on enhanced mitochondrial fission. Inhibition of mitochondrial fission did not affect tolerogenic properties of 991-stimulated mDCs (Fig. S5, E and F), which may indicate that residual FAO following mdivi1 treatment is sufficient to support tolerogenic properties of the AMPK-conditioned DCs. Altogether, these data indicate that AMPK activation induces mitochondrial fission to support enhanced FAO in DCs.
Glucose oxidation in mitochondria and pentose phosphate pathway (PPP) contribute to AMPK-induced tolerogenicity
The increased accumulation of acetyl-CoA upon AMPK activation could only partly be explained by increased oxidation of palmitate (Fig. 3 G). An important alternative carbon source for mitochondrial acetyl-CoA is glucose. To test whether increased glycolysis contributed to elevated levels of acetyl-CoA in 991-stimulated DCs, we performed [U-13C]-glucose tracing experiments. This revealed that AMPK activation induced a significant increase in flux of glucose-derived carbons into glucose-6-phosphate (G6P) and lactate, resulting in a threefold and twofold increase in total G6P and lactate levels, respectively (Fig. 5 A and Fig. S4 G), suggesting that AMPK activation enhances glucose uptake and glycolytic flux. AMPK activation also promoted pyruvate import into the mitochondria, as increased abundance of labeled carbons in acetyl-CoA was observed (Fig. 5 B and Fig. S4 H), which could account for the increased accumulation of acetyl-CoA in these cells. The increase in glucose-derived carbon flux into acetyl-CoA in response to 991 treatment and the corresponding increase in total acetyl-CoA abundance was still partly observed in (iso)citrate, but not in further downstream TCA cycle metabolites (Fig. 5 B and Fig. S4 H). Of note, in contrast to the AMPK-induced increase in FAO, glucose oxidation was not dependent on mitochondrial fission (Fig. S5, G and H). To address whether mitochondrial glucose catabolism is required for AMPK-induced tolerogenicity, we blocked mitochondrial pyruvate import using UK5099, an inhibitor for mitochondrial pyruvate carrier 1 (MPC1) (Halestrap, 1975). While MPC1 inhibition did not restore expression of activation markers or IL-12p40 and IL-10 secretion by 991-stimulated mDCs (Fig. S4, I and J), and had mixed effects on RALDH activity, it prevented the ability of these cells to promote functional Tregs (Fig. 5, C and D).

Glucose oxidation supports AMPK-induced tolerogenicity. (A, B, and E) [U-13C]-glucose tracing was performed in DMSO/991-treated mDCs. Figures show total abundance of (labeled) metabolites involved in (A) glycolysis, (B) TCA cycle, and (E) PPP. (C and F) Normalized quantification of RALDH activity. (D and G) Representative histograms and normalized percentage of proliferation of bystander T cells after a T cell suppression assay. G6P, fructose 1,6-biphosphate (F1,6BP), phosphoenolpyruvate (PEP), α-ketoglutarate (αKG), and Sep7P. Results are expressed as means ± SD. Error bars represent SD (A, B, and E). Data are pooled from four donors from one experiment (A, B, and E), eight donors from four independent experiments (C and D), and four donors from two experiments (F and G). Statistical analyses were performed using repeated measures two-way ANOVA with Sidak’s post-hoc test (C, D, F, and G) or paired t test (A, B, and E). *P < 0.05, ***P < 0.001. Colored * displays differences between different M+ groups. gMFI, geometric mean fluorescence intensity.
Glucose oxidation supports AMPK-induced tolerogenicity. (A, B, and E) [U-13C]-glucose tracing was performed in DMSO/991-treated mDCs. Figures show total abundance of (labeled) metabolites involved in (A) glycolysis, (B) TCA cycle, and (E) PPP. (C and F) Normalized quantification of RALDH activity. (D and G) Representative histograms and normalized percentage of proliferation of bystander T cells after a T cell suppression assay. G6P, fructose 1,6-biphosphate (F1,6BP), phosphoenolpyruvate (PEP), α-ketoglutarate (αKG), and Sep7P. Results are expressed as means ± SD. Error bars represent SD (A, B, and E). Data are pooled from four donors from one experiment (A, B, and E), eight donors from four independent experiments (C and D), and four donors from two experiments (F and G). Statistical analyses were performed using repeated measures two-way ANOVA with Sidak’s post-hoc test (C, D, F, and G) or paired t test (A, B, and E). *P < 0.05, ***P < 0.001. Colored * displays differences between different M+ groups. gMFI, geometric mean fluorescence intensity.
Our metabolomic analysis revealed that, in addition to glycerophospholipids, there was also an enrichment for PPP metabolites following AMPK activation in DCs (Fig. 2 B). This led us to hypothesize that apart from enhanced glucose oxidation in mitochondria, glucose may also be increasingly fueling the PPP in AMPK-activated DCs. Indeed, AMPK activation induced a significant accumulation of sedoheptulose 7-phosphate (Sep7P), an intermediate of the PPP (Fig. 5 E), of which, in contrast to the untreated control, a fraction was labeled with glucose-derived carbons, demonstrating increased glucose flux into the PPP. Finally, inhibition of the PPP with 6-aminonicotinamide in AMPK-activated mDCs tended to prevent induction of RALDH activity (Fig. 5 F), and, concordantly, to negate their ability to induce functional Tregs (Fig. 5 G). Altogether, our data suggest that in addition to FAO, AMPK activation promotes mitochondrial and PPP-mediated glucose oxidation, which also underpins the tolerogenic capacity of 991-stimulated moDCs.
Discussion
Catabolic metabolism has been a well-described feature of tolDCs (Møller et al., 2022; Patente et al., 2019). While AMPK functions as the central regulator of catabolic metabolism, little is known about the role of AMPK in driving DC tolerogenicity. Despite several reports showing a role for AMPK in dampening DC activation (Carroll et al., 2013; Krawczyk et al., 2010; Nieves et al., 2016), only recently a role for AMPK in promoting Treg cell responses was described, as it was shown that RA-induced tolDCs require AMPK to prime Tregs (Patente et al., 2023, Preprint). On the contrary, AMPK is also activated in vitamin D3 (vitD) induced tolDCs (Adamik et al., 2022), but is not required for tolerogenicity in this context (Ferreira et al., 2015; Patente et al., 2023, Preprint). Here, we show that direct activation of AMPK is sufficient to render DCs tolerogenic. Mechanistically, we demonstrate that this tolerogenic capacity is underpinned by enhanced RALDH activity and dependent on metabolic rewiring involving increased breakdown of glycerophospholipids, mitochondrial fission–dependent FAO, and elevated glucose oxidation.
Well-described mechanisms through which DCs induce Treg responses include IL-10 (Boks et al., 2012) or TGF-β secretion (Awasthi et al., 2007), indoleamine 2,3-dioxygenase (IDO) expression (Rodrigues et al., 2016), and RALDH activity (Mucida et al., 2007). Our data indicate that AMPK-induced tolDCs promote Treg priming through enhanced RALDH activity. RALDH is the rate-limiting enzyme catalyzing the conversion of vitamin A–derivative retinol to RA and its expression in intestinal (Coombes et al., 2007; Sun et al., 2007) and skin DCs (Weckel et al., 2023) is important to maintain immune tolerance. We observed that inhibition of RALDH activity during moDC–T cell co-culture, but not during moDC culture alone, reduced Treg induction, suggesting that RALDH-produced RA directly acts on T cells for Treg induction. Our work suggests that AMPK activation in DCs promotes their ability to selectively prime and/or expand a population of Tr1 cells expressing TIGIT. In other studies, TIGIT+ Tregs have been shown to be highly active and suppressive cells (Joller et al., 2014, 2024). We therefore hypothesize that 991-stimulated DCs exert their immunosuppressive effects via induction of TIGIT+Tr1 cells. Further studies are warranted to establish this.
Through an integrated proteomics and metabolomics analysis, we identified breakdown of glycerophospholipids as one of the main metabolic consequences of AMPK activation in DCs. Importantly, 991-stimulated mDCs in which this process was partly inhibited through downregulation of PNPLA6 and GPCPD1, were functionally less tolerogenic, demonstrating a role for glycerophospholipid breakdown in driving the tolerogenic capacity of these moDCs. Interestingly, degradation of phospholipids has previously been reported in VitD, dexamethansone (Dex), and VitD+Dex-induced tolDCs (Ferreira et al., 2012), although the functional relevance was not explored. We now show a key role for phospholipid breakdown in supporting the tolerogenic properties of DCs. Yet, how this process mechanistically underpins tolDC function remains to be addressed. Since we found the tolerogenic effects to be dependent on FAO as well, it is tempting to speculate that phospholipid catabolism supports tolDC function by means of generating free fatty acids for mitochondrial FAO. In addition, it is conceivable that lipid mediators derived from AMPK-induced phospholipid degradation may also exert tolerogenic effects through autocrine or paracrine mechanisms. For instance, phospholipid composition is dynamically regulated in immune cells and has been shown to govern immune cell activation through changes in membrane fluidity and production of soluble lipid mediators that mediate signal transduction and cell–cell communication (O’Donnell et al., 2018). Moreover, deregulation of phospholipid metabolism in tumor cells leads to the accumulation of anti-inflammatory lipid mediators that suppress the antitumor immune response (Saito et al., 2022). Further studies are warranted to explore whether these mechanisms also play a role in AMPK-activation-driven DC tolerogenicity.
In addition to a role for glycerophospholipid catabolism, we show that AMPK activation-induced tolerogenicity is underpinned by increased FAO. We find this increase to be dependent on mitochondrial fission, a functional connection that has been reported previously in HeLa cells and which we here extend to DCs (Song et al., 2021). AMPK phosphorylates multiple proteins involved in mitochondrial dynamics and the observed specific increase in AMPK-mediated phosphorylation of MFF-S172/S146 suggests that AMPK activation in moDCs results in phosphorylation of fission-promoting targets, thereby inducing mitochondrial fragmentation (Trefts and Shaw, 2021). Despite the observation that blocking FAO through CPT1A silencing compromises AMPK-induced tolerogenicity, we found that lowering FAO to baseline levels through inhibition of mitochondrial fission was not sufficient to prevent Treg induction. This indicates that the remaining levels of FAO, possibly together with elevated glucose catabolism, are sufficient to support the tolerogenic effect induced by AMPK activation. Our findings are largely consistent with earlier work showing that tolDCs induced by a combination of VitD and Dex display increased FAO, which was found to contribute to suppression of early T cell activation (Malinarich et al., 2015). Moreover, tumor-associated murine DCs harbor FAO-dependent immunosuppressive capacities. Tumor-derived Wnt3a induces IDO expression and lowers IL-6 and IL-12 secretion via FAO (Zhao et al., 2018), and BMDCs treated with tumor-derived vesicles showed immune dysfunction in a PPAR-α and FAO-dependent manner (Yin et al., 2020). However, in other DC subsets, FAO has also been documented to support pro-inflammatory functions, as plasmacytoid DC activation upon stimulation of endosomal toll-like-receptors was found to rely on FAO (Basit and de Vries, 2019; Qiu et al., 2019; Wu et al., 2016), highlighting that the nature of the role of FAO in supporting DC function is likely DC subset dependent.
While these studies support a role for FAO in DC tolerogenicity, little is known about the mechanisms downstream of FAO that contribute to expression of anti-inflammatory genes and other immune-suppressive mediators. Our data indicate that FAO mediates increased RALDH activity upon AMPK activation, although how exactly increased FAO supports RALDH activity remains unexplored. Supplementation of butyrate to moDCs is known to promote RALDH partly through inhibition of histone deacetylases (HDACs) (Kaisar et al., 2017). Since AMPK can inhibit HDACs through direct phosphorylation (Mihaylova et al., 2011), and given that FAO-derived β-hydroxybutyrate, similar to butyrate, can inhibit HDACs (Shimazu et al., 2013), it is tempting to speculate that the AMPK-induced increase in FAO together with the direct phosphorylation of the protein may contribute to HDAC inhibition and subsequent promotion of RALDH activity.
Alongside FAO, AMPK activation increased glucose oxidation as revealed by enhanced glucose-derived carbon flux into acetyl-CoA. Blocking mitochondrial pyruvate import prevented the ability of 991-stimulated moDCs to prime functional Tregs, indicating an important role for glucose-derived mitochondrial metabolites in inducing immune suppression. Increased glycolysis was also observed in DCs rendered tolerogenic by VitD alone (Ferreira et al., 2015; Vanherwegen et al., 2019), VitD and Dex (Adamik et al., 2022), or by nuclear receptor corepressor 1 (nCoR1) ablation (Sen et al., 2023). While initial reports suggested that glucose availability and glycolysis, but not glucose oxidation, are essential for VitD-induced tolDCs (Ferreira et al., 2015), more recent studies also indicated an essential role for glucose oxidation in VitD-induced tolerogenicity (Vanherwegen et al., 2019). This is different from nCoR1-deficient DCs, in which MPC1 inhibition further increased tolerogenicity (Sen et al., 2023), indicating that mitochondrial glucose oxidation may serve different roles depending on how DCs are rendered tolerogenic. In our study, we observed reduced tolerogenicity upon MPC1 inhibition, but why this is the case remains to be addressed. The relatively large contribution of glucose-derived carbons to acetyl-CoA compared with downstream TCA cycle intermediates upon AMPK activation may point toward a role for acetyl-CoA distinct from fueling the TCA cycle in supporting AMPK-activation driven DC tolerogenicity. Acetyl-CoA can also be used for histone acetylation and in other myeloid cells, such as IL-4 polarized macrophages, acetyl-CoA accumulation fueled by glucose-derived carbons was found to be required for gene-specific histone modifications that induce M2 activation (Covarrubias et al., 2016). Moreover, it was recently found in T cells that glucose-derived pyruvate can be converted into acetyl-CoA in the nucleus by nuclear pyruvate dehydrogenase to alter epigenetic marks (Mocholi et al., 2023). As our tracing experiments cannot differentiate between subcellular pools of acetyl-CoA, it would be worth exploring whether this is also occurring in DCs and whether the accumulation of acetyl-CoA, potentially in combination with FAO-driven effects on HDAC activity, impacts epigenetic modifications in these tolerogenic DCs and thereby their function.
Finally, we found that AMPK activation in DCs also promoted glucose flux into the PPP and that AMPK activation–induced tolerogenicity is dependent on this flux. Increased PPP activity in DCs has previously been shown to support proinflammatory murine DC activation by promoting anabolic fatty acid synthesis through NADPH synthesis (Everts et al., 2014), but has never been linked to tolerogenic DC activity. We currently can only hypothesize about how the PPP contributes to DC tolerogenicity, but given that the PPP also plays a key in maintaining redox balance, through NADPH-dependent glutathione synthesis, and that high ROS production or reduced anti-oxidant activity has been shown to increase proinflammatory function of DCs (Mogilenko et al., 2019; Romero et al., 2019; Yeang et al., 2012), it is conceivable that the PPP may contribute to AMPK activation–induced tolerogenicity of DCs by buffering the pro-inflammatory effects of ROS.
Overall, based on our data, we propose a model in which AMPK activation promotes RALDH activity and rewiring of lipid and glucose metabolism to render DC tolerogenic. Currently, little is known about AMPK activation in DCs in situ, but there is some evidence that suggests this pathway is activated and may be functionally relevant in physiological tolerance, promoting environments like the intestine (Patente et al., 2023, Preprint), or in pathological immunosuppressive conditions such as the tumor microenvironment (Arner and Rathmell, 2023). Specifically, in the former setting, tolerogenic CD103+CD11b+ DCs in the murine small intestine have been shown to exhibit high AMPK activity and high RALDH activity, and AMPK deficiency in these CD11c+ cells induced a switch from a tolerogenic toward a more immunogenic phenotype. AMPK activation in tumor-associated DCs has, to our knowledge, not been directly quantified. However, since elevated AMPK levels have been observed in other tumor-infiltrating immune cells (An et al., 2021; Trillo-Tinoco et al., 2019) and phosphorylation of AMPK activator LKB1 has been reported in tumor-infiltrating DCs (Wang et al., 2019), it is likely that the tumor microenvironment is also a setting with increased AMPK activation in DCs. Further studies are required to determine whether AMPK signaling or downstream pathways are relevant for DC tolerogenicity in these immunosuppressive environments. Finally, unraveling the metabolic underpinnings behind DC tolerogenicity may also provide new insights into how DC-based therapies could be improved. There have been several clinical trials in which the use of ex vivo–generated monocyte-derived tolDCs has been evaluated for the treatment of autoimmune diseases, Crohn’s disease, or to prevent transplant rejection (Mohammadi et al., 2023; Ness et al., 2021; Passeri et al., 2021), unfortunately thus far with variable success rates. Therefore, our work does not only provide new fundamental insights into the metabolic underpinnings of DC-driven tolerogenic responses but also provides a rationale to explore AMPK as a potential actionable target for the generation of durable monocyte-derived tolDCs for clinical purposes.
Materials and methods
moDC culture and stimulation
Monocytes were purified from buffy coats of healthy donors (Sanquin), through peripheral blood mononuclear cell isolation by Ficoll density gradient centrifugation and magnetic separation using CD14 MicroBeads (130-050-201; Miltenyi Biotec), according to manufacturer’s protocol. Monocytes were cultured in complete RPMI (RPMI-1640; 42401-042; Gibco) with 10% FCS (Greiner Bio-one), 100 U/ml penicillin (Eureco-Pharma), 100 μg/ml streptomycin (S9137; Sigma-Aldrich), and 2 mM L-glutamine (G8540; Sigma-Aldrich) supplemented with 10 ng/ml human rGM-CSF (PHC2013; Gibco) and 0.86 ng/ml human rIL4 (204-IL; R&D Systems) to induce moDC differentiation. On day 2/3, medium was refreshed and new cytokines were added. On day 5, moDCs were harvested and replated and if indicated treated with 25 or 100 µM 991 (129739-36-2; Spirochem), 10 µm Mdivi1 (M0199; Sigma-Aldrich), 10 nM VitD (D1530; Sigma-Aldrich), 45 µm bisdiamine (WIN 18446, 4736/50; Bio-techne), 50 µm UK-5099 (PZ0160; Sigma-Aldrich) or DMSO (102931; Merck Millipore). On day 6, moDCs were stimulated with 100 ng/ml ultrapure LPS (E. coli 0111 B4 strain; InvivoGen) or left untreated. On day 7, moDCs were harvested and used for further experiments, including analysis of activation markers by flow cytometry and IL-12(p70) and IL-10 secretion by ELISA (555183 and 555157; BD Biosciences). For this, supernatant of moDCs was collected before harvesting moDCs at day 7, or after a 24 h co-culture with CD40L-expressing J558 cells.
T cell polarization
moDCs were cultured with allogeneic naïve CD4+ T cells in complete RPMI, supplemented with staphylococcal enterotoxin B (10 pg/ml). On days 6 and 8, 10 U/ml human rIL-2 (202-IL; R&D Systems) was added to expand the T cells. On day 11, cells were harvested and replated for cytokine analysis. Intracellular cytokine production was analyzed using flow cytometry after 4 h of polyclonal restimulation with 100 ng/ml phorbol myristate acetate (PMA, P8139; Sigma-Aldrich) and 1 µg/ml ionomycin (I0634; Sigma-Aldrich) in the presence of 10 µg/ml Brefeldin A (B7651; Sigma-Aldrich). IL-10 secretion was determined by ELISA in supernatants harvested after a 24-h restimulation with anti-CD3 (555336; BD Biosciences) and anti-CD28 (555725; BD Biosciences).
T cell suppression assay
moDCs were cultured with allogenic naïve CD4+ T cells in a 1:10 ratio in complete IMDM (IMDM [BE12-722F; Lonza] with 100 U/ml penicillin, 100 μg/ml streptomycin, 2 mM L-glutamine, and 1 mM pyruvate [P5280; Sigma-Aldrich]). On day 7, T cells (test T cells) were harvested, stained with 1 μM Cell Trace Violet (C34557; Thermo Fisher Scientific), irradiated (3000 RAD) or, where indicated, left unirradiated, and co-cultured with autologous carboxyfluorescein succinimidyl ester (C34554; Thermo Fisher Scientific)–stained CD4+ memory T cells (bystander T cells) in a 2:1 ratio in the presence of LPS matured moDCs. After 6 days, cells were harvested and proliferation of bystander T cells was measured using flow cytometry. Irradiation of test T cells was performed to arrest them in their cell cycle to allow for a better direct assessment of the ability of these T cells to suppress the proliferation of bystander T cells by immune-mediated mechanisms.
Flow cytometry
In general, cells were stained with a viability dye (Zombie NIR Fixable Viability Kit, #423106; BioLegend or LIVE/DEAD Fixable Aqua, #L34957; Thermo Fisher Scientific) for 20 min at RT before fixation with 1.85% formaldehyde (F1635; Sigma-Aldrich). For assessment of phosphorylated proteins, cells were fixed in 4% ultrapure formaldehyde (#18814-20; Polysciences) for 10 min at 37°C directly after cell culture, and for Treg characterization, cells were fixed with FoxP3/Transcription factor staining buffer set (00-5523-00; Invitrogen) for 1 h at 4°C. Metabolic dyes and T cell proliferation were measured in live cells. Extracellular proteins were stained for 30 min at 4°C in FACS buffer (PBS [220/12257974/1110; Braun], supplemented with 0.5% BSA [10735086001; Roche] and 2 mM EDTA [15575-038; Thermo Fisher Scientific]). For intracellular protein and cytokine detection, cells were permeabilized for 20 min at 4°C in permeabilization buffer (#00-8333-56; Thermo Fisher Scientific), before staining for 30 min at 4°C in a permeabilization buffer. Prior to staining with antibodies against phosphorylated proteins, cells were also permeabilized in 96% methanol (67-56-1; Fisher chemical) for 20 min at −20°C. Cells were stained with metabolic dyes as previously described (Brombacher et al., 2023). Briefly, live cells were incubated with BODIPY FL C16 (D3821; Thermo Fisher Scientific), BODIPY 493/503 (D3922; Thermo Fisher Scientific), tetramethylrhodamine methyl ester (T668; Thermo Fisher Scientific), or MitoTracker Green FM (M7514; Thermo Fisher Scientific) in PBS for 15 min at 37°C before measurement. Aldefluor kit (01700; Stemcell Technologies) was used for assessing RALDH activity, according to the manufacturer’s protocol. Briefly, cells were stained for 30 min at 37°C with 1 µM of Aldefluor reagent dissolved in assay buffer. Cells were kept in assay buffer until measurement. Samples were acquired on FACSCanto II or Cytek Aurora 3-laser spectral flow cytometer and analyzed using FlowJo (Version 10.6; TreeStar). Antibody information is provided in Table 1.
Antibodies’ flow cytometry
| Target | Clone | Conjugate | Source | Identifier |
|---|---|---|---|---|
| CD103 | Ber-ACT8 | PE-Cy7 | BioLegend | 350211 |
| CD127 | HIL-7R-M21 | APC-R700 | BD Biosciences | 565185 |
| CD14 | M5E2 | BV510 | BioLegend | 301842 |
| CD1a | HI149 | BV421 | BioLegend | 300128 |
| CD25 | M-A251 | APC-Cy7 | BD Pharmingen | 557753 |
| CD3 | UCHT1 | AF700 | BioLegend | 300423 |
| CD4 | SK3 | PerCP-ef710 | Invitrogen | 46-0047-42 |
| CD40 | 5C3 | APC | BD Pharmingen | 555591 |
| CD49b | P1E6-Cd5 | PE-Cy7 | BioLegend | 359313 |
| CD80 | 2D10 | PE-Cy5 | BioLegend | 305209 |
| CD83 | HB15e | PE | eBioscience | 12-0839-42 |
| CD86 | 2331 (FUN-1) | FITC | BD Pharmingen | 555657 |
| CD152 (CTLA4) | BNI3 | PE-Cy5 | BD Pharmingen | 555854 |
| CD284 (TLR4) | HTA125 | Alexa Fluor 488 | eBioscience | 59-9917-42 |
| CD197 (CCR7) | 3D12 | Pe-C7 | BD Pharmingen | 557648 |
| FoxP3 | PCH101 | APC | Invitorgen | 17-4776-42 |
| Goat anti-Rabbit | Polyclonal | AF647 | Invitrogen | A21244 |
| HLA-DR | L243 | APC-Cy7 | BioLegend | 307618 |
| ICOS | C398.4A | FITC | BioLegend | 313505 |
| IDO | Eyedio | PE | Invitrogen | 12-9477-41 |
| IFNγ | B27 | V450 | BD Biosciences | 560371 |
| IL-10 | JES3-19F1 | APC | BioLegend | 506807 |
| IL-4 | 8D4-8 | PE-Cy7 | eBioscience | 25-7049-82 |
| ILT3 | ZM3.8 | BV480 | BD Optibuild | 746718 |
| LAG-3 | 11C3C65 | BV605 | BioLegend | 369323 |
| PD-L1 | MIH3 | PE-Cy7 | BioLegend | 374506 |
| PD-L2 | MIH18 | FITC | Milteny Biotec | 130-098-528 |
| Phopho-S6 (S240) | N4-41 | - | BD Biosciences | 560430 |
| Phospho-ACC (Ser79) | D7D11 | - | Cell Signaling | 11818S |
| TIGIT | A15153G | BV711 | BioLegend | 372741 |
siRNA transfection
On day 4 of the moDC differentiation, cells were harvested and transfected with 20 nM non-targeting siRNA (D-001206-13-05; Dharmacon), or siRNAs targeting CPT1a (M-009749-02; Dharmacon), PNPLA6 (s21441; Thermo Fisher Scientific), or GPCPD1 (L-013836-01-0005; Dharmacon). Electroporation was performed with the Neon Transfection System (Invitrogen) using one pulse (1,600 V, 20 ms). After electroporation, cells were overnight cultured without antibiotics and polarizing cytokines in RPMI with 10% FCS and 2 mM L-glutamine. The next morning fresh medium containing antibiotics, IL-4, and GM-CSF was added to the cells.
Metabolomics data and analysis
Metabolites were extracted from 5 × 10⁵ moDCs. Cells were washed with 75 mM ammonium carbonate (A9516; Sigma-Aldrich) in HPLC-grade water (15651400; Honeywell) at 37°C, before metabolite extraction for 3 min in 600 µl 70% ethanol at 70°C. Samples were centrifuged at 14,000 rpm for 10 min at 4°C and supernatants were shipped to General Metabolics for analysis as previously described (Fuhrer et al., 2011). Briefly, polar metabolites were analyzed on a non-targeted metabolomics platform in negative ion mode. 886 unique ions were identified, of which 632 were annotated according to the human Kyoto Encyclopedia of Genes and Genomes (KEGG) database. Data filtering based on interquartile range, log transformation, and normalization (mean-centered and divided by the standard deviation) was done using Metaboanalyst (https://www.metaboanalyst.ca), as was further analysis including pathway enrichment and differential expression analysis.
Proteomics data and analysis
Proteins were extracted from 1 × 10⁶ moDCs after cells were washed in PBS and snap-frozen in liquid nitrogen. Cell lysis, digestion, and tandem mass tag (TMT) labeling were performed as previously described (Paulo and Gygi, 2017). Cells were lysed using a 5% SDS lysis buffer (100 mM Tris-HCl pH 7.6) and were incubated at 95°C for 4 min. Protein determination was performed using Pierce BCA Gold protein assay (Thermo Fisher Scientific). 100 µg protein of each sample was reduced, alkylated, and excess iodoacetamide was quenched with 5 mM tris(2-carboxyethyl)phosphine, 15 mM iodoacetamide, and 10 mM DTT, respectively. Protein was retrieved using chloroform/methanol precipitation and resulting pellets were resolubilized in 40 mM HEPES pH 8.4. Tosyl phenylalanyl chloromethyl ketone-treated trypsin (1:12.5 enzyme/protein ratio) was added to digest protein overnight at 37°C. Pierce BCA Gold protein assay was used to determine the peptide concentration. The peptides were labeled with TMTpro Label Reagents (Thermo Fisher Scientific) in a 1:4 ratio by mass (peptides/TMT reagents) for 1 h at RT. 5 µl 6% hydroxylamine was added to quench excess TMT reagent and incubated for 15 min at RT. Samples were pooled and lyophilized. The sample was subsequently fractionated on an Agilent 1200 series HPLC system (Agilent Technologies). 60 µg of the pooled peptide sample was dissolved in solvent A (10 mM NH4HCO3 pH 8.4), injected onto and eluted from an Agilent Eclipse Plus C18 2.1 × 150-mm, 3.5-μm column (Agilent Technologies). The gradient was run from 2 to 90% solvent B (10 mM NH4HCO3 pH 8.4, final concentration 20/80 water/acetonitrile vol/vol) in 30 min at a flowrate of 200 µl/min. 12 fractions were made; every 3 s, a fraction was collected in a vial before going to the next vial. After reaching the last vial, collection was continued in the first vial. Afterward, the samples were lyophilized.
Mass spectrometry (MS)
The lyophilized fractions were dissolved in water/formic acid (100/0.1 vol/vol) and subsequently analyzed twice by on-line C18 nanoHPLC MS/MS with a system consisting of an Easy nLC 1200 gradient HPLC system (Thermo Fisher Scientific) and a LUMOS mass spectrometer (Thermo Fisher Scientific). Samples were injected onto a homemade precolumn (100 μm × 15 mm; Reprosil-Pur C18-AQ 3 μm, Dr. Maisch) and eluted via a homemade analytical nano-HPLC column (30 cm × 50 μm; Reprosil-Pur C18-AQ 3 μm). The gradient was run from 5 to 30% solvent B (20/80/0.1 water/acetonitrile/formic acid vol/vol) in 240 min. The nano-HPLC column was drawn to a tip of ∼10 μm and acted as the electrospray needle of the MS source. The mass spectrometer was operated in data-dependent MS/MS mode (SPS-MS3 method) for a cycle time of 2.5 s, with an higher-energy collisional dissociation (HCD) collision energy at 36 V and recording of the MS2 spectrum in the orbitrap, with a quadrupole isolation width of 0.7 Da. In the master scan (MS1), the resolution was 120,000, and the scan range was 400–1,600 at standard AGC target “standard.” A lock mass correction on the background ion m/z = 445.12 was used. Precursors were dynamically excluded after n = 1 with an exclusion duration of 45 s and with a precursor range of 20 ppm. Charge states 2–6 were included. MS2 (CID) was performed in the ion trap at 35%, with automatic gain control (AGC) target “standard” and mass range “normal.” Synchronous precursor selection in MS3 was “true” at an HCD collision energy of 55% and detection in the orbitrap at a resolution of 50,000, at an AGC target of 300% with a scan range of m/z 100–500. In a post-analysis process, raw data were first converted to peak lists using Proteome Discoverer version 2.5 (Thermo Electron) and submitted to the Uniprot database (Homo sapiens, 20,596 entries) using Mascot v. 2.2.07 (https://www.matrixscience.com) for protein identification. Mascot searches were with 10 ppm and 0.5 Da deviation for precursor and fragment mass, respectively. Enzyme specificity was set to trypsin. Up to three missed cleavages were allowed. Methionine oxidation and acetyl on the protein N-terminus were set as variable modifications. Carbamidomethyl on Cys and TMTpro on Lys and N-terminus were set as fixed modifications. Protein false discovery rate (FDR) of 1% was set. Normalization was on total peptide amount.
8,325 proteins were identified, of which 3,462 were used for further processing after filtering based on high protein confidence and at least five unique peptides per protein. Pathway enrichment was performed using Metascape and enriched gene ontology (GO) pathways were considered significant if FDR ≤ 0.05 (Zhou et al., 2019). Integration of metabolomics and proteomics data was performed using Shiny Gam (Sergushichev et al., 2016).
13C-tracer experiments
On day 7, 20 h after LPS stimulation, moDCs were harvested, counted, and 5 × 10⁵ cells were replated in 350 µl in complete glucose-free RPMI (11879020; Thermo Fisher Scientific) supplemented with 100 U/ml penicillin, 100 μg/ml streptomycin, and 25 mM HEPES (9136; Sigma-Aldrich). Additionally, 350 µl complete glucose-free RPMI was added, supplemented with either 22 mM [U-13C]-Glucose (CLM-1396-PK; Cambridge Isotope Laboratories) and 0.027 mM 12C-Palmitate (76119; Merck Millipore) or 22 mM 12C-Glucose (15023021; Gibco) and 0.027 mM [U-13C]-Palmitate (CLM-409-PK; Cambridge Isotope Laboraties) to reach an end concentration of 11 mM glucose and 0.014 mM palmitate. Palmitate was in-house conjugated to BSA in a 2:1 ratio. Cells were cultured for 4 h at 37°C before metabolites were extracted. Cells were washed in ice-cold PBS before extraction in lysis buffer (40% acetonitrile [34967; Honeywell] and 40% methanol in HPLC-grade water). Samples were vortexed three times for 3 s and centrifuged at 4°C for 15 min at full speed. Supernatant was stored at −80°C. Metabolites were analyzed by liquid chromatography-MS–based metabolomics as previously described (Zaal et al., 2017). Briefly, metabolite identification was based on exact mass (5 ppm range), validated by concordance with retention times of standards and peak areas were in their respective linear range of detection. TraceFinder Software (Thermo Fisher Scientific) was used for quantification. Peak intensities were normalized based on mean peak intensity, and isotopomer distributions were corrected for natural abundance.
qPCR
RNA was extracted from snap-frozen moDCs as previously described (Patente et al., 2023, Preprint). cDNA synthesis was performed using M-MLV Reverse Transcriptase (28025013; Thermo Fisher Scientific) and qPCR was performed with the Gotaq qPCR master mix (A6001; Promega) and the CFX96 Touch Real-Time PCR Detection System (Biorad). Primers are listed in Table 2.
Primers
| Target | Forward | Reverse |
|---|---|---|
| PNPLA6 | 5′-TGACCCGCCTTATCCACCTA-3′ | 5′-CCAGAGCCTGCTGGGAAG-3′ |
| GPCPD | 5′-ACAAAGGCTGCACCATGACT-3′ | 5′-CCATCGAGGTGCAGGAAACT-3′ |
| CPT1A | 5′-GCGCACTACAAGGACATGGGCA-3′ | 5′-CACCATGGCCCGCACGAAGT-3′ |
| MFN1 | 5′-AGCGGCTTTCCAAGCCTAAT-3′ | 5′-CTGTCTGCGTACGTCTTCCA-3′ |
| DRP1 | 5′-AAACTTCGGAGCTATGCGGT-3′ | 5′-AGGACGAGGACCAGTAGCAT-3′ |
| FIS1 | 5′-AGGCCTTAAAGTACGTCCGC-3′ | 5′-TGCCCACGAGTCCATCTTTC-3′ |
Confocal microscopy
On day 5 of moDC differentiation, cells were plated in glass bottom confocal dishes (627871; Greiner) and coated for 2 h with poly-D-lysine (PDL) at 37°C. Treatments were performed as described earlier and cells were analyzed on day 7. 10 min prior to imaging nuclei were stained with 50 ng/ml Hoechst 33342 (H3570; Thermo Fisher Scientific) and mitochondria with 10 nM Cy5-methyl-methyl (Cy5M2) (Winkel et al., 2019). Cells were imaged directly using the 40× objective on a SP8X WLL (white light laser) microscope (Leica Microsystems) with climate control at 37°C, 5% CO2. Mitochondrial quantification was done in ImageJ using the MitoAnalyzer Marco as previously described (Chaudhry et al., 2020).
Seahorse extracellular flux analysis
Mitochondria oxygen consumption rate (OCR) was analyzed using a XFe96 extracellular flux analyzer (Seahorse Bioscience). moDCs were plated in seahorse cell culture plates coated with PDL at 37°C for 1 h, in unbuffered, glucose-free RPMI, supplemented with 5% FCS and 2 mM L-glutamine, and incubated for 1 h at 37°C in a CO2 free incubator. OCR was measured in response to 10 mM glucose (G8644; Sigma-Aldrich), 1 µM oligomycin (11342; Cayman Chemical), 3 µM fluoro-carbonyl cyanide phenylhydrazone (C2920; Sigma-Aldrich), and 1 µM rotenone (R8875; Sigma-Aldrich) + 1 µM antimycin A (A8674; Sigma-Aldrich).
Western blot
moDCs were washed in PBS, snap-frozen in liquid nitrogen, and lysed with EBSB buffer (8% glycerol [7044; J.T. Baker], 3% SDS [151-21-3; VWR Life Science], and 100 mM Tris-HCl [pH 6.8] [1.00317; Supelco; 77-86-1; Thermo Fisher Scientific]) for detection of complexes of the electron transport chain or lysed with radioimmunoprecipitation assay–like buffer (50 mmol/L HEPES [pH 7.6], 50 mmol/L Natrium fluoride [S7920; Sigma-Aldrich], 50 mmol/L potassium chloride [7447407; Merck Millipore], 5 mmol/L sodium pyrophosphate decahydrate [13472-36-1; Sigma-Aldrich], 1 mmol/L EDTA [E5134; Sigma-Aldrich], 1 mmol/L EGTA [E3889; Sigma-Aldrich], 1 mmol/L dithiothreitol [V315A; Promega], 5 mmol/L β-glycerophosphate [G6376; Sigma-Aldrich], 1 mmol/L sodium orthovanadate [S6508; Sigma-Aldrich], 1% NP40 [74385; Sigma-Aldrich], and protease inhibitor cocktail [11697498001; Roche]). Lysates were boiled for 5 min (except lysates used for detection of electron transport chain complexes) and protein content was determined using a BCA kit (23225; Thermo Fisher Scientific). Proteins were separated by SDS-PAGE and transferred to a 45-µm polyvinylideenfluoride membrane. Membranes were blocked for 1 h at RT in TTBS buffer (20 mM Tris-HCl [pH 7.6], 137 mM NaCl [1.06404.1000; Merck Millipore], and 0.25% Tween [8.22184.0500; Merck Millipore]) containing 5% fat-free milk (Campina). Membranes were incubated with primary antibodies overnight at 4°C, washed in TTBS buffer, incubated with horseradish peroxidase–conjugated secondary antibodies for 2 h at RT, washed again, and developed using enhanced chemiluminescence. Primary antibodies were HSP90 (#sc7947; Santa Cruz), DRP1 (5391T; Cell Signaling), phospho-DRP1 (Ser637) (4867S; Cell Signaling), MFF (84580T; Cell Signaling), phospho-MFF (Ser172, Ser146) (PA5-104614; Thermo Fisher Scientific), and total Oxphos antibody cocktail (ab110413; Abcam).
Western blots were quantified using ImageJ software (National Institutes of Health), and phosphorylation status was normalized to the total abundance of the target protein and a housekeeping protein.
Statistical analysis
Results are expressed as mean ± standard error mean (SEM) except where stated otherwise. Data were analyzed using GraphPad Prism. Comparisons between two or more independent data groups were made by Student’s t test or analysis of variance test (ANOVA), respectively. Data distribution was assumed to be normal but this was not formally tested. Details of statistical tests are provided in the figure legends. P < 0.05 was considered statistically significant.
Online supplemental material
The article contains five supplemental figures. Fig. S1 shows a dose-response of 991 on AMPK signaling, the effect of irradiation on the viability of T cells, the comparison of 991 with AICAR and vitamin D, the inhibition of LPS-induced expression of activation markers, and the gating strategy and cytokine data for identification of Tregs. Fig. S2 shows the raw data from Fig. 1 and the effects of RALDH inhibitor on surface markers and cytokine secretion of DCs, as well as their ability to induce Tregs. Fig. S3 shows the proteomics and metabolomics data of 991-treated DCs with and without LPS stimulation and the effect of silencing of two proteins involved in breakdown of glycerophospholipids, namely PNPLA6 and GPCPD1 on DCs. Fig. S4 shows the effect of 991 on mitochondrial fitness, lipid uptake, and neutral lipid content; the effect of 991 on CPT1a-silenced cells and MPC1-inhibited DCs, and the quantification of TCA intermediates. Fig. S5 shows the expression of MFN1, DRP1, and FIS1 combined with the effect of 991 on mdivi1-treated DCs, and tracing of 13C-glucose in TCA intermediates in mdivi1-treated DCs.
Data availability
The data underlying Figs. 1–5 are available in the published article and its online supplemental material. The proteomics data underlying Fig. 2, A–E and Fig. S3, A–E have been deposited to the ProteomeXchange Consortium via PRIDE repositorywith the dataset identifier PXD053979. The metabolomics data underlying Fig. 2, A–E and Fig. S3, A–E are openly available on Zenodo at https://zenodo.org/records/13253596 and will be available in MetaboLights.
Acknowledgments
This work was supported by a Leids Universitair Medisch Centrum fellowship and Exacte en Natuurwetenschappen-M grant (project#: OCENW.M.21.057) awarded to B. Everts. The funders had no role in study design, data collection and analysis, decision to publish, or preparation of the manuscript.
Author contributions: E.C. Brombacher: Conceptualization, Data curation, Formal analysis, Investigation, Methodology, Project administration, Resources, Validation, Visualization, Writing—original draft, Writing—review & editing, T.A. Patente: Formal analysis, Investigation, Writing—original draft, Writing—review & editing, A.J. van der Ham: Investigation, Project administration, Resources, T.J.A. Moll: Investigation, F. Otto: Investigation, Resources, F.W.M. Verheijen: Formal analysis, Investigation, Methodology, Writing—review & editing, E.A. Zaal: Investigation, Writing—review & editing, A.H. de Ru: Resources, R.T.N. Tjokrodirijo: Investigation, C.R. Berkers: Resources, Supervision, Writing—review & editing, P.A. van Veelen: Funding acquisition, Investigation, Project administration, Supervision, Writing—review & editing, B. Guigas: Supervision, Writing—review & editing, B. Everts: Conceptualization, Funding acquisition, Methodology, Project administration, Supervision, Writing—review & editing.

