


PTEN is a crucial negative regulator of the INS/PI3K/AKT pathway and is one of the most commonly mutated tumor suppressors in cancer. Global overexpression (OE) of PTEN in mice shifts metabolism to favor oxidative phosphorylation over glycolysis, reduces fat mass, and extends the lifespan of both sexes. We demonstrate that PTEN regulates chaperone-mediated autophagy (CMA). Using cultured cells and mouse models, we show that PTEN OE enhances CMA, dependent upon PTEN’s lipid phosphatase activity and AKT inactivation. Reciprocally, PTEN knockdown reduces CMA, which can be rescued by inhibiting class I PI3K or AKT. Both PTEN and CMA are negative regulators of glycolysis and lipid droplet formation. We show that suppression of glycolysis and lipid droplet formation downstream of PTEN OE depends on CMA activity. Finally, we show that PTEN protein levels are sensitive to CMA and that PTEN accumulates in lysosomes with elevated CMA. Collectively, these data suggest that CMA is both an effector and a regulator of PTEN.
Introduction
PTEN is a non-redundant lipid phosphatase whose primary function is the negative regulation of the INS/PI3K/AKT pathway (Maehama and Dixon, 1999). Downstream of the activation of INSR, class I PI3Ks phosphorylate the phosphatidyl inositol (PI) lipid second messenger PI(4,5)P2, producing PI(3,4,5)P3. AKT, PDPK1, and the MAPKAP1 component of MTOR complex 2 (MTORC2) all contain pleckstrin homology domains, which bind to PI(3,4,5)P3. This causes the recruitment of AKT, PDPK1, and MTORC2 to the cytosolic face of the plasma membrane, where their close proximity allows both PDPK1 and MTORC2 to phosphorylate AKT, leading to the complete activation of AKT’s kinase activity (Bayascas et al., 2008; Liu et al., 2015). Through the phosphorylation of its substrates, AKT regulates several fundamental cellular processes, including growth, survival, glucose uptake, and metabolism (Sugiyama et al., 2019). PTEN converts PI(3,4,5)P3 to PI(4,5)P2, preventing further activation of AKT (Myers et al., 1998; Maehama and Dixon, 1998). The protein abundance of PTEN affects the rate of PI(3,4,5)P3 conversion to PI(4,5)P2, in turn regulating the duration of AKT activation (Mukherjee et al., 2021).
Excessive activation of the INS/PI3K/AKT pathway drives cancer growth and survival and also promotes the pathogenesis of type II diabetes (Leahy, 2005). PTEN is one of the most commonly mutated tumor suppressor genes in cancer (Luongo et al., 2019). Inherited mutations in PTEN lead to a category of diseases collectively known as PTEN hamartoma tumor syndromes, which predispose patients to a spectrum of pathologies, including autism, development of benign skin hamartomas, and an elevated risk of malignant transformation in multiple organs (Pilarski, 2019).
Global overexpression (OE) of PTEN is sufficient to extend the lifespan of both male and female mice (Ortega-Molina et al., 2012). PTEN OE exerts anti-neoplastic effects (Garcia-Cao et al., 2012), and PTEN OE mice show other signs of slowed aging and increased healthspan, such as improved brown adipose function, reduced DNA damage, and increased tightrope success rates in 18–24 mo-old animals (Ortega-Molina et al., 2012). PTEN OE mice have reduced fasting insulin and lower fasting blood glucose levels (Ortega-Molina et al., 2012). On a normal diet, PTEN OE mice have reduced body weight (caused by reduced adiposity) and consume more food per day (relative to body size) than their WT littermates (Ortega-Molina et al., 2012). When fed a high-fat diet, WT animals become unresponsive to insulin and develop fatty liver disease, but PTEN OE mice maintain insulin sensitivity and liver health (Ortega-Molina et al., 2012).
PTEN OE mice show some overlapping phenotypes with other mouse stocks with reduced INS/PI3K/AKT pathway activity. Mice with genetic ablation of GH production, such as the hypopituitary pou1f1 mutant (Snell dwarf) or ablation of GHR, such as the ghr KO mouse, are dwarfs with reduced circulating IGF1 levels, low rates of lethal cancer, altered carbohydrate metabolism, increased insulin sensitivity, and significantly extended lifespans (Coschigano et al., 2003; Flurkey et al., 2001; Anisimov and Bartke, 2013). Our recent work found that Snell dwarf and ghr KO mice have elevated chaperone-mediated autophagy (CMA; Endicott et al., 2020a).
CMA is the most selective form of lysosomal proteolysis, where proteins bearing consensus motifs are individually selected for lysosomal degradation (Cuervo et al., 1997; Dice, 1990; Cuervo and Dice, 1996). The CMA consensus motif resembles a sequence of Lys-Phe-Glu-Arg-Gln (KFERQ), which is recognized by the cytosolic chaperone HSPA8 (Hsc70; Agarraberes and Dice, 2001; Chiang et al., 1989; Dice, 1990). The KFERQ-bearing target is trafficked to the lysosomal surface, where it is unfolded and translocated across the lysosomal membrane, independent of vesicle fusion, in a process dependent upon LAMP2A (Cuervo and Dice, 1996; Agarraberes and Dice, 2001; Bandyopadhyay et al., 2008).
CMA degrades proteins that are damaged or present in excess, maintaining proteostasis with aging (Schneider et al., 2015). In addition to its role in maintaining a “clean” proteome, CMA regulates the abundance of proteins whose overaccumulation contributes to age-related diseases, including Parkinson’s disease, Alzheimer’s disease, fatty liver disease, cancer, inflammation, and atherosclerosis (Cuervo and Dice, 2000; Schneider et al., 2014; Gomes et al., 2017; Qiao et al., 2021; Kaushik and Cuervo, 2018). Our own work has shown that long-lived mutant mice with elevated CMA have decreased abundance of several CMA-sensitive proteins, which have been previously implicated in regulating cancer, metabolism, and lifespan, including MYC, ACLY, and ACSS2 (Endicott et al., 2020a, 2021; Hofmann et al., 2015).
Mice with a liver-specific pten deletion and mice with a liver-specific deletion of CMA receptor lamp2a show remarkably similar phenotypes, i.e., spontaneous development of fatty liver disease, reductions in peripheral adiposity, and a shift in liver energy production favoring glycolysis over oxidative phosphorylation (Stiles et al., 2004; Schneider et al., 2014). We and others have reported that CMA is negatively regulated by the INS/PI3K/AKT signaling pathway (Arias et al., 2015; Endicott et al., 2020b). We have also shown that clinically safe inhibitors of class I PI3K activate CMA in mice (Endicott et al., 2020b; Endicott et al., 2020a). Based on our previous findings that CMA is negatively regulated by the INS/PI3K pathway and the findings that liver-specific deletions of pten and lamp2a give highly overlapping phenotypes, we hypothesized that (1) PTEN, as an inhibitor of INS/PI3K, is a CMA activator and (2) the metabolic changes downstream of PTEN OE require CMA activation.
Our results now show that overexpression of PTEN potently activates CMA and reduces the abundance of CMA-sensitive proteins, dependent on PTEN’s lipid phosphatase activity and AKT inactivation, in both AML12 hepatocytes and NIH3T3 cells. Reciprocally, the knockdown of PTEN in AML12 cells leads to a reduction in CMA, and an increase in the abundance of CMA-sensitive proteins, which can be rescued by inhibiting either class I PI3K or AKT. PTEN protein levels are known to decrease when the INS/PI3K pathway is inhibited (Mukherjee et al., 2021), and our results show that PTEN is itself a CMA substrate and that both lysosomal proteolysis and CMA receptor LAMP2A are necessary to reduce PTEN when the INS/PI3K pathway is inhibited. Using PTEN OE mice, and mice with liver-specific Pten deletion, we found that PTEN expression levels affect lysosome-localized AKT, MTOR, and the CMA regulator GFAP. Finally, using cell culture models for PTEN OE, we show that CMA is required for the reduction in glycolysis and lipid droplet synthesis that occurs downstream of PTEN OE. These findings support a model where the beneficial metabolic changes caused by reducing INS/PI3K/AKT signaling are caused by an enhancement of CMA activity.
Results
PTEN positively regulates CMA, dependent on its lipid phosphatase activity
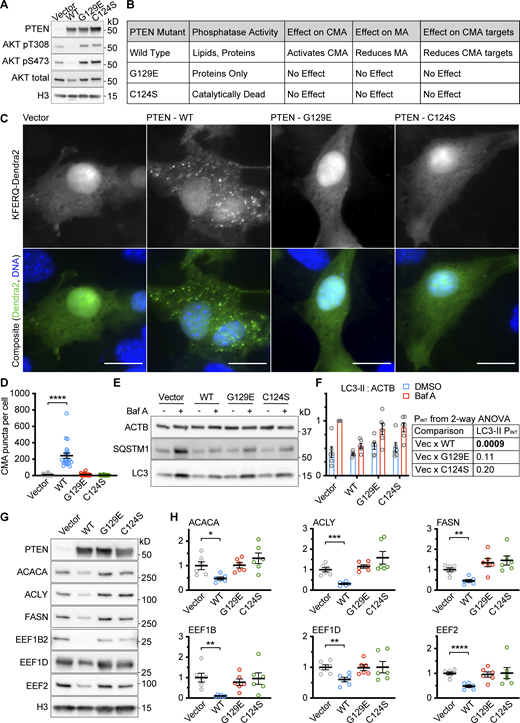
We hypothesized that, as an endogenous antagonist of the INS/PI3K pathway, PTEN is an activator of CMA, dependent on PI(3,4,5)P3 signaling. To test this hypothesis, we obtained a lentiviral expression vector for WT PTEN (PTENWT), and we generated two point mutants, one that retains tyrosine phosphatase, but not lipid phosphatase activity (PTENG129E), and one that is catalytically dead (PTENC124S), as previously described (Myers et al., 1998; Furnari et al., 1998). As a control, we verified that overexpression of PTENWT, but not PTENG129E or PTENC124S, was sufficient to reduce AKT phosphorylation in AML12 cells (normal mouse hepatocytes; Fig. 1, A–C). The PTENG129E mutant caused a 19% increase in phosphorylation of AKT S473 but did not significantly change pT308. The PTENC124S mutant caused significant increases in the phosphorylation of both AKT sites (Fig. 1, B and C), consistent with previous reports that the PTENC124S mutant is a dominant negative (Wu et al., 1998). We tested the PTEN constructs for their effects on CMA in AML12 cells, as detected by a fluorescent photo-switchable CMA reporter (Endicott et al., 2020b; Koga et al., 2011; Fig. 1, D and E). For these experiments and subsequent experiments, the cells were ∼90% confluent at the time of the fixation for microscopy, unless otherwise indicated. Only PTENWT was able to activate CMA, suggesting that the PI(3,4,5)P3 phosphatase activity of PTEN is required for PTEN to activate CMA. Macroautophagy (MA), as measured by LC3 and SQSTM1 flux, was not altered by any of the PTEN constructs (Fig. 1, F and G). Our recent lysosomal targetomics work in ghr KO mice, which have enhanced hepatic CMA, showed that some proteins involved in fatty acid synthesis from acetyl-coA and some proteins involved in translation elongation are CMA sensitive and decrease when CMA is enhanced (Endicott et al., 2021). We measured the abundance of three proteins involved in fatty acid synthesis from acetyl-coA (ACLY, ACACA, and FASN) and three proteins involved in translation elongation (EEF1B2, EEF1D, and EEF2) in AML12 hepatocytes overexpressing PTENWT, PTENG129E, or PTENC124S. Only PTENWT was able to decrease the abundance of the CMA-sensitive proteins (Fig. 1, H and I), consistent with the results from the fluorescent CMA reporter.
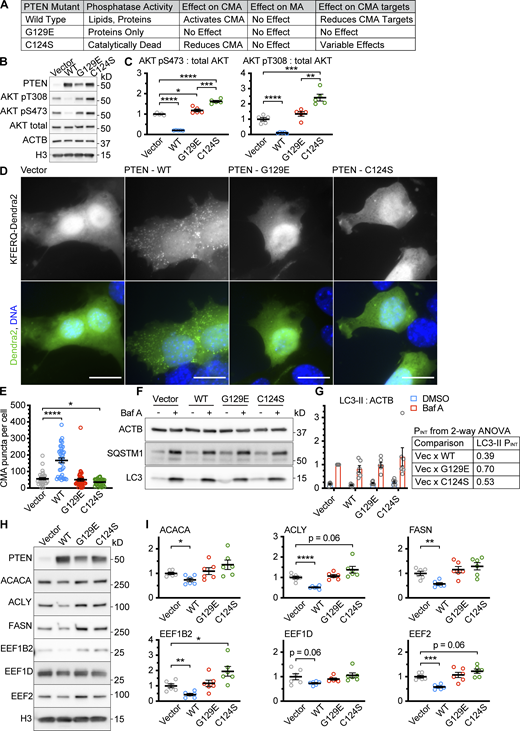
PTEN overexpression activates CMA, dependent upon its lipid phosphatase activity. AML12 hepatocytes were transduced with a pHAGE lentiviral vector containing either an empty multiple cloning site, PTENWT; PTENG129E which retains protein tyrosine phosphatase activity, but not lipid phosphatase activity; or PTENC124S, which is catalytically dead. (A) Summary table of results for this figure. (B) Western blots showing effects of PTEN overexpression on AKT phosphorylation. (C) Quantification of blots shown in B; n = 5 for each group. (D) Fluorescent microscopy images of AML12 cells expressing a KFERQ-Dendra2 CMA reporter transduced with control and PTEN vectors. (E) Quantification of D showing that only PTENWT caused an accumulation of CMA puncta. Data points are individual cells, pooled from at least three replicates, n = 30, 37, 39, 36 (for EV, WT, G129E, and C124S, respectively). (F) Western blots showing macroautophagic flux assays for each of the PTEN constructs. (G) Quantification of LC3-II levels in F, adjusted to ACTB loading control, showing that none of the PTEN constructs have an effect on macroautophagic flux in AML12 cells; n = 6 for each group. The P values shown are interaction term P values from a two-way ANOVA, testing if the effect of BafA is modified by each PTEN construct. (H) Western blots of CMA-sensitive proteins ACACA, ACLY, FASN, EEF1B2, EEF1D, and EEF2, in AML12 cells treated with an empty vector, or vectors expressing the different PTEN constructs. (I) Quantifications of proteins shown in H, adjusted by H3 loading control; n = 6 for each group. PTENWT causes a reduction in the protein abundance of CMA-sensitive proteins, but PTENG129E and PTENC124S do not. In some cases, there is a trend toward an increase in CMA-sensitive proteins for PTENC124S, consistent with previous studies suggesting that this mutant can have dominant negative effects. Scale bars are 20 μM. On all graphs, the solid bar shows the mean. Error bars are SEM. P values shown on graphs for Western blots are from two-tailed unpaired t tests. P values shown on graphs for CMA reporter puncta are from Kolmogorov–Smirnov tests. P values shown in G are interaction terms from two-way ANOVAs. *P < 0.05, **P < 0.01, ***P < 0.001, ****P < 0.0001. Source data are available for this figure: SourceData F1.
PTEN overexpression activates CMA, dependent upon its lipid phosphatase activity. AML12 hepatocytes were transduced with a pHAGE lentiviral vector containing either an empty multiple cloning site, PTENWT; PTENG129E which retains protein tyrosine phosphatase activity, but not lipid phosphatase activity; or PTENC124S, which is catalytically dead. (A) Summary table of results for this figure. (B) Western blots showing effects of PTEN overexpression on AKT phosphorylation. (C) Quantification of blots shown in B; n = 5 for each group. (D) Fluorescent microscopy images of AML12 cells expressing a KFERQ-Dendra2 CMA reporter transduced with control and PTEN vectors. (E) Quantification of D showing that only PTENWT caused an accumulation of CMA puncta. Data points are individual cells, pooled from at least three replicates, n = 30, 37, 39, 36 (for EV, WT, G129E, and C124S, respectively). (F) Western blots showing macroautophagic flux assays for each of the PTEN constructs. (G) Quantification of LC3-II levels in F, adjusted to ACTB loading control, showing that none of the PTEN constructs have an effect on macroautophagic flux in AML12 cells; n = 6 for each group. The P values shown are interaction term P values from a two-way ANOVA, testing if the effect of BafA is modified by each PTEN construct. (H) Western blots of CMA-sensitive proteins ACACA, ACLY, FASN, EEF1B2, EEF1D, and EEF2, in AML12 cells treated with an empty vector, or vectors expressing the different PTEN constructs. (I) Quantifications of proteins shown in H, adjusted by H3 loading control; n = 6 for each group. PTENWT causes a reduction in the protein abundance of CMA-sensitive proteins, but PTENG129E and PTENC124S do not. In some cases, there is a trend toward an increase in CMA-sensitive proteins for PTENC124S, consistent with previous studies suggesting that this mutant can have dominant negative effects. Scale bars are 20 μM. On all graphs, the solid bar shows the mean. Error bars are SEM. P values shown on graphs for Western blots are from two-tailed unpaired t tests. P values shown on graphs for CMA reporter puncta are from Kolmogorov–Smirnov tests. P values shown in G are interaction terms from two-way ANOVAs. *P < 0.05, **P < 0.01, ***P < 0.001, ****P < 0.0001. Source data are available for this figure: SourceData F1.
Similar experiments in NIH3T3 cells gave highly similar results, showing that PTENWT, but not PTENG129E or PTENC124S, could reduce AKT phosphorylation, activate CMA, and reduce the abundance of CMA-sensitive proteins (Fig. S1, A–D, G, and H), suggesting that the effects of PTEN on CMA are not cell-type specific. The PTEN constructs had complex effects on macroautophagy in NIH3T3 cells (Fig. S1, E and F), so the effects of PTEN on MA are cell-type specific.
Data supportingFig. 1 —the effects of PTEN on CMA are reproducible in an additional cell type. NIH3T3 cells were transduced with a pHAGE lentiviral vector containing either an empty multiple cloning site, PTENWT, PTENG129E or PTENC124S. (A) Western blots showing effects of PTEN overexpression on AKT phosphorylation. (B) Summary table of results for this figure. (C) Fluorescent microscopy images of NIH3T3 cells expressing a KFERQ-Dendra2 CMA reporter transduced with control and PTEN vectors. (D) Quantification of C, showing only PTENWT caused an accumulation of CMA puncta. Data points are individual cells, pooled from at least three replicates, n = 34, 22, 42, 45 (for EV, WT, G129E, and C124S, respectively). (E) Western blots showing macroautophagic flux assays for each of the PTEN constructs. (F) Quantification of LC3-II levels in E, adjusted to ACTB loading control; n = 6 for each group. PINT displayed to the right of the graph is the interaction term from a two-way ANOVA showing whether or not the effects of Bafilomycin are modified by each PTEN construct. PTENWT, but not the other PTEN constructs reduce macroautophagic flux in NIH3T3 cells. (G) Western blots of CMA sensitive proteins ACACA, ACLY, FASN, EEF1B2, EEF1D, and EEF2, in NIH3T3 cells treated with an empty vector, or vectors expressing the different PTEN constructs. (H) Quantifications of proteins shown in G, adjusted by H3 loading control; n = 6 for each group. PTENWT causes a reduction in the protein abundance of CMA-sensitive proteins, but PTENG129E and PTENC124S do not. In some cases, there is a trend toward an increase in CMA sensitive proteins for PTENC124S consistent with previous studies suggesting that this mutant can have dominant negative effects. Scale bars are 20 μM. On all graphs, the solid bar shows the mean. Error bars are SEM. P values shown on graphs for Western blots are from two-tailed unpaired t tests. P values shown on graphs for CMA reporter puncta are from Kolmogorov–Smirnov tests. *P < 0.05, **P < 0.01, ***P < 0.001, ****P < 0.0001. Source data are available for this figure: SourceData FS1.
Data supportingFig. 1 —the effects of PTEN on CMA are reproducible in an additional cell type. NIH3T3 cells were transduced with a pHAGE lentiviral vector containing either an empty multiple cloning site, PTENWT, PTENG129E or PTENC124S. (A) Western blots showing effects of PTEN overexpression on AKT phosphorylation. (B) Summary table of results for this figure. (C) Fluorescent microscopy images of NIH3T3 cells expressing a KFERQ-Dendra2 CMA reporter transduced with control and PTEN vectors. (D) Quantification of C, showing only PTENWT caused an accumulation of CMA puncta. Data points are individual cells, pooled from at least three replicates, n = 34, 22, 42, 45 (for EV, WT, G129E, and C124S, respectively). (E) Western blots showing macroautophagic flux assays for each of the PTEN constructs. (F) Quantification of LC3-II levels in E, adjusted to ACTB loading control; n = 6 for each group. PINT displayed to the right of the graph is the interaction term from a two-way ANOVA showing whether or not the effects of Bafilomycin are modified by each PTEN construct. PTENWT, but not the other PTEN constructs reduce macroautophagic flux in NIH3T3 cells. (G) Western blots of CMA sensitive proteins ACACA, ACLY, FASN, EEF1B2, EEF1D, and EEF2, in NIH3T3 cells treated with an empty vector, or vectors expressing the different PTEN constructs. (H) Quantifications of proteins shown in G, adjusted by H3 loading control; n = 6 for each group. PTENWT causes a reduction in the protein abundance of CMA-sensitive proteins, but PTENG129E and PTENC124S do not. In some cases, there is a trend toward an increase in CMA sensitive proteins for PTENC124S consistent with previous studies suggesting that this mutant can have dominant negative effects. Scale bars are 20 μM. On all graphs, the solid bar shows the mean. Error bars are SEM. P values shown on graphs for Western blots are from two-tailed unpaired t tests. P values shown on graphs for CMA reporter puncta are from Kolmogorov–Smirnov tests. *P < 0.05, **P < 0.01, ***P < 0.001, ****P < 0.0001. Source data are available for this figure: SourceData FS1.
To verify that the effects of PTENWT on the decreased abundance of ACLY, ACACA, FASN, EEF1B2, EEF1D, and EEF2 were dependent on lysosomal proteolysis, AML12 hepatocytes overexpressing PTEN were treated with the lysosomal protease inhibitors leupeptin and ammonium chloride. As expected, the protein levels of ACLY, ACACA, FASN, and EEF1B2 were rescued by leupeptin/ammonium chloride. EEF1D and EEF2 showed similar effects that did not reach statistical significance (Fig. S2, A and B). We next verified whether CMA per se is required to decrease the abundance of ACLY, ACACA, FASN, EEF1B2, EEF1D, and EEF2 in response to PTENWT overexpression. AML12 cells were transfected with either a negative control siRNA, siRNA targeting Lamp2a (rate-limiting component of CMA), or siRNA targeting Tsg101 (essential for endosomal microautophagy), before transduction with lentivirus for PTEN OE. Knockdown of Lamp2a, but not Tsg101, rescued the protein levels of ACLY, ACACA, FASN, EEF1B2, and EEF2. EEF1D showed a similar trend, but this did not reach statistical significance (Fig. S2, C and D). These results suggest that the selected proteins are, for the most part, appropriately chosen biomarkers of CMA activity.
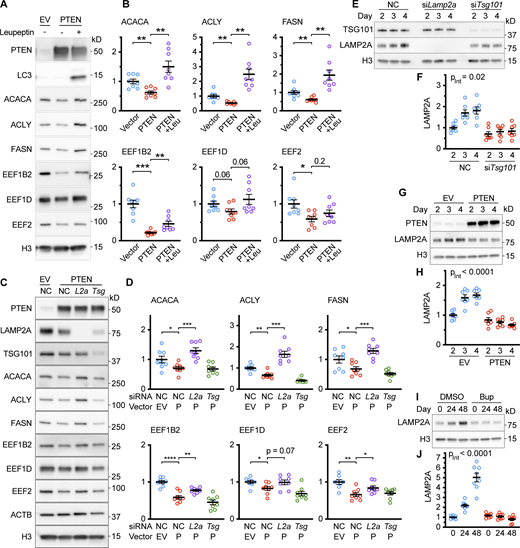
Data supportingFig. 1 —the effects of PTEN on CMA-sensitive proteins are rescued by inhibiting lysosomal proteolysis or by knocking down Lamp2a. (A) Western blots of lysates from AML12 hepatocytes were transduced with either an empty lentiviral vector or one encoding PTEN, and then lysosomal proteolysis was inhibited with 100 μM leupeptin and 20 mM ammonium chloride. CMA-sensitive proteins ACACA, ACLY, FASN, EEF1B2, EEF1D, and EEF2 were assessed for changes. (B) Quantification of blots in A, adjusted to H3 loading control; n = 8 for each group. (C) Western blots of lysates from AML12 hepatocytes that were chemically transfected with negative control siRNA or siRNA targeting Lamp2a or Tsg101 and then transduced with either an empty lentiviral vector or one encoding PTEN. (D) Quantifications of protein levels from C, adjusted to H3 loading control; n = 8 for each group. (E) Western blots of lysates from AML12 hepatocytes that were chemically transfected at ∼50% confluence with negative control siRNA or siRNA targeting Lamp2a or Tsg101, and then harvested at day 2, 3, or 4 after transfection. (F) Quantification of LAMP2A blot in E, adjusted to H3 loading control; n = 7 for each group. (G) Western blots of lysates from AML12 hepatocytes were transduced at ∼50% confluence with either an empty lentiviral vector or one encoding PTEN and then harvested at day 2, 3, or 4 after transfection. (H) Quantification of LAMP2A blot from G, adjusted to H3 loading control. (I) Western blots of lysates from AML12 hepatocytes were treated with 5 μM buparlisib at 50% confluence and harvested at time points of 0, 24, and 48 h. (J) Quantification of LAMP2A blot from I, adjusted to H3 loading control; n = 8 for each group. Bars on graphs show the mean. Error bars are SEM. P values shown on graphs in B and D are from two-tailed unpaired t tests. “PInt” shown in F, H, and J is the interaction term P value from a “full model” two-way ANOVA. *P < 0.05, **P < 0.01, ***P < 0.001, ****P < 0.0001. Source data are available for this figure: SourceData FS2.
Data supportingFig. 1 —the effects of PTEN on CMA-sensitive proteins are rescued by inhibiting lysosomal proteolysis or by knocking down Lamp2a. (A) Western blots of lysates from AML12 hepatocytes were transduced with either an empty lentiviral vector or one encoding PTEN, and then lysosomal proteolysis was inhibited with 100 μM leupeptin and 20 mM ammonium chloride. CMA-sensitive proteins ACACA, ACLY, FASN, EEF1B2, EEF1D, and EEF2 were assessed for changes. (B) Quantification of blots in A, adjusted to H3 loading control; n = 8 for each group. (C) Western blots of lysates from AML12 hepatocytes that were chemically transfected with negative control siRNA or siRNA targeting Lamp2a or Tsg101 and then transduced with either an empty lentiviral vector or one encoding PTEN. (D) Quantifications of protein levels from C, adjusted to H3 loading control; n = 8 for each group. (E) Western blots of lysates from AML12 hepatocytes that were chemically transfected at ∼50% confluence with negative control siRNA or siRNA targeting Lamp2a or Tsg101, and then harvested at day 2, 3, or 4 after transfection. (F) Quantification of LAMP2A blot in E, adjusted to H3 loading control; n = 7 for each group. (G) Western blots of lysates from AML12 hepatocytes were transduced at ∼50% confluence with either an empty lentiviral vector or one encoding PTEN and then harvested at day 2, 3, or 4 after transfection. (H) Quantification of LAMP2A blot from G, adjusted to H3 loading control. (I) Western blots of lysates from AML12 hepatocytes were treated with 5 μM buparlisib at 50% confluence and harvested at time points of 0, 24, and 48 h. (J) Quantification of LAMP2A blot from I, adjusted to H3 loading control; n = 8 for each group. Bars on graphs show the mean. Error bars are SEM. P values shown on graphs in B and D are from two-tailed unpaired t tests. “PInt” shown in F, H, and J is the interaction term P value from a “full model” two-way ANOVA. *P < 0.05, **P < 0.01, ***P < 0.001, ****P < 0.0001. Source data are available for this figure: SourceData FS2.
LAMP2A levels and CMA activity increase with the confluence in AML12 cells
We noticed that AML12 cells treated with siRNA against Tsg101 and cells overexpressing PTEN appeared to have less LAMP2A than the negative control cells. LAMP2A is essential for CMA and a decrease in LAMP2A under CMA activating conditions is unexpected. To further characterize the relationship between TSG101 and LAMP2A, we conducted a time course to examine changes in LAMP2A levels in cells depleted of Tsg101. AML12 cells were transfected with either siTsg101 or negative control siRNA at 50% confluence. Cells were harvested 2, 3, or 4 d after treatment with siRNA. We found that LAMP2A levels increased over time in the negative control cells, but this time-dependent increase was significantly less in cells treated with siTsg101 (two-way ANOVA interaction term P value = 0.02; Fig. S2, E and F). We also noticed that PTEN OE affected LAMP2A protein levels and we hypothesized that PTEN OE might cause a similar time-dependent effect on LAMP2A protein levels.
We performed a similar time course after transfecting AML12 cells at ∼50% confluence with an empty viral vector control or a vector encoding PTENWT. Cells were harvested 2, 3, or 4 d after treatment with the viral vectors. Once again, the protein levels of LAMP2A increased over time in the negative control cells. However, the protein levels of LAMP2A did not significantly change with time in the cells overexpressing PTEN. A two-way ANOVA revealed a highly significant interaction (interaction term P value <0.0001) of the effects of time and PTEN OE on the levels of LAMP2A (Fig. S2, G and H).
Early studies of CMA found that CMA-dependent proteolysis increased with confluence (Finn et al., 2005). We hypothesized that the increase in LAMP2A levels with time might correlate with increasing cell density. We also hypothesized that CMA activity would increase with increasing cell density in the AML12 cell line. Using the fluorescent KFERQ-Dendra2 CMA reporter, we observed that the baseline CMA activity in AML12 cells increases with the confluence of the cells. Cells at 50% confluence have low CMA, which is substantially increased in cells at 90% or 100% confluence (Fig. S3, A and B). We measured the abundance of PTEN and the phosphorylation of AKT in AML12 cells at 50, 90, and 100% confluence, and found that PTEN levels also increase with increasing confluence (Fig. S3, C and D). At 100% confluence, AKT phosphorylation at S473 and T308 was substantially reduced compared with cells at 50% confluence (Fig. S3, E and F). However, the reduction in AKT phosphorylation between cells at 50 and 90% confluence did not reach statistical significance. LAMP2A also increased significantly with increasing confluence, but HSPA8 levels remained unchanged (Fig. S3, G and H).
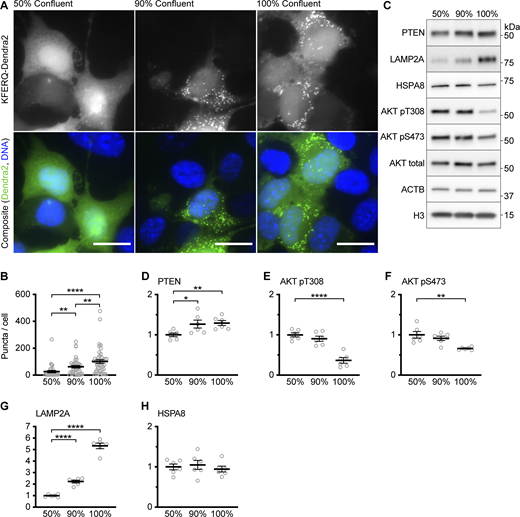
Data supportingFig. 2 —CMA activity and PTEN levels increase with the confluence in AML12 cells. (A) Fluorescent microscopy images of AML12 cells expressing a KFERQ-Dendra2 CMA reporter that were plated on glass coverslips and grown to the indicated confluence before being fixed for microscopy. (B) Quantification of puncta from the experiment shown in A, showing increasing CMA activity with increased confluence. Data points are individual cells, pooled from at least three replicates, n = 34, 39, 48 (for 50, 90, and 100% confluence, respectively). (C) Western blots of lysates from AML12 cells grown to the indicated confluence. For D–H, n = 6 for each group. (D) Quantification of PTEN protein levels, adjusted to the H3 loading control, showing increased PTEN in more confluent cells. (E and F) Quantification of AKT pT308 and AKT pS473, respectively. Both are adjusted to total AKT as a loading control. (G) Quantification of LAMP2A protein levels, adjusted to the H3 loading control, showing increased LAMP2A in more confluent cells. (H) Quantification of HSPA8 protein levels, adjusted to the H3 loading control, showing that HSPA8 is unchanged with confluence. Scale bars are 20 μM. On all graphs, the solid bar shows the mean. Error bars are SEM. P values shown on graphs for Western blots are from two-tailed unpaired t tests. P values shown in B are from Kolmogorov–Smirnov tests. *P < 0.05, **P < 0.01, ***P < 0.001, ****P < 0.0001. Source data are available for this figure: SourceData FS3.
Data supportingFig. 2 —CMA activity and PTEN levels increase with the confluence in AML12 cells. (A) Fluorescent microscopy images of AML12 cells expressing a KFERQ-Dendra2 CMA reporter that were plated on glass coverslips and grown to the indicated confluence before being fixed for microscopy. (B) Quantification of puncta from the experiment shown in A, showing increasing CMA activity with increased confluence. Data points are individual cells, pooled from at least three replicates, n = 34, 39, 48 (for 50, 90, and 100% confluence, respectively). (C) Western blots of lysates from AML12 cells grown to the indicated confluence. For D–H, n = 6 for each group. (D) Quantification of PTEN protein levels, adjusted to the H3 loading control, showing increased PTEN in more confluent cells. (E and F) Quantification of AKT pT308 and AKT pS473, respectively. Both are adjusted to total AKT as a loading control. (G) Quantification of LAMP2A protein levels, adjusted to the H3 loading control, showing increased LAMP2A in more confluent cells. (H) Quantification of HSPA8 protein levels, adjusted to the H3 loading control, showing that HSPA8 is unchanged with confluence. Scale bars are 20 μM. On all graphs, the solid bar shows the mean. Error bars are SEM. P values shown on graphs for Western blots are from two-tailed unpaired t tests. P values shown in B are from Kolmogorov–Smirnov tests. *P < 0.05, **P < 0.01, ***P < 0.001, ****P < 0.0001. Source data are available for this figure: SourceData FS3.
Taken together, these data suggest that in AML12 cells, LAMP2A levels and CMA both increase with increasing cell density. Knockdown of Tsg101 or PTEN OE prevents the cell-density-dependent increase in LAMP2A, without inhibiting CMA. This suggests that CMA regulation is more nuanced than simply regulating total cellular levels of LAMP2A.
PTEN depletion reduces CMA in AML12 cells
To determine if PTEN is necessary for CMA activation in confluent AML12 cells, we used siRNA to knock down the endogenous Pten mRNA in cells expressing the KFERQ-Dendra2 CMA reporter and then grew the cells to 100% confluence. We found that cells depleted of PTEN had reduced CMA compared with cells treated with a non-targeting negative control siRNA (Fig. 2, A and B). We hypothesized that PTEN’s lipid phosphatase activity, rather than its transcriptional role or protein phosphatase activity, is responsible for the reduction in CMA when PTEN is depleted. To mimic the effects of PTEN’s lipid phosphatase activity in AML12 cells depleted of PTEN, we treated the cells with 5 μM buparlisib, a class I PI3K inhibitor that prevents the production of PI(3,4,5)P3. We previously showed that buparlisib is able to enhance CMA in cultured mouse cells and the livers of mice receiving the drug by oral gavage (Endicott et al., 2020b). Indeed, the reduction in CMA caused by Pten siRNA was entirely rescued by treatment with buparlisib (Fig. 2, A and B). Copanlisib, an inhibitor of class I PI3K with a different chemical structure than buparlisib, gave highly similar results (Fig. S4, A and B), suggesting that the observed effects of buparlisib and copanlisib on CMA are not due to off-target inhibition of other kinases by either drug. We measured the phosphorylation of AKT pT308 as a control for the effects of pten knockdown and buparlisib administration, as shown in Fig. 2 C.
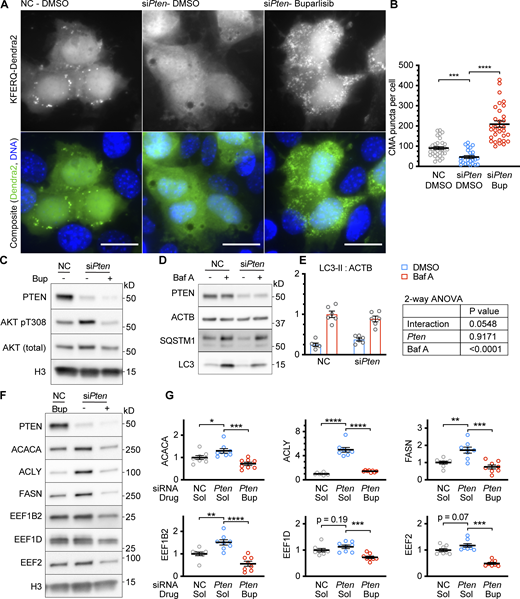
Knockdown of PTEN reduces CMA in confluent AML12 cells. (A) Fluorescent microscopy images of AML12 cells expressing a KFERQ-Dendra2 CMA reporter that were chemically transfected with the indicated siRNAs, and then treated with 5 μM buparlisib (Bup) or DMSO solvent control. (B) Quantifications of CMA puncta from A, showing that puncta were reduced by siPten and rescued by buparlisib treatment. Data points are individual cells, pooled from at least three replicates, n = 33, 25, 32 (for NC.DMSO, siPten.DMSO, siPten.Bup, respectively). (C) Western blots of lysates from AML12 cells that were treated as described in A and B, showing that siPten increased AKT pT308, which was rescued by buparlisib, as expected. (D) Western blots of a macroautophagic flux analysis for the effects of siPten. (E) Quantification of Westerns in D, showing a nearly significant reduction in macroautophagic flux as a result of siPten treatment; n = 6 for each group. (F) Western blots showing the effects of siPten and buparlisib rescue on CMA-sensitive proteins. (G) Quantification of blots, as shown in F, adjusted to H3 loading control; n = 8 for each group. Scale bars are 20 μM. On all graphs, the solid bar shows the mean. Error bars are SEM. P values shown on graphs for Western blots are from two-tailed unpaired t tests. P values shown on graphs for CMA reporter puncta are from Kolmogorov–Smirnov tests. P values shown in E are interaction terms from two-way ANOVAs. *P < 0.05, **P < 0.01, ***P < 0.001, ****P < 0.0001. Source data are available for this figure: SourceData F2.
Knockdown of PTEN reduces CMA in confluent AML12 cells. (A) Fluorescent microscopy images of AML12 cells expressing a KFERQ-Dendra2 CMA reporter that were chemically transfected with the indicated siRNAs, and then treated with 5 μM buparlisib (Bup) or DMSO solvent control. (B) Quantifications of CMA puncta from A, showing that puncta were reduced by siPten and rescued by buparlisib treatment. Data points are individual cells, pooled from at least three replicates, n = 33, 25, 32 (for NC.DMSO, siPten.DMSO, siPten.Bup, respectively). (C) Western blots of lysates from AML12 cells that were treated as described in A and B, showing that siPten increased AKT pT308, which was rescued by buparlisib, as expected. (D) Western blots of a macroautophagic flux analysis for the effects of siPten. (E) Quantification of Westerns in D, showing a nearly significant reduction in macroautophagic flux as a result of siPten treatment; n = 6 for each group. (F) Western blots showing the effects of siPten and buparlisib rescue on CMA-sensitive proteins. (G) Quantification of blots, as shown in F, adjusted to H3 loading control; n = 8 for each group. Scale bars are 20 μM. On all graphs, the solid bar shows the mean. Error bars are SEM. P values shown on graphs for Western blots are from two-tailed unpaired t tests. P values shown on graphs for CMA reporter puncta are from Kolmogorov–Smirnov tests. P values shown in E are interaction terms from two-way ANOVAs. *P < 0.05, **P < 0.01, ***P < 0.001, ****P < 0.0001. Source data are available for this figure: SourceData F2.
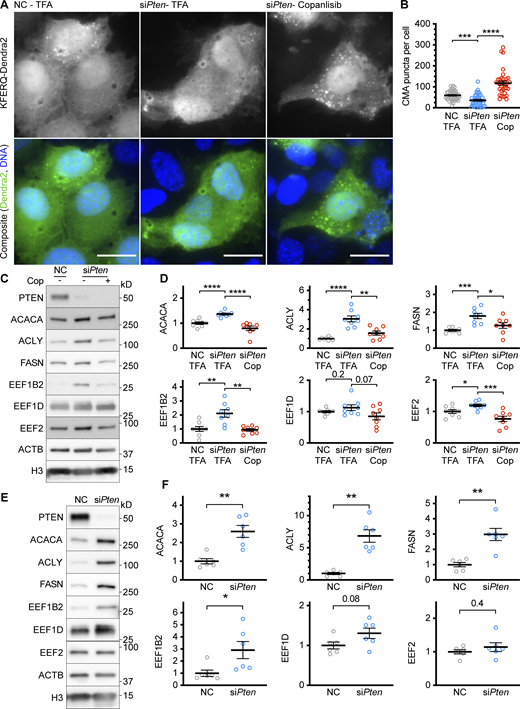
Data supportingFig. 2 —Additional controls for the effects of siPten on CMA. (A) Fluorescent microscopy images of AML12 cells expressing a KFERQ-Dendra2 CMA reporter that were chemically transfected with the indicated siRNAs, and then treated with 100 nM copanlisib (Cop) or TFA solvent control. (B) Quantifications of CMA puncta from A, show that puncta were reduced by siPten and rescued by copanlisib treatment. Data points are individual cells, pooled from at least three replicates, n = 44, 40, 35 (for NC.TFA, siPten.TFA, and siPten.Cop, respectively). (C) Western blots showing the effects of siPten and copanlisib rescue on CMA-sensitive proteins. (D) Quantification of blots, as shown in C, adjusted to H3 loading control; n = 8 for each group. (E) Western blots of lysates from NIH3T3 cells treated with siPten or negative control siRNA, examining for changes in CMA-sensitive proteins. (F) Quantifications of protein levels for the experiment described in E, adjusted to H3 loading control; n = 6 for each group. Scale bars are 20 μM. On all graphs, the solid bar shows the mean. Error bars are SEM. P values shown on graphs for Western blots are from two-tailed unpaired t tests. P values shown on graphs for CMA reporter puncta are from Kolmogorov–Smirnov tests. *P < 0.05, **P < 0.01, ***P < 0.001, ****P < 0.0001. Source data are available for this figure: SourceData FS4.
Data supportingFig. 2 —Additional controls for the effects of siPten on CMA. (A) Fluorescent microscopy images of AML12 cells expressing a KFERQ-Dendra2 CMA reporter that were chemically transfected with the indicated siRNAs, and then treated with 100 nM copanlisib (Cop) or TFA solvent control. (B) Quantifications of CMA puncta from A, show that puncta were reduced by siPten and rescued by copanlisib treatment. Data points are individual cells, pooled from at least three replicates, n = 44, 40, 35 (for NC.TFA, siPten.TFA, and siPten.Cop, respectively). (C) Western blots showing the effects of siPten and copanlisib rescue on CMA-sensitive proteins. (D) Quantification of blots, as shown in C, adjusted to H3 loading control; n = 8 for each group. (E) Western blots of lysates from NIH3T3 cells treated with siPten or negative control siRNA, examining for changes in CMA-sensitive proteins. (F) Quantifications of protein levels for the experiment described in E, adjusted to H3 loading control; n = 6 for each group. Scale bars are 20 μM. On all graphs, the solid bar shows the mean. Error bars are SEM. P values shown on graphs for Western blots are from two-tailed unpaired t tests. P values shown on graphs for CMA reporter puncta are from Kolmogorov–Smirnov tests. *P < 0.05, **P < 0.01, ***P < 0.001, ****P < 0.0001. Source data are available for this figure: SourceData FS4.
To determine if PTEN depletion has an effect on macroautophagy in AML12 cells, we assessed LC3 flux (Fig. 2 D). A two-factor ANOVA testing for an interaction between Bafilomycin A and siPten on LC3 flux gave an interaction term P value of 0.055, suggesting a nearly significant reduction in macroautophagy as a result of PTEN depletion (Fig. 2 E).
If CMA is blocked by the depletion of PTEN, then we expect CMA-sensitive proteins to be increased in siPten-treated AML12 cells. Indeed, ACACA, FASN, ACLY, and EEF1B2 protein levels were increased in cells depleted of PTEN. EEF1G and EEF2 increases did not reach statistical significance. AML12 cells depleted of PTEN showed a reduction in CMA-sensitive proteins when treated with 5 μM buparlisib, indicating a rescue (Fig. 2, F and G). When this rescue experiment was repeated using copanlisib instead of buparlisib, highly similar results were obtained (Fig. S4, C and D), again confirming that the effects of buparlisib are unlikely to be caused by off-target inhibition of other kinases. To determine if the increases in the abundance of CMA-sensitive proteins caused by PTEN depletion are cell-type specific, we measured the abundance of ACLY, ACACA, FASN, EEF1B2, EEF1D, and EEF2 in NIH3T3 cells treated with a siRNA targeting Pten. There were significant increases in the abundance of ACLY, ACACA, FASN, and EEF1B2, with a trend toward an increase in EEF1D (P = 0.08). There was no change in EEF2. For the most part, these results in NIH3T3 cells are similar to those obtained in AML12 cells, suggesting that the effects of PTEN depletion on CMA-sensitive proteins are (with the exception of EEF2) not cell-type-specific. Collectively, these data indicate that PTEN depletion reduces CMA in a manner dependent upon the accumulation of PI(3,4,5)P3. Preventing PI(3,4,5)P3 production with buparlisib or copanlisib rescues the effects of PTEN depletion.
The effects of PTEN on CMA are dependent on AKT
AKT regulates CMA by phosphorylating and inhibiting lysosome-localized GFAP (Arias et al., 2015). In its unphosphorylated form, GFAP promotes the assembly of the CMA translocation complex (Bandyopadhyay et al., 2010). Mice treated with PI3K inhibitors buparlisib or pictilisib have reduced lysosomal GFAP phosphorylation and enhanced CMA (Endicott et al., 2020b). Thus, we hypothesized that the effects of PTENWT overexpression on CMA required a reduction in AKT activity. To test this hypothesis, we overexpressed a constitutively active AKT (CA-AKT) in AML12 cells carrying the transgene for the KFERQ-Dendra2 CMA reporter, before overexpressing PTENWT, using cells treated with an empty vector or PTENWT alone as controls. As detected by the KFERQ-Dendra2 CMA reporter, PTENWT alone enhanced CMA, compared with the levels observed in the empty vector-treated cells. However, the cells treated with both PTENWT and CA-AKT had significantly fewer CMA puncta than the cells treated with PTENWT alone, indicating a rescue (Fig. 3, A and B). Overexpression of CA-AKT did not affect PTENWT levels but did partially rescue the phosphorylation of AKT substrate MAPKAP1 on T86 (Fig. 3 C). Consistent with the partial rescue on AKT substrate phosphorylation, overexpression of CA-AKT also partially rescued the abundance of CMA-sensitive proteins (Fig. 3, D and E).
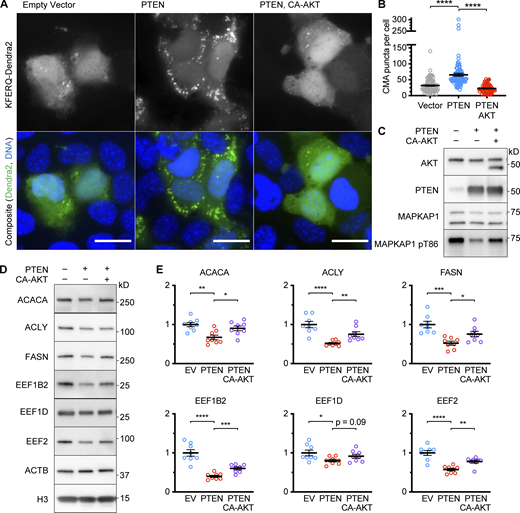
Activation of CMA by PTEN requires AKT inactivation. (A) Fluorescent microscopy images of AML12 hepatocytes expressing a KFERQ-Dendra2 CMA reporter that were transduced with a pHAGE lentiviral vector containing either an empty multiple cloning site, PTEN, or co-transduced with vectors for PTEN and CA-AKT. (B) Quantification of puncta for the experiment shown in A. Data points are individual cells, pooled from at least three replicates, n = 90, 90, 67 (for EV, PTEN OE, PTEN OE + AKT OE, respectively). PTEN overexpression caused an increase in reporter puncta, which was reversed by the expression of CA-AKT. (C) Western blots of AML12 cells that were treated as described in A and B, showing that CA-AKT partially rescued the phosphorylation of AKT substrate MAPKAP1, as expected. The lower band on the AKT blot is CA-AKT, which runs below the endogenous band. (D) Western blots showing changes to CMA-sensitive proteins in response to PTEN overexpression and CA-AKT rescue. (E) Quantifications protein levels from experiments shown in D, adjusted to H3 loading control; n = 8 for each group. Scale bars are 20 μM. On all graphs, the solid bar shows the mean. Error bars are SEM. P values shown on graphs for Western blots are from two-tailed unpaired t tests. P values shown on graphs for CMA reporter puncta are from Kolmogorov–Smirnov tests. *P < 0.05, **P < 0.01, ***P < 0.001, ****P < 0.0001. Source data are available for this figure: SourceData F3.
Activation of CMA by PTEN requires AKT inactivation. (A) Fluorescent microscopy images of AML12 hepatocytes expressing a KFERQ-Dendra2 CMA reporter that were transduced with a pHAGE lentiviral vector containing either an empty multiple cloning site, PTEN, or co-transduced with vectors for PTEN and CA-AKT. (B) Quantification of puncta for the experiment shown in A. Data points are individual cells, pooled from at least three replicates, n = 90, 90, 67 (for EV, PTEN OE, PTEN OE + AKT OE, respectively). PTEN overexpression caused an increase in reporter puncta, which was reversed by the expression of CA-AKT. (C) Western blots of AML12 cells that were treated as described in A and B, showing that CA-AKT partially rescued the phosphorylation of AKT substrate MAPKAP1, as expected. The lower band on the AKT blot is CA-AKT, which runs below the endogenous band. (D) Western blots showing changes to CMA-sensitive proteins in response to PTEN overexpression and CA-AKT rescue. (E) Quantifications protein levels from experiments shown in D, adjusted to H3 loading control; n = 8 for each group. Scale bars are 20 μM. On all graphs, the solid bar shows the mean. Error bars are SEM. P values shown on graphs for Western blots are from two-tailed unpaired t tests. P values shown on graphs for CMA reporter puncta are from Kolmogorov–Smirnov tests. *P < 0.05, **P < 0.01, ***P < 0.001, ****P < 0.0001. Source data are available for this figure: SourceData F3.
While our results indicate that the increase in CMA resulting from PTEN overexpression is dependent on a reduction in AKT activity, we wondered whether the decrease in CMA resulting from PTEN depletion is dependent on an increase in AKT activity. To test this hypothesis, we used siRNA to deplete PTEN in AML12 cells expressing the KFERQ-Dendra2 CMA reporter and then treated the cells with either DMSO solvent control or the pan-AKT inhibitor ipatasertib. Dose curves to determine the minimum effective dose of Ipatasertib are shown in Fig. S5 A. Because AKT inhibitors can increase AKT phosphorylation as a result of a regulatory feedback loop (Okuzumi et al., 2009), effective doses were determined based on blocking the phosphorylation of AKT substrates MAPKAP1 and GSK3β.
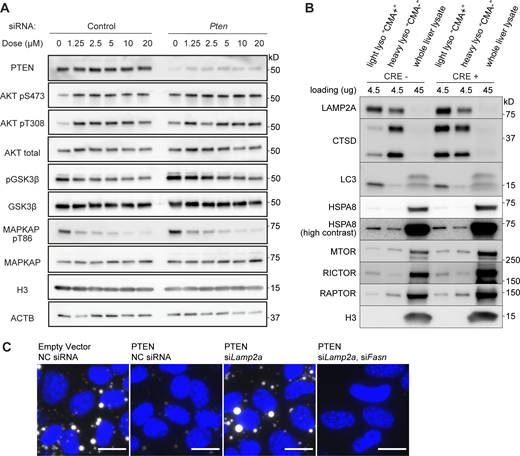
Data supportingFigs. 4,and5,—controls supporting validity of experimental findings. (A) Western blots of dose curves for Ipatasertib in AML12 cells pretreated with either negative control siRNA or siPten, examining the phosphorylation of AKT and AKT substrates GSK3β and MAPKAP1. (B) Western blots of light lysosome fractions, heavy lysosome fractions, and whole liver lysates from control and liver pten knockout mice. RICTOR and HSPA8 are markers of light (CMA+) lysosomes and RAPTOR is a marker of heavy (CMA−) lysosomes. (C) Fluorescence images from Fig. 9 of BODIPY (white), merged with images of DAPI (blue) to show the cells in each image, even where BODIPY staining is nearly absent. Source data are available for this figure: SourceData FS5.
Data supportingFigs. 4,and5,—controls supporting validity of experimental findings. (A) Western blots of dose curves for Ipatasertib in AML12 cells pretreated with either negative control siRNA or siPten, examining the phosphorylation of AKT and AKT substrates GSK3β and MAPKAP1. (B) Western blots of light lysosome fractions, heavy lysosome fractions, and whole liver lysates from control and liver pten knockout mice. RICTOR and HSPA8 are markers of light (CMA+) lysosomes and RAPTOR is a marker of heavy (CMA−) lysosomes. (C) Fluorescence images from Fig. 9 of BODIPY (white), merged with images of DAPI (blue) to show the cells in each image, even where BODIPY staining is nearly absent. Source data are available for this figure: SourceData FS5.
Inhibition of AKT with ipatasertib rescued the reduction in CMA caused by PTEN depletion (Fig. 4, A and B) and also rescued the phosphorylation in AKT substrate MAPKAP1 on T86 (Fig. 4 C). To further confirm that inhibition of AKT reverses the effects of PTEN depletion on CMA, we measured the abundance of CMA-sensitive proteins in AML12 cells by Western blotting after depletion of PTEN and treatment with ipatasertib. We found that cells treated with both siPten and ipatasertib had significantly lower levels of CMA-sensitive proteins than cells treated with siPten and DMSO, suggesting a rescue (Fig. 4, D and E).
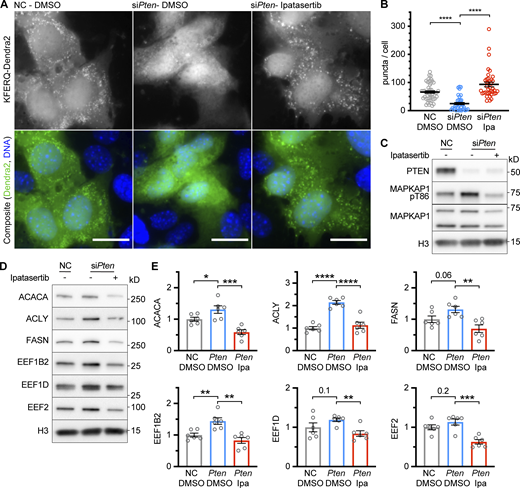
Inhibition of CMA by siPten is reversed by inhibiting AKT. (A) Fluorescent microscopy images of AML12 hepatocytes expressing a KFERQ-Dendra2 CMA reporter that were chemically transfected with the indicated siRNAs and then treated with ipatasertib (Ipa) or DMSO solvent control. (B) Quantifications of CMA puncta, as seen in A, which were reduced by siPten and rescued by ipatasertib treatment. Data points are individual cells, pooled from at least three replicates, n = 51, 38, 39 (for NC.DMSO, siPten.DMSO, and siPten.Ipa, respectively). (C) AML12 cells were treated as described in A and B and lysed for Western blotting, which showed that siPten caused an increase in the phosphorylation of AKT substrate MAPKAP1, which was rescued by ipatasertib. (D) Western blots showing the effects of siPten and ipatasertib rescue on CMA-sensitive proteins. (E) Quantifications of blots for the experiment shown in D, adjusted to H3 loading control; n = 6 for each group. Scale bars are 20 μM. On all graphs, the solid bar shows the mean. Error bars are SEM. P values shown on graphs for Western blots are from two-tailed unpaired t tests. P values shown on graphs for CMA reporter puncta are from Kolmogorov–Smirnov tests. *P < 0.05, **P < 0.01, ***P < 0.001, ****P < 0.0001. Source data are available for this figure: SourceData F4.
Inhibition of CMA by siPten is reversed by inhibiting AKT. (A) Fluorescent microscopy images of AML12 hepatocytes expressing a KFERQ-Dendra2 CMA reporter that were chemically transfected with the indicated siRNAs and then treated with ipatasertib (Ipa) or DMSO solvent control. (B) Quantifications of CMA puncta, as seen in A, which were reduced by siPten and rescued by ipatasertib treatment. Data points are individual cells, pooled from at least three replicates, n = 51, 38, 39 (for NC.DMSO, siPten.DMSO, and siPten.Ipa, respectively). (C) AML12 cells were treated as described in A and B and lysed for Western blotting, which showed that siPten caused an increase in the phosphorylation of AKT substrate MAPKAP1, which was rescued by ipatasertib. (D) Western blots showing the effects of siPten and ipatasertib rescue on CMA-sensitive proteins. (E) Quantifications of blots for the experiment shown in D, adjusted to H3 loading control; n = 6 for each group. Scale bars are 20 μM. On all graphs, the solid bar shows the mean. Error bars are SEM. P values shown on graphs for Western blots are from two-tailed unpaired t tests. P values shown on graphs for CMA reporter puncta are from Kolmogorov–Smirnov tests. *P < 0.05, **P < 0.01, ***P < 0.001, ****P < 0.0001. Source data are available for this figure: SourceData F4.
PTEN expression levels affect lysosomal AKT in mouse liver
The role of lysosomal AKT in regulating CMA is well appreciated (Arias et al., 2015). However, it is unclear if the plasma-membrane-localized phosphoinositide signaling steps downstream of the insulin receptor and PTEN are capable of regulating the phosphorylation of lysosome-localized AKT. To address this point, we isolated light and heavy lysosome fractions (also called “CMA+” and “CMA−” lysosomes, respectively) from PTEN OE and from mice with a liver-specific deletion of Pten. We bred Ptenloxp/loxp Alb-CRE mice, which have a liver-specific deletion of Pten, as described in previous studies (Stiles et al., 2004; Horie et al., 2004). This genetic modification results in hepatomegaly, hepatosteatosis, and dysregulation of metabolism leading to a reduction in peripheral adiposity (Stiles et al., 2004; Horie et al., 2004). The liver Pten deletion leads to the progressive development of adenomas and hepatocellular carcinomas with age, with approximately half of the mice developing liver tumors by 10 mo of age (Horie et al., 2004). To avoid the possible confounding effects of tumor cell biology, we harvested liver lysosomes from young (2–3 mo-old) male and female Ptenloxp/loxp Alb-CRE knockout (KO) experimental animals and pten+/+ Alb-CRE WT littermate controls. No tumors were observed in any of the mice at this young age. Controls for the enrichment of lysosomes from liver fractionation are shown in (Fig. S5 B). The light lysosome fraction (CMA+) had more RICTOR and HSPA8 than the heavy lysosome fraction (CMA−), as previously described (Arias et al., 2015).
In whole liver lysates from PTEN OE mice, levels of LAMP2A, HSPA8, MTOR, and AKT were not changed, relative to the sibling controls, although there was a nearly significant (P = 0.054) increase in LAMP2A in females, relative to males (Fig. 5, A and B). On the light liver lysosomes from PTEN OE mice, total AKT levels were significantly reduced (Fig. 5, C and D). While AKT pS473 was reduced in the lysosomes of PTEN OE mice (data not shown), the ratio of AKT pS473 to total AKT was not reduced (Fig. 5, C and D). GFAP pS8 was significantly decreased, suggesting reduced AKT activity at the lysosome (Fig. 5, C and D). MTOR negatively regulates CMA at the lysosome membrane (Arias et al., 2015). MTOR protein levels were also decreased in the liver lysosomes from PTEN OE mice (Fig. 5, C and D). Because the total levels of AKT and MTOR in whole liver lysates of PTEN OE mice were not changed, the change in the lysosome abundance of these proteins cannot be attributed to a decrease in total liver protein levels.
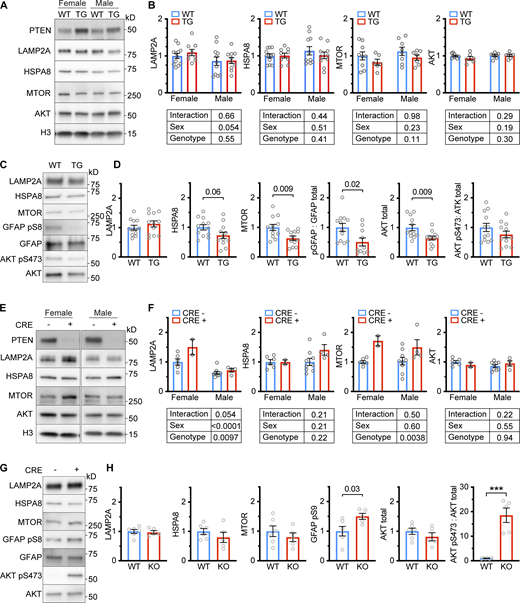
Lysosome-localized AKT and MTOR are affected by PTEN. (A) Whole liver lysates from male and female PTEN OE mice were analyzed for LAMP2A, HSPA8, MTOR, and AKT protein levels. (B) Quantifications of Western blots from the experiments are shown in A. There were no significant differences caused by sex or genotype. A trend toward more LAMP2A in the livers of female mice (relative to males) was noted, although this fell shy of significance (P = 0.054). (C) The light lysosome fractions from the livers of approximately equal numbers of male and female PTEN OE mice (or sibling controls) were analyzed by Western blotting. (D) Quantifications of Westerns from the experiment shown in C, using LAMP2A as a loading control, unless otherwise indicated. PTEN OE mice had significantly reduced levels of lysosomal MTOR and AKT. While pS473 AKT was reduced, the ratio of pS473 AKT to total AKT was not reduced due to the reduction in total AKT levels. GFAP pS9 levels were also reduced (two outliers were identified by the quartile method and removed). (E) Whole-liver lysates from male and female mice with a liver-specific Pten deletion (or sibling controls) were analyzed for LAMP2A, HSPA8, MTOR, and AKT protein levels. (F) Quantifications of Western blots from the experiments shown in E. Two-way ANOVA showed a significant effect of the Pten deletion on MTOR levels and a significant effect of Pten and sex on LAMP2A levels. (G) The light lysosome fractions from the livers of approximately equal numbers of male and female mice with a liver-specific Pten deletion (or sibling controls) were analyzed by Western blotting. (H) Quantifications of Westerns from the experiment shown in G, using LAMP2A as a loading control, unless otherwise indicated. The phosphorylation of both AKT pS473 and GFAP pS9 was increased, as expected. On all graphs, the solid bar shows the mean. Error bars are SEM. P values shown on graphs for Western blots are from two-tailed unpaired t tests. *P < 0.05, **P < 0.01, ***P < 0.001, ****P < 0.0001. Source data are available for this figure: SourceData F5.
Lysosome-localized AKT and MTOR are affected by PTEN. (A) Whole liver lysates from male and female PTEN OE mice were analyzed for LAMP2A, HSPA8, MTOR, and AKT protein levels. (B) Quantifications of Western blots from the experiments are shown in A. There were no significant differences caused by sex or genotype. A trend toward more LAMP2A in the livers of female mice (relative to males) was noted, although this fell shy of significance (P = 0.054). (C) The light lysosome fractions from the livers of approximately equal numbers of male and female PTEN OE mice (or sibling controls) were analyzed by Western blotting. (D) Quantifications of Westerns from the experiment shown in C, using LAMP2A as a loading control, unless otherwise indicated. PTEN OE mice had significantly reduced levels of lysosomal MTOR and AKT. While pS473 AKT was reduced, the ratio of pS473 AKT to total AKT was not reduced due to the reduction in total AKT levels. GFAP pS9 levels were also reduced (two outliers were identified by the quartile method and removed). (E) Whole-liver lysates from male and female mice with a liver-specific Pten deletion (or sibling controls) were analyzed for LAMP2A, HSPA8, MTOR, and AKT protein levels. (F) Quantifications of Western blots from the experiments shown in E. Two-way ANOVA showed a significant effect of the Pten deletion on MTOR levels and a significant effect of Pten and sex on LAMP2A levels. (G) The light lysosome fractions from the livers of approximately equal numbers of male and female mice with a liver-specific Pten deletion (or sibling controls) were analyzed by Western blotting. (H) Quantifications of Westerns from the experiment shown in G, using LAMP2A as a loading control, unless otherwise indicated. The phosphorylation of both AKT pS473 and GFAP pS9 was increased, as expected. On all graphs, the solid bar shows the mean. Error bars are SEM. P values shown on graphs for Western blots are from two-tailed unpaired t tests. *P < 0.05, **P < 0.01, ***P < 0.001, ****P < 0.0001. Source data are available for this figure: SourceData F5.
In whole liver lysates from mice with a liver-specific Pten deletion, there were significant effects of sex and genotype on LAMP2A levels, and KO mice had significantly more MTOR protein than their sibling controls (Fig. 5, E and F). In the light lysosome fractions from liver Pten KO mice, the phosphorylation of AKT on S473 was dramatically increased, without a significant change in total AKT levels, in the light lysosome fraction from mice with liver PTEN KO (Fig. 5, G and H). Moreover, GFAP phosphorylation on S8, the AKT phosphorylation site, was increased (Fig. 5, G and H). These data suggest that PTEN affects the phosphorylation of lysosome-localized AKT.
One possible explanation for reduced AKT and MTOR on the liver lysosomes of PTEN OE mice is that these two enzymes have reduced trafficking to the lysosome. A recent study found that PI(3,4,5)P3 on the lysosome membrane is not produced at the lysosome. Rather, PI(3,4,5)P3 is produced at the plasma membrane and is transported to the lysosome through dynamin-dependent endocytosis and vesicle trafficking (Chen et al., 2021). AKT accumulates on the lysosomal membrane in response to growth factor stimulation, and PI(3,4,5)P3 is required for AKT localization and activity at the lysosome (Chen et al., 2021). It is expected that PTEN OE will reduce the amount of PI(3,4,5)P3 that is available to move to the lysosome, thus reducing lysosomal levels of AKT.
There is increased uptake of CMA substrates into liver lysosomes from PTEN OE mice
The reduction in AKT on liver lysosomes from PTEN OE mice suggests the hypothesis that these lysosomes will have increased uptake of endogenous CMA substrates. To address this hypothesis, we performed an endogenous substrate uptake assay, as we previously described (Endicott et al., 2020b; Endicott et al., 2020a; Endicott et al., 2021). Briefly, PTEN OE and sibling control mice were injected with leupeptin (or sterile PBS, as a negative control) 2 h before dissection. Leupeptin blocks lysosomal proteolysis, allowing endogenous lysosomal substrates to accumulate in the lysosomal lumen. Lysosomes were isolated from the livers of six batches of mice (three batches of males and three batches of females), with one mouse of each treatment group per batch, and were then evaluated for the uptake of PTEN and three CMA substrates, GAPDH, ACLY, and ENO1. Values were normalized to the leupeptin-treated control lysosomes in each batch, and the difference in uptake was analyzed by two statistical approaches. First, a “full model” two-factor ANOVA was used to test if the genotypes of the mice modified the effects of the leupeptin on substrate accumulation. By this method, GAPDH, ACLY, and PTEN showed significantly more accumulation in the lysosomes from PTEN OE mice in response to leupeptin than what was observed in the sibling controls (Fig. 6, A and B). ENO1 showed a similar trend that fell shy of significance (P = 0.06). For a second statistical approach, we analyzed the data according to the methods of the original paper to perform in vivo lysosome substrate uptake assays (Schneider et al., 2014). We performed a t test to evaluate whether there was a difference in PTEN, GAPDH, ACLY, and ENO1 between the lysosomes from leupeptin-treated PTEN OE mice and leupeptin-treated controls. This test gave very similar results to the two-factor ANOVA. These results suggest that CMA activity is higher in lysosomes of PTEN OE mice, but also suggest that PTEN itself might be a CMA substrate.
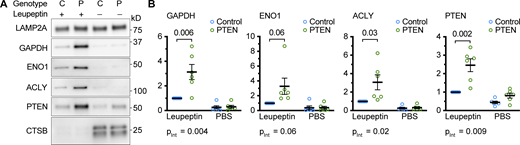
Increased uptake of endogenous CMA target proteins into liver lysosomes from PTEN OE mice. (A) Western blots of liver lysosomes that were isolated from PTEN OE or sibling control mice, 2 h after leupeptin (or PBS control) injection. Samples were prepared in six batches with one mouse in each treatment group. Three of the batches contained all male mice, the other three contained all female mice. The protein levels for each sample were normalized to the leupeptin-injected control in that batch. (B) Quantifications of Western blots are shown in A. On all graphs, the solid bar shows the mean. Error bars are SEM P values shown on graphs for Western blots are from two-tailed unpaired t tests. pInt shown below each graph is the interaction term P value of a full model two-way ANOVA. Source data are available for this figure: SourceData F6.
Increased uptake of endogenous CMA target proteins into liver lysosomes from PTEN OE mice. (A) Western blots of liver lysosomes that were isolated from PTEN OE or sibling control mice, 2 h after leupeptin (or PBS control) injection. Samples were prepared in six batches with one mouse in each treatment group. Three of the batches contained all male mice, the other three contained all female mice. The protein levels for each sample were normalized to the leupeptin-injected control in that batch. (B) Quantifications of Western blots are shown in A. On all graphs, the solid bar shows the mean. Error bars are SEM P values shown on graphs for Western blots are from two-tailed unpaired t tests. pInt shown below each graph is the interaction term P value of a full model two-way ANOVA. Source data are available for this figure: SourceData F6.
PTEN protein levels are controlled by CMA
The protein levels of PTEN are positively regulated by the INS/PI3K pathway via selective translation of Pten mRNA (Mukherjee et al., 2021). The increase in PTEN when INS/PI3K activity is high serves to limit the duration and intensity of the output of the INS/PI3K pathway (Mukherjee et al., 2021). Reciprocally, when the activity of the INS/PI3K pathway is low, PTEN protein levels decrease, making cells more sensitive to the activation of the INS/PI3K pathway (Mukherjee et al., 2021). Our results suggest the hypothesis that the decrease in PTEN levels when INS/PI3K pathway activity is low might be facilitated by increased CMA activity.
KFERQ Finder V0.8 (publicly available bioinformatic tool for identifying KFERQ motifs) predicts that mouse PTEN has three KFERQ-like motifs (Kirchner et al., 2019), all requiring activation by a posttranslational modification. The QRRYV motif starting at position 171 is predicted to be activated by phosphorylation (Kirchner et al., 2019) of Y174. Y174 is already known to be a PTEN phospho-site implicated in PTEN stability (Liu et al., 2014), although the mechanism is not known. The LKKDK motif starting at position 265 is predicted to be activated by acetylation (Kirchner et al., 2019) of K269. The QITKV motif starting at position 399 is located in the unstructured region of the PTEN C-terminal tail and is predicted to be activated by the phosphorylation (Kirchner et al., 2019) of T401. The two targeting motifs that are present in the structured region of PTEN are mapped onto the crystal structure of PTEN (Fig. 7 A), as determined by Lee et al. (1999). The LKKDK motif is present on the surface of the C2 domain of the protein, but the QRRYV motif is buried in the core of the phosphatase domain (Fig. 7 A). A summary table is shown below the crystal structure, where the amino acids of the targeting motif are color-coded as they appear in the illustration (Fig. 7 B).
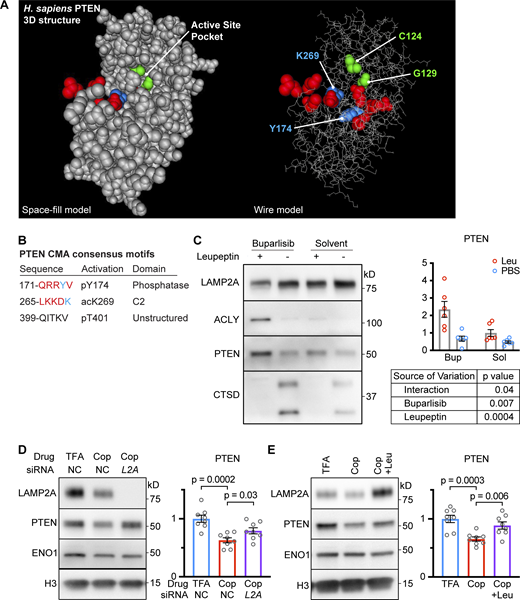
PTEN is sensitive to lysosomal proteolysis and CMA. (A) Illustration of the PTEN crystal structure as a space-fill model (left) and a wire model (right). The two amino acids, C124 and G129, that were mutated to alter PTEN catalytic activity are shown in green. The KFERQ-like consensus sequences are shown in red, with the amino acid that must be modified for activation of the KFERQ shown in blue. (B) A table with summary information about PTEN’s KFERQ-like sequences. (C) Western blots of liver lysosomes that were isolated from genetically heterogeneous mice treated with CMA-activating drug buparlisib (or solvent control) followed by leupeptin (or PBS control) injection; n = 6 for each group. PTEN accumulated in lysosomes in response to leupeptin, but this accumulation was significantly enhanced by buparlisib treatment. ACLY is highly CMA sensitive and is a control for CMA uptake. CTSD levels are reduced by leupeptin and are controls for successful leupeptin administration. (D) Western blots of lysates from AML12 cells pre-treated with siLamp2a or negative control siRNA were treated with CMA activating drug copanlisib. siLamp2a significantly rescued the reduction in PTEN caused by copanlisib; n = 8 for each group. (E) Western blots of lysates from AML12 cells treated with the CMA-activating drug copanlisib (Cop; dose = 100 nM), which have reduced PTEN, rescued when lysosomal proteolysis is inhibited by 100 μM leupeptin and 20 mM ammonium chloride (+Leu); n = 8 for each group. Bars on graphs show means. Error bars are SEM. P values shown on graphs for Western blots are from two-tailed unpaired t tests. A two-way ANOVA table is shown in C. Source data are available for this figure: SourceData F7.
PTEN is sensitive to lysosomal proteolysis and CMA. (A) Illustration of the PTEN crystal structure as a space-fill model (left) and a wire model (right). The two amino acids, C124 and G129, that were mutated to alter PTEN catalytic activity are shown in green. The KFERQ-like consensus sequences are shown in red, with the amino acid that must be modified for activation of the KFERQ shown in blue. (B) A table with summary information about PTEN’s KFERQ-like sequences. (C) Western blots of liver lysosomes that were isolated from genetically heterogeneous mice treated with CMA-activating drug buparlisib (or solvent control) followed by leupeptin (or PBS control) injection; n = 6 for each group. PTEN accumulated in lysosomes in response to leupeptin, but this accumulation was significantly enhanced by buparlisib treatment. ACLY is highly CMA sensitive and is a control for CMA uptake. CTSD levels are reduced by leupeptin and are controls for successful leupeptin administration. (D) Western blots of lysates from AML12 cells pre-treated with siLamp2a or negative control siRNA were treated with CMA activating drug copanlisib. siLamp2a significantly rescued the reduction in PTEN caused by copanlisib; n = 8 for each group. (E) Western blots of lysates from AML12 cells treated with the CMA-activating drug copanlisib (Cop; dose = 100 nM), which have reduced PTEN, rescued when lysosomal proteolysis is inhibited by 100 μM leupeptin and 20 mM ammonium chloride (+Leu); n = 8 for each group. Bars on graphs show means. Error bars are SEM. P values shown on graphs for Western blots are from two-tailed unpaired t tests. A two-way ANOVA table is shown in C. Source data are available for this figure: SourceData F7.
We previously reported that liver lysosomes isolated from mice administered the pan-class I PI3K inhibitor buparlisib have enhanced uptake of CMA substrates but not substrates of macroautophagy or endosomal microautophagy (Endicott et al., 2020b). To verify that PTEN accumulates in the lysosomal lumen when CMA is active and under conditions where PTEN is not overexpressed, we performed Western blots on liver lysosomes from mice treated with buparlisib (BKM120) and leupeptin, a drug that blocks lysosomal proteolysis, causing intralumenal accumulation of lysosomal target proteins. We found that leupeptin treatment caused accumulation of PTEN in lysosomes from both buparlisib and solvent control-treated mice. However, this accumulation was significantly higher in mice treated with buparlisib (Fig. 7 C).
We next evaluated whether or not CMA is necessary to control steady-state levels of PTEN in AML12 cells. We treated AML12 cells with either a negative control or a Lamp2a-targeting siRNA before treatment with copanlisib, a CMA-activating inhibitor of class I PI3K (Fig. 7 D). We found that the reduction in PTEN protein levels in response to copanlisib was at least partially dependent on LAMP2A, suggesting that CMA is required for the reduction in PTEN when the INS/PI3K pathway is inhibited. Furthermore, the reduction in PTEN in AML12 cells treated with copanlisib was also rescued when lysosomal proteolysis was inhibited with leupeptin (Fig. 7 E). Collectively, these data suggest that PTEN is itself a CMA substrate and that CMA is necessary to regulate PTEN protein abundance.
Suppression of glycolysis downstream of PTEN requires CMA
Mice with global overexpression of PTEN have a shift in metabolism favoring oxidative phosphorylation over glycolysis (Ortega-Molina et al., 2012; Garcia-Cao et al., 2012). Reciprocally, loss of CMA in the liver causes a shift in energy production, favoring glycolysis over oxidative phosphorylation (Schneider et al., 2014), similar to the shift observed in mice with a liver-specific knockout of pten (Stiles et al., 2004; Horie et al., 2004).
We used extracellular flux analysis (Seahorse) to test the hypothesis that the reduction in glycolysis as a result of PTEN OE is dependent on CMA. We found that AML12 cells had reduced adherence to the Seahorse plates after transduction with the PTEN transgene, confounding our initial analysis (data not shown), so we switched to NIH3T3 cells, which adhered to the plates and produced consistently repeatable results. Extracellular flux results were normalized to total protein concentration to address how changes to CMA affect the relative metabolic activity of the proteome.
As expected, PTEN overexpression caused a reduction in glycolysis and glycolytic capacity in NIH3T3 cells, as measured by the extracellular acidification rate (ECAR) during a glycolysis stress test (Fig. 8 A). NIH3T3 cells pretreated with siRNA targeting Lamp2a before PTEN overexpression showed a significant rescue of glycolysis and glycolytic capacity, confirming the hypothesis that CMA is required to decrease glycolysis and glycolytic capacity downstream of PTEN overexpression (Fig. 8 A). None of these treatment groups showed any significant differences in basal mitochondrial respiration, ATP-linked respiration, or maximal respiratory capacity, as detected by the oxygen consumption rate (OCR) during a mitochondrial stress test (Fig. 8 B).
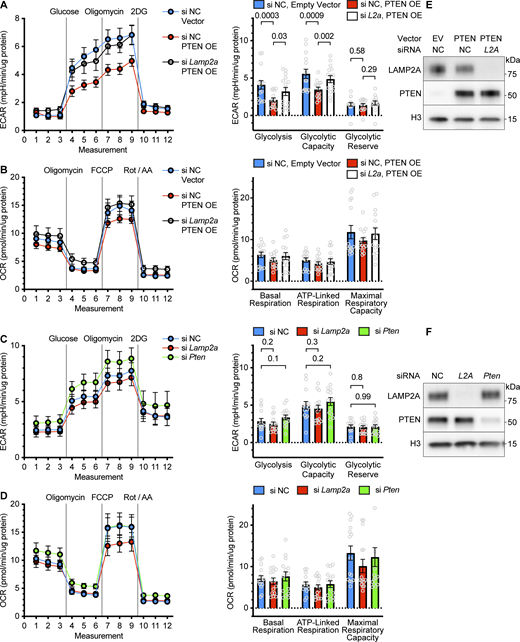
Suppression of glycolysis by PTEN requires CMA. NIH3T3 cells were treated with the indicated siRNAs and overexpression vectors and then plated in 96-well Seahorse plates for extracellular flux analysis. (A) Glycolysis stress test showing that PTEN OE reduces glycolysis and glycolytic capacity, which is rescued by siLamp2a. (B) Mitochondrial stress test showing no significant changes in respiration in response to PTEN OE or PTEN OE + siLamp2a. (C) Glycolysis stress test showing that neither siLamp2a nor siPten cause any significant changes in glycolysis. (D) Mitochondrial stress test showing no significant changes in respiration in response to siLamp2a or siPten. (E and F) Control Western blots from cells transfected and transduced in parallel to the cells used in the Seahorse analysis, showing the expected changes in PTEN and LAMP2A. For each Seahorse analysis, data were pooled from three independent replicates, with 5 wells per plate in each treatment group. Each point on the graphs represents data from one well. Bars on graphs show means. Error bars are SEM. P values shown on graphs are from two-tailed unpaired t tests. Source data are available for this figure: SourceData F8.
Suppression of glycolysis by PTEN requires CMA. NIH3T3 cells were treated with the indicated siRNAs and overexpression vectors and then plated in 96-well Seahorse plates for extracellular flux analysis. (A) Glycolysis stress test showing that PTEN OE reduces glycolysis and glycolytic capacity, which is rescued by siLamp2a. (B) Mitochondrial stress test showing no significant changes in respiration in response to PTEN OE or PTEN OE + siLamp2a. (C) Glycolysis stress test showing that neither siLamp2a nor siPten cause any significant changes in glycolysis. (D) Mitochondrial stress test showing no significant changes in respiration in response to siLamp2a or siPten. (E and F) Control Western blots from cells transfected and transduced in parallel to the cells used in the Seahorse analysis, showing the expected changes in PTEN and LAMP2A. For each Seahorse analysis, data were pooled from three independent replicates, with 5 wells per plate in each treatment group. Each point on the graphs represents data from one well. Bars on graphs show means. Error bars are SEM. P values shown on graphs are from two-tailed unpaired t tests. Source data are available for this figure: SourceData F8.
We also treated NIH3T3 cells with siRNA targeting Pten or Lamp2a, expecting to see an increase in glycolysis, similar to what is observed in the livers of mice with Pten deficiency (Stiles et al., 2004; Horie et al., 2004) or Lamp2a deficiency (Schneider et al., 2014). However, in NIH3T3 cells, we did not notice any significant changes to any metrics pertaining to glycolysis or mitochondrial respiration (Fig. 8, C and D). Previous reports used different cell types, assay designs, serum treatments, and normalization techniques from our study (Schneider et al., 2014). Given that CMA and glycolysis are both affected by cell type, serum, and confluence, it might be the case the effects of Pten or Lamp2a deficiencies on glycolysis are not easily generalizable between experimental setups. Control Western blots confirmed that siRNA and viral vector treatments altered PTEN and LAMP2A protein levels, as expected (Fig. 8, E and F).
Suppression of lipid droplet accumulation downstream of PTEN requires CMA
ACLY (ATP-citrate lyase) consumes ATP and citrate to produce acetyl-coA and oxaloacetate (Pietrocola et al., 2015; Zhao et al., 2016). The cytosolic acetyl-coA produced by ACLY can be used in the first steps of de novo lipid synthesis catalyzed by ACACA and FASN (Song et al., 2018). PTEN decreases de novo lipid synthesis by downregulating the INS/PI3K pathway (Chen et al., 2018). We hypothesized that the decrease in lipid synthesis downstream of PTEN overexpression is dependent on CMA. We grew AML12 hepatocytes on coverslips and treated them with siRNA targeting Lamp2a, or a non-targeting negative control, before transducing the cells with lentivirus carrying the PTEN transgene or an empty vector. The cells were then treated with either BSA (not conjugated to any fats) or BSA conjugated to oleic acid. BODIPY staining was used to visualize lipid droplet accumulation in the cells. We found that in BSA-treated AML12 cells, PTEN reduced lipid droplet accumulation, which was reversed when Lamp2a was knocked down (Fig. 9, A and B). This suggests that the suppression of de novo triglyceride synthesis (in fatty acid–free media) downstream of PTEN requires CMA. AML12 cells treated with oleic acid conjugated BSA also showed a reduction in lipid droplet accumulation when PTEN was overexpressed, but this was not rescued by knocking down Lamp2a (Fig. 9, A and B). This suggests that the effects of PTEN on suppressing triglyceride synthesis from fatty acids does not require CMA. To confirm that the lipid droplet accumulation resulting from Lamp2a knockdown in OA-free medium was dependent upon lipid synthesis, we treated AML12 cells with siRNA against both Lamp2a and Fasn before overexpressing PTEN. Again, siLamp2a alone reversed the effects of PTEN OE on lipid droplet accumulation. However, cells depleted of both LAMP2A and FASN had significantly less lipid droplet accumulation than cells depleted only of LAMP2A (Fig. 9, C–E). Images from Fig. 9 C merged with the DAPI staining are shown in Fig. S5 C to show the presence of cells, even where BODIPY staining is very faint. Altogether, these data suggest that when PTEN is overexpressed in AML12 cells, there is a CMA-dependent reduction in triglyceride synthesis.
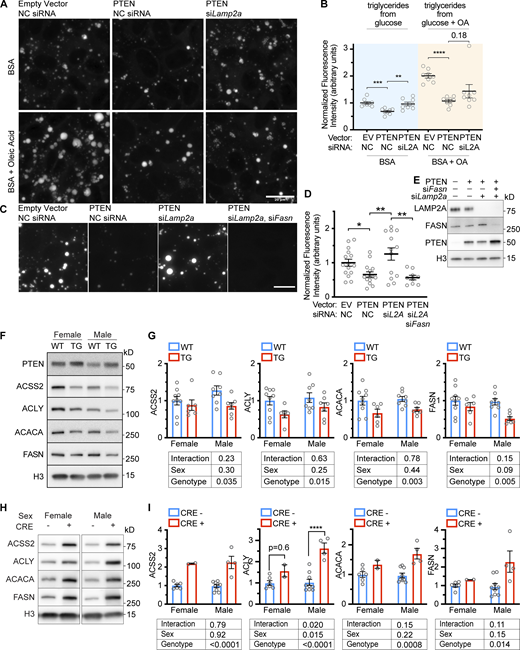
Suppression of fatty acid synthesis by PTEN requires CMA. (A) Fluorescent microscopy showing BODIPY staining of AML12 cells that were chemically transfected with the indicated siRNAs, and then transduced with the indicated viral vectors. The cells were treated with BSA or BSA conjugated to oleic acid before lipid droplets were visualized by BODIPY staining. (B) Quantification of fluorescence intensity from images acquired as described in A; n = 8 for each group. PTEN OE caused a decrease in lipid droplets in cells treated with BSA, which was rescued by siLamp2a. PTEN OE also caused a decrease in lipid droplets in cells treated with BSA + OA. However, this was not rescued by siLamp2a. (C) Fluorescent microscopy showing BODIPY staining of AML12 cells that were chemically transfected with the indicated siRNAs, and then transduced with the indicated viral vectors. (D) Quantification of fluorescence intensity from images acquired as described in C; n = 15, 15, 13, 9 (for EV.NC, PTEN.NC, PTEN.siL2A, and PTEN.siL2AsiFASN, respectively). (E) Western blots confirming gene expression changes for the experiment shown in C. (F) Whole liver lysates from PTEN OE mice were assessed for changes in CMA-sensitive proteins involved in the production of cytoplasmic acetyl-coA and fatty acids, ACSS2, ACLY, ACACA, and FASN. (G) Quantification of the experiment shown in F; n = 9, 6, 8, 7 (for F.WT, F.TG, M.WT, and M.TG, respectively). The PTEN OE genotype significantly reduced the liver protein abundance of all four proteins. (H) Whole liver lysates from mice with a liver-specific Pten deletion were assessed for changes in ACSS2, ACLY, ACACA, and FASN. (I) Quantifications of blots from H showed that ACSS2, ACACA, and FASN all showed significant genotype-dependent increases in abundance; n = 6, 2, 9, 4 (for F.CRE-, F.CRE+, M.CRE-, and M.CRE+, respectively). There was a sex x genotype interaction in ACLY levels, but a t-test revealed a significant increase in males. Bars on graphs show means. Error bars are SEM. P values shown on graphs are from two-tailed unpaired t tests. Results from two-way ANOVAs are shown below the graphs in G and I. *P < 0.05, **P < 0.01, ***P < 0.001, ****P < 0.0001. Source data are available for this figure: SourceData F9.
Suppression of fatty acid synthesis by PTEN requires CMA. (A) Fluorescent microscopy showing BODIPY staining of AML12 cells that were chemically transfected with the indicated siRNAs, and then transduced with the indicated viral vectors. The cells were treated with BSA or BSA conjugated to oleic acid before lipid droplets were visualized by BODIPY staining. (B) Quantification of fluorescence intensity from images acquired as described in A; n = 8 for each group. PTEN OE caused a decrease in lipid droplets in cells treated with BSA, which was rescued by siLamp2a. PTEN OE also caused a decrease in lipid droplets in cells treated with BSA + OA. However, this was not rescued by siLamp2a. (C) Fluorescent microscopy showing BODIPY staining of AML12 cells that were chemically transfected with the indicated siRNAs, and then transduced with the indicated viral vectors. (D) Quantification of fluorescence intensity from images acquired as described in C; n = 15, 15, 13, 9 (for EV.NC, PTEN.NC, PTEN.siL2A, and PTEN.siL2AsiFASN, respectively). (E) Western blots confirming gene expression changes for the experiment shown in C. (F) Whole liver lysates from PTEN OE mice were assessed for changes in CMA-sensitive proteins involved in the production of cytoplasmic acetyl-coA and fatty acids, ACSS2, ACLY, ACACA, and FASN. (G) Quantification of the experiment shown in F; n = 9, 6, 8, 7 (for F.WT, F.TG, M.WT, and M.TG, respectively). The PTEN OE genotype significantly reduced the liver protein abundance of all four proteins. (H) Whole liver lysates from mice with a liver-specific Pten deletion were assessed for changes in ACSS2, ACLY, ACACA, and FASN. (I) Quantifications of blots from H showed that ACSS2, ACACA, and FASN all showed significant genotype-dependent increases in abundance; n = 6, 2, 9, 4 (for F.CRE-, F.CRE+, M.CRE-, and M.CRE+, respectively). There was a sex x genotype interaction in ACLY levels, but a t-test revealed a significant increase in males. Bars on graphs show means. Error bars are SEM. P values shown on graphs are from two-tailed unpaired t tests. Results from two-way ANOVAs are shown below the graphs in G and I. *P < 0.05, **P < 0.01, ***P < 0.001, ****P < 0.0001. Source data are available for this figure: SourceData F9.
We next measured the abundance of ACLY, ACACA, FASN, and ACSS2 (which produces cytoplasmic acetyl-coA from acetate) in the livers of PTEN OE mice and mice with a liver-specific pten deletion. As expected, PTEN OE mice showed a reduction in all four of these CMA-sensitive proteins (Fig. 9, F and G). Conversely, mice with a liver-specific deletion of pten showed an increase in ACACA, FASN, and ACSS2. There was a sex x genotype interaction in ACLY levels, with a significant increase in ACLY in males only (Fig. 9, H and I).
When these data are taken together with the findings that PTEN OE mice are resistant to hepatosteatosis when fed a high-fat diet (Ortega-Molina et al., 2012) and that mice with liver pten deletion spontaneously develop the fatty liver disease (Stiles et al., 2004; Horie et al., 2004), they suggest that CMA modulation downstream of PTEN regulates the abundance of enzymes involved in lipid synthesis. The modulation of these enzymes by CMA might account for the profound changes in lipid biology in mice with altered PTEN levels.
Discussion
PTEN is a very well-studied regulator of cell growth and metabolism. Here, we report a previously unidentified role for CMA as a regulator of PTEN and as an effector of PTEN’s ability to modulate glycolysis and fatty acid synthesis. CMA activity is very sensitive to PTEN protein abundance, and the ability of PTEN to modulate CMA is dependent upon its lipid phosphatase activity and AKT.
Several experiments in this paper identified previously uncharacterized aspects of the regulation of protein levels of LAMP2A. We found that female mice on a C57BL/6J background (the Ptenloxp/loxp Alb-CRE model) have higher levels of LAMP2A in the liver than their male siblings. Mice on a background that is ∼50% BALB/cByJ and 50% C57BL/6J (PTEN OE model) showed a nearly significant (P = 0.054) difference in liver LAMP2A protein levels between the biological sexes, once again with females having more LAMP2A protein than their male siblings. The effects of biological sex on LAMP2A expression have not been described in previous papers evaluating CMA in mice. Mice overexpressing PTEN did not have altered LAMP2A protein levels in the liver. However, overexpression of PTEN in AML12 hepatocyte-like cells prevented the increase in LAMP2A levels that occurs with increasing confluence. The lack of an observable difference in LAMP2A protein levels in the PTEN OE mouse liver might be attributable to fundamental differences in the biology of hepatocytes in vivo and hepatocyte-like cells in culture, or it might be attributable to the fact that PTEN protein levels are only increased by about 50% in the mouse model, but are increased several fold in the cultured cells, so the results are not directly comparable. However, despite the effects of PTEN on LAMP2A levels, PTEN OE causes increased activity of CMA. This suggests that the mechanisms that determine relative CMA activity are far too nuanced to be predicted by absolute levels of LAMP2A.
CMA is positively regulated by the serine/threonine phosphatase PHLPP1, which associates with the lysosome to dephosphorylate and inactivate AKT, counteracting the effects of lysosomal MTORC2 (Arias et al., 2015). AKT is thought to inhibit CMA primarily by phosphorylation of lysosomal GFAP, inhibiting its ability to promote LAMP2A multimerization, which is a crucial step in CMA substrate translocation into the lysosomal lumen (Arias et al., 2015; Bandyopadhyay et al., 2010; Bandyopadhyay et al., 2008). Treatment of lysosome-enriched fractions from mouse liver with inhibitors of MTOR or AKT is sufficient to increase the uptake of CMA substrates, as evaluated by in vitro uptake assays, indicating a direct role for these kinases in controlling CMA in the lysosomal compartment (Arias et al., 2015), independently from transcription or new protein synthesis. Treating cells with small molecule inhibitors of AKT or MTOR also increased CMA reporter puncta (Arias et al., 2015). Our own work has demonstrated that inhibition of class I PI3K or PDPK1 is sufficient to activate CMA in three cultured cell types (Endicott et al., 2020b). This suggests that the INS/PI3K/AKT pathway communicates with the lysosome to regulate CMA. Mice administered the class I PI3K inhibitors buparlisib or pictilisib have enhanced CMA in the liver, suggesting a possible therapeutic repurposing of these unsuccessful anticancer drugs as CMA activators (Endicott et al., 2020b).
Here, we show that PTEN is a positive regulator of CMA and is itself a CMA substrate (i.e., PTEN protein levels are negatively regulated by CMA). These two findings suggest the hypothesis that CMA self-inhibits by degrading PTEN in a feedback loop, creating a self-stabilizing CMA/PTEN equilibrium. The PTEN transgene shifts this equilibrium, favoring more CMA. Future work by our group and others will evaluate the validity of this hypothesis.
There is currently intense interest in characterizing the regulation of CMA, with the hope that augmenting CMA may lead to therapeutic benefits. CMA degrades proteins implicated in the pathogenesis of Parkinson’s disease, Alzheimer’s disease, fatty-liver disease, cancer, inflammation, and atherosclerosis (Cuervo and Dice, 2000; Schneider et al., 2014; Gomes et al., 2017; Qiao et al., 2021; Kaushik and Cuervo, 2018). While drugs inhibiting the INS/PI3K/AKT pathway have not yet been used to counteract these diseases through CMA activation, there have been several recent studies showing therapeutic uses of CMA-enhancing small molecule inhibitors of RARα. Mouse fibroblasts treated with siRNA targeting retinoic acid receptor α (RARα) have enhanced CMA, and small molecule inhibitors of RARα increase Lamp2a mRNA expression and promote CMA (Anguiano et al., 2013). RARα inhibitors cause the formation of KFERQ-Dendra2 puncta in several tissues of mice carrying a transgene for this CMA reporter (Dong et al., 2020). The pathogenesis of Alzheimer’s-like neurodegeneration is delayed in two Alzheimer’s mouse models treated with RARα inhibitors (Bourdenx et al., 2021). Mouse models of retinitis pigmentosa show delayed retinal degeneration when CMA is activated with RARα inhibitors (Gomez-Sintes et al., 2022). These findings suggest that drugs enhancing CMA might have several therapeutic applications in human patients.
In addition to having protective effects against disease pathogenesis, enhanced CMA has been hypothesized to delay aging (Kaushik and Cuervo, 2018). Our recent work has identified enhanced CMA in the liver of pou1f1 mutant (Snell dwarf) and ghr KO (Laron dwarf) mice, which both live ∼40% longer than their normal littermates (Flurkey et al., 2001; Coschigano et al., 2003; Endicott et al., 2020a). Snell dwarf mice have decreased protein abundance of CMA-sensitive proteins CIP2A and MYC in the liver, kidney, and skeletal muscle, without changes in mRNA abundance (Endicott et al., 2020a). CMA degrades CIP2A, a positive regulator of MYC stability, and thus CMA indirectly reduces MYC levels by degrading CIP2A (Gomes et al., 2017). PTEN OE mice of both sexes live longer than their normal siblings (12% median lifespan extension when sexes are pooled), and like the pou1f1 mutant and ghr KO mice, have reduced MYC in several tissues (Garcia-Cao et al., 2012; Ortega-Molina et al., 2012). Mice hemizygous for the myc gene are long-lived (Hofmann et al., 2015), suggesting the hypothesis that part of the exceptional longevity of Snell, ghr KO, and PTEN OE mice might be caused by CMA-mediated reductions in MYC or other CMA target proteins (Hofmann et al., 2015; Endicott et al., 2020a).
In addition to its role in negatively regulating MYC, CMA negatively regulates the abundance of other proteins implicated in setting the pace of aging. Our recently published work on lysosomal targetomics in ghr KO mice showed that ghr KO liver lysosomes have increased degradation of ACLY and ACSS2 (Endicott et al., 2021), the two enzymes responsible for nucleocytosolic acetyl-coA synthesis. These proteins are also decreased in ghr KO liver, and their abundance is highly sensitive to CMA function in NIH3T3 and AML12 cells (Endicott et al., 2021). Partial reductions of either ACLY or ACSS2 are sufficient to extend the lifespan in Drosophila (Eisenberg et al., 2014; Peleg et al., 2016; Zhao et al., 2016). The recent findings that ACLY inhibitors recapitulate some beneficial effects of calorie restriction in mice have led some scientists to speculate that ACLY might play a role in regulating mammalian longevity (Cătană et al., 2018). Here, we show that ACLY levels in the liver are highly sensitive to PTEN levels, which is consistent with our previous finding that ACLY is highly CMA sensitive and that PTEN regulates CMA.
Maintaining the balance between glycolysis and oxidative phosphorylation is essential for disease-free aging. Oxidative capacity declines with age across diverse animal models (Gonzalez-Freire et al., 2015), and compensatory increases in glycolysis have been hypothesized to contribute to a “Warburg transition,” which makes aging mammals more susceptible to cancer (Tidwell et al., 2017). PTEN OE mice have elevated energy expenditure relative to their WT littermates and display a metabolic shift in energy production, favoring oxidative phosphorylation over glycolysis (Garcia-Cao et al., 2012). It has been hypothesized that the metabolic reprogramming downstream of PTEN OE might extend the lifespan and increase cancer resistance by delaying the age-related “Warburg transition” (Garcia-Cao et al., 2012). Our data suggest that CMA is essential for PTEN to downregulate glycolysis, suggesting that CMA might contribute to lifespan extension by selectively reducing a subpopulation of glycolytic enzymes. Altogether, our data reinforce the hypothesis that CMA is an important regulator of health and longevity and suggest that drugs that enhance CMA may be able to retard aspects of aging and extend healthy lifespan.
Materials and methods
Antibodies
Commercially available antibodies are listed below. Some antibodies were validated by the vendors by knock out (KO), siRNA knockdown, or overexpression of a tagged protein, and this is indicated where applicable:
ACACA/ACC1 (Cell Signaling Technology [CST]: 4190S; rabbit host; Lot: 4; siRNA validated for specificity from ACACB/ACC2), ACLY (40793; AbCam; rabbit host; Lot: GR3244069-3; KO validated), ACTB/β-Actin (8457L; CST; rabbit host; Lot: 7), AKT (4691S; CST; rabbit host; Lot: 28), AKT pS473 (4060S; CST; rabbit host; Lot: 26), AKT pT308 (13038S; CST; rabbit host; Lot: 7) ATG5 (108327; AbCam; rabbit host; Lot: GR3202986-8; KO validated), CTSD/Cathepsin D (75852; AbCam; rabbit host; Lot: GR260148-28), ENO1 (3810S; CST; rabbit host; Lot: 2; KO validated), EEF1B2 (ab228642; AbCam; rabbit host), EEF1D (PA5-96147; Invitrogen; rabbit host), EEF2 (2332S; CST; rabbit host; Lot: 7), FASN (22759; AbCam; rabbit host; Lot: GR3192402-1; KO validated), GAPDH (2118S; CST; rabbit host; Lot: 14), GSK3β (12456S; CST; rabbit host), pS9 GSK3β (9323S; CST; rabbit host), GFAP (7260; AbCam; rabbit host), pS8 GFAP (PA5-12991; Thermo Fisher Scientific; rabbit host),H3 (176842; AbCam; rabbit host; Lot: GR3277361-2), HSPA8/Hsc70 (154415; AbCam; rabbit host; Lot: GR307969-3), LAMP1 (24170; AbCam; rabbit host; Lot:GR3255586-1), LAMP2A (125068; AbCam; rabbit host; Lot:GR23784-34), MAP1LC3B/LC3 (2775S; CST; rabbit host; Lot: 12), MAPKAP1/mSIN1 (64188; AbCam; rabbit host), pT86 MAPKAP1/mSIN1 (14716S; CST; rabbit host), PTEN (9188S; CST; rabbit host; Lot: 6), SQSTM1/p62 (5114S; CST; rabbit host; Lot: 6; validated by overexpression of a tagged protein), and TSG101 (125011; AbCam; rabbit host; Lot: GR299332-27).
For Western blots, most antibodies detected a single band at the expected molecular weight. GFAP showed multiple bands, as we have previously reported (Endicott et al., 2020b). For main text figures showing GFAP, the band matching the molecular weight of the lysosomal band was used (Endicott et al., 2020b).
Antibodies for LAMP2A (125068; AbCam) and TSG101 (125011; AbCam) were validated by siRNA knockdown in our previous work (Endicott et al., 2021).
Plasmids, viral vectors, and siRNA
The pHAGE-PTEN plasmid (116780; Addgene) contains a WT Homo sapiens PTEN gene in a third-generation lentiviral expression system (Ng et al., 2018). To generate an empty vector to use as a negative control, the PTEN transgene was replaced with a multiple cloning site by Q5 site-directed mutagenesis, using an NEB kit (E0554S; New England BioLabs), according to the manufacturer’s instructions. The primer sequences for the replacement were 5′-TTGGATCCCCATGGGTTAACTAGAACCCAGCTTTCTTG-3′ and 5′-TTGTCGACTCGCGAAGGCCTATGCATGGTGCCTGCTTTTTTG-3′. PTEN point mutants were also generated by Q5 site-directed mutagenesis, with the following primer pairs: C124S (5′-TCTAAAGCTGGAAAGGGACG-3′, 5′-GTGAATTGCTGCAACATGATTG-3′), G129E (5′-GAACGAACTGGTGTAATGATATGTGC-3′, 5′-CTTTCCAGCTTTACAGTGAATTG-3′), Y174F (5′-TTCGTGTATTATTATAGCTACCTGTTAAAGAATCATCT-3′, 5′-GCGCCTCTGACTGG-3′), K269R (5′-AGAATGTTTCACTTTTGGGTAAATACATTCTT-3′, 5′-GTCCTTTTTTAGCATCTTGTTCTGTT-3′), and T401A (5′-GCCAAAGTCTAGAACCCAGCTTTCTT-3′, 5′-AATTTGTGTATGCTGATCTTCATCAAAAG-3′).
The KFERQ-Dendra2 plasmid was a gift from Ana Maria Cuervo (Albert Einstein College of Medicine). The reporter consists of the N-terminus of RNAase A fused to the photo-switchable fluorescent protein Dendra2, in a third-generation pCCL lentiviral backbone, similar to what has been reported in other studies (Koga et al., 2011; Arias et al., 2015; Anguiano et al., 2013).
Overexpression of CA-AKT was achieved by using the pHRIG-Akt1 plasmid (53583; Addgene) which encodes a myristoylated version of human AKT1 (Xie et al., 2013).
Lentivirus for transgene delivery was created by the University of Michigan BRCF Vector Core. Cells were transduced with the virus using standard techniques to generate stable lines.
siRNAs were acquired as follows: Medium GC content negative control (465372; Invitrogen), Pten (PtenMSS208094; Invitrogen), Tsg101 (Tsg101MSS238580; Invitrogen), and Lamp2A (cocktail of two custom-designed Stealth siRNA duplexes from Invitrogen; sequences: 5′-CAGCUCUGGGAGGAGUACUUAUUCU-3′ and 5′-CAAGCGCCAUCAUACUGGAUAUGAG-3′, complexed to the reverse complement antisense sequences). Transfections were performed using Lipofectamine RNAi MAX (56532; Invitrogen), with transfections prepared in OptiMEM (31985-062; Gibco), according to the manufacturer’s instructions.
Cell culture
For all cell culture experiments, cells were passaged not more than 20 times, after thawing the original stock obtained from ATCC. Cells were checked for mycoplasma contamination upon thaw, returning a negative result each time. All cells were maintained in a humidified 37°C incubator with 10% CO2 and ambient O2. Recipes for cell culture growth media were obtained from the ATCC website. NIH3T3 cells were obtained from ATCC (CRL-1658) and maintained in DMEM (11965092; Gibco) supplemented with 10% FBS (35-016-CV; Corning) and penicillin-streptomycin (15070063; Gibco). AML12 cells were obtained from ATCC (CRL-2254) and maintained in DMEM:F12 (11320033; Gibco), supplemented with insulin–selenium–transferrin (51500-056; Gibco), 10% FBS (35-016-CV; Corning), 40 ng/ml dexamethasone (D4902; Sigma-Aldrich), and penicillin-streptomycin (15070063; Gibco).
CMA reporter
AML12 cells stably expressing the Dendra2 reporter were generated in our previous study (Endicott et al., 2020b), and frozen aliquots of the same cells were used here. These cells were seeded in 24-well plates with a cover glass (1254580; Thermo Fisher Scientific) dropped into each well. Cells were treated as indicated in the figures. For fixation, cells were rinsed once with PBS and fixed in a solution of 1% paraformaldehyde, 1% sucrose, in PBS, pH = 7.2, for 7 min at room temperature. Cells were rinsed twice with PBS, stained with Hoechst (94403; Sigma-Aldrich), and mounted onto microscope slides (12-550-343; Thermo Fisher Scientific), using fluorescent protein mounting medium (E18-18; GBI Labs). Slides were dried overnight at 4°C and were imaged the next day.
Dendra2 puncta were counted blind, with images analyzed in random order, using our previously published methods (Endicott et al., 2020b). First, images were subjected to the ImageJ Max Entropy thresholding algorithm to identify cells with sufficient fluorescent protein expression to be counted. Then the number of puncta per cell were manually counted in unadjusted images and recorded (because of uneven background, automated counting is consistently less accurate than manual counting). Cells were excluded from analysis if they were on the edge of the image (such that a portion of the cytosol was outside of the image, preventing an accurate count) or if their cytoplasm overlapped substantially with another cell, preventing accurate quantification. Final results were unblinded and tabulated by a different person than the one performing the analysis. For each experiment, data were pooled from at least three independent replicates.
Drugs for cell culture experiments
Drugs for cell culture experiments were obtained as follows: Bafilomycin A (SML1661; Sigma-Aldrich), copanlisib (S2802; SelleckChem), leupeptin (L2884; Sigma-Aldrich), and ammonium chloride (A4514; Sigma-Aldrich).
Bafilomycin A was used at a concentration of 160 nM for all experiments. All other drug doses and incubation times are as indicated in the figure legends or directly on the figures. Bafilomycin A was dissolved in DMSO (D2650; Sigma-Aldrich). Copanlisib, which is not DMSO soluble, was initially solubilized in a 10% trifluoroacetic acid (T6508; Sigma-Aldrich)/90% water solution to a concentration of 2 mM and then diluted with water to appropriate working stock concentrations. Leupeptin (L2884; Sigma-Aldrich) was solubilized in sterile PBS.
For all drug treatments, the cells were maintained in a complete growth medium with serum, according to the recipes specified above.
Drugs for mouse experiments
Leupeptin (L2884; Sigma-Aldrich) was dissolved in sterile PBS to a concentration of 25 mg/ml and administered by intraperitoneal injection at a dose of 100 mg/kg to a final volume of ∼100 μl.
Buparlisib (HY-70063; MedChem Express) was administered at a dose of 50 mg/kg. Buparlisib was dissolved in NMP/PEG300 (10% N-methylpyrrolidone, 90% polyethylene glycol 300) to concentrations of 15 mg/ml so that the final volume delivered to each mouse was ∼100 μl. To dissolve the drug, the solution was passed through a 23-gauge needle repeatedly, until clear. Buparlisib solution was aliquoted, stored at −80°C, and thawed immediately before use. Buparlisib or the solvent control was administered by oral gavage at approximately the same time every day for 1 wk prior to leupeptin injection and lysosome isolation.
Extracellular flux analysis
NIH3T3 cells were grown in 24-well plates and transfected with the indicated siRNAs 4 d before the extracellular flux analysis. Where applicable, cells were transduced with lentiviral vectors 3 d before the extracellular flux analysis. 24 h before the extracellular flux analysis, the cells were treated with 0.05% trypsin (25300-054; Gibco) and replated in 96-well Seahorse Assay Plates (101085-004; Agilent). 20,000 cells were seeded per well. 1 h before analysis, the cells were changed into either warm Seahorse assay medium (102353-100; Agilent) supplemented with 4 mM glutamine (G5763; Sigma-Aldrich) for glycolysis stress tests or warm Seahorse assay medium supplemented with 4 mM glutamine and 4 g/l glucose (67528; Sigma-Aldrich) for mitochondrial stress tests. Mitochondrial and glycolysis stress tests were performed according to the manufacturer’s instructions, with 3-min mixing steps and 3-min measuring steps, repeated three times for each cycle between injections. For the glycolysis stress test, the injections were (concentrations are final concentrations in the plate) first 10 mM glucose (67528; Sigma-Aldrich), second 1.5 μM oligomycin (O4876; Sigma-Aldrich), and third 50 mM 2-deoxy-D-glucose (D8375; Sigma-Aldrich). For the mitochondrial stress test, the injections were (concentrations are final concentrations in the plate) first 1.5 μM oligomycin (O4876; Sigma-Aldrich), second 2.0 μM FCCP (C2920; Sigma-Aldrich), and third 0.5 μM of both rotenone (557368; EMD Millipore) and antimycin A (A8674; Sigma-Aldrich).
Lysosome isolation—light and heavy lysosomes
Mice were dissected at approximately the same time for each experiment (between 9 and 10 am, with the dark period ending at 6 am). All mice were allowed free access to food during the entire course of experimentation. Upon dissection, mice were qualitatively assessed for the presence of food in the stomach (and all mice used in the study had food in the stomach).
Freshly dissected liver tissue was immediately washed in ice-cold PBS until no visible blood remained. All subsequent steps were performed at 4°C. Tissue was diced with scissors in ice-cold 0.25 M sucrose (57-50-1; Thermo Fisher Scientific), pH = 7.2. The diced tissue was then gently homogenized in a Wheaton Dounce homogenizer (357538; Wheaton) with the “LOOSE” pestle (0.089–0.14 mm gap). The homogenate volume was adjusted to 2 ml with ice-cold 0.25 M sucrose before 3-min centrifugation at 6,800 × g to remove unbroken cells, extracellular matrix, and nuclei. The supernatant was collected and spun at 17,000 × g for 10 min to pellet the remaining organelles, which include the lysosomes. The pellet was resuspended in 0.25 M sucrose to a volume of 800 μl and then gently mixed with 1,600 μl of 88.38% Histodenz (D2158; Sigma-Aldrich). The sample was loaded into an ultracentrifuge tube (344057; Beckman Coulter) for a 55Ti-SW rotor (342194; Beckman Coulter). Four layers were laid over the sample: 0.8 ml 33.74% Histodenz, 0.8 ml 26.99% Histodenz, 0.8 ml 20.25% Histodenz, and 0.4 ml 0.25 M sucrose. The samples were subjected to ultracentrifugation at 141,000 × g for 2 h in a Beckman Coulter L-70 ultracentrifuge. During ultracentrifugation, the sample resolved into visible bands at the interfaces of the density layers. The visible bands at the interface of the 0.25 M sucrose–20.25% Histodenz layers and the interface of the 20.25–26.99% Histodenz layers were both highly enriched in lysosome markers, such as LAMP2A and CTSD, and were referred to as “light” and “heavy” lysosomes, respectively. After the lysosome-containing bands were removed from the density gradient, the samples were diluted in PBS to decrease the Histodenz density, allowing the lysosomes to be pelleted, washed, and resuspended in isotonic MOPS/sucrose buffer. Protein concentrations were measured by BCA assay (23225; Thermo Fisher Scientific), and all samples were adjusted to the same protein concentration.
Lysosome isolation—analysis of endogenous substrate uptake
Leupeptin (dissolved in sterile PBS) was administered by intraperitoneal injection at a dose of 100 mg/kg in a final volume of ∼100 μl, as previously described (Endicott et al., 2020b; Endicott et al., 2020a). Injections were administered between 9 am and 9:30 am for each of the six replicates of the experiment. Mice were dissected between 11 am and 11:30 am. All mice were allowed free access to food and water until they were humanely euthanized. Upon dissection, mice were qualitatively assessed for the presence of food in the stomach (and all mice used in the study had food in the stomach).
Freshly dissected liver tissue was immediately washed in ice-cold PBS until no visible blood remained. All subsequent steps were performed at 4°C. Tissue was diced with scissors and gently dounce-homogenized in commercially available fractionation buffers (89839; Thermo Fisher Scientific). Nuclei, extracellular matrix, and unbroken cells were removed by 10-min centrifugation at 500 × g. The postnuclear sample was mixed with iodixanol/OptiPrep to a concentration of 15% OptiPrep and loaded onto a discontinuous 17–30% OptiPrep (D1556; Sigma-Aldrich) density gradient in ultracentrifuge tubes (344057; Beckman Coulter) for a 55Ti-SW rotor (342194; Beckman Coulter). A 10% Optiprep layer was laid over the sample, and the samples were subjected to ultracentrifugation at 145,000 × g for 2 h in a Beckman Coulter L-70 ultracentrifuge. During ultracentrifugation, the sample resolved into visible bands on the density gradient. The visible band at the 10–15% gradient interface is highly enriched (>50 fold) for lysosomal markers and was used for all experiments. After the lysosome-containing band was removed from the density gradient, the sample was diluted in PBS to decrease the OptiPrep density, allowing the lysosomes to be pelleted, washed, and resuspended. Protein concentrations were measured by the BCA assay (23225; Thermo Fisher Scientific), and all samples were adjusted to the same protein concentration before being analyzed by Western blotting.
Microscope image acquisition and analysis
Microscopy was performed in the UM BRCF Microscopy Core. Images were acquired with a Zeiss Axioplan2 microscope equipped with Zeiss ApoTome for optical sectioning. Image capture was performed with a Zeiss AxioCam MRm camera. The objective lens used was a Zeiss Plan-NEOFLUAR 40x, with a numerical aperture of 0.75 (this lens requires no immersion medium). The microscope was operated with Zeiss Axiovision software. All microscopy was performed on fixed samples at room temperature.
For each experimental replicate, equal numbers of images for each experimental group were acquired on the same day using the exact same exposure settings and light intensity. Image stacks were acquired with a 0.5 μm z-plane slice distance. Fluorescence quantification was performed in ImageJ, using raw, unadjusted images. Post-acquisition image adjustment was only performed for display images (i.e., only after analysis was complete) using ImageJ software.
Mouse stocks and husbandry
All animal experiments were approved by the University of Michigan Institutional Animal Care and Use Committee. Mice were housed in Specific Pathogen Free facilities, with sentinel animals checked quarterly for infection (all such tests were negative). Mice had free access to food (5L0D, Lab Diet: 0067138) and water during the course of all experiments.
Experiments using isolated lysosomes from the livers of buparlisib-treated mice, used 3-mo-old mice of the genetically heterogeneous UM-HET3 mouse stock, as previously described (Miller et al., 1999; Miller et al., 2007). The UM-HET3 stock is produced by crossing female CByB6F1/J (stock #100009; JAX) to male C3D2F1/J (stock #100004; JAX). Each of the parents is F1 crosses. The CByB6F1/J mothers are generated by crossing BALB/cByJ females to C57BL/6J males. The C3D2F1/J fathers are generated by crossing C3H/HeJ females to DBA/2J males. All test animals are the grandchildren of the same four inbred mouse lines.
Mice with a liver-specific knockout of Pten were created by crossing transgenic mice hemizygous for B6.Cg-Speer6-ps1-Tg(Alb-cre)21Mgn/J, a Cre recombinase with liver-specific Cre driven by the mouse albumin promoter/enhancer (Albumin-Cre), (stock #003574; JAX; Postic et al., 1999) to homozygous C;129S4-Ptentm1Hwu/J (pten flox) mice (stock #004597; JAX; Groszer et al., 2001). Hemizygous Pten-floxed progeny were then crossed, with one of the parents also being hemizygous for Albumin Cre. These crosses yielded offspring harboring WT, hemizygous, or homozygous Pten flox alleles with and without hemizygous Albumin Cre that were used for downstream experimental comparisons. To identify experimental mice, DNA from tail snips was obtained for PCR. Generic Cre primers were 5′-CAAAACAGGTAGTTATTCGG-3′ (forward) and 5′-CGTATAGCCGAAATTGCCAG-3′ (reverse). The PCR protocol was: 94°C for 3 min, followed by 35 cycles of 94°C for 30 s, 59°C for 30 s, and 72°C for 30 s. After completion of the protocol, samples were held at 4°C. Pten-floxed primers were 5′- CAAGCACTCTGCGAACTGAG-3′ (forward) and 5′-AAGTTTTTGAAGGCAAGATGC-3′ (reverse). The PCR protocol was 94°C for 3 min, followed by 35 cycles of 94°C for 30 s, 60°C for 1 min, and 72°C for 1 min, with a final extension of 72°C for 2 min and hold at 4°C.
To generate mice with a global overexpression of PTEN, a female mouse on an inbred background of ∼75% C57BL6 and 25% CBA carrying a single copy of the pten transgene was a gift from Daniel Herranz at Rutgers University. This female was crossed to a BALB/cByJ (stock 0012026; JAX) male. Subsequent generations were produced by breeding males heterozygous for the pten transgene to CByB6F1/J females (stock 100009; JAX), which are F1 hybrids from BALB/cByJ mothers and C57BL/6J fathers. Thus, the pten transgene was migrated onto a background of 50% C57BL/6J and 50% BALB/cByJ. All experimental animals carry a single copy of the pten transgene, with non-transgene-carrying littermates used as controls. To identify the presence of the pten transgene, DNA was isolated from ear notches and subjected to PCR using primers: 5′-CCGCTAATACGACTCACTATAGGG-3′ (forward) and 5′-TCATCTCGGCTCCATCGTTT-3′ (reverse). The PCR protocol was 94°C for 3 min, followed by 35 cycles of 94°C for 30 s, 60°C for 30 s, and 72°C for 30 s, with a final extension of 72°C for 3 min and a hold at 4°C. This protocol produces an ∼200 bp product, indicating the presence of the pten transgene.
Quantification of intracellular lipid droplets
For lipid droplet staining in AML12 cells, cells were grown on coverslips and transfected with siRNA when they reached 60% confluence. The next day, cells were transduced with lentivirus. On the third day after transfection, the cells were treated with bovine serum albumin (BSA; A1933; Sigma-Aldrich) or BSA conjugated to Oleic acid (112-80-1; Alfa Aesar) for 24 h. 4 d after lentiviral transduction, 5 μM BODIPY dye was added to the cell culture media and cells were incubated under normal conditions for 30 min. Cells were quickly rinsed in PBS and then fixed in 4% PFA for 10 min. Coverslips were rinsed twice with PBS, stained with Hoechst (94430; Sigma-Aldrich), and then mounted to microscope slides with mounting medium (E18-18; GBI Labs). Slides were dried overnight in a light-protected box at 4°C and were imaged the next day.
Western blotting
Western blotting was performed by standard protocol. Protein gel electrophoresis was performed on 15-well, 4–20% gradient gels (4561096; BioRad), with the manufacturer’s recommended Tris/Glycine/SDS running buffer, diluted to 1× (1610732; BioRad). Proteins were transferred onto PVDF membrane with 0.2 μm pore size (1620177; BioRad) to maximize the capture of small proteins, such as H3 and LC3. The transfer buffer was Tris/Glycine Buffer (1610734; BioRad), diluted to 1 × in 80%/20% (v/v) water/methanol (A412-4; Thermo Fisher Scientific). After the transfer, membranes were rinsed once with water and were placed in blocking buffer 1 × TBS, diluted from 10× stock (1706435; BioRad) plus 0.1% (v/v) Tween (P1379; Sigma-Aldric), plus 5% (w/v) dry milk powder (M17200; Research Products International), for 20 min, on a rotating platform. Membranes were cut to appropriate sizes and incubated overnight at 4°C, with rocking, in blocking buffer containing the primary antibodies described above. Membranes were washed once for 5 min in wash buffer (1 × TBS +0.1% [v/v] Tween). HRP-conjugated goat pAb targeting Rabbit IgG secondary antibody (ab6721; AbCam) was diluted in blocking buffer and incubated with membranes for 1 h, on a rotating platform. Membranes were quickly rinsed with water and washed once for 5 min in wash buffer before being imaged. The HRP substrate was EcoBright Femto (EBFH100; InnovSol). Images were acquired with a GE Healthcare ImageQuant LAS 4000, using the manufacturer’s ImageQuant LAS 4000 software. Files were saved as “.gel” format to preserve all metadata for analysis. Image analysis was performed in FIJI/ImageJ using the “Analyze Gels” function.
Statistical analysis
All statistical analysis and graph generation were performed with GraphPad Prism 8. Results of t tests and two-way ANOVAs are reported directly on the figures or in the figure legends. Unless otherwise stated, all t tests are unpaired. For data from mice, endpoints measured from male and female mice were compared by two-way ANOVA to check for a sex effect. When sex effects were not identified, the data were pooled.
Online supplemental material
This manuscript is accompanied by five supplementary figures. Fig. S1 contains data supporting Fig. 1. It shows the effects of PTEN on CMA in NIH3T3 cells. Fig. S2 contains data supporting Fig. 1. It shows that the effects of PTEN on CMA sensitive proteins are rescued by inhibiting lysosomal proteolysis or by knocking down Lamp2a. Fig. S3 contains data supporting Fig. 2. It shows that CMA activity and PTEN levels increase with confluence in AML12 cells. Fig. S4 contains data supporting Fig. 2. It contains additional controls for the effects of siPten on CMA. Fig. S5 contains data supporting Figs. 4, 5, and 9. It shows dose curves for Ipatasertib, controls for lysosome fractionation, and controls for BODIPY staining.
Data availability
Data are available from the corresponding author upon request.
Acknowledgments
We are very grateful to Manuel Serrano (Institute for Research in Biomedicine, Barcelona, Spain) and Daniel Herranz (Rutgers University, New Brunswick, NJ, USA) for creating and sharing PTEN OE mouse breeders, respectively. Surinder Kumar (University of Miami, Miami, FL, USA) provided training and experimental guidance for extracellular flux analysis using the Seahorse Analyzer. We thank the Miller lab mouse husbandry staff (University of Michigan, Ann Arbor, MI, USA) for the care and maintenance of the PTEN OE colony, especially Asuman Ilkim Erturk and Jacob Sheets, who managed the breeding, weaning, and genotyping of the PTEN OE colony.
This work was supported by the National Institutes of Health (NIH) grants U01-AG022303-18 and U19-AG023122-11 to R.A. Miller, by NIH grant 5P30-AG024824 to Raymond Yung, and with sub-awards to S.J. Endicott, by the Hevolution Foundation grant HF-AGE005 to S.J. Endicott, and by NIH grants R01-GM101171 and R01-CA253986 to D.B. Lombard.
Author contributions: K.K. Zhang performed experiments, performed data analysis, and prepared figures. C.M. Burns performed experiments, performed data analysis, and helped with the generation and validation of resources. M.E. Skinner performed experiments and generated and validated resources. D.B. Lombard contributed to the conceptualization of the project, experimental design, supervision, and funding acquisition. R.A. Miller contributed to the conceptualization of the project, experimental design, supervision, and funding acquisition. S.J. Endicott conceived the project, performed experiments, analyzed data, prepared figures, supervised the experiments, and acquired funding. S.J. Endicott wrote the paper with input from all authors.

