


Microvascular basement membrane (BM) plays a pivotal role in the interactions of astrocyte with endothelium to maintain the blood–brain barrier (BBB) homeostasis; however, the significance and precise regulation of the endothelial cell–derived BM component in the BBB remain incompletely understood. Here, we report that conditional knockout of Atg7 in endothelial cells (Atg7-ECKO) leads to astrocyte–microvascular disassociation in the brain. Our results reveal astrocytic endfeet detachment from microvessels and BBB leakage in Atg7-ECKO mice. Furthermore, we find that the absence of endothelial Atg7 downregulates the expression of fibronectin, a major BM component of the BBB, causing significantly reduced coverage of astrocytes along cerebral microvessels. We reveal Atg7 triggers the expression of endothelial fibronectin via regulating PKA activity to affect the phosphorylation of cAMP-responsive element-binding protein. These results suggest that Atg7-regulated endothelial fibronectin production is required for astrocytes adhesion to microvascular wall for maintaining the BBB homeostasis. Thus, endothelial Atg7 plays an essential role in astrocyte–endothelium interactions to maintain the BBB integrity.
Introduction
The blood–brain barrier (BBB) separates the central nervous system (CNS) from the circulating blood and maintains the homeostasis of the CNS microenvironment (Obermeier et al., 2013; Zhao et al., 2015). Disruption of the BBB is associated with various CNS diseases, including multiple sclerosis (Sweeney et al., 2019), Alzheimer’s disease (Sweeney et al., 2018), and ischemic stroke (Jiang et al., 2018; Yang et al., 2019), etc. The BBB is a unique multicellular microvascular structure, and its core anatomical element is brain microvascular endothelial cells (BMECs), which has continuous intercellular tight junctions to limit the paracellular movement of molecules through the BMEC layer (Obermeier et al., 2013; Wang et al., 2020; Zhao et al., 2015). The BBB endothelium is surrounded by a defined basement membrane (BM), pericytes, and astrocytic endfeet processes. The endfeet of astrocytes are closely wrapped around blood microvessels. Astrocyte–microvascular communication, i.e., the interactions of astrocytes with endothelial cells, is essential for the maintenance of BBB integrity (Guerit et al., 2021; Watkins et al., 2014).
Astrocyte–endothelial interactions mainly depend on extracellular secretory components (Guerit et al., 2021; Rui et al., 2019; Yao et al., 2014). Astrocytes maintain the barrier property of endothelial cells by secreting nutritional factors such as transforming growth factor β1, glial-derived neurotrophic factor, fibroblast growth factor, and angiopoietin-1 (McConnell et al., 2019). BMECs-derived leukemia inhibitory factor has been shown to induce astrocytic endfeet differentiation (Mi et al., 2001). In the BBB, BM is located at the interface between endothelial cells and astrocytes, and plays a vital role in astrocyte–microvascular interactions to maintain the BBB integrity. The BM is composed of multiple highly organized extracellular matrix proteins including collagen IV, laminins, nidogens, heparin sulfate proteoglycan, and fibronectin (Jayadev and Sherwood, 2017; Marchand et al., 2019; Pozzi et al., 2017; Thomsen et al., 2017). Col4a1 mutation causes cerebral vascular defects, such as cerebral hemorrhage and porencephaly (Gould et al., 2005; Gould et al., 2006). Laminin α2 isoform knockout mice develop defects in the BBB with changes in tight junction proteins and decreased pericyte coverage (Menezes et al., 2014; Thomsen et al., 2017). The extracellular matrix protein of the BM can be generated from BMECs, astrocytes, and pericytes. However, the role of the different cell-derived BM matrix components in maintaining the BBB remains incompletely understood.
Autophagy-related 7 gene (Atg7) is an E1-like ubiquitin-activating enzyme, and participates in two crucial ubiquitin-like modifications in the process of autophagy. Atg7 promotes microtubule-associated protein light chain 3 (LC3)-phosphatidylethanolamine and Atg12 conjugation, which facilitates the autophagy vesicles extension and autophagosomes maturation (Noda and Inagaki, 2015; Tanida et al., 1999; Xiong, 2015). Over the past decade, Atg7 has been shown to play an essential role in autophagy-related cell homeostasis. Atg7-deficient mice exhibit structural and starvation-induced impairment of autophagy and die shortly after birth (Komatsu et al., 2005). Endothelial-specific deletion of Atg7 in mice accelerates lung fibrosis via regulation of endothelial-to-mesenchymal transition (Singh et al., 2015), and attenuates arterial thrombosis through reducing the expression of tissue factors (Yau et al., 2017). We previously found that Atg7 can enhance NF-κB binding to IL-6 promoter to promote IL-6 transcription for the brain vascular angiogenesis (Zhuang et al., 2017).
Here, we report a novel role of Atg7 in regulating astrocyte–endothelial interactions at the BBB. Our results show that the endothelial loss of Atg7 leads to astrocytes detachment from cerebravessels and BBB leakage in mice. Based on transcriptome analysis and functional characterization, we found that Atg7 triggers the expression of fibronectin, a major BM component of the BBB, by directly regulating protein kinase A (PKA) activity to affect the activation of cAMP-responsive element-binding protein (CREB) transcription factors. Our results demonstrate that Atg7 is responsible for the endothelium-derived fibronectin production, which plays a critical role in astrocytes adhesion to microvessels for the maintenance of BBB integrity.
Results
Endothelial deletion of Atg7 causes BBB leakage in mice
To test whether endothelial Atg7 is involved in the maintenance of BBB integrity, we constructed a transgenic mouse line with endothelial cell (EC)–specific deletion of Atg7. The mice harboring LoxP-flanked Atg7 (Atg7loxP/loxP; Komatsu et al., 2005) were crossed with mice expressing Cre recombinase under the control of vascular endothelial cadherin (VE-cadherinCre/+) promoter, generating the mice with EC-specific deletion of Atg7 (Atg7loxP/loxP; VE-cadherinCre/+), named as Atg7-ECKO. The deficiency of Atg7 in the cerebral blood vessels was verified by immunostaining using the brain slices of Atg7-ECKO mice (Fig. 1 A and Fig. S1 A). Interestingly, we found obvious deposits of fibrinogen, indicator of plasma protein leakage, in the brain parenchyma outside of the blood vessels in Atg7-ECKO mice compared to controls (Fig. 1 B and Fig. S1 B), suggesting impairment of BBB integrity induced by Atg7 deletion. To further characterize the alterations of BBB permeability, different sizes of fluorescein (FITC)-labeled dextran were injected to the tail vein of mice and in vivo two-photon imaging (Fig. S1 C) was performed to assess the leakage of trace in the brain. We found that 40 kD (Fig. 1 C) and 70 kD (Fig. 1 D) FITC-dextran was accumulated in the perivascular region of brain parenchyma in Atg7-ECKO mice, but not in the control mice. In contrast, the 150 kD dextran was not detectable in the brain parenchyma of Atg7-ECKO mice (Fig. 1 E). Then, the 70 kD FITC-dextran was injected to the tail vein of mice and the brain homogenate was obtained to measure its leakage in the brain. We found that the concentration of FITC-dextran in the brain extract of Atg7-ECKO mice was higher than that in control mice (Fig. 1 F). We further found that the brain water content, an indicator of cerebral edema that may result from BBB disruption (Park et al., 2018), was increased in Atg7-ECKO mice compared to the control (Fig. 1 G).

Endothelial deletion of Atg7 causes BBB leakage in mice. (A) The brain slices were prepared from the Atg7-ECKO mice, with wild-type littermate as control. Immunostaining was performed with the antibodies recognizing Atg7 (green) and CD31 (red). The stained slices were mounted and visualized by confocal microscopy. The representative images of the cortex were presented (left). Scale bar, 10 μm. The vascular expression of Atg7 was quantified as relative level of Atg7 fluorescence intensity in the CD31 positive area (mean ± SD; right). n = 6. ***, P < 0.001. Unpaired two-tailed Student’s t test for comparison of two groups. (B) Immunofluorescence was performed with the brain slices from the Atg7-ECKO mice, with wild-type littermate as control. The slices were stained with antibodies against fibrinogen (green) and CD31 (red). The stained slices were mounted and visualized by confocal microscopy, and then the representative images of the cortex were presented (left). Scale bar, 20 μm. The fibrinogen positive area outside the blood vessels in the brain parenchyma was quantified (right). Data were shown as mean ± SD, n = 5. **, P < 0.01. Unpaired two-tailed Student’s t test for comparison of two groups. (C–E) The 2-mo-old Atg7-ECKO mice were used for in vivo two-photon imaging, with wild-type littermate as control. The thinned-skull cranial windows were prepared and covered with glass coverslip. The mice were anesthetized and head-fixed for imaging under two-photon microscope. The 40 kD (C), 70 kD (D), and 150 kD (E) FITC-dextran (0.25 mg/g body weight, dissolved in saline) were injected to the tail vein immediately before imaging. Time-lapse images were acquired with water immersion 20× objective excited by an 800 nm laser beam at indicated time points. Representative time-lapse images of the parietal cortex were provided (left). The area with dotted line indicated the extravascular FITC-dextran in the brain parenchyma. Scale bar, 50 μm. The relative changes of the extravascular FITC-dextran over time were measured as ΔF/F0 = (Ftime − F0)/F0, where Ftime is the fluorescence intensity at each time points and F0 is the initial fluorescence intensity (right). Data were shown as mean ± SD, n = 6. (F) 70-kD FITC-dextran (0.25 mg/g body weight) dissolved in saline was injected to the mice through the tail vein. 50 min later, the brains were harvested and homogenized, and the fluorescence intensity of FITC-dextran was measured by microplate reader. Data were normalized to control and presented as mean ± SD, n = 3. **, P < 0.01. Unpaired two-tailed Student′s t test for comparison of two groups. (G) The mice brain was harvested and weighed for wet weight. Then the brain was dried for 4 d at 85°C to measure the dry weight. Brain water content was calculated as (wet weight − dry weight)/wet weight × 100%. Data were shown as mean ± SD, n = 6. *, P < 0.05. Unpaired two-tailed t test for comparison of two groups. (H) The NOR test was performed to assess recognition memory performance in the Atg7-ECKO mice, with wild-type littermate as control. 24 h after habituation, the mice were trained in a 10-min-long session during which they were placed at the center of the box in the presence of two identical objects. 1 h after training, the mice were placed in the same box for the test session, in which one of the objects was replaced by a novel object. The representative motion tracks of the test session were showed (left). The recognition index was calculated by the ratio of the time spent exploring the novel object to the total time spent exploring both the novel and familiar objects (right). Data were shown as mean ± SD, n = 6. *, P < 0.05. Unpaired two-tailed Student’s t test for comparison of two groups. (I) The Y maze test was performed to assess spatial memory of the Atg7-ECKO mice, with wild-type littermate as control. The mice were trained for 10 min in both starting and familiar arms. 1 h later, the mice were returned to the maze at the starting arm, with free access to all three arms, and were allowed 5 min to explore the maze. The representative motion tracks of the test session were provided (left). The exploration ambulation, time, number in the novel arm was quantified in percent of both novel and familiar arms (right). Data were shown as mean ± SD, n = 6. *, P < 0.05. Unpaired two-tailed Student’s t test for comparison of two groups.
Endothelial deletion of Atg7 causes BBB leakage in mice. (A) The brain slices were prepared from the Atg7-ECKO mice, with wild-type littermate as control. Immunostaining was performed with the antibodies recognizing Atg7 (green) and CD31 (red). The stained slices were mounted and visualized by confocal microscopy. The representative images of the cortex were presented (left). Scale bar, 10 μm. The vascular expression of Atg7 was quantified as relative level of Atg7 fluorescence intensity in the CD31 positive area (mean ± SD; right). n = 6. ***, P < 0.001. Unpaired two-tailed Student’s t test for comparison of two groups. (B) Immunofluorescence was performed with the brain slices from the Atg7-ECKO mice, with wild-type littermate as control. The slices were stained with antibodies against fibrinogen (green) and CD31 (red). The stained slices were mounted and visualized by confocal microscopy, and then the representative images of the cortex were presented (left). Scale bar, 20 μm. The fibrinogen positive area outside the blood vessels in the brain parenchyma was quantified (right). Data were shown as mean ± SD, n = 5. **, P < 0.01. Unpaired two-tailed Student’s t test for comparison of two groups. (C–E) The 2-mo-old Atg7-ECKO mice were used for in vivo two-photon imaging, with wild-type littermate as control. The thinned-skull cranial windows were prepared and covered with glass coverslip. The mice were anesthetized and head-fixed for imaging under two-photon microscope. The 40 kD (C), 70 kD (D), and 150 kD (E) FITC-dextran (0.25 mg/g body weight, dissolved in saline) were injected to the tail vein immediately before imaging. Time-lapse images were acquired with water immersion 20× objective excited by an 800 nm laser beam at indicated time points. Representative time-lapse images of the parietal cortex were provided (left). The area with dotted line indicated the extravascular FITC-dextran in the brain parenchyma. Scale bar, 50 μm. The relative changes of the extravascular FITC-dextran over time were measured as ΔF/F0 = (Ftime − F0)/F0, where Ftime is the fluorescence intensity at each time points and F0 is the initial fluorescence intensity (right). Data were shown as mean ± SD, n = 6. (F) 70-kD FITC-dextran (0.25 mg/g body weight) dissolved in saline was injected to the mice through the tail vein. 50 min later, the brains were harvested and homogenized, and the fluorescence intensity of FITC-dextran was measured by microplate reader. Data were normalized to control and presented as mean ± SD, n = 3. **, P < 0.01. Unpaired two-tailed Student′s t test for comparison of two groups. (G) The mice brain was harvested and weighed for wet weight. Then the brain was dried for 4 d at 85°C to measure the dry weight. Brain water content was calculated as (wet weight − dry weight)/wet weight × 100%. Data were shown as mean ± SD, n = 6. *, P < 0.05. Unpaired two-tailed t test for comparison of two groups. (H) The NOR test was performed to assess recognition memory performance in the Atg7-ECKO mice, with wild-type littermate as control. 24 h after habituation, the mice were trained in a 10-min-long session during which they were placed at the center of the box in the presence of two identical objects. 1 h after training, the mice were placed in the same box for the test session, in which one of the objects was replaced by a novel object. The representative motion tracks of the test session were showed (left). The recognition index was calculated by the ratio of the time spent exploring the novel object to the total time spent exploring both the novel and familiar objects (right). Data were shown as mean ± SD, n = 6. *, P < 0.05. Unpaired two-tailed Student’s t test for comparison of two groups. (I) The Y maze test was performed to assess spatial memory of the Atg7-ECKO mice, with wild-type littermate as control. The mice were trained for 10 min in both starting and familiar arms. 1 h later, the mice were returned to the maze at the starting arm, with free access to all three arms, and were allowed 5 min to explore the maze. The representative motion tracks of the test session were provided (left). The exploration ambulation, time, number in the novel arm was quantified in percent of both novel and familiar arms (right). Data were shown as mean ± SD, n = 6. *, P < 0.05. Unpaired two-tailed Student’s t test for comparison of two groups.

Identification and characterization of the mice with endothelial deletion of Atg7. (A) The brain slices were prepared from the Atg7-ECKO mice, with wild-type littermate as control. Immunostaining was performed with the antibodies recognizing Atg7 (green) and CD31 (red). DAPI (blue) was used for counterstaining. The stained slices were mounted and visualized by confocal microscopy. The representative images of the cortex, hippocampus, and striatum were presented (left). Scale bar, 50 μm. The zoomed-in views (right) are the areas indicated by the dotted lines on the left. Scale bar, 10 μm. (B) Immunofluorescence was performed with the brain slices from the Atg7-ECKO mice, with wild-type littermate as control. The slices were stained with antibodies against fibrinogen (green) and CD31 (red). DAPI (blue) was used for counterstaining. The stained slices were mounted and visualized by confocal microscopy. The representative images of the cortex, hippocampus, and striatum were presented (left). Scale bar, 50 μm. The fibrinogen positive area outside the blood vessels in the brain parenchyma was quantified (right). Data were shown as mean ± SD, n = 4. **, P < 0.01. ***, P < 0.001. Unpaired two-tailed Student’s t test for comparison of two groups. (C) Schematic diagram of the two-photon imaging system for in vivo imaging of cerebral blood vessels in mice. Mice were anesthetized and the cranium was firmly secured in a stereotaxic frame. The dental drill was then used to create a thinned-skull circular cranial window (4 mm in diameter) over the parietal cortex. A sterile 3 mm glass coverslip was then placed above the thinned-skull and sealed with 3 M Vetbond tissue adhesive. After recovering for 3 d, in vivo time-lapse images were acquired at 5, 10, 15, 20, 30, 40, 50, 60, 70, 80, 90 min after FITC-dextran injection with two-photon microscope (Zeiss LSM880). (D) The brain slices were prepared from the Atg7-ECKO mice, with wild-type littermate as control. Immunostaining was performed with the antibodies recognizing NeuN (a neuronal marker, green). The stained slices were mounted and visualized by confocal microscopy. The representative images of the hippocampus were presented (left). Scale bar, 50 μm. The number of NeuN+ cells was quantified (right). Data were shown as mean ± SD, n = 4. *, P < 0.05. Unpaired two-tailed Student’s t test for comparison of two groups. (E) The brain slices were prepared from the Atg7-ECKO mice, with wild-type littermate as control. Immunostaining was performed with the antibodies recognizing fibronectin (FN; green) and CD31 (red). DAPI (blue) was used for counterstaining. The stained slices were mounted and visualized by confocal microscopy. The representative images of the cortex were presented (left). Scale bar, 20 μm. The vascular expression of fibronectin was quantified as relative level of fibronectin fluorescence intensity in the CD31 positive area (mean ± SD, n = 3; right). The ns represents no statistical significance. *, P < 0.05. Unpaired two-tailed Student’s t test for comparison of two groups.
Identification and characterization of the mice with endothelial deletion of Atg7. (A) The brain slices were prepared from the Atg7-ECKO mice, with wild-type littermate as control. Immunostaining was performed with the antibodies recognizing Atg7 (green) and CD31 (red). DAPI (blue) was used for counterstaining. The stained slices were mounted and visualized by confocal microscopy. The representative images of the cortex, hippocampus, and striatum were presented (left). Scale bar, 50 μm. The zoomed-in views (right) are the areas indicated by the dotted lines on the left. Scale bar, 10 μm. (B) Immunofluorescence was performed with the brain slices from the Atg7-ECKO mice, with wild-type littermate as control. The slices were stained with antibodies against fibrinogen (green) and CD31 (red). DAPI (blue) was used for counterstaining. The stained slices were mounted and visualized by confocal microscopy. The representative images of the cortex, hippocampus, and striatum were presented (left). Scale bar, 50 μm. The fibrinogen positive area outside the blood vessels in the brain parenchyma was quantified (right). Data were shown as mean ± SD, n = 4. **, P < 0.01. ***, P < 0.001. Unpaired two-tailed Student’s t test for comparison of two groups. (C) Schematic diagram of the two-photon imaging system for in vivo imaging of cerebral blood vessels in mice. Mice were anesthetized and the cranium was firmly secured in a stereotaxic frame. The dental drill was then used to create a thinned-skull circular cranial window (4 mm in diameter) over the parietal cortex. A sterile 3 mm glass coverslip was then placed above the thinned-skull and sealed with 3 M Vetbond tissue adhesive. After recovering for 3 d, in vivo time-lapse images were acquired at 5, 10, 15, 20, 30, 40, 50, 60, 70, 80, 90 min after FITC-dextran injection with two-photon microscope (Zeiss LSM880). (D) The brain slices were prepared from the Atg7-ECKO mice, with wild-type littermate as control. Immunostaining was performed with the antibodies recognizing NeuN (a neuronal marker, green). The stained slices were mounted and visualized by confocal microscopy. The representative images of the hippocampus were presented (left). Scale bar, 50 μm. The number of NeuN+ cells was quantified (right). Data were shown as mean ± SD, n = 4. *, P < 0.05. Unpaired two-tailed Student’s t test for comparison of two groups. (E) The brain slices were prepared from the Atg7-ECKO mice, with wild-type littermate as control. Immunostaining was performed with the antibodies recognizing fibronectin (FN; green) and CD31 (red). DAPI (blue) was used for counterstaining. The stained slices were mounted and visualized by confocal microscopy. The representative images of the cortex were presented (left). Scale bar, 20 μm. The vascular expression of fibronectin was quantified as relative level of fibronectin fluorescence intensity in the CD31 positive area (mean ± SD, n = 3; right). The ns represents no statistical significance. *, P < 0.05. Unpaired two-tailed Student’s t test for comparison of two groups.
The fibrinogen leakage in the hippocampus of Atg7-ECKO mice (Fig. S1 B), together with the report that the disruption of BBB was found to be an early marker of cognitive impairment (Nation et al., 2019), prompted us to measure the effect of endothelial Atg7 depletion on cognitive performance. We assessed the cognitive behavior of Atg7-ECKO mice by novel object recognition (NOR) and Y maze test. Using NOR test, we found that Atg7-ECKO mice spent less time in exploring the novel object than control mice (Fig. 1 H). The results from Y maze test showed that the Atg7-ECKO mice exhibited a tendency to spend less time in the novel arm than in the other arms compared to control mice (Fig. 1 I). The results of behavioral tests revealed a memory deficit in Atg7-ECKO mice. These data suggested that endothelial Atg7 is involved in the maintenance of BBB integrity.
Detachment of astrocytic endfeet from cerebral microvessels in mice with endothelial deletion of Atg7
To investigate the mechanism of BBB disruption caused by Atg7 knockout, the expression of occludin and claudin-5, the major molecular constituents of tight junctions in the BBB (Zhao et al., 2015), were examined by Western blot using the brain microvessel lysate of Atg7-ECKO mice. The results showed that the expression of occludin and claudin-5 remained unchanged in Atg7-ECKO mice compared with that in the control mice (Fig. 2 A). Consistently, occludin and claudin-5 protein expression was not altered in Atg7-deficient human brain microvascular endothelial cells (HBMECs; Fig. S2 B). We further isolated the microvessels from the Atg7-ECKO mice brain and the total RNA was extracted for quantitative PCR (qPCR), and the results showed that the mRNA levels of occludin and claudin-5 remained unchanged by Atg7 knockout (Fig. 2 B). Further results showed that the subcellular distribution of occludin and claudin-5 remained unchanged by Atg7 depletion (Fig. S2 C). These suggested that the increased BBB permeability in Atg7-ECKO mice was not caused by the expression alterations of tight junction proteins.
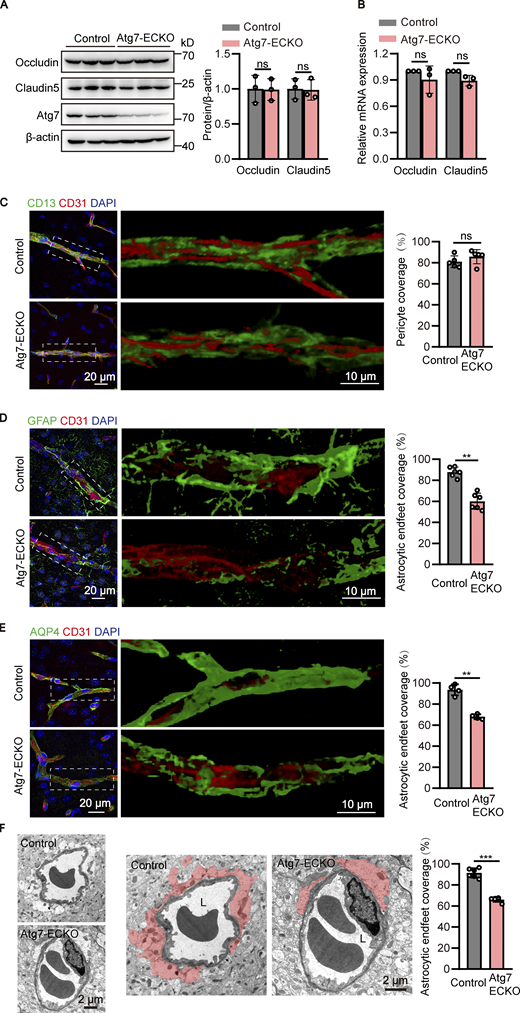
Detachment of astrocytic endfeet from cerebral microvessels in mice with endothelial deletion of Atg7. (A) The brain microvessel lysate were obtained from Atg7-ECKO mice, with wild-type littermate as control. The expression of occludin and claudin-5 were analyzed by Western blot, with β-actin as an internal loading control. The band densities were quantified by ImageJ software and normalized to the control. Data were shown as mean ± SD (n = 3). The ns represents no statistical significance. Unpaired two-tailed Student’s t test for comparison of two groups. (B) Brain microvessels were isolated from Atg7-ECKO mice, with wild-type littermate as control. The mRNA levels of occludin and claudin-5 were analyzed by RT-qPCR, with β-actin used as an internal control. Data were shown as the mean ± SD (n = 3). The ns represents no statistical significance. Unpaired two-tailed Student’s t test for comparison of two groups. (C) The brain slices were prepared from the Atg7-ECKO mice, with wild-type littermate as control. Immunostaining was performed with the antibodies against CD13 (green, a pericyte marker) and CD31 (red). DAPI (blue) was used for counterstaining. The stained slices were mounted and visualized by z-stack confocal imaging with 63× objective. The representative images of the cortex were presented (left). The zoomed-in views (middle) show the 3D reconstruction of CD13+ pericytes (green) covering CD31+ vessels (red). The pericyte coverage along the vessels was quantified by dividing the total area of the vessels by the area of the pericyte in contact with the vessels (right). For quantifications, 30 vessels from five mice were analyzed in each group (right). Data were shown as mean ± SD (n = 5). The ns represents no statistical significance. Unpaired two-tailed Student’s t test for comparison of two groups. (D and E) Similar experiments were performed as in C, except that the CD13 antibody was replaced by GFAP (astrocyte marker; D) or AQP4 (astrocytic endfeet marker; E). For quantifications, 30 vessels from six or four mice were analyzed in each group. Data were shown as mean ± SD (n = 6, D; n = 4, E). **, P < 0.01. Unpaired two-tailed Student’s t test for comparison of two groups. (F) The brain cortex samples from the Atg7-ECKO mice were subjected to TEM analysis, with wild-type littermate as control. Representative electron micrograph of perivascular astrocytes was provided (left). The zoomed-in views (middle) show astrocytic endfeet (shaded in red) covering vessels. L, the lumen of the blood microvessels. The astrocytic endfeet coverage around the vessels was calculated as the length of the lumen in contact with the red shaded part divided by the total length of the lumen (right). For quantifications, 30 vessels from six mice were analyzed in each group (right). Data were shown as mean ± SD (n = 6). ***, P < 0.001. Unpaired two-tailed Student’s t test for comparison of two groups. Source data are available for this figure: SourceData F2.
Detachment of astrocytic endfeet from cerebral microvessels in mice with endothelial deletion of Atg7. (A) The brain microvessel lysate were obtained from Atg7-ECKO mice, with wild-type littermate as control. The expression of occludin and claudin-5 were analyzed by Western blot, with β-actin as an internal loading control. The band densities were quantified by ImageJ software and normalized to the control. Data were shown as mean ± SD (n = 3). The ns represents no statistical significance. Unpaired two-tailed Student’s t test for comparison of two groups. (B) Brain microvessels were isolated from Atg7-ECKO mice, with wild-type littermate as control. The mRNA levels of occludin and claudin-5 were analyzed by RT-qPCR, with β-actin used as an internal control. Data were shown as the mean ± SD (n = 3). The ns represents no statistical significance. Unpaired two-tailed Student’s t test for comparison of two groups. (C) The brain slices were prepared from the Atg7-ECKO mice, with wild-type littermate as control. Immunostaining was performed with the antibodies against CD13 (green, a pericyte marker) and CD31 (red). DAPI (blue) was used for counterstaining. The stained slices were mounted and visualized by z-stack confocal imaging with 63× objective. The representative images of the cortex were presented (left). The zoomed-in views (middle) show the 3D reconstruction of CD13+ pericytes (green) covering CD31+ vessels (red). The pericyte coverage along the vessels was quantified by dividing the total area of the vessels by the area of the pericyte in contact with the vessels (right). For quantifications, 30 vessels from five mice were analyzed in each group (right). Data were shown as mean ± SD (n = 5). The ns represents no statistical significance. Unpaired two-tailed Student’s t test for comparison of two groups. (D and E) Similar experiments were performed as in C, except that the CD13 antibody was replaced by GFAP (astrocyte marker; D) or AQP4 (astrocytic endfeet marker; E). For quantifications, 30 vessels from six or four mice were analyzed in each group. Data were shown as mean ± SD (n = 6, D; n = 4, E). **, P < 0.01. Unpaired two-tailed Student’s t test for comparison of two groups. (F) The brain cortex samples from the Atg7-ECKO mice were subjected to TEM analysis, with wild-type littermate as control. Representative electron micrograph of perivascular astrocytes was provided (left). The zoomed-in views (middle) show astrocytic endfeet (shaded in red) covering vessels. L, the lumen of the blood microvessels. The astrocytic endfeet coverage around the vessels was calculated as the length of the lumen in contact with the red shaded part divided by the total length of the lumen (right). For quantifications, 30 vessels from six mice were analyzed in each group (right). Data were shown as mean ± SD (n = 6). ***, P < 0.001. Unpaired two-tailed Student’s t test for comparison of two groups. Source data are available for this figure: SourceData F2.
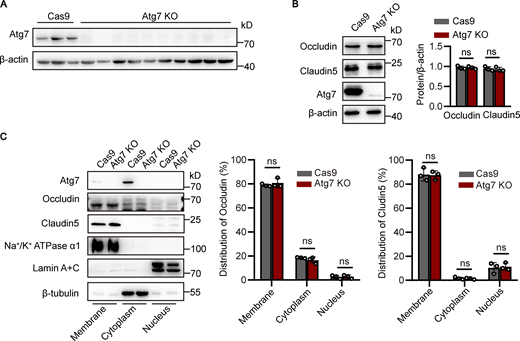
Atg7 deletion in HBMECs reduces the expression of fibronectin but not occludin and claudin-5. (A) Atg7-knockout (KO) of HBMECs were constructed using CRISPR/Cas9-mediated genome editing in vitro. HBMECs were infected by lentivirus containing the cDNA of Cas9 together with sgRNA targeting the first exon of Atg7. 48 h after infection, blasticidin (3 μg/ml) and puromycin (1 μg/ml) were used for screening of positive infected cells. The cells were collected for protein extraction, and Western blot was performed to detect the knockout effect of Atg7 in HBMECs. Lentivirus containing the cDNA of Cas9 alone was used as a control. (B) The cells were lysed, and Western blot was performed to determine the protein levels of occludin and claudin-5 in Atg7 KO HBMECs, with HBMECs transfected with Cas9 alone as control. β-Actin was used as an internal loading control. The band densities were quantified by ImageJ software and normalized to the control. Data were shown as mean ± SD (n = 3). The ns represents no statistical significance. Unpaired two-tailed Student’s t test for comparison of two groups. (C) The subcellular fractions, including membrane, cytoplasm, and nucleus fractions, were extracted from the Atg7-KO HBMECs and the control cells using the Minute Plasma Membrane Protein Isolation and Cell Fractionation Kit (Invent Biotechnologies) according to the manufacturer’s instructions. Western blot was performed to determine subcellular distribution of occludin and claudin-5 in the cells. Na+/K+ ATPase α1, lamin A+C, and β-tubulin were detected as the marker for membrane, cytoplasm, and nucleus, respectively. The band densities were quantified by ImageJ software. The distribution of occludin and claudin-5 in each fraction was calculated as the percentage of total. Data were shown as mean ± SD (n = 3). The ns represents no statistical significance. Unpaired two-tailed Student’s t test for comparison of two groups. Source data are available for this figure: SourceData FS2.
Atg7 deletion in HBMECs reduces the expression of fibronectin but not occludin and claudin-5. (A) Atg7-knockout (KO) of HBMECs were constructed using CRISPR/Cas9-mediated genome editing in vitro. HBMECs were infected by lentivirus containing the cDNA of Cas9 together with sgRNA targeting the first exon of Atg7. 48 h after infection, blasticidin (3 μg/ml) and puromycin (1 μg/ml) were used for screening of positive infected cells. The cells were collected for protein extraction, and Western blot was performed to detect the knockout effect of Atg7 in HBMECs. Lentivirus containing the cDNA of Cas9 alone was used as a control. (B) The cells were lysed, and Western blot was performed to determine the protein levels of occludin and claudin-5 in Atg7 KO HBMECs, with HBMECs transfected with Cas9 alone as control. β-Actin was used as an internal loading control. The band densities were quantified by ImageJ software and normalized to the control. Data were shown as mean ± SD (n = 3). The ns represents no statistical significance. Unpaired two-tailed Student’s t test for comparison of two groups. (C) The subcellular fractions, including membrane, cytoplasm, and nucleus fractions, were extracted from the Atg7-KO HBMECs and the control cells using the Minute Plasma Membrane Protein Isolation and Cell Fractionation Kit (Invent Biotechnologies) according to the manufacturer’s instructions. Western blot was performed to determine subcellular distribution of occludin and claudin-5 in the cells. Na+/K+ ATPase α1, lamin A+C, and β-tubulin were detected as the marker for membrane, cytoplasm, and nucleus, respectively. The band densities were quantified by ImageJ software. The distribution of occludin and claudin-5 in each fraction was calculated as the percentage of total. Data were shown as mean ± SD (n = 3). The ns represents no statistical significance. Unpaired two-tailed Student’s t test for comparison of two groups. Source data are available for this figure: SourceData FS2.
Considering that the BBB permeability is also regulated by low rate of caveolin-mediated transcytosis (Andreone et al., 2017; Ben-Zvi et al., 2014), we analyzed the expression of Cav-1 and Mfsd2a reported to be associated with caveolae-mediated transport (Andreone et al., 2017; Wood et al., 2021). The results showed that the expression of Cav-1 and Mfsd2a remained unchanged in the Atg7-deficient group compared to control in vitro and in vivo (Fig. S3, A–C). Further results from transmission electron microscopy (TEM) revealed that the number of caveolae vesicles in the endothelium remained unchanged in the Atg7-ECKO mice compared to control (Fig. S3 D). These data demonstrated that the increased BBB permeability in Atg7-ECKO mice was not caused by the caveolin-mediated transcytosis.
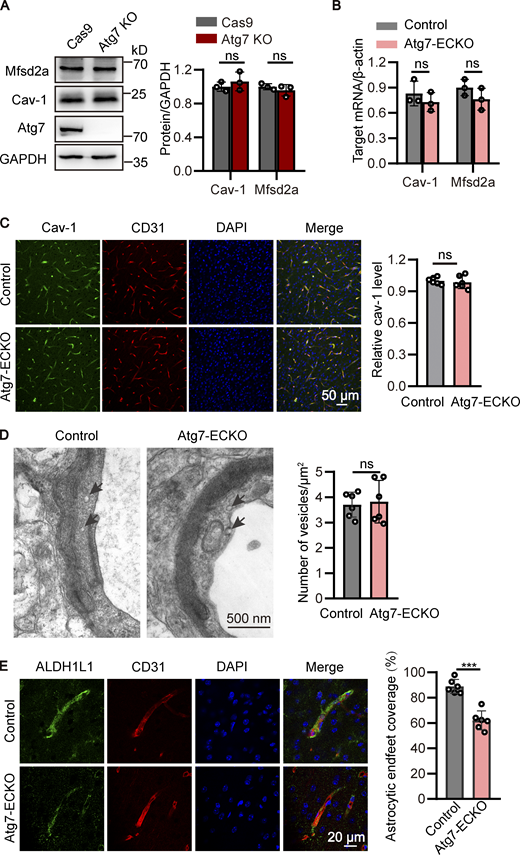
Atg7 deletion has no effect on caveolae-mediated transcytosis. (A) The cells were lysed, and Western blot was performed to determine the protein levels of Cav-1 and Mfsd2a in Atg7-knockout (KO) HBMECs, with HBMECs transfected with Cas9 alone as control. GAPDH was used as an internal loading control. The band densities were quantified by ImageJ software and normalized to the control. Data were shown as mean ± SD (n = 3). The ns represents no statistical significance. Unpaired two-tailed Student’s t test for comparison of two groups. (B) Brain microvessels were isolated from Atg7-ECKO mice, with wild-type littermate as control. The mRNA levels of Cav-1 and Mfsd2a were analyzed by qRT-PCR, with β-actin used as an internal control. Data were shown as the mean ± SD (n = 3). The ns represents no statistical significance. Unpaired two-tailed Student’s t test for comparison of two groups. (C) The brain slices were prepared from the Atg7-ECKO mice, with wild-type littermate as control. Immunostaining was performed with the antibodies recognizing Cav-1 (green) and CD31 (red). DAPI (blue) was used for counterstaining. The stained slices were mounted and visualized by confocal microscopy. The representative images of the cortex were presented (left). Scale bar, 50 μm. The vascular expression of Cav-1 was quantified as relative level of Cav-1 fluorescence intensity in the CD31 positive area (mean ± SD; right). n = 6. The ns represents no statistical significance. Unpaired two-tailed Student’s t test for comparison of two groups. (D) The cerebral cortex from the Atg7-ECKO mice were subjected to TEM analysis, with wild-type littermate as control. Representative electron micrograph of caveolae vesicles (arrows) in the endothelium were provided (left). Scale bar, 500 nm. The number of vesicles was quantified (right). 30 vessels from six mice were used for statistical analysis. Data were shown as mean ± SD, n = 6. The ns represents no statistical significance. Unpaired two-tailed Student’s t test for comparison of two groups. (E) The brain slices were prepared from the Atg7-ECKO mice, with wild-type littermate as control. Immunostaining was performed with the antibodies recognizing ALDH1L1 (green) and CD31 (red). DAPI (blue) was used for counterstaining. The stained slices were mounted and visualized by confocal microscopy. The representative images of the cortex were presented (left). Scale bar, 20 μm. The astrocytic endfeet coverage along the vessels was quantified by dividing the total area of the vessels by the area of the astrocytes in contact with the vessels (right). Data were shown as mean ± SD (n = 6). ***, P < 0.001. Unpaired two-tailed Student’s t test for comparison of two groups. Source data are available for this figure: SourceData FS3.
Atg7 deletion has no effect on caveolae-mediated transcytosis. (A) The cells were lysed, and Western blot was performed to determine the protein levels of Cav-1 and Mfsd2a in Atg7-knockout (KO) HBMECs, with HBMECs transfected with Cas9 alone as control. GAPDH was used as an internal loading control. The band densities were quantified by ImageJ software and normalized to the control. Data were shown as mean ± SD (n = 3). The ns represents no statistical significance. Unpaired two-tailed Student’s t test for comparison of two groups. (B) Brain microvessels were isolated from Atg7-ECKO mice, with wild-type littermate as control. The mRNA levels of Cav-1 and Mfsd2a were analyzed by qRT-PCR, with β-actin used as an internal control. Data were shown as the mean ± SD (n = 3). The ns represents no statistical significance. Unpaired two-tailed Student’s t test for comparison of two groups. (C) The brain slices were prepared from the Atg7-ECKO mice, with wild-type littermate as control. Immunostaining was performed with the antibodies recognizing Cav-1 (green) and CD31 (red). DAPI (blue) was used for counterstaining. The stained slices were mounted and visualized by confocal microscopy. The representative images of the cortex were presented (left). Scale bar, 50 μm. The vascular expression of Cav-1 was quantified as relative level of Cav-1 fluorescence intensity in the CD31 positive area (mean ± SD; right). n = 6. The ns represents no statistical significance. Unpaired two-tailed Student’s t test for comparison of two groups. (D) The cerebral cortex from the Atg7-ECKO mice were subjected to TEM analysis, with wild-type littermate as control. Representative electron micrograph of caveolae vesicles (arrows) in the endothelium were provided (left). Scale bar, 500 nm. The number of vesicles was quantified (right). 30 vessels from six mice were used for statistical analysis. Data were shown as mean ± SD, n = 6. The ns represents no statistical significance. Unpaired two-tailed Student’s t test for comparison of two groups. (E) The brain slices were prepared from the Atg7-ECKO mice, with wild-type littermate as control. Immunostaining was performed with the antibodies recognizing ALDH1L1 (green) and CD31 (red). DAPI (blue) was used for counterstaining. The stained slices were mounted and visualized by confocal microscopy. The representative images of the cortex were presented (left). Scale bar, 20 μm. The astrocytic endfeet coverage along the vessels was quantified by dividing the total area of the vessels by the area of the astrocytes in contact with the vessels (right). Data were shown as mean ± SD (n = 6). ***, P < 0.001. Unpaired two-tailed Student’s t test for comparison of two groups. Source data are available for this figure: SourceData FS3.
Accumulating evidences revealed that pericytes (Armulik et al., 2010; Daneman et al., 2010; Sweeney et al., 2016; Villasenor et al., 2017) and astrocytes (Abbott et al., 2006; Watkins et al., 2014; Yao et al., 2014) surrounding cerebral microvessels play a critical role in maintaining the integrity of BBB. To visualize the pericytes surrounding the microvessels, z-stack confocal imaging with 63× objective was performed using the brain slices immunostained with CD31 (an endothelial marker) and CD13 (a pericyte marker), followed by 3D reconstruction. The results showed that the pericyte coverage in the brain microvessels of Atg7-ECKO mice appeared similar to that in littermate control mice (Fig. 2 C). Then we sought to analyze the covering of astrocytes around the microvessels by immunostaining of brain slices with glial fibrillary acidic protein (GFAP) or ALDH1L1 (an astrocyte marker) together with CD31. We found the astrocytes along the brain microvessels were significantly reduced in Atg7-ECKO mice compared to the control (Fig. 2 D and Fig. S3 E). Furthermore, the brain slices were immunostained with CD31 and AQP4 which are enriched around astrocytic endfeet at the BBB (Ikeshima-Kataoka, 2016), followed by z-stack confocal imaging and 3D reconstruction. We found the astrocytic endfeet ensheathing the brain microvessels was significantly reduced in Atg7-ECKO mice compared to the control (Fig. 2 E). To further characterize the perivascular coverage of astrocytes, TEM was used to examine the astrocyte–vascular interactions in the mouse brain tissues. The results showed that the adhesion of astrocytic endfeet to the brain microvessels were significantly reduced in Atg7-ECKO mice compared with littermate control mice (Fig. 2 F). These data indicated that knockout of Atg7 in the brain endothelium causes astrocytic endfeet detachment from the microvasculature, thus leading to the leakage of BBB.
Knockout of Atg7 downregulates fibronectin in brain endothelial cells
To dissect the molecular mechanism underlying the detachment of astrocytic endfeet from the microvasculature induced by endothelial deletion of Atg7, we performed high-throughput transcriptome analysis to examine the transcriptional alterations in Atg7-depleted HBMECs. We found that the expression level of fibronectin, a component of BM of BBB mediating cell adhesion (Lu et al., 2020a; Zollinger and Smith, 2017), was downregulated by Atg7 depletion (Table S1). Then, we established HBMECs cell lines with Atg7 deletion by CRISPR/Cas9-mediated genome editing (Fig. S2 A), and the qPCR and Western blot results demonstrated that both the mRNA and protein levels of fibronectin were significantly downregulated by Atg7 knockout (Fig. 3, A and B). Immunofluorescence results revealed the reduction of cellular fibronectin in Atg7-deleted HBMECs (Fig. 3 C). Then, the extracellular matrix was extracted for Western blot analysis and we found that the extracellular fibronectin was consistently reduced in Atg7-deleted HBMECs compared to control (Fig. 3 D). To verify these in vitro findings, the expression of fibronectin in the brain microvessels of Atg7-ECKO mice was examined by immunostaining. We found an obvious reduction of vascular fibronectin expression in the brain of Atg7-ECKO mice compared to control mice (Fig. 3 E). We further isolated microvessels from the mice brain to perform qPCR analysis and the results showed that fibronectin mRNA levels were significantly decreased in Atg7-ECKO mice compared to control (Fig. 3 F). In contrast, the mRNA and protein levels of collagen IV and laminin subtypes (laminin α4, α5, β1, and γ1), the major components of the BM of BBB (Jayadev and Sherwood, 2017; Xu et al., 2018), remained unchanged in the microvessels of Atg7-ECKO mice (Fig. 3, F–H). Furthermore, the Atg7-knockout HBMECs were infected with adenovirus containing the full-length Atg7 cDNA to restore the expression of Atg7, and then the expression of fibronectin was analyzed. The Western blot and immunofluorescence results showed that the reduced fibronectin caused by Atg7 depletion was effectively rescued by exogenously expressed Atg7 (Fig. 3, I and J). These data demonstrated that Atg7 is indeed necessary for the expression of fibronectin in brain endothelial cells.
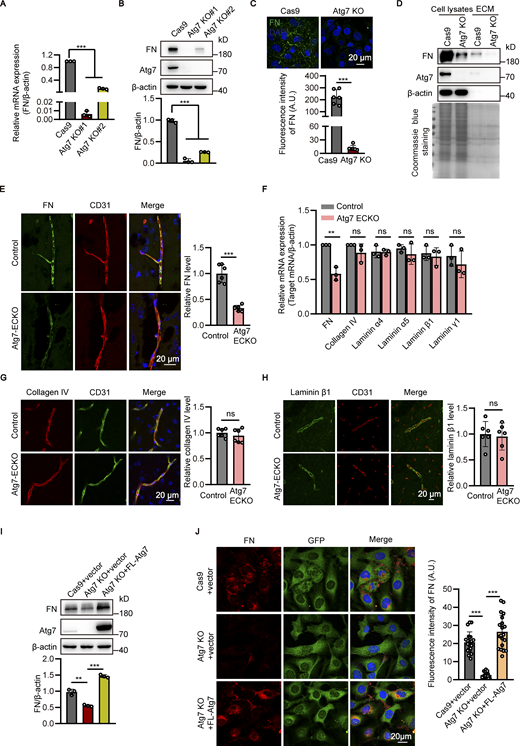
Knockout of Atg7 downregulates fibronectin in brain endothelial cells. (A) The mRNA levels of fibronectin (FN) in the CRISPR/Cas9-mediated Atg7-knockout (KO) HBMECs were determined by RT-qPCR, with Cas9-only as control. The β-actin was used as an internal control. Data were shown as mean ± SD (n = 3). ***, P < 0.001. Statistics were calculated by one-way ANOVA coupled with Dunnett’s post hoc test. (B) The cells were lysed and Western blot was performed to determine the protein levels of fibronectin in Atg7-knockout HBMECs, with β-actin as an internal loading control. The band densities were quantified by ImageJ software and normalized to the Cas9-only control cells. Data were shown as mean ± SD (n = 3). ***, P < 0.001. Statistics were calculated by one-way ANOVA coupled with Dunnett’s post hoc test. (C) The Atg7-KO HBMECs were seeded on coverslips and immunofluorescence was performed with antibody against fibronectin (green), with HBMECs transfected with Cas9 alone as control. DAPI (blue) was used for counterstaining. The representative images were presented (top). The fluorescence intensity of fibronectin was quantified (bottom). Data were shown as the mean ± SD (n = 6). ***, P < 0.001. Unpaired two-tailed Student’s t test for comparison of two groups. (D) The extracellular matrix (ECM) protein and total protein of the HBMECs were extracted, and Western blot was performed to determine the levels of fibronectin and Atg7 using β-actin as an internal loading control. The result of Coomassie blue staining was shown on the bottom, indicating consistent loading. (E) The brain slices were prepared from the Atg7-ECKO mice, with wild-type littermate as control. Immunostaining was performed with the antibodies recognizing fibronectin (green) and CD31 (red). DAPI (blue) was used for counterstaining. The stained slices were mounted and visualized by confocal microscopy. The representative images of the cortex were presented (left). The vascular expression of fibronectin was quantified as relative level of fibronectin fluorescence intensity in the CD31 positive area (mean ± SD, n = 6; right). ***, P < 0.001. Unpaired two-tailed Student’s t test for comparison of two groups. (F) Brain microvessels were isolated from Atg7-ECKO mice, with wild-type littermate as control. The mRNA levels of fibronectin, collagen IV, laminin subtypes (laminin α4, α5, β1, and γ1) were determined by RT-qPCR. β-Actin was used as an internal control. Data were shown as the mean ± SD (n = 3). **, P < 0.01. The ns represents no statistical significance. Unpaired two-tailed Student’s t test for comparison of two groups. (G and H) Similar experiments were performed as in E, except that the fibronectin antibody was replaced by collagen IV (G) or laminin β1 (H). The ns represents no statistical significance (n = 6). Unpaired two-tailed Student’s t test for comparison of two groups. (I and J) Full-length (FL) Atg7 cDNA was transfected to Atg7-KO HBMECs by adenovirus containing GFP, with adenovirus empty vector as control. 48 h after transfection, (I) the cells were lysed, and Western blot was performed to analyze the expression of fibronectin, using β-actin as an internal loading control. The band densities were quantified by ImageJ software and normalized to the control cells transfected with empty vector. Data were shown as mean ± SD (n = 3). **, P < 0.01. ***, P < 0.001. Statistics were calculated by one-way ANOVA coupled with Dunnett’s post hoc test. (J) Left: Immunofluorescence was conducted with antibody against fibronectin (red). DAPI (blue) was used for counterstaining (left). The cells were analyzed for fluorescence intensity of fibronectin (right, at least 20 cells per group). Data were shown as mean ± SD. ***, P < 0.001. Statistics were calculated by one-way ANOVA coupled with Dunnett’s post hoc test. Source data are available for this figure: SourceData F3.
Knockout of Atg7 downregulates fibronectin in brain endothelial cells. (A) The mRNA levels of fibronectin (FN) in the CRISPR/Cas9-mediated Atg7-knockout (KO) HBMECs were determined by RT-qPCR, with Cas9-only as control. The β-actin was used as an internal control. Data were shown as mean ± SD (n = 3). ***, P < 0.001. Statistics were calculated by one-way ANOVA coupled with Dunnett’s post hoc test. (B) The cells were lysed and Western blot was performed to determine the protein levels of fibronectin in Atg7-knockout HBMECs, with β-actin as an internal loading control. The band densities were quantified by ImageJ software and normalized to the Cas9-only control cells. Data were shown as mean ± SD (n = 3). ***, P < 0.001. Statistics were calculated by one-way ANOVA coupled with Dunnett’s post hoc test. (C) The Atg7-KO HBMECs were seeded on coverslips and immunofluorescence was performed with antibody against fibronectin (green), with HBMECs transfected with Cas9 alone as control. DAPI (blue) was used for counterstaining. The representative images were presented (top). The fluorescence intensity of fibronectin was quantified (bottom). Data were shown as the mean ± SD (n = 6). ***, P < 0.001. Unpaired two-tailed Student’s t test for comparison of two groups. (D) The extracellular matrix (ECM) protein and total protein of the HBMECs were extracted, and Western blot was performed to determine the levels of fibronectin and Atg7 using β-actin as an internal loading control. The result of Coomassie blue staining was shown on the bottom, indicating consistent loading. (E) The brain slices were prepared from the Atg7-ECKO mice, with wild-type littermate as control. Immunostaining was performed with the antibodies recognizing fibronectin (green) and CD31 (red). DAPI (blue) was used for counterstaining. The stained slices were mounted and visualized by confocal microscopy. The representative images of the cortex were presented (left). The vascular expression of fibronectin was quantified as relative level of fibronectin fluorescence intensity in the CD31 positive area (mean ± SD, n = 6; right). ***, P < 0.001. Unpaired two-tailed Student’s t test for comparison of two groups. (F) Brain microvessels were isolated from Atg7-ECKO mice, with wild-type littermate as control. The mRNA levels of fibronectin, collagen IV, laminin subtypes (laminin α4, α5, β1, and γ1) were determined by RT-qPCR. β-Actin was used as an internal control. Data were shown as the mean ± SD (n = 3). **, P < 0.01. The ns represents no statistical significance. Unpaired two-tailed Student’s t test for comparison of two groups. (G and H) Similar experiments were performed as in E, except that the fibronectin antibody was replaced by collagen IV (G) or laminin β1 (H). The ns represents no statistical significance (n = 6). Unpaired two-tailed Student’s t test for comparison of two groups. (I and J) Full-length (FL) Atg7 cDNA was transfected to Atg7-KO HBMECs by adenovirus containing GFP, with adenovirus empty vector as control. 48 h after transfection, (I) the cells were lysed, and Western blot was performed to analyze the expression of fibronectin, using β-actin as an internal loading control. The band densities were quantified by ImageJ software and normalized to the control cells transfected with empty vector. Data were shown as mean ± SD (n = 3). **, P < 0.01. ***, P < 0.001. Statistics were calculated by one-way ANOVA coupled with Dunnett’s post hoc test. (J) Left: Immunofluorescence was conducted with antibody against fibronectin (red). DAPI (blue) was used for counterstaining (left). The cells were analyzed for fluorescence intensity of fibronectin (right, at least 20 cells per group). Data were shown as mean ± SD. ***, P < 0.001. Statistics were calculated by one-way ANOVA coupled with Dunnett’s post hoc test. Source data are available for this figure: SourceData F3.
Atg7-regulated fibronectin in endothelial cells is required for astrocyte adhesion and BBB integrity
From the above results, we hypothesized that the reduced fibronectin may be responsible for the detachment of astrocytes from the cerebral microvessels in the brain of Atg7-ECKO mice. To test this, the adhesion of in vitro cultured astrocytes to endothelial cells was analyzed. We found that the astrocytes adhered to the Atg7-deficient endothelial cells was less than the control, which was effectively rescued after restoring fibronectin expression by exogenous expression of Atg7 (Fig. 4 A and Fig. 5 G). Then, an in vitro BBB model was established in which HBMECs were seeded in the Transwell insert and astrocytes were grown on the underside of the Transwell (Fig. 4 B, top) to mimic the close contact between endothelial cells and astrocytes in BBB. The in vitro BBB model was used to assess its permeability to different sizes of tracers by measuring the leakage of FITC-dextran in the bottom chamber of the Transwell. The results revealed the leakage of 40 and 70 kD FITC-dextran (Fig. 4 B, bottom), but not the 150 kD one (Fig. 4 B, bottom), in the Transwell seeded with Atg7-depleted HBMECs compared to the control group, which is in line with the in vivo BBB permeability results obtained with Atg7-ECKO mice (Fig. 1). We further found that this increased in vitro BBB permeability was recovered when the membrane of Transwell insert was pre-coated with fibronectin before permeability assay (Fig. 4 B). Furthermore, AAV-BR1 (Dogbevia et al., 2020; Korbelin et al., 2016), a brain endothelial-targeted viral vector for intravenous injection (Fig. S4 A), was employed to specifically silence the fibronectin of brain endothelium in mice. The in vivo transduction efficiency of AAV-BR1 virus in brain endothelial cells was 78.99 ± 1.97% (Fig. S4 B). Further immunostaining results showed that the tail vein injection of AAV-BR1-shFN virus encoding shRNA targeting fibronectin successfully downregulated fibronectin of microvascular endothelial cells in the mice brain (Fig. 4 C). We observed that knockdown of endothelial fibronectin significantly reduced the coverage of astrocytes along the brain microvessels (Fig. 4, D and E). We further found that the BBB permeability was increased after injection of AAV-BR1-shFN virus by showing extravasation of 40 and 70 kD fluorescent dextran in the brain following tail vein injection (Fig. 4, F and G). In addition, the HBMECs were transfected with fibronectin-specific siRNA to knockdown fibronectin (Fig. S4 C), and we found the adhesion of astrocytes to endothelial cells was reduced (Fig. S4 D) and the permeability of in vitro BBB model was increased (Fig. S4 E). These in vivo and in vitro results demonstrated that endothelial fibronectin, the expression of which is regulated by Atg7, is required for the astrocyte adhesion to endothelial cells and the maintenance of BBB integrity.

Atg7-regulated fibronectin in endothelial cells is required for astrocyte adhesion and BBB integrity. (A) The cDNA encoding full length Atg7 or Atg7(C572S) mutant was transfected to Atg7-knockout (KO) HBMECs by adenovirus containing GFP, with empty vector as control. 48 h after transfection, the astrocytes stained with PKH26 dye were added to the wells of plate seeded with HBMECs to allow the adhesion to endothelial cells for 30 min. Then the culture medium was removed, washed twice with PBS, and replaced with imaging solution. The living cells were then imaged by fluorescence microscopy. The representative images were provided (left). The astrocytes adhered to the HBMECs was quantified (right). Data were shown as the mean ± SD (n = 6). **, P < 0.01. ***, P < 0.001. Statistics were calculated by one-way ANOVA coupled with Dunnett’s post hoc test. (B) Schematic diagram of the in vitro BBB model comprised of HBMECs grown on the upside of the membrane in the Transwell insert with astrocytes grown on the underside of the Transwell membrane. The 3.0 μm pores at the Transwell membrane allow the penetration of astrocytic processes to contact with the HBMECs (top). The in vitro BBB model comprised of Atg7-KO HBMECs co-cultured with astrocytes was established, with Cas9-only HBMECs co-cultured with astrocytes as control. When indicated, the Transwell membrane was precoated with recombinant fibronectin (FN). 4 d later, FITC-dextran with different molecular weight (40, 70, and 150 kD) was added to the upper chamber at a concentration of 1 mg/ml. 1 h later, the medium in the lower chamber was collected and fluorescence intensity was detected by microplate reader. Data are shown as the mean ± SD (n = 6; bottom). ***, P < 0.001. The ns represents no statistical significance. Statistics were calculated by one-way ANOVA coupled with Dunnett’s post hoc test. (C–G) The GFP-tagged AAV-BR1 vectors containing shRNA against fibronectin or scramble shRNA control were injected into the tail vein of wild-type mice at a dose of 5 × 10¹¹ genomic particles in total volume of 150 μl saline. 4 wk later, (C) the brain was harvested and sections were obtained for immunostaining with the antibodies recognizing fibronectin (red) and CD31 (gray). DAPI (blue) was used for counterstaining. The representative images of the cortex were shown (left). The vascular expression of fibronectin was quantified as relative level of fibronectin fluorescence intensity in the CD31 positive area (right; mean ± SD, n = 6). For quantifications, 30 vessels from six mice were analyzed in each group (right). ***, P < 0.001. Unpaired two-tailed Student’s t test for comparison of two groups. (D and E) The brain sections were obtained for immunostaining with the antibodies against GFAP (red; D), or AQP4 (red; E). GFP indicate the microvessels infected with AAV-BR1 virus. The stained slices were mounted and visualized by z-stack confocal imaging with 63× objective. The representative images of the cortex were presented (left). The zoomed-in views (middle) show the 3D reconstruction of astrocytes covering vessels. The astrocytic coverage at the vessels was quantified by dividing the total area of the vessels by the area of the astrocyte in contact with the vessels (right). For quantifications, 30 vessels from six mice were analyzed in each group. Data were shown as the mean ± SD (n = 6). ***, P < 0.001. Unpaired two-tailed Student’s t test for comparison of two groups. (F and G) 40 kD (F) or 70 kD (G) Texas-red-dextran (0.08 mg/g body weight, dissolved in saline) was injected to mice through the tail vein. 30 min later, the brains were harvested and the brain slices were prepared for confocal microscopy. Representative confocal images of the cortex are provided (left). The extravascular Texas-red-dextran in mice brain was quantified (right). Data were shown as mean ± SD (n = 6). ***, P < 0.001. Unpaired two-tailed Student’s t test for comparison of two groups.
Atg7-regulated fibronectin in endothelial cells is required for astrocyte adhesion and BBB integrity. (A) The cDNA encoding full length Atg7 or Atg7(C572S) mutant was transfected to Atg7-knockout (KO) HBMECs by adenovirus containing GFP, with empty vector as control. 48 h after transfection, the astrocytes stained with PKH26 dye were added to the wells of plate seeded with HBMECs to allow the adhesion to endothelial cells for 30 min. Then the culture medium was removed, washed twice with PBS, and replaced with imaging solution. The living cells were then imaged by fluorescence microscopy. The representative images were provided (left). The astrocytes adhered to the HBMECs was quantified (right). Data were shown as the mean ± SD (n = 6). **, P < 0.01. ***, P < 0.001. Statistics were calculated by one-way ANOVA coupled with Dunnett’s post hoc test. (B) Schematic diagram of the in vitro BBB model comprised of HBMECs grown on the upside of the membrane in the Transwell insert with astrocytes grown on the underside of the Transwell membrane. The 3.0 μm pores at the Transwell membrane allow the penetration of astrocytic processes to contact with the HBMECs (top). The in vitro BBB model comprised of Atg7-KO HBMECs co-cultured with astrocytes was established, with Cas9-only HBMECs co-cultured with astrocytes as control. When indicated, the Transwell membrane was precoated with recombinant fibronectin (FN). 4 d later, FITC-dextran with different molecular weight (40, 70, and 150 kD) was added to the upper chamber at a concentration of 1 mg/ml. 1 h later, the medium in the lower chamber was collected and fluorescence intensity was detected by microplate reader. Data are shown as the mean ± SD (n = 6; bottom). ***, P < 0.001. The ns represents no statistical significance. Statistics were calculated by one-way ANOVA coupled with Dunnett’s post hoc test. (C–G) The GFP-tagged AAV-BR1 vectors containing shRNA against fibronectin or scramble shRNA control were injected into the tail vein of wild-type mice at a dose of 5 × 10¹¹ genomic particles in total volume of 150 μl saline. 4 wk later, (C) the brain was harvested and sections were obtained for immunostaining with the antibodies recognizing fibronectin (red) and CD31 (gray). DAPI (blue) was used for counterstaining. The representative images of the cortex were shown (left). The vascular expression of fibronectin was quantified as relative level of fibronectin fluorescence intensity in the CD31 positive area (right; mean ± SD, n = 6). For quantifications, 30 vessels from six mice were analyzed in each group (right). ***, P < 0.001. Unpaired two-tailed Student’s t test for comparison of two groups. (D and E) The brain sections were obtained for immunostaining with the antibodies against GFAP (red; D), or AQP4 (red; E). GFP indicate the microvessels infected with AAV-BR1 virus. The stained slices were mounted and visualized by z-stack confocal imaging with 63× objective. The representative images of the cortex were presented (left). The zoomed-in views (middle) show the 3D reconstruction of astrocytes covering vessels. The astrocytic coverage at the vessels was quantified by dividing the total area of the vessels by the area of the astrocyte in contact with the vessels (right). For quantifications, 30 vessels from six mice were analyzed in each group. Data were shown as the mean ± SD (n = 6). ***, P < 0.001. Unpaired two-tailed Student’s t test for comparison of two groups. (F and G) 40 kD (F) or 70 kD (G) Texas-red-dextran (0.08 mg/g body weight, dissolved in saline) was injected to mice through the tail vein. 30 min later, the brains were harvested and the brain slices were prepared for confocal microscopy. Representative confocal images of the cortex are provided (left). The extravascular Texas-red-dextran in mice brain was quantified (right). Data were shown as mean ± SD (n = 6). ***, P < 0.001. Unpaired two-tailed Student’s t test for comparison of two groups.
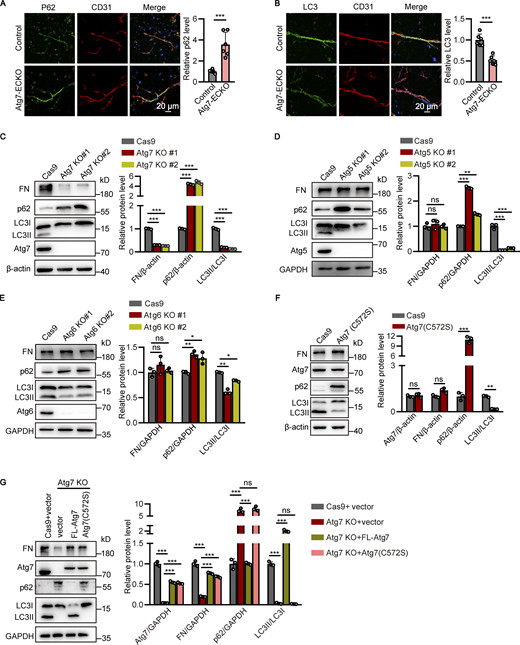
Atg7-regulated fibronectin expression is autophagy independent. (A and B) The brain microvessels were isolated from Atg7-ECKO mice, with wild-type littermate as control. Immunostaining was performed with the antibodies against p62 (A) or LC3 (B; green) together with CD31 antibody (red). DAPI (blue) was used for counterstaining. The vascular expression of p62 or LC3 was quantified as relative level of p62 or LC3 fluorescence intensity in the CD31 positive area (mean ± SD; right). n = 6. ***, P < 0.001. Unpaired two-tailed Student’s t test for comparison of two groups. (C–E) The stable HBMEC cell lines with knockout of Atg genes were established. Then the cells were lysed and Western blot was performed to determine the protein levels of fibronectin (FN), p62, and LC3 in HBMECs with knockout of Atg7 (C), Atg5 (D), or Atg6 (E). β-Actin or GAPDH was used as an internal loading control. Representative images were presented (left). The band densities were quantified by ImageJ software and normalized to the Cas9-only control cells (right). Data were shown as mean ± SD (n = 3). *, P < 0.05. **, P < 0.01. ***, P < 0.001. Statistics were calculated by one-way ANOVA coupled with Dunnett’s post hoc test. (F) The stable HBMEC cell line with the endogenous Atg7 gene genetically replaced with Atg7(C572S) were established. The cells were lysed and Western blot was performed to determine the protein levels of fibronectin, p62, and LC3, with β-actin as an internal loading control. The band densities were quantified by ImageJ software and normalized to the Cas9-only control cells. Data were shown as mean ± SD (n = 3). **, P < 0.01. ***, P < 0.001. The ns represents no statistical significance. Unpaired two-tailed Student’s t test for comparison of two groups. (G) The adenovirus containing cDNA encoding full-length (FL) Atg7 or Atg7(C572S) mutant was introduced to Atg7-knockout (KO) HBMECs, respectively, with adenovirus empty vector as control. 48 h later, the cells were lysed and Western blot was performed to analyze the expression of Atg7, fibronectin, p62, and LC3, with GAPDH as an internal loading control. The band densities were quantified by ImageJ software and normalized to the control cells transfected with empty vector. Data were shown as mean ± SD (n = 3). ***, P < 0.001. The ns represents no statistical significance. Statistics were calculated by one-way ANOVA coupled with Dunnett’s post hoc test. Source data are available for this figure: SourceData F5.
Atg7-regulated fibronectin expression is autophagy independent. (A and B) The brain microvessels were isolated from Atg7-ECKO mice, with wild-type littermate as control. Immunostaining was performed with the antibodies against p62 (A) or LC3 (B; green) together with CD31 antibody (red). DAPI (blue) was used for counterstaining. The vascular expression of p62 or LC3 was quantified as relative level of p62 or LC3 fluorescence intensity in the CD31 positive area (mean ± SD; right). n = 6. ***, P < 0.001. Unpaired two-tailed Student’s t test for comparison of two groups. (C–E) The stable HBMEC cell lines with knockout of Atg genes were established. Then the cells were lysed and Western blot was performed to determine the protein levels of fibronectin (FN), p62, and LC3 in HBMECs with knockout of Atg7 (C), Atg5 (D), or Atg6 (E). β-Actin or GAPDH was used as an internal loading control. Representative images were presented (left). The band densities were quantified by ImageJ software and normalized to the Cas9-only control cells (right). Data were shown as mean ± SD (n = 3). *, P < 0.05. **, P < 0.01. ***, P < 0.001. Statistics were calculated by one-way ANOVA coupled with Dunnett’s post hoc test. (F) The stable HBMEC cell line with the endogenous Atg7 gene genetically replaced with Atg7(C572S) were established. The cells were lysed and Western blot was performed to determine the protein levels of fibronectin, p62, and LC3, with β-actin as an internal loading control. The band densities were quantified by ImageJ software and normalized to the Cas9-only control cells. Data were shown as mean ± SD (n = 3). **, P < 0.01. ***, P < 0.001. The ns represents no statistical significance. Unpaired two-tailed Student’s t test for comparison of two groups. (G) The adenovirus containing cDNA encoding full-length (FL) Atg7 or Atg7(C572S) mutant was introduced to Atg7-knockout (KO) HBMECs, respectively, with adenovirus empty vector as control. 48 h later, the cells were lysed and Western blot was performed to analyze the expression of Atg7, fibronectin, p62, and LC3, with GAPDH as an internal loading control. The band densities were quantified by ImageJ software and normalized to the control cells transfected with empty vector. Data were shown as mean ± SD (n = 3). ***, P < 0.001. The ns represents no statistical significance. Statistics were calculated by one-way ANOVA coupled with Dunnett’s post hoc test. Source data are available for this figure: SourceData F5.
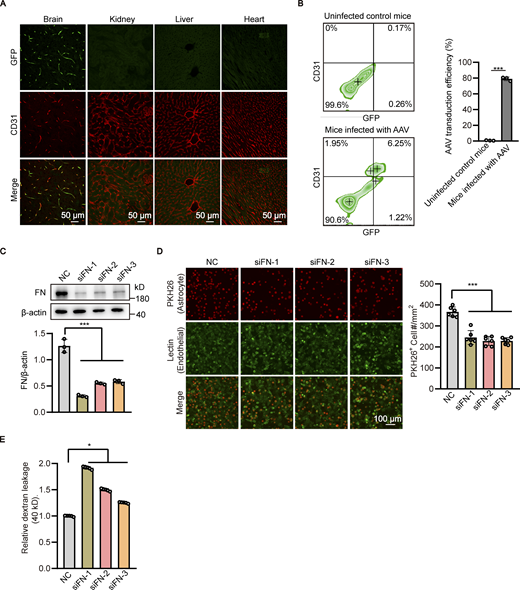
Endothelial knockdown of fibronectin reduces astrocyte adhesion and increases the permeability of in vitro BBB model. (A) Recombinant GFP-tagged AAV-BR1 virus were injected into the tail vein at a dose of 5 × 10¹¹ genomic particles in total volume of 150 μl saline. 4 wk after AAV infection, the brain, kidney, liver, and heart were harvested, and sections were obtained for immunofluorescence staining with CD31 antibody (red). Representative confocal images were provided. Scale bar, 50 μm. (B) Recombinant GFP-tagged AAV-BR1 virus were injected into the tail vein of mice as in A, and mice infected with 150 μl saline served as the control group. 4 wk after AAV infection, the brain tissue was harvested and the cell suspension was subjected to flow cytometry with antibody recognizing CD31 and GFP. The transduction efficiency of AAV-BR1 virus in brain endothelial cells was quantified by the proportion of GFP positive cells in CD31 positive cells. Data were shown as the mean ± SD (n = 3). ***, P < 0.001. Unpaired two-tailed Student’s t test for comparison of two groups. (C and D) HBMECs were transfected with siRNAs against fibronectin (FN) or non-silencing control siRNA (NC). 48 h after transfection, (C) cell lysates were subjected to Western blot analysis to detect the cellular expression of fibronectin. β-Actin was used as an internal loading control. The band densities were quantified by ImageJ software and normalized to the NC group. Data were shown as the mean ± SD (n = 3). ***, P < 0.001. Statistics were calculated by one-way ANOVA coupled with Dunnett’s post hoc test. (D) Astrocytes stained with PKH26 dye were added to the well of 24-well plate seeded with HBMECs to allow the adhesion to endothelial cells for 30 min. After that, the culture medium was removed, plates were washed twice with PBS, and imaging solution was added to the plates. Finally, cells were imaged by fluorescence microscopy. The representative images were provided (left). Scale bar, 100 μm. The number of astrocytes adhered to the HBMECs was quantified (right). Data were shown as the mean ± SD (n = 6). ***, P < 0.001. Statistics were calculated by one-way ANOVA coupled with Dunnett’s post hoc test. (E) In vitro BBB model consisting of HBMECs and astrocytes was constructed. 24 h later, siRNAs against fibronectin of HBMECs or negative control siRNA (NC) were transfected to HBMECs. 72 h after transfection, 40-kD FITC-dextran was added into the upper chamber of the Transwell at a concentration of 1 mg/ml, with 600 μl serum-free basal medium added to the lower chamber. After incubation for 1 h, the medium in the lower chamber was collected to detect the fluorescence intensity using microplate reader. Data were shown as the mean ± SD (n = 5). *, P < 0.05. Statistics were calculated by one-way ANOVA coupled with Dunnett’s post hoc test. Source data are available for this figure: SourceData FS4.
Endothelial knockdown of fibronectin reduces astrocyte adhesion and increases the permeability of in vitro BBB model. (A) Recombinant GFP-tagged AAV-BR1 virus were injected into the tail vein at a dose of 5 × 10¹¹ genomic particles in total volume of 150 μl saline. 4 wk after AAV infection, the brain, kidney, liver, and heart were harvested, and sections were obtained for immunofluorescence staining with CD31 antibody (red). Representative confocal images were provided. Scale bar, 50 μm. (B) Recombinant GFP-tagged AAV-BR1 virus were injected into the tail vein of mice as in A, and mice infected with 150 μl saline served as the control group. 4 wk after AAV infection, the brain tissue was harvested and the cell suspension was subjected to flow cytometry with antibody recognizing CD31 and GFP. The transduction efficiency of AAV-BR1 virus in brain endothelial cells was quantified by the proportion of GFP positive cells in CD31 positive cells. Data were shown as the mean ± SD (n = 3). ***, P < 0.001. Unpaired two-tailed Student’s t test for comparison of two groups. (C and D) HBMECs were transfected with siRNAs against fibronectin (FN) or non-silencing control siRNA (NC). 48 h after transfection, (C) cell lysates were subjected to Western blot analysis to detect the cellular expression of fibronectin. β-Actin was used as an internal loading control. The band densities were quantified by ImageJ software and normalized to the NC group. Data were shown as the mean ± SD (n = 3). ***, P < 0.001. Statistics were calculated by one-way ANOVA coupled with Dunnett’s post hoc test. (D) Astrocytes stained with PKH26 dye were added to the well of 24-well plate seeded with HBMECs to allow the adhesion to endothelial cells for 30 min. After that, the culture medium was removed, plates were washed twice with PBS, and imaging solution was added to the plates. Finally, cells were imaged by fluorescence microscopy. The representative images were provided (left). Scale bar, 100 μm. The number of astrocytes adhered to the HBMECs was quantified (right). Data were shown as the mean ± SD (n = 6). ***, P < 0.001. Statistics were calculated by one-way ANOVA coupled with Dunnett’s post hoc test. (E) In vitro BBB model consisting of HBMECs and astrocytes was constructed. 24 h later, siRNAs against fibronectin of HBMECs or negative control siRNA (NC) were transfected to HBMECs. 72 h after transfection, 40-kD FITC-dextran was added into the upper chamber of the Transwell at a concentration of 1 mg/ml, with 600 μl serum-free basal medium added to the lower chamber. After incubation for 1 h, the medium in the lower chamber was collected to detect the fluorescence intensity using microplate reader. Data were shown as the mean ± SD (n = 5). *, P < 0.05. Statistics were calculated by one-way ANOVA coupled with Dunnett’s post hoc test. Source data are available for this figure: SourceData FS4.
Atg7-regulated fibronectin expression is autophagy independent
Given the crucial role of Atg7 in autophagy regulation, the brain microvessels of Atg7-ECKO mice were isolated to assess the autophagy status. Immunofluorescence results showed that p62 was increased, whereas LC3 was decreased, in the brain microvessels of Atg7-ECKO mice compared to the control (Fig. 5, A and B), indicating the inhibition of brain endothelial autophagy. Western blot results verified the increased p62 expression in the brain microvessels of Atg7-ECKO mice compared to control (Fig. S5 A). Consistently, the inhibition of autophagy was revealed by Western blot analysis in the HBMEC cell lines with Atg7 knockout (Fig. 5 C). These data demonstrated the defective autophagy in the brain endothelial cells with Atg7 depletion, which prompted us to test whether the fibronectin reduction induced by Atg7 knockout was the results of autophagy inhibition. We established stable HBMEC cell lines with knockout of Atg5 or Atg6 (also known as Beclin1, mammalian homologue of yeast Atg6), which play critical roles in autophagy (Shravage et al., 2013; Su et al., 2017), by CRISPR/Cas9 gene-editing system (Fig. S5, B and C). Interestingly, the Western blot results revealed that the expression of fibronectin remained unaltered in the brain endothelial cells with knockout of Atg5 or Atg6 (Fig. 5, D and E). Further results showed that the mRNA and protein levels of fibronectin remained unchanged after treatment with chloroquine, an inhibitor of autophagy (Fig. S5, D and E). These results raised the interesting possibility that the fibronectin reduction in the condition of Atg7 knockout may not depend on the dysregulated autophagy.
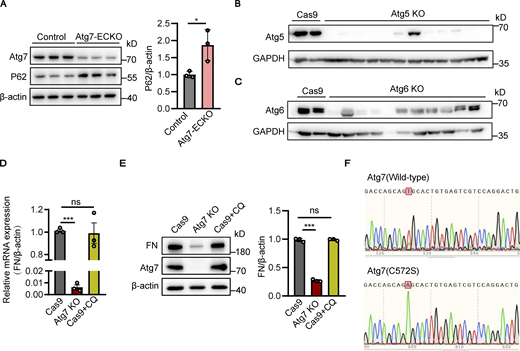
The fibronectin reduction induced by Atg7 depletion is independent of autophagy inhibition. (A) Brain microvessels were isolated from Atg7-ECKO mice, with wild-type littermate as control. The protein levels of Atg7 and p62 were analyzed by Western blot, with β-actin used as an internal control. Data were shown as the mean ± SD (n = 3). *, P < 0.05. Unpaired two-tailed Student’s t test for comparison of two groups. (B and C) HBMECs were infected by lentivirus containing the cDNA of Cas9 together with sgRNA targeting the exon of Atg5 (B) or Atg6 (C). 48 h after infection, blasticidin (3 μg/ml) and puromycin (1 μg/ml) were used for screening of positive infected cells. The cells were collected for protein extraction, and Western blot was performed to detect the knockout (KO) effect of Atg5 (B) or Atg6 (C) in HBMECs. Lentivirus containing the cDNA of Cas9 alone was used as a control. (D and E) The HBMECs were treated with CQ (chloroquine, 10 μM) for 24 h, with the cells treated with vehicle as control. (D) The mRNA levels of fibronectin were determined by RT-PCR using β-actin as an internal control. Data were shown as the mean ± SD (n = 3). ***, P < 0.001. The ns represents no statistical significance. Statistics were calculated by one-way ANOVA coupled with Dunnett’s post hoc test. (E) The cells were lysed, and Western blot was performed to determine the protein levels of fibronectin and Atg7 using β-actin as an internal loading control. The band densities were quantified by ImageJ software and normalized to the control. Data were shown as mean ± SD (n = 3). ***, P < 0.001. The ns represents no statistical significance. Statistics were calculated by one-way ANOVA coupled with Dunnett’s post hoc test. (F) HBMECs cell lines with the endogenous Atg7 gene genetically replaced with Atg7(C572S) were constructed using CRISPR/Cas9 technology. The cells were collected for RNA extraction, and the extracted RNA was reverse transcribed into cDNA. The primers were designed for the Atg7 mutation site and the cDNA was used as template for PCR, and the amplified products were cloned into T vector for DNA sequencing. The sequencing results of wild-type Atg7 and Atg7(C572S) mutant cells were presented. Source data are available for this figure: SourceData FS5.
The fibronectin reduction induced by Atg7 depletion is independent of autophagy inhibition. (A) Brain microvessels were isolated from Atg7-ECKO mice, with wild-type littermate as control. The protein levels of Atg7 and p62 were analyzed by Western blot, with β-actin used as an internal control. Data were shown as the mean ± SD (n = 3). *, P < 0.05. Unpaired two-tailed Student’s t test for comparison of two groups. (B and C) HBMECs were infected by lentivirus containing the cDNA of Cas9 together with sgRNA targeting the exon of Atg5 (B) or Atg6 (C). 48 h after infection, blasticidin (3 μg/ml) and puromycin (1 μg/ml) were used for screening of positive infected cells. The cells were collected for protein extraction, and Western blot was performed to detect the knockout (KO) effect of Atg5 (B) or Atg6 (C) in HBMECs. Lentivirus containing the cDNA of Cas9 alone was used as a control. (D and E) The HBMECs were treated with CQ (chloroquine, 10 μM) for 24 h, with the cells treated with vehicle as control. (D) The mRNA levels of fibronectin were determined by RT-PCR using β-actin as an internal control. Data were shown as the mean ± SD (n = 3). ***, P < 0.001. The ns represents no statistical significance. Statistics were calculated by one-way ANOVA coupled with Dunnett’s post hoc test. (E) The cells were lysed, and Western blot was performed to determine the protein levels of fibronectin and Atg7 using β-actin as an internal loading control. The band densities were quantified by ImageJ software and normalized to the control. Data were shown as mean ± SD (n = 3). ***, P < 0.001. The ns represents no statistical significance. Statistics were calculated by one-way ANOVA coupled with Dunnett’s post hoc test. (F) HBMECs cell lines with the endogenous Atg7 gene genetically replaced with Atg7(C572S) were constructed using CRISPR/Cas9 technology. The cells were collected for RNA extraction, and the extracted RNA was reverse transcribed into cDNA. The primers were designed for the Atg7 mutation site and the cDNA was used as template for PCR, and the amplified products were cloned into T vector for DNA sequencing. The sequencing results of wild-type Atg7 and Atg7(C572S) mutant cells were presented. Source data are available for this figure: SourceData FS5.
To assess this possibility, we established a stable HBMEC cell line with the endogenous Atg7 gene genetically replaced with Atg7(C572S) (Fig. S5 F), an autophagy-deficiency mutant of Atg7 (Lee et al., 2012; Nitta et al., 2019; Tanida et al., 2001). The following Western blot results revealed the inhibition of autophagy in the Atg7(C572S) cells (Fig. 5 F), which is consistent with the Atg7-knockout cells (Fig. 5 C). In contrast, the FN expression remained unchanged by Atg7(C572S) mutant (Fig. 5 F). Furthermore, we performed rescue experiments by overexpression of full-length Atg7 and Atg7(C572S) mutant in the Atg7-knockout HBMEC, respectively. The results showed that full-length Atg7 could recover the autophagy deficiency and fibronectin reduction in Atg7-knockout brain endothelial cells (Fig. 5 G). More importantly, Atg7(C572S) mutant effectively recovered the fibronectin reduction in Atg7-knockout cells, without affecting the autophagy deficiency (Fig. 5 G). These data demonstrated that the fibronectin reduction in Atg7-depleted brain endothelial cells is independent of autophagy deficiency.
Atg7 depletion downregulates fibronectin through inhibition of PKA/CREB signaling
To explore the mechanism of how Atg7 regulates FN expression, the Atg7-knockout brain endothelial cells were treated with the protein synthesis inhibitor cycloheximide followed by Western blot analysis. The results showed that the half-life of fibronectin protein remained unaltered by Atg7 depletion (Fig. S6 A). Further results showed that the fibronectin reduction induced by Atg7 depletion remained unchanged by treatment with MG132, a proteasome inhibitor (Fig. S6 B). These results, together with the decrease of fibronectin mRNA levels induced by Atg7 knockout (Fig. 3, A and F), suggested that the reduced fibronectin expression by Atg7 knockout is dependent on transcriptional regulation.
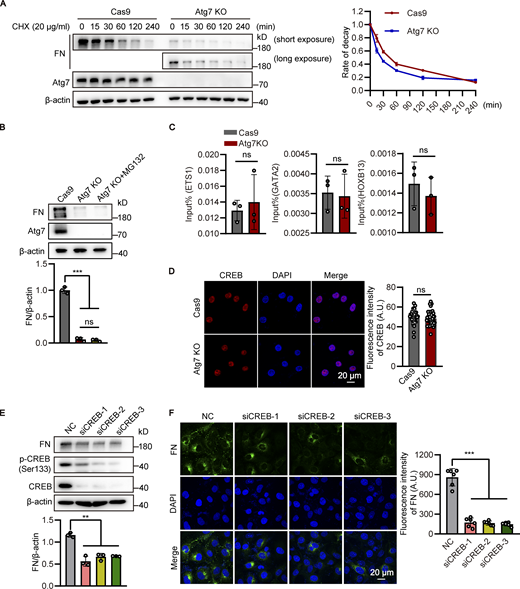
Analysis of the post-transcriptional regulation of fibronectin by Atg7 and the identification of CREB-dependent fibronectin expression. (A) The Atg7 KO HBMECs and control cells were treated with cycloheximide (CHX, 20 μg/ml) for indicated of times. The cell lysates were subjected to Western blot analysis to detect the expression of fibronectin (FN) and Atg7 (left). β-Actin was used as an internal loading control. The band densities were quantified by ImageJ software and normalized to the vehicle control. The rate of decay of fibronectin expression was plotted (right). Data were shown as the mean ± SD (n = 3). (B) The HBMECs were treated with MG132 (10 μM), with the cells treated with vehicle as control. The cell lysates were subjected to Western blot analysis to detect the expression of fibronectin and Atg7 (top). β-Actin was used as an internal loading control. The band densities were quantified by ImageJ software and normalized to the Cas9 group (bottom). Data were shown as the mean ± SD (n = 3). ***, P < 0.001. The ns represents no statistical significance. Statistics were calculated by one-way ANOVA coupled with Dunnett’s post hoc test. (C) The HBMEC lysates were subjected to the ChIP assay using the EST1, GATA2, and HOXB13 antibody, respectively. The immunoprecipitated DNA fragments were amplified by qPCR using the primers flanking the promoter regions of fibronectin gene. Data were shown as the mean ± SD (n = 3). The ns represents no statistical significance. Unpaired two-tailed Student’s t test for comparison of two groups. (D) The HBMECs were seeded on coverslips and immunofluorescence was performed with antibody against CREB (red). DAPI (blue) was used for counterstaining. The representative images were presented (left). The fluorescence intensity of CREB was quantified (right). A total of 40 cells were analyzed per group. Data were shown as the mean ± SD. The ns represents no statistical significance. Unpaired two-tailed Student’s t test for comparison of two groups. (E and F) HBMECs were transfected with siRNAs against CREB or non-silencing control siRNA (NC). 48 h after transfection, (E) cell lysates were subjected to Western blot analysis to detect the expression of fibronectin, CREB, and p-CREB (ser133), respectively (left). β-Actin was used as an internal loading control. The band densities were quantified by ImageJ software and normalized to the NC group (right). Data were shown as the mean ± SD. **P < 0.01. Statistics were calculated by one-way ANOVA coupled with Dunnett’s post hoc test. (F) Immunofluorescence was performed to analyze the cellular expression of fibronectin (green). DAPI (blue) was used for counterstaining (left). The fluorescence intensity of fibronectin was quantified (right). Data were shown as the mean ± SD. ***, P < 0.001. Statistics were calculated by one-way ANOVA coupled with Dunnett’s post hoc test. Source data are available for this figure: SourceData FS6.
Analysis of the post-transcriptional regulation of fibronectin by Atg7 and the identification of CREB-dependent fibronectin expression. (A) The Atg7 KO HBMECs and control cells were treated with cycloheximide (CHX, 20 μg/ml) for indicated of times. The cell lysates were subjected to Western blot analysis to detect the expression of fibronectin (FN) and Atg7 (left). β-Actin was used as an internal loading control. The band densities were quantified by ImageJ software and normalized to the vehicle control. The rate of decay of fibronectin expression was plotted (right). Data were shown as the mean ± SD (n = 3). (B) The HBMECs were treated with MG132 (10 μM), with the cells treated with vehicle as control. The cell lysates were subjected to Western blot analysis to detect the expression of fibronectin and Atg7 (top). β-Actin was used as an internal loading control. The band densities were quantified by ImageJ software and normalized to the Cas9 group (bottom). Data were shown as the mean ± SD (n = 3). ***, P < 0.001. The ns represents no statistical significance. Statistics were calculated by one-way ANOVA coupled with Dunnett’s post hoc test. (C) The HBMEC lysates were subjected to the ChIP assay using the EST1, GATA2, and HOXB13 antibody, respectively. The immunoprecipitated DNA fragments were amplified by qPCR using the primers flanking the promoter regions of fibronectin gene. Data were shown as the mean ± SD (n = 3). The ns represents no statistical significance. Unpaired two-tailed Student’s t test for comparison of two groups. (D) The HBMECs were seeded on coverslips and immunofluorescence was performed with antibody against CREB (red). DAPI (blue) was used for counterstaining. The representative images were presented (left). The fluorescence intensity of CREB was quantified (right). A total of 40 cells were analyzed per group. Data were shown as the mean ± SD. The ns represents no statistical significance. Unpaired two-tailed Student’s t test for comparison of two groups. (E and F) HBMECs were transfected with siRNAs against CREB or non-silencing control siRNA (NC). 48 h after transfection, (E) cell lysates were subjected to Western blot analysis to detect the expression of fibronectin, CREB, and p-CREB (ser133), respectively (left). β-Actin was used as an internal loading control. The band densities were quantified by ImageJ software and normalized to the NC group (right). Data were shown as the mean ± SD. **P < 0.01. Statistics were calculated by one-way ANOVA coupled with Dunnett’s post hoc test. (F) Immunofluorescence was performed to analyze the cellular expression of fibronectin (green). DAPI (blue) was used for counterstaining (left). The fluorescence intensity of fibronectin was quantified (right). Data were shown as the mean ± SD. ***, P < 0.001. Statistics were calculated by one-way ANOVA coupled with Dunnett’s post hoc test. Source data are available for this figure: SourceData FS6.
Then, we attempted to dissect the essential region in the promoter of fibronectin regulated by Atg7. The truncated DNA sequence of fibronectin promoter was cloned into pGL3 basic vector encoding luciferase. The constructs were then transfected into HEK293T cells together with pRL-TK plasmids followed by luciferase reporter assay. The results showed that the 506 bp proximal region of fibronectin promoter contained the necessary elements for adequate expression of fibronectin (Fig. 6 A). The transcription factors that are likely to bind to the 506 bp fragment of the fibronectin promoter were predicted using the JASPAR database (Fornes et al., 2020) and four transcription factors, CREB, ETS1, GATA2, and HOXB13, were identified as candidates. The results of chromatin immunoprecipitation (ChIP) assay showed that CREB, but not ETS1, GATA2, and HOXB13, bound with the 506 bp fibronectin promoter (Fig. 6 B and Fig. S6 C). Results from ChIP experiments showed that the binding of CREB to the −(428–422) bp and –(276–269) bp of fibronectin promoter was significantly reduced in Atg7 knockout HBMECs compared to the control (Fig. 6 B). The results from Western blot and cellular immunofluorescence analysis revealed that the phosphorylation of CREB on Ser133, which enhances its transcriptional activity (Mayr and Montminy, 2001), was significantly decreased by Atg7 knockout (Fig. 6, C and D), whereas the total CREB protein levels remained unchanged (Fig. 6 C and Fig. S6 D). Our further immunofluorescence results showed a recovery of phosphorylated CREB when the expression of Atg7 was restored by adenovirus-mediated overexpression in Atg7 knockout HBMECs (Fig. 6 D). These results indicated that Atg7 knockout inhibits CREB activation.
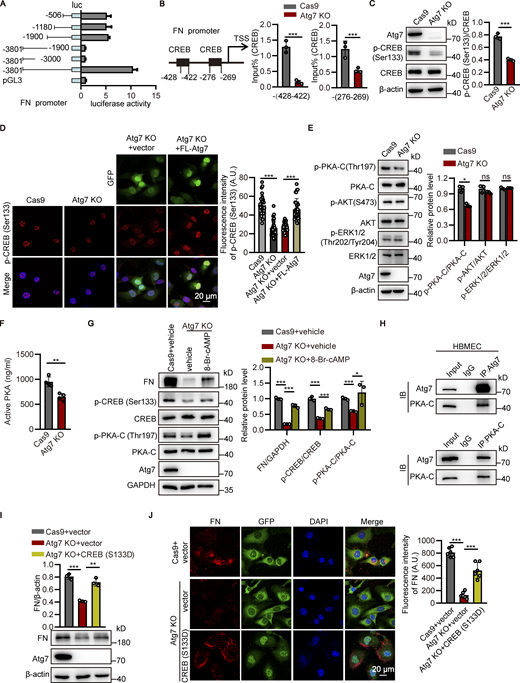
Atg7 depletion downregulates fibronectin through inhibition of PKA/CREB signaling. (A) The pGL3-basic vectors carrying different truncations of the fibronectin (FN) promoter were cotransfected with pRL-TK into HEK293T cells. After 48 h, the cells were lysed and the luciferase activity was detected. (B) The cell lysates were subjected to ChIP assay using CREB (p-Ser133) antibody. The immunoprecipitated DNA fragments were amplified by qPCR using the primers flanking two different fragments within the promoter region of fibronectin gene. Data were shown as the mean ± SD (n = 3). ***, P < 0.001. Unpaired two-tailed Student’s t test for comparison of two groups. (C) The Atg7-knockout (KO) HBMECs were lysed, and then Western blot was performed to analyze the expression of CREB and phosphorylated CREB using antibodies against CREB and CREB (p-Ser133), respectively, with the Cas9-only HBMECs as control. The band densities were quantified by ImageJ software. The ratio of CREB (p-Ser133)/CREB was calculated and normalized to the Cas9-only control. Data were shown as the mean ± SD (n = 3). ***, P < 0.001. Unpaired two-tailed Student’s t test for comparison of two groups. (D) Full-length (FL) Atg7 cDNA was transfected to Atg7-KO HBMECs by adenovirus containing GFP, with empty adenovirus vector as control. Left: Immunofluorescence was conducted with antibody against CREB (p-Ser133; red). DAPI (blue) was used for counterstaining. Right: Fluorescence intensity of the CREB (p-Ser133) was quantified. A total of 30 cells were analyzed per group. Data were shown as the mean ± SD. ***, P < 0.001. Statistics were calculated by one-way ANOVA coupled with Dunnett’s post hoc test. (E) Western blot was performed to analyze the expression of PKA-C, p-PKA-C, AKT, p-AKT, ERK1/2, and p-ERK1/2 using the corresponding antibodies in Atg7-KO HBMEC, with the Cas9-only HBMECs as control. The band densities were quantified by ImageJ software. The relative protein levels were calculated and normalized to the Cas9-only control. Data were shown as the mean ± SD (n = 3). *, P < 0.05. The ns represents no statistical significance. Unpaired two-tailed Student’s t test for comparison of two groups. (F) The Atg7 KO HBMECs were lysed, and then the active form of PKA was measured using PKA Kinase Activity Assay, with the Cas9-only HBMECs as control. Data were shown as the mean ± SD (n = 4). **, P < 0.01. Unpaired two-tailed Student’s t test for comparison of two groups. (G) The HBMECs were treated with 8-Bromo-cAMP (50 μM) for 24 h, with the cells treated with vehicle as control. The cells were lysed, and Western blot was performed to determine the protein levels of fibronectin, CREB, p-CREB (Ser133), PKA-C, p-PKA-C (Thr197) using GAPDH as an internal loading control. The band densities were quantified by ImageJ software and normalized to the control. Data were shown as mean ± SD (n = 3). *, P < 0.05. ***, P < 0.001. Statistics were calculated by one-way ANOVA coupled with Dunnett’s post hoc test. (H) HBMECs lysates were immunoprecipitated with Atg7 (top) and PKA-C (bottom) antibody, respectively, and then the precipitated proteins were analyzed by Western blot using antibodies against Atg7 and PKA-C. IB, immunoblot. (I and J) The constitutively active CREB (S133D) mutant was transfected to Atg7-KO HBMECs by adenovirus containing GFP with empty adenovirus vector as control. 48 h after transfection, (I) cell lysates were subjected to Western blot analysis to detect the expression of fibronectin and Atg7, respectively. β-Actin was used as an internal loading control. The band densities were quantified by ImageJ software and normalized to the control group transfected by empty vector. Data were shown as the mean ± SD. **, P < 0.01, ***, P < 0.001. Statistics were calculated by one-way ANOVA coupled with Dunnett’s post hoc test. (J) Left: Immunofluorescence was performed to analyze the cellular expression of fibronectin (red). DAPI (blue) was used for counterstaining. Right: Fluorescence intensity of fibronectin was quantified. Data were shown as the mean ± SD. ***, P < 0.001. Statistics were calculated by one-way ANOVA coupled with Dunnett’s post hoc test. Source data are available for this figure: SourceData F6.
Atg7 depletion downregulates fibronectin through inhibition of PKA/CREB signaling. (A) The pGL3-basic vectors carrying different truncations of the fibronectin (FN) promoter were cotransfected with pRL-TK into HEK293T cells. After 48 h, the cells were lysed and the luciferase activity was detected. (B) The cell lysates were subjected to ChIP assay using CREB (p-Ser133) antibody. The immunoprecipitated DNA fragments were amplified by qPCR using the primers flanking two different fragments within the promoter region of fibronectin gene. Data were shown as the mean ± SD (n = 3). ***, P < 0.001. Unpaired two-tailed Student’s t test for comparison of two groups. (C) The Atg7-knockout (KO) HBMECs were lysed, and then Western blot was performed to analyze the expression of CREB and phosphorylated CREB using antibodies against CREB and CREB (p-Ser133), respectively, with the Cas9-only HBMECs as control. The band densities were quantified by ImageJ software. The ratio of CREB (p-Ser133)/CREB was calculated and normalized to the Cas9-only control. Data were shown as the mean ± SD (n = 3). ***, P < 0.001. Unpaired two-tailed Student’s t test for comparison of two groups. (D) Full-length (FL) Atg7 cDNA was transfected to Atg7-KO HBMECs by adenovirus containing GFP, with empty adenovirus vector as control. Left: Immunofluorescence was conducted with antibody against CREB (p-Ser133; red). DAPI (blue) was used for counterstaining. Right: Fluorescence intensity of the CREB (p-Ser133) was quantified. A total of 30 cells were analyzed per group. Data were shown as the mean ± SD. ***, P < 0.001. Statistics were calculated by one-way ANOVA coupled with Dunnett’s post hoc test. (E) Western blot was performed to analyze the expression of PKA-C, p-PKA-C, AKT, p-AKT, ERK1/2, and p-ERK1/2 using the corresponding antibodies in Atg7-KO HBMEC, with the Cas9-only HBMECs as control. The band densities were quantified by ImageJ software. The relative protein levels were calculated and normalized to the Cas9-only control. Data were shown as the mean ± SD (n = 3). *, P < 0.05. The ns represents no statistical significance. Unpaired two-tailed Student’s t test for comparison of two groups. (F) The Atg7 KO HBMECs were lysed, and then the active form of PKA was measured using PKA Kinase Activity Assay, with the Cas9-only HBMECs as control. Data were shown as the mean ± SD (n = 4). **, P < 0.01. Unpaired two-tailed Student’s t test for comparison of two groups. (G) The HBMECs were treated with 8-Bromo-cAMP (50 μM) for 24 h, with the cells treated with vehicle as control. The cells were lysed, and Western blot was performed to determine the protein levels of fibronectin, CREB, p-CREB (Ser133), PKA-C, p-PKA-C (Thr197) using GAPDH as an internal loading control. The band densities were quantified by ImageJ software and normalized to the control. Data were shown as mean ± SD (n = 3). *, P < 0.05. ***, P < 0.001. Statistics were calculated by one-way ANOVA coupled with Dunnett’s post hoc test. (H) HBMECs lysates were immunoprecipitated with Atg7 (top) and PKA-C (bottom) antibody, respectively, and then the precipitated proteins were analyzed by Western blot using antibodies against Atg7 and PKA-C. IB, immunoblot. (I and J) The constitutively active CREB (S133D) mutant was transfected to Atg7-KO HBMECs by adenovirus containing GFP with empty adenovirus vector as control. 48 h after transfection, (I) cell lysates were subjected to Western blot analysis to detect the expression of fibronectin and Atg7, respectively. β-Actin was used as an internal loading control. The band densities were quantified by ImageJ software and normalized to the control group transfected by empty vector. Data were shown as the mean ± SD. **, P < 0.01, ***, P < 0.001. Statistics were calculated by one-way ANOVA coupled with Dunnett’s post hoc test. (J) Left: Immunofluorescence was performed to analyze the cellular expression of fibronectin (red). DAPI (blue) was used for counterstaining. Right: Fluorescence intensity of fibronectin was quantified. Data were shown as the mean ± SD. ***, P < 0.001. Statistics were calculated by one-way ANOVA coupled with Dunnett’s post hoc test. Source data are available for this figure: SourceData F6.
It has been shown that the primary signaling pathways activating CREB phosphorylation includes PKA, AKT, and extracellular regulated protein kinase (ERK; Li et al., 2018; Lu et al., 2020b; Mayr and Montminy, 2001). We thus analyzed the activation status of PKA, AKT, and ERK, and the results showed that the phosphorylation of PKA (Thr197) was significantly reduced upon Atg7 knockout in brain endothelial cells, whereas the phosphorylation of AKT and ERK remained unaltered (Fig. 6 E). Consistently, ELISA results showed that the active forms of cellular PKA were decreased in the Atg7-depleted brain endothelial cells compared to control (Fig. 6 F). We further found that 8-Bromo-cAMP, a PKA agonist, could effectively rescue the reduced CREB phosphorylation, as well as the decreased fibronectin expression, in the Atg7-depleted brain endothelial cells (Fig. 6 G). These results indicated that Atg7 regulates CREB phosphorylation via PKA signaling. Additional immunoprecipitation (IP) results showed that Atg7 was physically associated with PKA in brain endothelial cells (Fig. 6 H), suggesting the direct regulation of PKA activity by Atg7.
Next, we sought to determine whether the activation of CREB is responsible for the expression of fibronectin in brain endothelial cells. The CREB expression was downregulated in HBMECs by siRNA-mediated knockdown followed by Western blot and cellular immunofluorescence analysis. We found that the expression of fibronectin was reduced in HBMECs with CREB knockdown (Fig. S6, E and F). Furthermore, a constitutively active phosphomimetic CREB (S133D) mutant was transfected to Atg7-knockout HBMECs by recombinant adenovirus and then the expression of fibronectin was examined by Western blot and immunofluorescence. The results showed that the expression of fibronectin was restored to the level similar to that in controls by the expression of CREB (S133D) mutant (Fig. 6, I and J). These data demonstrated that Atg7 depletion transcriptionally suppresses fibronectin expression through inhibition of PKA/CREB signaling pathway.
Exogenous expression of active CREB in brain endothelium protects the BBB from Atg7-knockout-induced disruption
Next, we wondered whether the in vivo delivery of CREB to brain endothelium could restore the BBB dysfunction in Atg7-ECKO mice. The BMEC-specific adeno-associated virus serotype BR1 (AAV-BR1) virus encoding constitutively active CREB (S133D) was obtained and delivered to Atg7-ECKO mice by tail vein injection. 4 wk later, the expression of microvascular fibronectin and astrocytic coverage of microvessels was examined by immunofluorescence staining of brain tissue sections. The results showed that the expression of microvascular fibronectin (Fig. 7 A) and the coverage of perivascular astrocytes (Fig. 7, B and C) were efficiently restored in the brain of Atg7-ECKO mice after delivery of CREB (S133D) to the brain endothelium. Further results revealed that the increased permeability of Atg7-ECKO mice to 40 and 70 kD FITC-dextran was recovered to the levels similar to that in the control mice after delivery of CREB (S133D) to the brain endothelium (Fig. 7, D and E and Fig. S7 A). Consistently, the increased permeability of the in vitro BBB model seeding Atg7-silenced HBMECs was recovered to the levels similar to the control when the Atg7-silenced HBMECs was infected with adenovirus harboring CREB (S133D; Fig. S7 B).

Exogenous expression of active CREB in brain endothelium protects the BBB from Atg7-knockout-induced disruption. (A–G) Recombinant GFP-tagged AAV-BR1 virus expressing constitutively active CREB (S133D) or empty vector virus were injected into the tail vein of mice at a dose of 5 × 10¹¹ genomic particles in total volume of 150 μl saline. 4 wk after injection, (A) the brain was harvested and sections were obtained for immunofluorescence staining. Representative confocal images (top) of brain cortex tissue sections stained with fibronectin (FN; red), CD31 (gray) were presented. DAPI (blue) was stained for counterstaining. The vascular expression of fibronectin was quantified as relative level of fibronectin fluorescence intensity in the CD31 positive area (mean ± SD, n = 6; bottom). ***, P < 0.001. Statistics were calculated by one-way ANOVA coupled with Dunnett’s post hoc test. (B and C) The brain sections were obtained for immunofluorescence staining. Immunostaining was performed with the antibodies against GFAP (B) or AQP4 (C; red) and CD31 (gray). DAPI (blue) was stained for counterstaining. The stained slices were mounted and visualized by z-stack confocal imaging with 63× objective. The representative images of the cortex were presented (left). The zoomed-in views (middle) show the 3D reconstruction of astrocytes covering vessels. The astrocytic endfeet coverage along the vessels was quantified by dividing the total area of the vessels by the area of the astrocytes in contact with the vessels (right). Data were shown as the mean ± SD (n = 6). **, P < 0.01; ***, P < 0.001. Statistics were calculated by one-way ANOVA coupled with Dunnett’s post hoc test. (D and E) (D) 40-kD or (E) 70-kD Texas-red-dextran (0.08 mg/g body weight, dissolved in saline) was injected to mice through the tail vein. 30 min later, the brains were harvested and brain slices were prepared for confocal microscopy. Representative confocal images of the cortex were provided (left). Scale bar, 50 μm. The extravascular Texas-red-dextran in mice brain was calculated and normalized to control (right). Data were shown as mean ± SD (n = 6). ***, P < 0.001. Statistics were calculated by one-way ANOVA coupled with Dunnett’s post hoc test. (F) The NOR test was performed to assess recognition memory performance in the mice. 24 h after habituation, the mice were trained in a 10-min-long session during which they were placed at the center of the box in the presence of two identical objects. 1 h after training, the mice were placed in the same box for the test session, in which one of the objects was replaced by a novel object. The representative motion tracks of the test session were shown (top). The recognition index was calculated by the ratio of the time spent exploring the novel object to the total time spent exploring both the novel and familiar objects (bottom). Data were shown as mean ± SD, n = 6. *, P < 0.05. Statistics were calculated by one-way ANOVA coupled with Dunnett’s post hoc test. (G) The Y maze test was performed to assess spatial memory of the mice. The mice were trained for 10 min in both start and familiar arms. 1 h later, the mice were returned to the maze at the starting arm, with free access to all three arms, and were allowed 5 min to explore the maze. The representative motion tracks of the test session were provided (top). The exploration time, ambulation, number of the novel arm was quantified in percent of both novel and familiar arms (bottom). Data were shown as mean ± SD, n = 6. *, P < 0.05. Statistics were calculated by one-way ANOVA coupled with Dunnett’s post hoc test.
Exogenous expression of active CREB in brain endothelium protects the BBB from Atg7-knockout-induced disruption. (A–G) Recombinant GFP-tagged AAV-BR1 virus expressing constitutively active CREB (S133D) or empty vector virus were injected into the tail vein of mice at a dose of 5 × 10¹¹ genomic particles in total volume of 150 μl saline. 4 wk after injection, (A) the brain was harvested and sections were obtained for immunofluorescence staining. Representative confocal images (top) of brain cortex tissue sections stained with fibronectin (FN; red), CD31 (gray) were presented. DAPI (blue) was stained for counterstaining. The vascular expression of fibronectin was quantified as relative level of fibronectin fluorescence intensity in the CD31 positive area (mean ± SD, n = 6; bottom). ***, P < 0.001. Statistics were calculated by one-way ANOVA coupled with Dunnett’s post hoc test. (B and C) The brain sections were obtained for immunofluorescence staining. Immunostaining was performed with the antibodies against GFAP (B) or AQP4 (C; red) and CD31 (gray). DAPI (blue) was stained for counterstaining. The stained slices were mounted and visualized by z-stack confocal imaging with 63× objective. The representative images of the cortex were presented (left). The zoomed-in views (middle) show the 3D reconstruction of astrocytes covering vessels. The astrocytic endfeet coverage along the vessels was quantified by dividing the total area of the vessels by the area of the astrocytes in contact with the vessels (right). Data were shown as the mean ± SD (n = 6). **, P < 0.01; ***, P < 0.001. Statistics were calculated by one-way ANOVA coupled with Dunnett’s post hoc test. (D and E) (D) 40-kD or (E) 70-kD Texas-red-dextran (0.08 mg/g body weight, dissolved in saline) was injected to mice through the tail vein. 30 min later, the brains were harvested and brain slices were prepared for confocal microscopy. Representative confocal images of the cortex were provided (left). Scale bar, 50 μm. The extravascular Texas-red-dextran in mice brain was calculated and normalized to control (right). Data were shown as mean ± SD (n = 6). ***, P < 0.001. Statistics were calculated by one-way ANOVA coupled with Dunnett’s post hoc test. (F) The NOR test was performed to assess recognition memory performance in the mice. 24 h after habituation, the mice were trained in a 10-min-long session during which they were placed at the center of the box in the presence of two identical objects. 1 h after training, the mice were placed in the same box for the test session, in which one of the objects was replaced by a novel object. The representative motion tracks of the test session were shown (top). The recognition index was calculated by the ratio of the time spent exploring the novel object to the total time spent exploring both the novel and familiar objects (bottom). Data were shown as mean ± SD, n = 6. *, P < 0.05. Statistics were calculated by one-way ANOVA coupled with Dunnett’s post hoc test. (G) The Y maze test was performed to assess spatial memory of the mice. The mice were trained for 10 min in both start and familiar arms. 1 h later, the mice were returned to the maze at the starting arm, with free access to all three arms, and were allowed 5 min to explore the maze. The representative motion tracks of the test session were provided (top). The exploration time, ambulation, number of the novel arm was quantified in percent of both novel and familiar arms (bottom). Data were shown as mean ± SD, n = 6. *, P < 0.05. Statistics were calculated by one-way ANOVA coupled with Dunnett’s post hoc test.

Expression of active CREB in BMECs rescues the increased permeability induced by Atg7 knockout. (A) 70-kD FITC-dextran (0.25 mg/g body weight, dissolved in saline) was injected to mice through the tail vein. 50 min later, brains were harvested and homogenized, and the fluorescence intensity of FITC-dextran was measured by microplate reader. Data were shown as mean ± SD (n = 3). *, P < 0.05. Statistics were calculated by one-way ANOVA coupled with Dunnett’s post hoc test. (B) The in vitro BBB model was constructed with HBMECs grown on the upside of the membrane (3 μm pore) in the Transwell insert and astrocytes grown on the underside of the Transwell membrane. 24 h later, the full-length Atg7 cDNA or the constitutively active CREB (S133D) mutant were transfected to the Atg7-knockout (KO) HBMECs by adenovirus containing GFP, with empty vector as control. 72 h later, 70-kD FITC-dextran was added to the upper chamber at a concentration of 1 mg/ml, with 600 μl serum-free basal medium added to the lower chamber. 1 h later, the medium in the lower chamber was collected and the fluorescence intensity was detected by microplate reader. Data were shown as the mean ± SD (n = 3) **, P < 0.01; ***, P < 0.001. Statistics were calculated by one-way ANOVA coupled with Dunnett’s post hoc test.
Expression of active CREB in BMECs rescues the increased permeability induced by Atg7 knockout. (A) 70-kD FITC-dextran (0.25 mg/g body weight, dissolved in saline) was injected to mice through the tail vein. 50 min later, brains were harvested and homogenized, and the fluorescence intensity of FITC-dextran was measured by microplate reader. Data were shown as mean ± SD (n = 3). *, P < 0.05. Statistics were calculated by one-way ANOVA coupled with Dunnett’s post hoc test. (B) The in vitro BBB model was constructed with HBMECs grown on the upside of the membrane (3 μm pore) in the Transwell insert and astrocytes grown on the underside of the Transwell membrane. 24 h later, the full-length Atg7 cDNA or the constitutively active CREB (S133D) mutant were transfected to the Atg7-knockout (KO) HBMECs by adenovirus containing GFP, with empty vector as control. 72 h later, 70-kD FITC-dextran was added to the upper chamber at a concentration of 1 mg/ml, with 600 μl serum-free basal medium added to the lower chamber. 1 h later, the medium in the lower chamber was collected and the fluorescence intensity was detected by microplate reader. Data were shown as the mean ± SD (n = 3) **, P < 0.01; ***, P < 0.001. Statistics were calculated by one-way ANOVA coupled with Dunnett’s post hoc test.
Furthermore, we evaluated the cognitive performance of the Atg7-ECKO mice injected with the AAV-BR1 virus encoding active CREB (S133D). The results from new object recognition test and Y maze indicated that brain endothelium delivery of CREB (S133D) effectively recovered the cognitive defects in the Atg7-ECKO mice (Fig. 7, F and G). These results demonstrated that in vivo delivery of active CREB to brain endothelium restores fibronectin expression and astrocytic coverage of microvessels, thus protecting the BBB from disruption in the condition of Atg7 depletion.
Discussion
The non-cellular component, BM, plays an essential role in the BBB formation and maintenance (Xu et al., 2018). The composition of BM is complex, which is a “mixture” of extracellular matrix from various cell sources including BMECs, astrocytes, and pericytes (Xu et al., 2018). The significance of different cell-derived extracellular matrix in the BBB remains to be clarified. It has been reported that astrocytic laminin γ1 prevents pericyte differentiation from the BBB-stabilizing resting stage to the BBB-disrupting contractile stage (Yao et al., 2014). In present study, we found that endothelium-derived fibronectin production is required for astrocytes attachment to microvascular wall, and this astrocyte–endothelial interaction is regulated by Atg7 in brain endothelial cells. Our results, for the first time, revealed that endothelial Atg7 plays an essential role in maintenance of the BBB integrity.
It has been reported that endothelial Atg7 conditional knockout mice shows accelerated lung fibrosis (Singh et al., 2015) and attenuated arterial thrombosis (Yau et al., 2017). In this study, we observed that endothelial-specific Atg7 deletions in mice lead to BBB leakage for tracers up to 70 kD. Meanwhile, we found the deposits of blood-derived extravascular fibrinogen in the brain parenchyma and the loss of some neurons in hippocampus in Atg7-ECKO (Fig. S1, B and D). These results indicated that Atg7 is required for maintaining the BBB integrity. The tight junction forms the first line of defense restricting paracellular passage of molecules through the BBB (Jiang et al., 2018). In order to find out the reason of BBB leakage caused by Atg7 knockout, we detected the expression of the major tight junction proteins including occludin and claudin-5 in the brain of Atg7-ECKO mice. Our results show that Atg7 could not regulate tight junctional proteins expression in endothelial cells. Similarly, we found that caveolin-mediated transcytosis, which regulates BBB permeability (Andreone et al., 2017), was not altered upon Atg7 depletion in endothelial cells. It is known that pericytes and astrocytes, the major cellular constituents of the BBB, play an essential role in stabilization and maintenance of the BBB (Abbott et al., 2006; Armulik et al., 2010; Zhao et al., 2015). Therefore, we analyze the coverage of pericytes and astrocytes in the brain microvessels of Atg7-ECKO mice. We found that endothelial-specific deletion of Atg7 leads to astrocytes detachment from microvessels in mice, without affecting pericytes coverage. These results strongly suggest that the loss of endothelial Atg7 causes astrocyte–microvascular disassociation, leading to BBB integrity disruption and BBB leakage in mice brain.
Regarding the astrocyte adhesion to brain microvessels, previous studies revealed the contribution of astrocyte to this process. The astrocytic endfeet at the abluminal side of cerebral vessels could be replaced by the glioma cells leading to gliovascular uncoupling (Watkins et al., 2014). The deletion of astrocytic aquaporin-4, connexin, or α-dystrobrevin results in astrocyte–microvascular disassociation (Ezan et al., 2012; Haj-Yasein et al., 2011; Lien et al., 2012). However, whether the endothelial cells, which are in close contact with the astrocyte endfeet via the BM, may affect the astrocyte adhesion to cerebral microvascular wall remained elusive. Segarra et al. (2018) report that deletion of Disabled1 in endothelial cells leads to a reduced secretion of laminin-α4 and decreased coverage of astrocytic endfeet on microvessels. In this study, we first find that genetic depletion of endothelial Atg7 triggers astrocytes detachment from the microvessels. We identified the fibronectin, a component of the BM (Thomsen et al., 2017), is significantly reduced in the Atg7 knockout endothelial cells. Further in vitro and in vivo results demonstrated that Atg7-induced fibronectin expression in endothelial cells is required for astrocyte adhesion to brain microvessels, which has not been reported previously.
Traditionally, the function of Atg7 is to participate in autophagy. Recent evidence suggests that most components of the molecular machinery for autophagy, including Atg7, Atg5, and Atg6/beclin1, mediate autophagy-independent functions (Galluzzi and Green, 2019). In present study, we found that endothelial Atg7 depletion not only damaged autophagy but also led to a significant downregulation of fibronectin expression (Fig. 5). The inhibition of autophagy but not fibronectin production in a cell line with Atg7(C572S), an autophagy-deficiency mutant, indicating that Atg7-induced fibronectin expression for maintenance of the BBB integrity is autophagy independent. The findings that Atg5 or Atg6 knockout had no effect on fibronectin expression in brain endothelial cells further demonstrated that Atg7-regulated fibronectin production plays an essential role in maintenance of the BBB integrity. It will be interesting to further dissect the structural domain of Atg7 required for autophagy-independent function in future studies.
To clarify the underlying mechanisms of Atg7-induced fibronectin production in brain endothelial cells, we focused on the autophagy-independent role of Atg7, the transcriptional regulation of which has been reported previously (Lee et al., 2012; Zhuang et al., 2017). Our research results showed that −506 to 0 region of fibronectin promoter contains the necessary elements for adequate expression of fibronectin. ChIP experiments and phosphorylation status of CREB verified that Atg7 induce CREB activation, and activated CREB binding to −428 to −422 and −276 to −269 region of fibronectin promoter to promote fibronectin transcription. Furthermore, we found that active forms of cellular PKA, acting upstream of CREB, were decreased in the Atg7-depeleted brain endothelial cells. Consistently, the phosphorylation of PKA-C (Thr197), which enhances its protein kinase activity (Keshwani et al., 2012), was significantly decreased by endothelial Atg7 depletion. More importantly, co-IP results revealed the physical association of Atg7 and PKA in brain endothelial cells, indicating the direct regulation of PKA activity by Atg7. These results suggest that Atg7 promotes endothelial fibronectin production at the BM via activating PKA/CREB signaling pathway to induce astrocytes attaching to microvascular wall for maintenance of BBB homeostasis. Yet how the Atg7–PKA interaction could activate PKA needs further investigation.
As one of the BM components, fibronectin is present as a dimer complex comprised of two monomers linked by disulfide bonding and is secreted by brain endothelial cells, astrocytes, and pericytes (Daneman and Prat, 2015; Xu et al., 2018). Null mutations of fibronectin are embryonic lethal (George et al., 1993), partly due to impaired BM stability. It is known that fibronectin is involved in mediating cell attachment (via integrins) and regulating the barrier properties of brain endothelial cells in vitro (Zobel et al., 2016; Zollinger and Smith, 2017). However, the in vivo role of fibronectin at the BBB, in particular, the role of endothelial cell-derived fibronectin remains unclear. In this study, we find that the coverage rate of astrocytes on microvascular wall decreased from 90.70 to 58.63% when the brain endothelial fibronectin was reduced (Fig. 4, D and E). Early studies showed that fibronectin of the BBB BM mainly originated from the astrocytes in early stage of development and then from endothelial cells (Halfter et al., 1989; Liesi et al., 1986). Stenzel et al. (2011) reported that deletion of astrocytic fibronectin reduces radial endothelial migration during vascular plexus formation in the mouse retina. Thus, we speculate that the astrocyte-derived fibronectin might be responsible for brain angiogenesis in early stage of brain development, and the fibronectin from brain endothelial cells could maintain the adult BBB homeostasis through sustaining astrocytes adhesion to microvascular wall. In addition, we found that fibronectin was not downregulated in the cerebral vessels of Atg7 ECKO mice until 3 wk after birth (Fig. S1 E), suggesting that the phenotype caused by endothelial Atg7 depletion may be unique to adulthood. It has become clear that abnormal changes of the BBB including astrocytes detachment from microvessels are associated with neurological disorders like Alzheimer’s disease (Sweeney et al., 2019). Thus, strategies aimed at manipulating endothelial fibronectin or Atg7 expression may provide a translational approach to restores the BBB integrity under disease condition.
In summary, we investigated the role of endothelial Atg7 on maintenance of the BBB integrity in this study. We first observed that conditional Atg7 knockout in endothelial cells resulted in astrocytes detachment from microvessels and the BBB leakage. Mechanistically, we found deficiency of endothelial Atg7 affects the PKA/CREB signaling to downregulate the vascular BM component fibronectin, causing significantly decreased astrocytes adhesion to cerebral microvascular wall. This astrocyte–microvascular disassociation at the BBB leads to the BBB leakage. Our findings unveil the autophagy-independent function of endothelial Atg7 in the maintenance of the BBB integrity.
Materials and methods
Reagents
FITC-dextran, chloroquine, and PKH26 Red Fluorescent Cell Linker Kit were purchased from Sigma-Aldrich. Simple ChIP Enzymatic Chromatin IP Kit was from Cell Signaling Technology. BCA Protein Assay Kit, Blasticidin S HCl, and puromycin were from Thermo Fisher Scientific. EasyGeno rapid recombinant cloning kit was purchased from Tiangen. Dual-Luciferase Reporter Assay System was from Promega Corporation. Prime STAR Max DNA Polymerase, Prime STAR HS DNA Polymerase with GC Buffer, 2×PCR Solution Premix Taq were purchased from Takara Biotechnology. Lectin was from Vector laboratories. MG-132 was from MedChemExpress. PKA Kinase Activity Assay kit was purchased from Abcam.
Animals
Atg7loxP/loxP mice were a kind gift from Dr. Tomoki Chiba (Komatsu et al., 2005). Atg7loxP/loxP mice were crossed with VE-cadherinCre/+ mice in which expression of the Cre-recombinase is under the control of the endothelial-specific VE-cadherin promoter, yielding Atg7loxP/+; VE-cadherinCre/+ mice. Then, Atg7loxP/+; VE-cadherinCre/+ mice were bred with Atg7loxP/loxP to produce Atg7loxP/loxP; VE-cadherinCre/+ mice to knockout Atg7 in the endothelium (named as Atg7-ECKO). The Cre-negative Atg7loxP/loxP littermates were used as control. The genotype was determined by PCR analysis as described previously (Komatsu et al., 2005; Torisu et al., 2013; Wang et al., 2018). All the animal experimental procedures were approved by the Animal Experimentation Ethics Committee of the China Medical University (protocol#: 14031).
Cells
HBMECs were a kind gift from Dr. Monique Stins (Johns Hopkins University School of Medicine, Baltimore, MD, USA). The HBMECs were cultured in RPMI 1640 medium, supplemented with 10% fetal bovine serum (Thermo Fisher Scientific), 10% Nu-serum (BD Biosciences), 2 mM glutamine, 1 mM sodium pyruvate, 1 × nonessential amino acid, and 1 × minimal essential medium vitamin. Astrocytes were purchased from Wuhan PriCells Biomedical Technology Co., Ltd. and cultured in DMEM medium with 10% fetal bovine serum. The cells were incubated at 37°C in a 5% CO2, 95% air humidified atmosphere.
In vivo two-photon imaging
The 8-wk-old mice were anesthetized with isoflurane, and a thinned-skull cranial window at the parietal cortex was created by dental drill and then covered with glass coverslip. Then, the mice were allowed to recover for 3 d followed by two-photon imaging performed under microscope (Zeiss LSM880, Carl Zeiss AG) equipped with Coherent Chameleon tunable laser. To detect the leakage of brain vessels, the blood plasma was labeled by tail vein injection of FITC-dextran (Sigma-Aldrich) with different molecular weight (40, 70, or 150 kD) immediately before imaging. The mice were anesthetized and fixed by ear bars and teeth on a stereotaxic frame. The time-lapse images were acquired under room temperature with a 20× water objective (W-Plan-Apochromat 20×, N.A. 1.0, Zeiss) irritated by 800 nm laser (8% power), at indicated time points after FITC-dextran injection. The fluorescence of FITC-dextran around the cortical vessels (at a depth 80–100 μm from the cortical surface) was recorded. For quantifications, the fluorescence intensity of FITC-dextran outside the cortical vessels at indicated time points was measured with ZEN Blue software (Carl Zeiss) by a blinded investigator.
Tracer injection experiments
Brain tracer leakage experiments were performed as described (Park et al., 2018; Yanagida et al., 2017). In brief, the mice were injected in the tail vein with 40 or 70 kD FITC-dextran (250 μg/g body weight) dissolved in saline. After 30 min (for 40 kD FITC-dextran) or 50 min (for 70 kD FITC-dextran), the mice were anesthetized and perfused transcardially with PBS (pH 7.4). Then, the brains were removed and the cortex was weighed and homogenized with 1% Triton X-100 in PBS. The cortex lysates were centrifuged at 12,000 g for 20 min at 4°C, and the supernatant was used to measure the fluorescence intensity (excitation/emission 490/520 nm) with a microplate reader (SpectraMax M5, Molecular Devices Corporation). For quantifications, the fluorescence intensity values were normalized with the weight of the cortex.
Determination of brain water content
The 2-mo-old mice were sacrificed and the whole brain was harvested and weighted for the wet weight. Then the brain were dried for 4 d at 85°C and weighted to obtain the dry weight. The brain water content was calculated as: (wet weight − dry weight)/wet weight × 100%.
Brain microvessels isolation
The mice were sacrificed and the brain tissues were obtained. Then, the cerebellum and olfactory bulb were excised, and the remaining brain tissue was rapidly placed in cold PBS, and the large vessels were removed under a dissecting microscope. All operations were performed on ice. Then, the brain was homogenized with 3 ml of cold sucrose buffer (0.32 M sucrose, 5 mM Hepes, pH 7.4), and the homogenate was centrifuged at 1,000 g for 10 min. The supernatant containing mostly neuronal components was discarded, and the dense white layer of myelin on the top of the pellet was also discarded. After that, the pellet was resuspended in 3 ml sucrose buffer and centrifuged at 1,000 g for 10 min to remove the remaining myelin. The supernatant was discarded, and the precipitate was washed four times with 1 ml of sucrose buffer and centrifuged at 350 g for 10 min to obtain the pellet.
CRISPR/Cas9-mediated gene deletion
Atg7 knockout of HBMECs were constructed using CRISPR/Cas9 technology. In brief, we designed two small guide RNAs (sgRNA) numbered 7541 (target sequence: 5′-AGAAGAAGCTGAACGAGTAT-3′) and 7542 (target sequence: 5′-TAGGGTCCATACATTCACTG-3′), targeting the first exons of Atg7, respectively. The pLenti-U6-spgRNA v2.0-CMV-Blasticidin (Obio Technology) was used as a carrier element for sgRNA. HBMECs were infected with the lentivirus containing the sgRNA and cDNA of Cas9. 48 h later, blasticidin (3 μg/ml) and puromycin (1 μg/ml) were used for monoclonal screening of positive infected cells. The cells were collected for protein extraction, and Western blot was performed to verify the genetic knockout.
Similarly, we designed two sgRNA numbered Y15619 (target sequence: 5′-GGACACGAGTTTCAAGATCC-3′) and Y15620 (target sequence: 5′-CGAGAGACACCATCCTGGCG-3′), targeting the exons of Atg6 for generating Atg6 knockout of HBMECs. And three sgRNA numbered Y15623 (target sequence: 5′-AAGATGTGCTTCGAGATGTG-3′), Y15624 (target sequence: 5′-TCAGGATGAGATAACTGAAA-3′) and Y15625 (target sequence: 5′- CATCAAGTTCAGCTCTTCCT-3′), targeting the exons of Atg5, were designed for generating Atg5 knockout of HBMECs.
Generation of HBMECs cell lines with Atg7(C572S) mutant
HBMECs cell lines with the endogenous Atg7 gene genetically replaced with Atg7(C572S) were constructed using CRISPR/Cas9 technology. In brief, sgRNA (target sequence: 5′-GTCAACCAGAGACCGGACCT-3′) was designed to target the exons of Atg7. The pLenti-U6-spgRNA v2.0-CMV-BSR-WPRE (Obio Technology) was used as a carrier element for sgRNA. ATG7(C572S) cDNA templates were synthesized. The pcADV-EF1-mNeonGreen-CMV-MSC-3xFLAG (Obio Technology) was used as a carrier element for ATG7(C572S) cDNA templates. HBMECs were infected with the lentivirus containing the sgRNA and cDNA of Cas9 and the adenovirus containing the cDNA of ATG7(C572S). 72 h later, blasticidin (3 μg/ml) and puromycin (1 μg/ml) were used for monoclonal screening of positive infected cells. The cells were collected for total RNA extraction, and the extracted RNA was reverse transcribed into cDNA. The primers (forward: 5′-ACCCTAGAATCACACAGAGA-3′; reverse: 5′-GGAGGCAAAATTTCTAAGGT-3′) were designed for the Atg7 mutation site. The transcribed cDNA was used as template for PCR reaction, and the amplified products were cloned into T vector for DNA sequencing. The successful mutant cell lines were identified by DNA sequencing results.
AAV-BR1 infection
The cDNA of CREB, or shRNA, against fibronectin was inserted into the AAV-BR1 vector, which is specifically targeted to BMECs (Korbelin et al., 2016). Delivery of the AAV-BR1 vector (5 × 10¹¹ genomic particles in 150 μl) into 4-wk-old mice was accomplished through tail vein injection as previously reported (Dong et al., 2019; Körbelin et al., 2016; Tang et al., 2017). 1 mo after the injection, we detected the expression of the virus plasmid in vivo and performed subsequent experiments.
Flow cytometry
Cells from mouse brain tissue were isolated using Adult Brain Dissociation Kit (Miltenyi Biotec) according to the manufacturer’s instructions. Isolated cells were incubated with anti-GFP and anti-CD31 antibodies. Then, flow cytometry was carried out using a BD Accuri C6 Plus flow cytometer (BD Biosciences). Data acquisition and analysis were performed with CellQuest (BD Biosciences).
RNA interference
HBMECs were transiently transfected with siRNA against CREB or fibronectin using Lipofectamine 3000 (Invitrogen) according to the manufacturer’s instructions, with non-silencing siRNA served as the control. 48 h after transfection, the interference efficiency was detected using RT-qPCR and Western blot. All the siRNAs were purchased from Gemma Gene Co., Ltd. and the sequences are presented in Table S2.
RNA extraction and RT-PCR
Total RNA was extracted from cells or mouse brain tissues using TRNzol Universal (Tiangen) and reverse-transcribed to cDNA using 5×FastKing-RT SuperMix (Tiangen) following the manufacturer’s instructions. The qPCR was then performed on an ABI 7500 real-time PCR system (Applied Biosystems) using SuperReal PreMix Plus (Tiangen). β-Actin was employed as an internal control. The relative expression of mRNA was calculated using the comparative Ct method. All the primer sequences are provided in Table S3.
Western blot
Cells or brain tissues were lysed with radioimmunoprecipitation assay lysis buffer (Beyotime Biotech) containing 1 mM PMSF (Beyotime Biotech) for 30 min, and the lysates were centrifuged (12,000 g) at 4°C for 15 min. Protein concentration was determined using BCA Protein Assay Kit (Thermo Fisher Scientific). Then, the protein samples were separated with SDS-polyacrylamide gels and subsequently transferred to polyvinylidene fluoride membranes (Millipore). The membranes were blocked with 5% BSA or skim milk at room temperature for 1 h and incubated with primary antibody against Atg7 (1:1,000; Sigma-Aldrich), fibronectin (1:1,000; Abcam), occludin (1:1,000; Abcam), claudin-5 (1:1,000; Abcam), CREB (1:1,000; Cell Signaling Technology), phospho-CREB (Ser133; 1:1,000; Cell Signaling Technology), β-actin (1:2,000; ZSGB-BIO), and GAPDH (1:5,000; KangChen Biotech), respectively, overnight at 4°C, with gentle shaking. The next day, the membranes were washed and incubated with HRP-conjugated secondary antibody (1:8,000 dilution; Santa Cruz Biotech) for 1 h at room temperature. Thereafter, immunoreactive bands were visualized by the SuperSignal West Pico Chemiluminescent Substrate (Pierce) and imaged with Tanon 5,200 Imaging system (Tanon). The signal densities of the bands were measured using the ImageJ software (National Institutes of Health).
Immunofluorescence
For brain slice staining, the mouse brain slices were incubated with PBS containing 0.5% Triton X-100 and 8% BSA for 1 h at room temperature. The slices were incubated with primary antibodies recognizing CD31 (1:200; R&D system), Atg7 (1:100; Abcam), fibrinogen (1:100; Novus), CD13 (1:500; Bio-Rad), aquaporin-4 (1:500; Millipore), GFAP (1:500; Proteintech), GFAP (1:1,000; Abcam), fibronectin (1:50; Abcam), or collagen IV (1:200; Abcam) overnight at 4°C. The slices were then incubated with the secondary antibodies (1:200; Invitrogen) for 3 h at room temperature. After counterstaining with DAPI for 5 min, the coverslips were mounted with the antifade Vectashield solution (Vector Laboratories) and analyzed under confocal laser scanning microscope (Zeiss LSM880). For cellular staining, the cells grown on coverslips were washed with PBS and fixed with 4% paraformaldehyde at 4°C for 30 min. The fixed cells were permeabilized with 0.1% Triton X-100 and then blocked with 5% BSA in PBS. Then, the cells were stained with antibody against fibronectin (1:50; Abcam), GFAP (1:1,000; Abcam), VE-cadherin (1:200; Abcam), CREB (1:200; Cell Signaling Technology), or phospho-CREB (Ser133; 1:200; Cell Signaling Technology), and then incubated with secondary antibody conjugated with Alexa488 or Alexa 555 (1:200 dilution; Invitrogen). Following DAPI staining, the coverslips were mounted and confocal fluorescence imaging was performed using a laser scanning confocal microscope (Zeiss LSM 880) with 63× (Plan-Apochromat 63×, N.A. 1.4, oil) or 20× (Plan-Apochromat 20×, N.A. 0.8) lenses at room temperature. All images were acquired and 3D reconstitutions made using ZEN Black software (Carl Zeiss). ZEN Blue software (Carl Zeiss) was used for image processing and analysis.
TEM
The tissue samples were excised from the mouse brain and fixed by 2.5% glutaraldehyde (dissolved by 0.1 M sodium dimethacharsenate buffer, pH 7.4) at 4°C for at least 2 h. Following fixation, tissue samples were washed with 0.1 M sodium dimethyl arsenate buffer three times and post-fixed in 1% osmium tetroxide and dehydrated. After gradient dehydration in ethyl alcohol, the tissue was embedded in epoxy resin. After the embedding was completed, the embedding block was trimmed to a smooth surface and then ultrathin sections (80 nm) were cut from the block surface. Slices were collected on copper grids and stained with uranyl acetate and lead citrate. Finally, the sections were visualized and photographed with transmission electron microscope (H-7650; Hitachi), and data were recorded using item software (Olympus).
In vitro BBB model
As previously described, the BBB model was established by co-culture of HBMECs and astrocytes (Eugenin et al., 2011; Shi et al., 2017) using the Transwell (3-μm pore, 6.5-mm diameter, Corning Incorporated). Astrocytes (1 × 10⁵) were first seeded onto the underside of the Transwell insert membrane. 4 h after incubation, HBMECs (1 × 10⁵) were seeded onto the upside of the Transwell insert. The cultures were maintained in medium at 37°C in humidified 95% air and 5% CO2 for 4 d to reach confluence. To assess paracellular permeability, FITC-dextran of different molecular weights (40, 70, and 150 kD) were added into the upper chamber of the Transwell at a concentration of 1 mg/ml in 100 μl medium per well, with 600 μl serum-free basal medium added to the lower chamber. After incubation for 1 h, the medium in the lower chamber was collected to detect the fluorescence intensity using SpectraMax M5 microplate reader (excitation/emission 490/520 nm).
Astrocytes adhesion assay
The endothelial cells were seeded in 24-well plates 2 d before the adhesion experiment and stained with lectin 30 min before the adhesion assay. Then 8 × 10⁴ astrocytes stained with PKH26 dye were added to the well for adhesion to endothelial cells for 30 min. After that, the culture medium was removed, plates were washed twice with PBS and imaging solution was added to the plates. Finally, cells were imaged using a laser scanning confocal microscope (Nikon A1R) with 20× (Plan Apo 20×, N.A. 0.75) lens at room temperature for quantification of astrocytes adhering to the endothelial cells. All images were acquired using NIS-Elements AR software (Nikon). NIS-Elements AR Analysis software (Nikon) was used for image processing and analysis.
Luciferase reporter assay
Different truncations of the fibronectin promoter were amplified by PCR and cloned into the pGL3-Basic plasmid at the sites between NheI and XhoI using EasyGeno Rapid Recombinant Cloning Kit (Tiangen). The sequences of the primers used for amplifications were listed in Table S3. The pGL3-Basic constructs containing fibronectin promoter truncations were transfected into HEK293T cells with the Renilla luciferase control reporter vector (Promega), respectively, using Lipofectamine 3000. 48 h after transfection, cells were lysed, and the luciferase activity was detected according to the manufacturer’s instructions.
ChIP assay
ChIP was performed according to the protocol of the SimpleChIP Enzymatic Chromatin IP Kit (Cell Signaling Technology). In brief, cells (1 × 10⁷) were cross-linked with 1% formaldehyde for 10 min at room temperature. The chromatin was harvested and sonicated into fragments. The fragmented chromatin was immunoprecipitated using CREB or phospho-CREB (Ser133) antibody, respectively, overnight at 4°C, with IgG served as the control. Successively to the decrosslink, the immunoprecipitated DNA was eluted from protein G agarose beads and subjected to qPCR analysis. The PCR primers for ChIP are listed in Table S3.
IP assay
Cells were washed with ice-cold PBS and NP40 lysis buffer (50 mM Tris, 150 mM NaCl, 1% NP-40, 1 mM sodium pyrophosphate, 25 mM β-glycerophosphate, 1 mM sodium orthovanadate, 1 mM sodium fluoride) containing protease inhibitors. The cell lysates were centrifuged, and the supernatant was collected. The protein concentration was determined using BCA Protein Assay Kit (Thermo Fisher scientific). A total of 1 mg of protein was incubated with appropriate antibody overnight at 4°C (5 μg/ml) and then incubated with protein A/G magnetic beads (MedChemExpress). Beads were washed four times in IP buffer followed by eluting immune complexes in SDS sample buffer. Immunoprecipitates and whole cell lysates were boiled in SDS loading buffer for Western blot.
NOR test
The NOR test was conducted as described previously (Lourenco et al., 2019; Yanagida et al., 2017). In brief, mice were acclimated to the testing room for 5 d before testing. After that, the mice were allowed to explore freely in the empty open-field box (40 × 40 × 40 cm) for 10 min. 24 h after habituation, mice were placed in the same box in the presence of two identical sample objects and were allowed to explore for 10 min. After an intersession interval of 1 h, mice were placed in the same box with one of the two objects replaced by a novel object. Mice were then allowed to explore for 5 min for the test. For analysis, the recognition (or preference) index was calculated by the ratio of the time spent exploring the novel object to the total time spent exploring both the novel and the familiar objects.
Y maze test
The Y maze consists of three arms with an angle of 120° between each other. Y-maze test was performed as described previously (Fu et al., 2017; Kraeuter et al., 2019; Onaolapo et al., 2015). In brief, the first trial (training) with 10-min duration was performed to allow the mouse to explore only two arms (start arm and familiar) of the maze, with the third arm (novel arm) blocked. The second trial (testing) was conducted after a 1-h interval; mice were placed back in the maze in the same starting arm, with free access to all three arms, for 5 min. The test results were analyzed as described previously (Fu et al., 2017). Briefly, the time, ambulation, and number of visits in both the novel and familiar arm were recorded by the investigator, and the exploration time, ambulation, number of the novel arm was quantified in percent of both novel and familiar arms.
Statistical analysis
The data were presented as mean ± SD. All data were analyzed using GraphPad Prism software. Statistical significance between two groups was assessed using the unpaired two-tailed Student’s t test. One-way ANOVA was used to compare multiple groups. P < 0.05 was considered as statistically significant. Data distribution was assumed to be normal, but this was not formally tested.
Online supplemental material
Fig. S1 shows the identification and characterization of the mice with endothelial deletion of Atg7. Fig. S2 shows that Atg7 deletion in HBMECs reduces the expression of fibronectin but not occludin and claudin-5. Fig. S3 shows that Atg7 deletion has no effect on caveolae-mediated transcytosis. Fig. S4 shows that endothelial knockdown of fibronectin reduces astrocyte adhesion and increases the permeability of in vitro BBB model. Fig. S5 shows that the fibronectin reduction induced by Atg7 depletion is independent of autophagy inhibition. Fig. S6 shows the analysis of the post-transcriptional regulation of fibronectin by Atg7 and the identification of CREB-dependent fibronectin expression. Fig. S7 shows that the expression of active CREB in BMECs rescues the increased permeability induced by Atg7 knockout. Table S1 shows the differentially expressed genes in Atg7-depleted HBMECs compared to the control HBMECs obtained by high-throughput mRNA transcriptome analysis. Table S2 includes the oligonucleotide sequence of siRNAs used in this study. Table S3 contains the primer information used in this study. Table S4 includes the antibodies information used in this study.
Acknowledgments
The authors are thankful to Dr. Monique Stins (Department of Pediatrics, John Hopkins University School of Medicine, Baltimore, MD, USA) for supplying HBMECs. The authors are grateful to Dr. Tomoki Chiba (Department of Molecular Oncology, Tokyo Metropolitan Institute of Medical Science, Bunkyo-ku, Tokyo, Japan) for providing the Atg7loxP/loxP mice.
This research was supported by the National Natural Science Foundation of China (32171108, 31771258, 31571057, 31701024, 31171291, 31870832), Key R&D Program from Department of Science & Technology of Liaoning Province (2019JH2/10300020), the Innovation Team Project from the Educational Department of Liaoning Province (LT2016004), and the key project of the Natural Science Foundation of the Liaoning Province (20170520420).
Author contributions: Y.-H. Chen and W.-D. Zhao designed the experiments and wrote the manuscript; L. Cao and Y.-P. Jin provided advice for experimental design and reviewed the manuscript; H. Liu and J.-Y. Wei conducted most of the experiments and interpretation of the data; D.-S. Shang and B. Li contributed to the study design; Y. Li, M. Ban, Q. Sun, H.-J. Wang, D. Zhao, P.-G. Tong, L. Wang, K.-J. Wang, J.-L. Yue, H.-Y. Zhang, D.-X. Liu, W.-G. Fang performed sample preparation, genotyping assays, and data validation.

