


The emerging cytokine tissue inhibitor of metalloproteinases-1 (TIMP-1) correlates with the progression of inflammatory diseases, including cancer. However, the effects of TIMP-1 on immune cell activation and underlying molecular mechanisms are largely unknown. Unbiased ligand-receptor-capture-screening revealed TIMP-1-interaction with Amyloid Precursor Protein (APP) family members, namely APP and Amyloid Precursor-like Protein-2 (APLP2), which was confirmed by pull-down assays and confocal microscopy. We found that TIMP-1 triggered glucose uptake and proinflammatory cytokine expression in human monocytes. In cancer patients, TIMP-1 expression positively correlated with proinflammatory cytokine expression and processes associated with monocyte activation. In pancreatic cancer, TIMP-1 plasma levels correlated with the monocyte activation marker sCD163, and the combined use of both clinically accessible plasma proteins served as a powerful prognostic indicator. Mechanistically, TIMP-1 triggered monocyte activation by its C-terminal domain and via APP as demonstrated by in vitro interference, in silico docking, and the employment of recombinant TIMP-1 variants. Identification of TIMP-1 as a trigger of monocyte activation opens new therapeutic perspectives for inflammatory diseases.
Introduction
Systemic levels of tissue inhibitor of metalloproteinases-1 (TIMP-1) are highly elevated in a variety of inflammatory diseases, including cancer, and correlate with disease severity and outcome (Prokopchuk et al., 2018; Eckfeld et al., 2019; Hermann et al., 2021; Schoeps et al., 2021a). The multitude of TIMP-1 interaction partners considerably determines its complex biological functions, ranging from metalloproteinase inhibition to receptor-mediated signaling activity (Eckfeld et al., 2019). The antiproteolytic function of TIMP-1, harbored within its N-terminal domain (Murphy et al., 1991), served as its eponymous feature, while its cytokine function and its erythroid-potentiating activity (Docherty et al., 1985) were neglected for a long time. In recent years, cytokine features of TIMP-1 gained increased attention (Grünwald et al., 2019; Schoeps et al., 2022) and helped to explain many of its disease-associated functions (Cui et al., 2015; Park et al., 2015; Grünwald et al., 2016; Schoeps et al., 2021a). Regarding its modulatory function on immune cells, we have recently shown that TIMP-1/CD63 interaction triggers the activation of neutrophils (Schoeps et al., 2021a). Furthermore, we identified an invariant chain (CD74) as a cell surface receptor of TIMP-1 on B lymphoma cells (Schoeps et al., 2021b). Still, the interactome of TIMP-1, especially within the immune cell compartment, is far from being fully explored.
As central players in the innate immune response, monocytes are key contributors to inflammation (Ziegler-Heitbrock, 2007). Monocyte activation is characterized by upregulated glucose uptake (Kramer et al., 2014) as well as increased production of proinflammatory cytokines (Choy and Rose-John, 2017). Upon activation, human monocytes release sCD163, which serves as a monocyte-specific activation marker in vivo (Møller, 2012). Typically, proinflammatory monocyte activation is either initiated by the binding of pathogen-associated ligands, such as lipopolysaccharide (LPS) to Toll-like receptors (TLRs; Bohannon et al., 2013), or it can be induced by the binding of cytokines to their respective cell-surface receptors (Farina et al., 2004). Amyloid Precursor Protein (APP), a member of the APP family, comprised of APP, Amyloid Precursor-like Protein-1 (APLP1), and -2 (APLP2; O'Brien and Wong, 2011), is mostly known for its role in neurodegenerative disorders, such as Alzheimer’s disease (Zheng and Koo, 2011). In addition, APP has been identified as a cell surface receptor on monocytes mediating the upregulation of proinflammatory signaling as well as the production of proinflammatory cytokines (Sondag and Combs, 2004; Sondag and Combs, 2006; Sondag and Combs, 2010). Mechanistically, APP-dependent monocyte activation can be induced by anti-APP antibodies as well as by the adherence of monocytes to collagen type I (Sondag and Combs, 2004; Sondag and Combs, 2006; Sondag and Combs, 2010). However, the cytokinic ligands of APPs mediating proinflammatory monocyte activation have been so far unknown.
In this study, we explored the potential of TIMP-1 to interact with so far unknown receptors on immune cells and identified APP-mediated proinflammatory effects of TIMP-1 on monocytes. Our findings reveal a completely new feature of the cytokinic activity of TIMP-1. Since TIMP-1 is involved in many and diverse inflammatory diseases, the here identified TIMP-1-induced activation of monocytes has the potential to be clinically relevant.
Results
TIMP-1 is a novel ligand of APP and APLP2
Based on the cumulative evidence of the cytokine activity of TIMP-1 on immune cells (Schoeps et al., 2021a; Schoeps et al., 2021b; Schoeps et al., 2022), we first aimed to identify novel TIMP-1 receptors on such cells. We used a B-cell line and employed a ligand-based receptor capturing (LRC)-TriCEPS technology, allowing for unbiased detection of cell surface interaction partners of defined ligands (Frei et al., 2012). Here, a ternary molecule (“TriCEPS”) comprising three functional arms was used: one arm was coupled to the ligand of interest (LOI), the second arm crosslinked with oxidized ligand-bound receptors, and the third arm was used for enrichment during LC-MS/MS analysis (Fig. 1, A and B). Identification of interaction partners relied on the relative enrichment of proteins in the LOI-TriCEPS samples as compared with two defined control samples (BSA as well as Transferrin-TriCEPS) with known interaction patterns. In these analyses, two members of the APP family, namely APP and APLP2, turned out as candidate receptors of TIMP-1 (Fig. 1, C–F). Both proteins were confirmed as TIMP-1 interaction partners in different cell types. First, we performed pull-down assays with TIMP-1-conjugated magnetic beads exposed to cell lysates of neuronal SH-SY5Y cells, which provide a sufficient amount of protein required for the detection of human APP (Fig. 1 G) and APLP2 (Fig. 1 H). Since we aimed to analyze novel cytokinic effects of TIMP-1 on inflammation-associated innate immune cells, which, in their pro-inflammatory role, can either suppress or even promote disease progression, we then focused on APP-expressing primary human monocytes. Monocytes were the cell type of particular interest for these experiments because monocyte activation is critical for the progression of TIMP-1-associated inflammatory diseases (Gabay, 2006; Lorente et al., 2009; Shrivastava and Bhatia, 2010; Prokopchuk et al., 2018; Herr et al., 2021), and their APP-associated activation is known (Sondag and Combs, 2004). Indeed, analysis of protein colocalization using high resolution confocal microscopy demonstrated that TIMP-1 colocalized with APP (Fig. 1 I) and APLP-2 in human primary monocytes (Fig. 1 J). Notably, the fact that TIMP-1 did not exclusively colocalize with APP or APLP2 in confocal images (Fig. 1, I and J) is in agreement with the results from our TIMP-1-interactome screening approach, where, in addition to APP and APLP2, several other cell-surface interaction partners of TIMP-1 were enriched (Fig. 1, C and D).
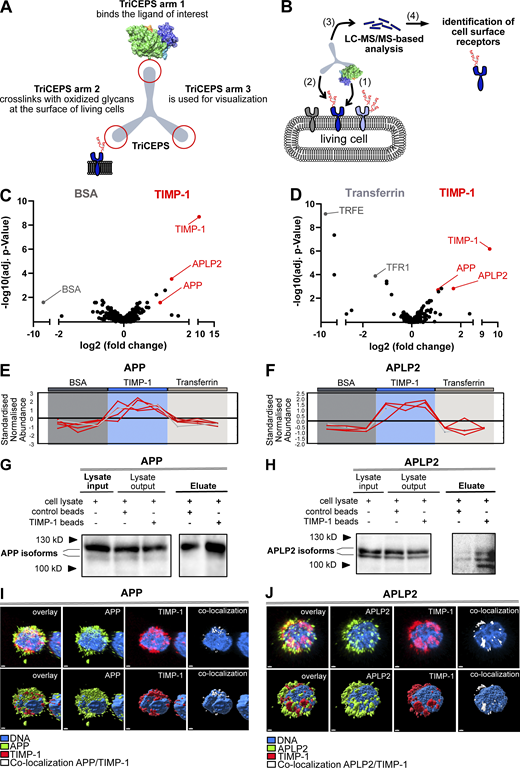
TIMP-1 is a novel ligand of APPs. (A) Functional arms of the TriCEPS molecule. Arm 1 is conjugated to the ligand of interest by an NHS-ester bond. Arms 2 and 3 are designed to bind to oxidized glycans of ligand-bound cell-surface receptors and to capture the TriCEPs-ligand-receptor complexes, respectively. (B) Experimental procedure of an LRC-TriCEPS approach. The ligand-bound TriCEPs molecule is added to living cells (1), which were oxidized prior to treatment to facilitate binding of the TriCEPs arm 2 (2). Arm 3 is used to catch the whole TriCEPs molecule for LC-MS/MS-based analysis of interaction molecules bound by arm 2 (3). (C and D) LRC TriCEPs volcano plots depicting enriched proteins from control samples and ligand of interest (TIMP-1) samples. BSA (C) and Transferrin (D) served as two controls to ensure the technical success of the experiment and to evaluate TIMP-1 candidate receptors. As compared to positive and negative controls, TIMP-1 samples led to statistically significant enrichment of APP and APLP2. The mean ratio fold change (log2 scale, x-axis) is plotted against the P value of the ratio fold change (−log10 scale, y-axis). This experiment was performed in triplicates. (E and F) Peptide profile plots depicting the relative abundance of detected peptides of APP (E) and APLP2 (F) in BSA control samples (dark gray box), TIMP-1 samples (blue box), and transferrin samples (light gray box). The abundance of detected APP and APLP2 peptides is compared with the BSA and Transferrin controls. Every red line corresponds to one detected peptide, every edge corresponds to a replicate. (G and H) Representative pull-downs of APP (G) and APLP2 (H) employing TIMP-1-coupled magnetic beads. TIMP-1-conjugated and unconjugated control beads were incubated with non-denatured cell lysates, and protein abundance in lysate inputs, lysate outputs, and eluate fractions was analyzed via Western blot. Different isoforms or differentially posttranslationally modified variants (Slunt et al., 1994; Hogl et al., 2011) of APP and APLP2 were detected. (I and J) Representative confocal images of primary human monocytes stimulated with exogenous, fluorescently labeled recombinant human TIMP-1 (Alexa555-TIMP-1) and stained for APP (I) or APLP2 (J). The nucleus is shown in blue, Alexa555-TIMP-1 is shown in red, APP (I) and APLP2 (J) are shown in green. Regions of TIMP-1/APP and TIMP-1/APLP2 colocalization are shown in white. The top panel shows confocal images; the bottom panel shows a surface depiction of the confocal images. The scale bars represent 1 μm. Source data are available for this figure: SourceData F1.
TIMP-1 is a novel ligand of APPs. (A) Functional arms of the TriCEPS molecule. Arm 1 is conjugated to the ligand of interest by an NHS-ester bond. Arms 2 and 3 are designed to bind to oxidized glycans of ligand-bound cell-surface receptors and to capture the TriCEPs-ligand-receptor complexes, respectively. (B) Experimental procedure of an LRC-TriCEPS approach. The ligand-bound TriCEPs molecule is added to living cells (1), which were oxidized prior to treatment to facilitate binding of the TriCEPs arm 2 (2). Arm 3 is used to catch the whole TriCEPs molecule for LC-MS/MS-based analysis of interaction molecules bound by arm 2 (3). (C and D) LRC TriCEPs volcano plots depicting enriched proteins from control samples and ligand of interest (TIMP-1) samples. BSA (C) and Transferrin (D) served as two controls to ensure the technical success of the experiment and to evaluate TIMP-1 candidate receptors. As compared to positive and negative controls, TIMP-1 samples led to statistically significant enrichment of APP and APLP2. The mean ratio fold change (log2 scale, x-axis) is plotted against the P value of the ratio fold change (−log10 scale, y-axis). This experiment was performed in triplicates. (E and F) Peptide profile plots depicting the relative abundance of detected peptides of APP (E) and APLP2 (F) in BSA control samples (dark gray box), TIMP-1 samples (blue box), and transferrin samples (light gray box). The abundance of detected APP and APLP2 peptides is compared with the BSA and Transferrin controls. Every red line corresponds to one detected peptide, every edge corresponds to a replicate. (G and H) Representative pull-downs of APP (G) and APLP2 (H) employing TIMP-1-coupled magnetic beads. TIMP-1-conjugated and unconjugated control beads were incubated with non-denatured cell lysates, and protein abundance in lysate inputs, lysate outputs, and eluate fractions was analyzed via Western blot. Different isoforms or differentially posttranslationally modified variants (Slunt et al., 1994; Hogl et al., 2011) of APP and APLP2 were detected. (I and J) Representative confocal images of primary human monocytes stimulated with exogenous, fluorescently labeled recombinant human TIMP-1 (Alexa555-TIMP-1) and stained for APP (I) or APLP2 (J). The nucleus is shown in blue, Alexa555-TIMP-1 is shown in red, APP (I) and APLP2 (J) are shown in green. Regions of TIMP-1/APP and TIMP-1/APLP2 colocalization are shown in white. The top panel shows confocal images; the bottom panel shows a surface depiction of the confocal images. The scale bars represent 1 μm. Source data are available for this figure: SourceData F1.
TIMP-1 induces proinflammatory features in monocytes
Given our here-identified TIMP-1/APP interaction (Fig. 1) and a previously described APP-dependent mode of monocyte activation (Sondag and Combs, 2004; Sondag and Combs, 2006; Sondag and Combs, 2010), we next addressed whether TIMP-1 can trigger monocyte activation in general. We stimulated primary human monocytes with different concentrations of TIMP-1 and analyzed glucose uptake as a typical marker of monocyte activation. Indeed, glucose uptake was induced upon stimulation of primary human monocytes with 500 ng/ml TIMP-1 (Fig. 2 A), which corresponds to the pathophysiological levels of TIMP-1 (Grünwald et al., 2016). Furthermore, primary monocytes treated with this concentration of TIMP-1 showed increased expression of a typical proinflammatory cytokine profile as observed in a cytokine array (Fig. 2, B and C; and Table S1). Based on the results of this array, we designed a panel comprising monocyte-typical, TIMP-1-induced pro-inflammatory cytokines (TIMP-1-Induced Cytokine Signature [TICS]), namely IL-6, IL-1α, TNF-α, CCL20, and CXCL1, by the evaluation of a published immune cell-type-specific transcriptome data set (Monaco et al., 2019; Fig. 2 D and Fig. S1 A). Of note, IL-3, GM-CSF, Adiponectin, EGF, and IGFBP2, which were also induced by TIMP-1-treatment (Fig. 2, B and C; and Table S1), are, in contrast to the TICS cytokines, also expressed by various other immune cells (Fig. S1, F, G, H, J, and K) and were therefore not included in the TICS panel. Stimulation of monocytes with different concentrations of TIMP-1 revealed the most significant induction of the TICS cytokines at 500 ng/ml or higher concentrations of TIMP-1 (Fig. 2, E–I). Upregulation of these cytokines by treatment with 500 ng/ml TIMP-1 was furthermore validated by Western blot (Fig. 2, J–N).
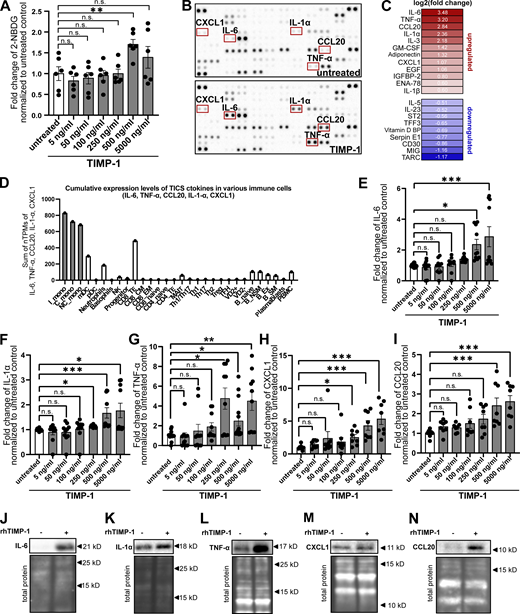
TIMP-1 induces proinflammatory features in monocytes. (A) Quantification of glucose uptake analyzed by flow cytometry. Primary human monocytes were stimulated with different concentrations human TIMP-1 (n = 10 biological replicates) or left untreated (n = 10 biological replicates), and the uptake fluorescent glucose (2-NBDG) was evaluated by calculation of geometric means of 2-NBDG in the whole monocyte population. Background of non-2-NBDG-treated cells was subtracted, and fold changes of geometric means of 2-NBDG were calculated by normalization to untreated controls. (B) Cytokine profiles of cell lysates derived from TIMP-1-stimulated and unstimulated primary human monocytes were analyzed using a Human XL Cytokine Array Kit (R&D Systems). Respective dots of the TICS cytokines (IL-6, TNF-α, IL-1α, CXCL1, and CCL20) are framed in red. (C) Quantification of fold changes of dot intensities comparing TIMP-1-treated with untreated cells. Fold changes are represented as log2 values. Upregulated cytokines are colored in different shades of red, downregulated cytokines are colored in different shades of blue. (D) Definition of the TICS panel. Sum of normalized Transcripts Per Million (nTPM) of IL-6, TNF-α, CCL20, IL-1α, and CXCL1 in different peripheral blood cells using published RNA-seq data (Monaco et al., 2019). (E–I) Quantification of fold changes of geometric means of intracellular IL-6 (E), TNF-α (F), IL-1α (G), CXCL1 (H), and CCL20 (I) in TIMP-1-treated (different concentrations, n = 10 biological replicates) and untreated (n = 10 biological replicates) primary human monocytes. For geometric mean calculation, background signals of an FMO control were subtracted and fold changes were calculated by normalization to untreated controls. (J–N) Western blots of IL-6 (J), IL-1α (K), TNF-α (L), CXCL1 (M), and CCL20 (N) in cell lysates derived from untreated or TIMP-1-treated primary human monocytes. (N and M) Total protein stains show different regions from the same blot. Data represent means ± SEM. Statistical differences between groups were analyzed employing a two-sided paired t test in the case of normal distribution or nonparametric Mann–Whitney test in the absence of normal distribution. Normality was tested using the Shapiro–Wilk normality test. Statistical differences between groups were assessed with one-way ANOVA Dunnett test for multiple comparisons between each group and a control. *, P ≤ 0.05; **, P ≤ 0.01; ***, P ≤0.001; ****, P ≤ 0.0001; n.s., not significant. Source data are available for this figure: SourceData F2.
TIMP-1 induces proinflammatory features in monocytes. (A) Quantification of glucose uptake analyzed by flow cytometry. Primary human monocytes were stimulated with different concentrations human TIMP-1 (n = 10 biological replicates) or left untreated (n = 10 biological replicates), and the uptake fluorescent glucose (2-NBDG) was evaluated by calculation of geometric means of 2-NBDG in the whole monocyte population. Background of non-2-NBDG-treated cells was subtracted, and fold changes of geometric means of 2-NBDG were calculated by normalization to untreated controls. (B) Cytokine profiles of cell lysates derived from TIMP-1-stimulated and unstimulated primary human monocytes were analyzed using a Human XL Cytokine Array Kit (R&D Systems). Respective dots of the TICS cytokines (IL-6, TNF-α, IL-1α, CXCL1, and CCL20) are framed in red. (C) Quantification of fold changes of dot intensities comparing TIMP-1-treated with untreated cells. Fold changes are represented as log2 values. Upregulated cytokines are colored in different shades of red, downregulated cytokines are colored in different shades of blue. (D) Definition of the TICS panel. Sum of normalized Transcripts Per Million (nTPM) of IL-6, TNF-α, CCL20, IL-1α, and CXCL1 in different peripheral blood cells using published RNA-seq data (Monaco et al., 2019). (E–I) Quantification of fold changes of geometric means of intracellular IL-6 (E), TNF-α (F), IL-1α (G), CXCL1 (H), and CCL20 (I) in TIMP-1-treated (different concentrations, n = 10 biological replicates) and untreated (n = 10 biological replicates) primary human monocytes. For geometric mean calculation, background signals of an FMO control were subtracted and fold changes were calculated by normalization to untreated controls. (J–N) Western blots of IL-6 (J), IL-1α (K), TNF-α (L), CXCL1 (M), and CCL20 (N) in cell lysates derived from untreated or TIMP-1-treated primary human monocytes. (N and M) Total protein stains show different regions from the same blot. Data represent means ± SEM. Statistical differences between groups were analyzed employing a two-sided paired t test in the case of normal distribution or nonparametric Mann–Whitney test in the absence of normal distribution. Normality was tested using the Shapiro–Wilk normality test. Statistical differences between groups were assessed with one-way ANOVA Dunnett test for multiple comparisons between each group and a control. *, P ≤ 0.05; **, P ≤ 0.01; ***, P ≤0.001; ****, P ≤ 0.0001; n.s., not significant. Source data are available for this figure: SourceData F2.

Pro-inflammatory features of TIMP-1. (A) Employed workflow used for selection of the TICS. (B–K) Normalized transcripts per million (nTPM) of different cytokines in different peripheral blood cells using published RNA-seq data (Monaco et al., 2019). (B) IL-6, (C) TNF-α, (D) CCL20, (E) IL-1α, (F) IL-3, (G) GM-CSF, (H) Adiponectin, (I) CXCL1, (J) EGF, and (K) IGFBP2. (L) Correlation of plasma TIMP-1 levels with plasma IL-6 levels in pancreatic cancer patients (n = 62). For statistical analyses, a Spearman rank correlation due to the absence of normal distribution was employed. Spearman rank correlation coefficient (R) and the P value are indicated. (M) Workflow (left panel) and quantification (right panel) of edema formation in pancreatic tissue derived from TIMP-1-competent (WT) as well as TIMP-1-deficient (KO) mice treated with either PBS (control) or cerulein (acute pancreatitis). (N) Plasma TIMP-1 levels (pg/ml) of pancreatic cancer patients with either high (n = 11) or low (n = 10) levels of TIMP-1 (separated by median TIMP-1 levels). The scale bars represent 200 µm. (O) Plasma sCD163 levels (pg/ml) of pancreatic cancer patients with either high (n = 11) or low (n = 10) levels of sCD163 (separated by median TIMP-1 levels). (P and Q) Overall survival of pancreatic cancer patients (n = 21) with low or high levels of sCD163 (P) or TIMP-1 (Q) in blood plasma. (R) Levels of secreted human TIMP-1 in conditioned medium from THP-1 (n = 3 biological replicates) cells and primary human monocytes (n = 3 biological replicates). (S and T) Quantification of geometric means of intracellular 2-NBDG (S; n = 4 biological replicates) or intracellular IL-6 (T; n = 3 biological replicates) levels in THP-1 cells stimulated with human recombinant TIMP-1 (500 ng/ml). (U) Representative Western blot detecting human TIMP-1 in cell lysates of wildtype and TIMP-1 Knockout THP-1 cells. Levels of secreted human TIMP-1 in conditioned medium from THP-1 wildtype (n = 3) cells and THP-1TKO (n = 3) cells. (V) Levels of secreted human TIMP-1 in conditioned medium from THP-1WT and THP-1TKO cells (n = 3). (W) Normalized geometric mean of APP in primary monocytes and THP-1TKO cells (n = 6 technical replicates). (X) Representative qRT-PCR analysis of APP mRNA expression in THP-1TKO control (shNT) and shAPP THP-1 cell lines (n = 3 technical replicates). 18S rRNA served as internal normalization control, and the expression of APP in shAPP cells was normalized to shNT control cells. (Y and Z) Quantification of geometric means of incorporated 2-NBDG (Y; n = 6 biological replicates) or intracellular IL-6 levels (Z; n = 7 biological replicates) in wildtype and TIMP-1 knockout THP-1 cells. Data are represented as mean ± SEM. Statistical differences between groups were analyzed employing a two-sided paired t test in the case of normal distribution, or nonparametric Mann–Whitney test in the absence of normal distribution was employed. Normality was tested using the Shapiro-Wilk normality test. *, P ≤ 0.05; **, P ≤0.01; ***, P ≤ 0.001; ****, P ≤ 0.0001; n.s., not significant.
Pro-inflammatory features of TIMP-1. (A) Employed workflow used for selection of the TICS. (B–K) Normalized transcripts per million (nTPM) of different cytokines in different peripheral blood cells using published RNA-seq data (Monaco et al., 2019). (B) IL-6, (C) TNF-α, (D) CCL20, (E) IL-1α, (F) IL-3, (G) GM-CSF, (H) Adiponectin, (I) CXCL1, (J) EGF, and (K) IGFBP2. (L) Correlation of plasma TIMP-1 levels with plasma IL-6 levels in pancreatic cancer patients (n = 62). For statistical analyses, a Spearman rank correlation due to the absence of normal distribution was employed. Spearman rank correlation coefficient (R) and the P value are indicated. (M) Workflow (left panel) and quantification (right panel) of edema formation in pancreatic tissue derived from TIMP-1-competent (WT) as well as TIMP-1-deficient (KO) mice treated with either PBS (control) or cerulein (acute pancreatitis). (N) Plasma TIMP-1 levels (pg/ml) of pancreatic cancer patients with either high (n = 11) or low (n = 10) levels of TIMP-1 (separated by median TIMP-1 levels). The scale bars represent 200 µm. (O) Plasma sCD163 levels (pg/ml) of pancreatic cancer patients with either high (n = 11) or low (n = 10) levels of sCD163 (separated by median TIMP-1 levels). (P and Q) Overall survival of pancreatic cancer patients (n = 21) with low or high levels of sCD163 (P) or TIMP-1 (Q) in blood plasma. (R) Levels of secreted human TIMP-1 in conditioned medium from THP-1 (n = 3 biological replicates) cells and primary human monocytes (n = 3 biological replicates). (S and T) Quantification of geometric means of intracellular 2-NBDG (S; n = 4 biological replicates) or intracellular IL-6 (T; n = 3 biological replicates) levels in THP-1 cells stimulated with human recombinant TIMP-1 (500 ng/ml). (U) Representative Western blot detecting human TIMP-1 in cell lysates of wildtype and TIMP-1 Knockout THP-1 cells. Levels of secreted human TIMP-1 in conditioned medium from THP-1 wildtype (n = 3) cells and THP-1TKO (n = 3) cells. (V) Levels of secreted human TIMP-1 in conditioned medium from THP-1WT and THP-1TKO cells (n = 3). (W) Normalized geometric mean of APP in primary monocytes and THP-1TKO cells (n = 6 technical replicates). (X) Representative qRT-PCR analysis of APP mRNA expression in THP-1TKO control (shNT) and shAPP THP-1 cell lines (n = 3 technical replicates). 18S rRNA served as internal normalization control, and the expression of APP in shAPP cells was normalized to shNT control cells. (Y and Z) Quantification of geometric means of incorporated 2-NBDG (Y; n = 6 biological replicates) or intracellular IL-6 levels (Z; n = 7 biological replicates) in wildtype and TIMP-1 knockout THP-1 cells. Data are represented as mean ± SEM. Statistical differences between groups were analyzed employing a two-sided paired t test in the case of normal distribution, or nonparametric Mann–Whitney test in the absence of normal distribution was employed. Normality was tested using the Shapiro-Wilk normality test. *, P ≤ 0.05; **, P ≤0.01; ***, P ≤ 0.001; ****, P ≤ 0.0001; n.s., not significant.
In vivo relevance of TIMP-1-associated inflammatory processes related to monocyte activation
Toward establishing a possible in vivo or clinical relevance of TIMP-1-associated inflammatory processes, we employed GSEA for unbiased analysis of biological processes associated with TIMP-1 expression in a known TIMP-1-associated inflammatory disease context, namely pancreatic cancer (PC; Grünwald et al., 2016; Hermann et al., 2021). We grouped PC patients into two subpopulations exhibiting either high (TIMP-1HI) or low (TIMP-1LO) TIMP-1 expression and calculated the respective fold-change differences in gene expression. GSEA revealed that elevated TIMP-1 levels were associated with increased expression of genes involved in inflammatory processes related to monocyte activation (e.g., “myeloid leukocyte activation,” “monocyte chemotaxis,” “acute inflammatory response,” and “positive regulation of cytokine production”; Fig. 3 A). This association was also demonstrated in other tumor entities (Fig. 3 B). A link between TIMP-1 and monocyte activation in patients was further corroborated by a highly significant positive correlation of TIMP-1 expression with the previously defined TICS panel (Fig. 3 C) in a broad variety of tumor diseases. Since monocyte activation can occur already in the circulation, we next tested whether plasma TIMP-1 levels correlate with plasma levels of IL-6, the most robust marker of TIMP-1-triggered monocyte activation that we have found in vitro (Fig. 2, B, C, and E). PC patients with high systemic levels of TIMP-1 (TIMP-1HI, Fig. 3 D) indeed exhibited higher levels of systemic IL-6 as compared with patients exhibiting low levels of TIMP-1 (TIMP-1LO, Fig. 3 D and Fig. S1 L). Importantly, a causal relationship between TIMP-1 and IL-6 was demonstrated by employing a well-established murine inflammation-associated pancreatic disease model (Hermann et al., 2021) in which TIMP-1-deficiency significantly reduced plasma levels of IL-6 (Fig. 3 E). Of note, the manifestation of pancreatic disease was comparable between TIMP-1-competent and TIMP-1-deficient mice (Fig. S1 M). Clinical relevance of TIMP-1-induced monocyte activation was further addressed by determining the levels of soluble CD163 (sCD163), the well-established monocyte-specific plasma marker for activated human monocytes (Møller, 2012), in PC patients. Here, we observed a close positive correlation between plasma sCD163 levels and TIMP-1 levels (Fig. 3 F). Although sCD163 or TIMP-1 plasma levels alone were not prognostically significant in this patient cohort (Fig. S1, N–Q), the combination of plasmaTIMP-1 with plasma sCD163 levels substantially improved the clinical value to predict patient survival (Fig. 3 G). In fact, this combination allowed the identification of a subgroup of PC patients with high systemic levels of both TIMP-1 and sCD163 (sCD163HITIMP-1HI), showing a significantly decreased survival as compared with all other patients (Fig. 3 G), highlighting the clinical relevance of TIMP-1-associated monocyte activation.

In vivo relevance of TIMP-1-associated inflammatory processes related to monocyte activation. (A) GSEA of bulk tumor RNA-seq from a PAAD data set. TIMP-1 is clearly associated with pathways related to monocyte activation (e.g., “myeloid leukocyte activation,” “humoral immune response,” “monocyte chemotaxis,” “immune response-regulating cell surface signaling pathways,” “acute inflammatory response,” and “positive regulation of cytokine production”). (B) GSEA of various RNA-seq data sets from different cancer entities. Biological processes showing a strong correlation with TIMP-1 are indicated. (C) Correlation of expression of TICS cytokines with TIMP-1 mRNA expression determined in a published transcriptome data set of patient-derived tumors of several cancer entities. Spearman’s correlation was employed for statistics. (D) Median plasma IL-6 levels in pancreatic cancer patients exhibiting high (n = 31, TIMP-1HI patients, plasma TIMP-1 levels above 240.67 ng/ml) or low (n = 31, TIMP-1LO patients, plasma TIMP-1 levels below 240.67 ng/ml) TIMP-1. Distribution in TIMP-1LO and TIMP-1HI patient groups was performed according to the median TIMP-1 level (240.67 ng/ml) in the whole patient cohort. (E) Median plasma IL-6 levels in acute pancreatitis-bearing TIMP-1WT (n = 7) and TIMP-1−/− (n = 6) mice. Plasma IL-6 levels are depicted as MFI-values measured in flow cytometry. Statistical differences between groups were analyzed employing a nonparametric Mann–Whitney test due to the absence of normal distribution. (F) Correlation of plasma TIMP-1 levels with plasma sCD163 levels in pancreatic cancer patients (n = 21). For statistical analyses, a Spearman rank correlation due to the absence of normal distribution was employed. Spearman rank correlation coefficient (R) and the P value are indicated. Normality was tested using the Shapiro–Wilk normality test. (G) Prognostic Overall survival of pancreatic cancer patients with high levels of sCD163 and in TIMP-1 in blood plasma (sCD163HITIMP-1HI) or of all other pancreatic cancer patients. Kaplan–Meier curve of sCD163HITIMP-1HI as compared with other patients. *, P ≤ 0.05; **, P ≤ 0.01; ***, P ≤ 0.001; ****, P ≤ 0.0001; n.s., not significant.
In vivo relevance of TIMP-1-associated inflammatory processes related to monocyte activation. (A) GSEA of bulk tumor RNA-seq from a PAAD data set. TIMP-1 is clearly associated with pathways related to monocyte activation (e.g., “myeloid leukocyte activation,” “humoral immune response,” “monocyte chemotaxis,” “immune response-regulating cell surface signaling pathways,” “acute inflammatory response,” and “positive regulation of cytokine production”). (B) GSEA of various RNA-seq data sets from different cancer entities. Biological processes showing a strong correlation with TIMP-1 are indicated. (C) Correlation of expression of TICS cytokines with TIMP-1 mRNA expression determined in a published transcriptome data set of patient-derived tumors of several cancer entities. Spearman’s correlation was employed for statistics. (D) Median plasma IL-6 levels in pancreatic cancer patients exhibiting high (n = 31, TIMP-1HI patients, plasma TIMP-1 levels above 240.67 ng/ml) or low (n = 31, TIMP-1LO patients, plasma TIMP-1 levels below 240.67 ng/ml) TIMP-1. Distribution in TIMP-1LO and TIMP-1HI patient groups was performed according to the median TIMP-1 level (240.67 ng/ml) in the whole patient cohort. (E) Median plasma IL-6 levels in acute pancreatitis-bearing TIMP-1WT (n = 7) and TIMP-1−/− (n = 6) mice. Plasma IL-6 levels are depicted as MFI-values measured in flow cytometry. Statistical differences between groups were analyzed employing a nonparametric Mann–Whitney test due to the absence of normal distribution. (F) Correlation of plasma TIMP-1 levels with plasma sCD163 levels in pancreatic cancer patients (n = 21). For statistical analyses, a Spearman rank correlation due to the absence of normal distribution was employed. Spearman rank correlation coefficient (R) and the P value are indicated. Normality was tested using the Shapiro–Wilk normality test. (G) Prognostic Overall survival of pancreatic cancer patients with high levels of sCD163 and in TIMP-1 in blood plasma (sCD163HITIMP-1HI) or of all other pancreatic cancer patients. Kaplan–Meier curve of sCD163HITIMP-1HI as compared with other patients. *, P ≤ 0.05; **, P ≤ 0.01; ***, P ≤ 0.001; ****, P ≤ 0.0001; n.s., not significant.
TIMP-1-triggered monocyte activation is dependent on APP but not on APLP2
Based on the pathophysiological relevance of TIMP-1-induced monocyte activation, we next aimed to mechanistically analyze whether this activity is executed via APP and/or APLP2, which we here identified as novel TIMP-1 receptors (Fig. 1). In primary human monocytes, we interfered with TIMP-1/APP- as well as with TIMP-1/APLP2-interaction employing anti-APP or anti-APLP2 antibodies, respectively. While blockade of APLP2 did not abrogate TIMP-1-mediated production of proinflammatory cytokines (Fig. 4, A–E), interference with APP blocked TIMP-1-triggered induction of the TICS cytokines, demonstrating that APP, but not APLP2, is the relevant receptor for proinflammatory monocyte activation. As a proof of concept, we aimed to validate the relevance of APP in TIMP-1-triggered activation of monocytes in a genetically modifiable cell system. For this, we employed the THP-1 cell line, a well-established model for the differentiation and activation of human monocytes (Bruchez et al., 2020; Mulvey et al., 2021). Since THP-1 cells already showed high TIMP-1 expression (Fig. S1 R), which would render them unresponsive to exogenous addition of TIMP-1 (Fig. S1, S and T), we employed a TIMP-1-deficient variant of THP-1 cells (THP-1TKO, Fig. S1, U and V). Stimulation of THP-1TKO cells with different concentrations of TIMP-1 revealed that glucose uptake (Fig. 4 F) was significantly induced by 500 ng/ml TIMP-1, and a trend toward induction of glucose uptake was already observable with 250 ng/ml TIMP-1 (Fig. 4 F). We also analyzed the effect of different concentrations of TIMP-1 on IL-6 production and found that IL-6 was, in contrast to primary monocytes (Fig. 2 E), already induced upon treatment with 250 ng/ml TIMP-1 (Fig. 4 G). Of note, the increased responsiveness of THP-1TKO to TIMP-1 is in agreement with the finding that THP-1TKO exhibit higher levels of APP on the cell surface as compared with primary human monocytes (Fig. S1 W), rendering THP-1TKO cells a suitable model to analyze TIMP-1/APP-mediated monocyte activation. Next, we genetically interfered with APP expression in THP-1TKO cells to confirm the causal relevance of APP in TIMP-1-induced monocyte activation. Knockdown of APP (Fig. 4 H and Fig. S1 X) curtailed TIMP-1-mediated glucose uptake (Fig. 4 I) as well as the expression of IL-6 (Fig. 4 J), altogether demonstrating that TIMP-1 triggers proinflammatory monocyte activation via APP.

TIMP-1-triggered monocyte activation is dependent on APP. (A–E) Fold changes of normalized geometric means of IL-6 (A; n ranging from 6 to 12 biological replicates), IL-1α (B; n = 6 biological replicates), TNF-α (C; n ranging from 6 to 12 biological replicates), CCL20 (D; n ranging from 6 to 11 biological replicates), and CXCL1 (E; n ranging from 6 to 12 biological replicates) in TIMP-1-treated as well as untreated primary human monocytes, which were pretreated with either IgG control antibodies, anti-APP, or anti-APLP2 antibodies. Fold change differences were normalized to respective non-TIMP-1-treated cells. (F and G) Quantification of geometric means of intracellular 2-NBDG (F; n = 10 biological replicates) or intracellular IL-6 levels (G, n ranging from 6 to 10 biological replicates) in THP-1TKO cells stimulated with different concentrations of human recombinant TIMP-1. (H) Normalized geometric means of cell surface APP levels in THP-1TKO control (shNT) and two different shAPP knockdown cell lines (shAPP #1, shAPP #2; n = 4 technical replicates). (I and J) Geometric means of intracellular 2-NBDG (I; n = 9 biological replicates) and intracellular IL-6 (J; n = 7 biological replicates) in different THP-1 cell lines. For the calculation of geometric means, background signals of an FMO control were subtracted and fold changes were calculated by normalization to shNT control cells. Data are represented as mean ± SEM. Statistical differences between groups were analyzed employing a two-sided paired t test in the case of normal distribution or a nonparametric Mann–Whitney test in the absence of normal distribution. Normality was tested using the Shapiro–Wilk normality test. Statistical differences between groups were assessed with one-way ANOVA Dunnett test for multiple comparisons between each group and a control. *, P ≤ 0.05; **, P ≤ 0.01; ***, P ≤ 0.001; ****, P ≤ 0.0001; n.s., not significant.
TIMP-1-triggered monocyte activation is dependent on APP. (A–E) Fold changes of normalized geometric means of IL-6 (A; n ranging from 6 to 12 biological replicates), IL-1α (B; n = 6 biological replicates), TNF-α (C; n ranging from 6 to 12 biological replicates), CCL20 (D; n ranging from 6 to 11 biological replicates), and CXCL1 (E; n ranging from 6 to 12 biological replicates) in TIMP-1-treated as well as untreated primary human monocytes, which were pretreated with either IgG control antibodies, anti-APP, or anti-APLP2 antibodies. Fold change differences were normalized to respective non-TIMP-1-treated cells. (F and G) Quantification of geometric means of intracellular 2-NBDG (F; n = 10 biological replicates) or intracellular IL-6 levels (G, n ranging from 6 to 10 biological replicates) in THP-1TKO cells stimulated with different concentrations of human recombinant TIMP-1. (H) Normalized geometric means of cell surface APP levels in THP-1TKO control (shNT) and two different shAPP knockdown cell lines (shAPP #1, shAPP #2; n = 4 technical replicates). (I and J) Geometric means of intracellular 2-NBDG (I; n = 9 biological replicates) and intracellular IL-6 (J; n = 7 biological replicates) in different THP-1 cell lines. For the calculation of geometric means, background signals of an FMO control were subtracted and fold changes were calculated by normalization to shNT control cells. Data are represented as mean ± SEM. Statistical differences between groups were analyzed employing a two-sided paired t test in the case of normal distribution or a nonparametric Mann–Whitney test in the absence of normal distribution. Normality was tested using the Shapiro–Wilk normality test. Statistical differences between groups were assessed with one-way ANOVA Dunnett test for multiple comparisons between each group and a control. *, P ≤ 0.05; **, P ≤ 0.01; ***, P ≤ 0.001; ****, P ≤ 0.0001; n.s., not significant.
The C-terminal domain of TIMP-1 is necessary for monocyte activation
The two-domain structure of TIMP-1 is a key molecular trait contributing to the multifunctionality of TIMP-1 (Eckfeld et al., 2019; Grünwald et al., 2019). To get first insights into which of TIMP-1’s domains may be involved in interaction with APP, we performed an in silico docking approach of TIMP-1 with APP using the ClusPro 2.0 algorithm (Kozakov et al., 2013; Kozakov et al., 2017; Vajda et al., 2017; Desta et al., 2020). This algorithm revealed potential interaction sites of the full-length crystal structure of TIMP-1 (PDB accession no. 1UEA; Gomis-Rüth et al., 1997) with an ab initio predicted structure of full-length APP, which was generated by employing the RoseTTAFold algorithm (Song et al., 2013; Baek et al., 2021) due to the absence of a published APP crystal structure. Comparison of this ab initio predicted APP structure with published crystallography-derived partial structures of the APP molecule revealed high three-dimensional similarity (more than 95% of compared residues have a root-mean-square deviation [RMSD] of less than 3 Å; Fig. S2 A), rendering the ab initio–predicted APP structure as a suitable model for our molecular docking approaches. Out of 70,000 randomly assigned interactions between TIMP-1 and APP, structures of the 1,000 energetically most favorable interactions were compared and complexes were clustered based on the similarity of orientation. The three energetically most favorable clusters were chosen for further analysis (Fig. S2, B and C). All three clusters suggested that the majority of amino acids involved in TIMP-1/APP interaction are located within the C-terminal domain of TIMP-1 (Fig. S2 D). On the APP molecule, interacting residues were mostly located within the E1 domain as well as the acidic domain (Fig. S2 E). To analyze whether the C-terminal domain of TIMP-1 is necessary for mediating the identified APP-dependent effects on monocytes, we employed a recombinant variant of TIMP-1 lacking the entire C-terminal domain (N-TIMP-1) for in vitro studies. In contrast to the APP-dependent induction of glucose uptake and IL-6 levels by full-length TIMP-1 (Fig. 2, A and E), stimulation of primary human monocytes with N-TIMP-1 did not lead to an increase of glucose uptake (Fig. 5 A) or IL-6 levels (Fig. 5 B). Likewise, stimulation of THP-1TKO cells with recombinant N-TIMP-1 did not trigger the induction of glucose uptake (Fig. 5 C) or IL-6 (Fig. 5 D), indicating that the C-terminal domain is necessary for TIMP-1-mediated effects on monocytes.

In silico docking of TIMP-1 and APP. (A) Justification of the in silico predicted APP structure model using published three-dimensional structures from the Protein Data Bank. Structural similarity of the predicted APP structure with published three-dimensional structures from the protein data bank was assessed using chimera X matchmaker function (best-aligning pair of chains). Calculated root-mean square deviations (RMSDs) between predicted APP structure (reference structure) as well as published structures (match structure) were depicted as a heatmap of the APP sequence. (B) Depiction of the three energetically most favorable TIMP-1/APP complexes. The three TIMP-1 molecules are depicted in beige, blue, and pink, respectively, the extracellular part of APP is shown in dark gray, and the transmembrane part is shown in light gray. (C) Detailed view of the three TIMP-1 interaction sites on the APP structure. TIMP-1 molecules are shown in ribbon depiction and the extracellular structure of APP is shown in surface depiction. (D) Interaction residues of TIMP-1 that interact with APP molecule. Interaction residues are highlighted in gray boxes. (E) Interaction residues of APP that interact with the TIMP-1 molecule. Interaction residues are highlighted in gray boxes.
In silico docking of TIMP-1 and APP. (A) Justification of the in silico predicted APP structure model using published three-dimensional structures from the Protein Data Bank. Structural similarity of the predicted APP structure with published three-dimensional structures from the protein data bank was assessed using chimera X matchmaker function (best-aligning pair of chains). Calculated root-mean square deviations (RMSDs) between predicted APP structure (reference structure) as well as published structures (match structure) were depicted as a heatmap of the APP sequence. (B) Depiction of the three energetically most favorable TIMP-1/APP complexes. The three TIMP-1 molecules are depicted in beige, blue, and pink, respectively, the extracellular part of APP is shown in dark gray, and the transmembrane part is shown in light gray. (C) Detailed view of the three TIMP-1 interaction sites on the APP structure. TIMP-1 molecules are shown in ribbon depiction and the extracellular structure of APP is shown in surface depiction. (D) Interaction residues of TIMP-1 that interact with APP molecule. Interaction residues are highlighted in gray boxes. (E) Interaction residues of APP that interact with the TIMP-1 molecule. Interaction residues are highlighted in gray boxes.

TIMP-1 binds to APP via its C-terminal domain. (A and B) Quantification of fold changes of geometric means of intracellular 2-NBDG (A; n = 5 biological replicates) and intracellular IL-6 (B; n = 8 biological replicates) in rhN-TIMP-1-treated (equimolar to 500 ng/ml full-length TIMP-1) and untreated primary human monocytes. (C and D) Quantification of geometric means of intracellular 2-NBDG (C; n ranging from 6 to 9 biological replicates) and intracellular IL-6 levels (D; n = 7 biological replicates) in THP-1T1KO cells treated with rhN-TIMP-1 (equimolar to 500 ng/ml full-length TIMP-1). For the calculation of geometric means, background signals of an FMO control were subtracted and the fold changes were calculated by normalization to untreated cells. Data are represented as mean ± SEM. Statistical differences between groups were analyzed employing a two-sided paired t test in the case of normal distribution, or a nonparametric Mann–Whitney test in the absence of normal distribution was employed. Normality was tested using the Shapiro–Wilk normality test. *, P ≤ 0.05; **, P ≤ 0.01; ***, P ≤ 0.001; ****, P ≤ 0.0001; n.s., not significant.
TIMP-1 binds to APP via its C-terminal domain. (A and B) Quantification of fold changes of geometric means of intracellular 2-NBDG (A; n = 5 biological replicates) and intracellular IL-6 (B; n = 8 biological replicates) in rhN-TIMP-1-treated (equimolar to 500 ng/ml full-length TIMP-1) and untreated primary human monocytes. (C and D) Quantification of geometric means of intracellular 2-NBDG (C; n ranging from 6 to 9 biological replicates) and intracellular IL-6 levels (D; n = 7 biological replicates) in THP-1T1KO cells treated with rhN-TIMP-1 (equimolar to 500 ng/ml full-length TIMP-1). For the calculation of geometric means, background signals of an FMO control were subtracted and the fold changes were calculated by normalization to untreated cells. Data are represented as mean ± SEM. Statistical differences between groups were analyzed employing a two-sided paired t test in the case of normal distribution, or a nonparametric Mann–Whitney test in the absence of normal distribution was employed. Normality was tested using the Shapiro–Wilk normality test. *, P ≤ 0.05; **, P ≤ 0.01; ***, P ≤ 0.001; ****, P ≤ 0.0001; n.s., not significant.
Discussion
In this study, we identified APP and APLP2 as novel cell-surface receptors of TIMP-1 by an unbiased LRC-TriCEPS approach, which was further validated by pull–down assays as well as confocal microscopy. In addition, we showed that TIMP-1 triggers the activation of human monocytes in an APP-dependent but APLP2-independent manner.
TIMP-1 is a multifunctional protein exerting antiproteolytic as well as cytokinic activities (Grünwald et al., 2019). By employing the N-TIMP-1 variant, we showed that the C-terminal domain of TIMP-1 is necessary for the activation of monocytes, which was in line with the results obtained from the in silico docking analysis. Since N-TIMP-1 is still antiproteolytically active (Murphy et al., 1991), these data show that TIMP-1-triggered monocyte activation is not mediated via its antiproteolytic function, but via its emerging cytokine-like function. In addition to APP, we have recently identified CD74 as a functional TIMP-1 receptor on immune cells (Schoeps et al., 2021b). Interestingly, CD74 was previously shown to interact with APP, but not with APLP2 (Matsuda et al., 2009). The fact that specifically APP, but not APLP2, turned out as a functional receptor of TIMP-1 triggering monocyte activation may suggest the potential involvement of CD74 (e.g., as coreceptor) in this process. Further investigation in future studies is needed to address such possible interdependencies.
APP was previously shown to trigger activation of monocytes upon antibody-dependent crosslinking of APP as well as by adhesion to collagen type I (Sondag and Combs, 2004; Sondag and Combs, 2006; Sondag and Combs, 2010), but soluble cytokinic ligands triggering this activation were so far unknown. Therefore, the here-described identification of TIMP-1 as a functional cytokinic ligand of APP unveils a completely new mechanism of monocyte activation. Regarding the TIMP-1-interaction sites on the APP molecule, molecular docking suggested predominantly residues within the N-terminal extracellular E1 as well as the acidic domains of APP as interaction regions with TIMP-1. The N-terminal domain of APP contains different structural traits including a hydrophobic patch, which is discussed to be involved in APP dimerization, mediating ligand-induced signaling (Rossjohn et al., 1999). Interestingly, residues on the APP molecule that were proposed to participate in interaction with TIMP-1 are located within or in close proximity to this hydrophobic patch, suggesting that this region may be important for TIMP-1/APP-induced activation of monocytes. While APP-dependent monocyte activation via collagen type-1 typically occurs during the adhesion of monocytes to the vascular endothelium or during tissue infiltration (Sondag and Combs, 2010), the here-described TIMP-1-mediated monocyte activation likely represents a separate pathway occurring already within the circulation since TIMP-1 levels are highly increased in the blood during most inflammatory processes (Eckfeld et al., 2019; Schoeps et al., 2022).
Importantly, we could show in vivo relevance of these proinflammatory features of TIMP-1 since TIMP-1 was associated with monocyte activation in patient-derived clinical samples and was identified as a decisive regulator of IL-6 levels during inflammation-associated diseases. Since monocytes are critical for inflammatory processes in many diseases, the here-described mechanism may be of broad relevance. Activation of monocytes (Augier et al., 2010; Robinson et al., 2021) and the subsequent production of inflammatory cytokines such as IL-6 (Kong et al., 2016) have been shown to drive the progression of many diseases including cancers (Lesina et al., 2014), as well as less-malignant diseases such as acute pancreatitis (Shrivastava and Bhatia, 2010), sepsis (Haveman, 1999), or COVID-19 (Jafarzadeh et al., 2020). Importantly, TIMP-1 is also associated with the progression of these diseases (Lorente et al., 2009; Prokopchuk et al., 2018; Hermann et al., 2021; Herr et al., 2021), suggesting that the here discovered pathway of monocyte activation is relevant in a variety of inflammatory conditions. In fact, the combination of TIMP-1 with sCD163, a marker of monocyte activation (Møller, 2012), substantially improved the stratification of PC patients with respect to survival. Given our observation that TIMP-1 interacts with APP also in neuronal cells and the fact that APP is decisive in neurodegenerative disorders such as Alzheimer’s disease (O'Brien and Wong, 2011), the clinical relevance of the here-identified TIMP-1/APP interaction may go far beyond monocyte-related inflammation-associated diseases.
Altogether, these results further corroborate and mechanistically extend the appreciation of TIMP-1 as an inflammatory cytokine capable of modulating distinct immune cell functions via a variety of cellular receptors (Schoeps et al., 2022).
Materials and methods
Patients and clinical samples
Human blood samples from pancreatic cancer patients were collected in an EDTA tube (S-Monovette, Sarstedt) and mixed immediately by gently inverting the tube. The blood sample was centrifuged for 15 min at 2,000 × g at 15°C and the plasma was snap-frozen in liquid nitrogen and stored at −80°C until further analysis. Patients did not have signs of acute inflammation at the time point of blood collection. An approval for this study was obtained from the Ethics Committee of the Medical Faculty of the Technical University of Munich (Germany; #183/18S, #409/16S, #395/17S). Written consent was obtained from all participants before inclusion in the study, and all participants agreed to participate in this study. Analysis of patient overall survival was conducted on a pseudonymized dataset. The separation of patients into subpopulations with low or high plasma levels of TIMP-1 or sCD163, respectively, was achieved based on the respective cohort median.
Animal models and experiments
Animal experiments were performed according to the Animal Research Reporting of in vivo experiment guidelines and in compliance with the Tierschutzgesetz des Freistaates Bayern and approved by the Regierung von Oberbayern. Male mice were employed in this study and kept at the animal facility of Klinikum rechts der Isar (Munich, Germany) at RT (21°C) under specific pathogen-free conditions. Mice were maintained in filter-topped cages with autoclaved food and water. In this study, acute pancreatitis was induced in mice (WT C57BL/6J; Charles River) as well as TIMP-1-deficient mice with C57BL/6 background (TIMP-1−/−, in-house breeding) by repetitive injections of cerulein, as previously described (Hermann et al., 2021). Mice were sacrificed 24 h after cerulein injection. Blood was collected using EDTA-coated syringes and immediately centrifuged at 500 g for 5 min at 4°C. The plasma samples were snap-frozen in liquid nitrogen and stored at −80°C. As previously described, mouse pancreas tissue was fixed in 2% neutral buffered formalin solution for 48 h, dehydrated under standard conditions (ASP300S; Leica), and embedded in paraffin. 2-µm sections were prepared with a rotary microtome (HM355S; Thermo Fisher Scientific), and H&E staining was performed on deparaffinized sections according to standardized protocol by the Institute of Pathology, Technical University of Munich, Germany.
Measurement of IL-6 in plasma of pancreatitis-bearing mice
Plasma levels of IL-6 in pancreatitis-bearing mice were measured using the LEGENDPlex Mouse Inflammation Panel (#640150; Biolegend) according to the manufacturer’s instructions. For data evaluation, adjusted MFI values of IL-6 were compared between pancreatitis-bearing TIMP-1-competent and TIMP-1-deficient mice.
Automated quantification of edema formation in pancreas tissue
To quantify the extent of tissue injury of the pancreas in the pancreatitis mouse model, imaging of H&E stainings from pancreas tissue was performed with the microscope Axio Imager M2 by taking five representative pictures from each sample. Automated quantification of edema formation was performed using CellProfiler version 2.2.0 (Carpenter et al., 2006). For this, colored pictures of H&E stainings were converted to gray using the function “ColorToGrey” and then further converted to binary pictures employing the intensity threshold value 0.85 with the function “Threshold” (Fig. S1 M). Using these converted pictures, the water content, defined as negative pixels, as well as the cell content, defined as positive pixels, within the pancreas tissue was quantified with the function “MeasureImageAreaOccupied”. Relative abundance of edema in pancreas tissue was considered as water content (negative pixels) normalized to total tissue (negative + positive pixels), while the relative water content of PBS-treated mice was subtracted from each sample to remove the background.
Cell lines
The human SH-SY5Y cell line was kindly provided by Stefan Lichtenthaler (DZNE, München; Chair for neuroproteomics at the Technical University of Munich) and was cultured in DMEM/F12 supplemented with 10% FBS and 1% glutamine at 37°C, 5% CO2. The human B lymphoma cell line Namalwa was kindly provided by Ghislain Opdenakker (KU Leuven, Leuven, Belgium) and was cultured in RPMI 1640 (Thermo Fisher Scientific Inc.) supplemented with 7.5% FBS. The human THP-1 cell lines (THP-1WT as well as THP-1TKO) were kindly provided by Ghislain Opdenakker (KU Leuven, Leuven, Belgium) and cultured in RPMI 1640 (Thermo Fisher Scientific Inc.) supplemented with 10% FBS. Knockout of TIMP-1 in THP-1TKO cells was verified by Western blot (Fig. S1 U) and ELISA of cell culture supernatants (Fig. S1 V). THP-1TKO cells showed lower basal glucose uptake (Fig. S1 Y) as well as lower basal levels of IL-6 (Fig. S1 Z).
Production and purification of recombinant human TIMP-1 and N-TIMP-1
Recombinant human TIMP-1 (rhTIMP-1) and N-TIMP-1 (rhN-TIMP-1) were produced and purified in an endotoxin-free system of HEK293F cells (Thermo Fisher Scientific Inc.) harboring a eukaryotic (pcDNA 3.1) expression plasmid encoding for the Igkappa antibody chain secretion sequence followed by the sequences encoding for human TIMP-1 or N-TIMP-1, as described previously (Schoeps et al., 2021a). Cells were cultured in Erlenmeyer flasks at 37°C, 8% CO2, and 125 rpm on an orbital shaker according to manufacturer’s protocol. rhTIMP-1- or rhN-TIMP-1-containing supernatant was purified using an Äktapure Fast Protein Liquid Chromatography (FPLC) system (Cytiva Europe GmbH). The supernatant was applied onto a Capto Q sepharose (Cytiva Europe GmbH) column using the ion exchange chromatography (IEX) equilibration buffer (20 mM HEPES/KOH pH 7.5, 5 mM EDTA, 0.5% Brij35) and the flow through was diluted to a conductivity of maximum 6 mS/cm. Subsequently, it was applied onto a Capto SP sepharose column (Cytiva Europe GmbH) and eluted using the IEX equilibration buffer containing 1 M NaCl. rh(N-)TIMP-1-containing fractions were identified by Western blot analysis using the anti-TIMP-1 antibody (rabbit anti-human antibody; 1:1,000, cat. #8946; Cell Signaling Technology), and the identified fractions were pooled and concentrated by centrifugal filter (Amicon Ultra 15, 10 kD; Merck) according to the manufacturer’s protocol. (N-)TIMP-1-containing concentrates were applied on a HiLoad Superdex 75 pg column (Cytiva Europe GmbH) and eluted by a continuous flow of equilibration buffer (1 × PBS, pH 7.5). Elution fractions containing (N-)TIMP-1 were identified by Western blot, and purity was analyzed by Coomassie staining as well as silver staining as described elsewhere. (N-)TIMP-1-containing fractions were pooled, concentrated by a centrifugal filter (Amicon Ultra 15, 10 kD; Merck), and stored at −80°C until further use.
Isolation of primary human monocytes
PBMCs were isolated from the blood of healthy human donors by density gradient centrifugation using Polymorphprep (Progen). By employing anti-CD14 Microbeads (cat. #130-050-201; Miltenyi Biotec), CD14+ monocytes were subsequently purified by positive selection via MACS according to the manufacturer’s instructions. Monocytes were cultured in RPMI 1640 (Thermo Fisher Scientific Inc.) supplemented with 10% FCS and 1%penicillin/streptomycin. Monocytes were stimulated with endotoxin-free human recombinant (N)-TIMP-1 (respective concentrations are indicated in the figure legend) as indicated. For subsequent intracellular cytokine stainings, TIMP-1 stimulation was performed in the presence of Brefeldin A (cat. #00-4506-51; Thermo Fisher Scientific Inc.). For interference experiments, primary human monocytes were preincubated with IgG control (rabbit anti-human antibody; 5 µg/ml, #sc-2027; Santa Cruz Biotechnology), anti-APLP2 (rabbit anti-human antibody; 5 µg/ml, # NBP1-32814; Novus Biologicals), or anti-APP (rabbit anti-human antibody; 5 µg/ml, #2452; cell signaling technology) antibodies for 1 h at RT and subsequently exposed to 500 ng/ml rhTIMP-1.
Knockdown of APP using lentiviral gene transfer in THP-1 cells
Experimental procedures were followed as described previously (Seubert et al., 2015). Briefly, 5 × 10⁶ 293 T cells were seeded. After 24 h, the media was replaced, and cotransfection of transfer plasmids purchased from Sigma Aldrich (shAPP #1 (TRCN0000011042; target sequence: 5′-CCCAAAGTTTACTCAAGACTA-3′; 57.53% knockdown, validated) and shAPP #2 (TRCN0000011043; target sequence: 5′-GCCATCTTTGACCGAAACGAA-3′; 97.13% knockdown, validated) with lentiviral packaging plasmids (pMD.GP, pRSV-rev, pMD.G) was performed using lipofectamine 2000 (cat. #11668019; Thermo Fisher Scientific Inc). shRNA that does not target any known human or mouse gene (shNT) was used as a control. 2 d later, lentiviral particles were harvested from the supernatant and frozen at −80°C. Target cells (THP-1TKO) were infected with lentiviral particles in the presence of 8 µg/ml Polybrene (cat. #TR-1003-G; Sigma-Aldrich), and the selection of transduced cells was performed using 10 µg/ml puromycin. Knockdown was verified on RNA (Fig. S1 Y) and protein levels (Fig. 4 H).
LRC-TriCEPS assay
Ligand-based receptor capturing was performed using the compound TriCEPS (Dualsystems Biotech AG), which allows the identification of cell-surface receptors of defined ligands (Frei et al., 2012). The experiment was performed using a TriCEPS assay kit (Dualsystems Biotech AG) according to the manufacturer’s instructions. In total, three different coupling reactions (BSA: control #1, Transferrin: control #2, TIMP-1: ligand of interest) were performed in triplicates using human B lymphoma cells (Namalwa cell line). The pelleted cells were sent to Dualsystems Biotech AG for further preparation and final mass spectrometric analysis. Receptor capturing was conducted at a pH of 7.4 in the presence of the catalyst 2-amino-5-methoxybenzoic acid.
Pull-down assay
For pull-down assays, non-denatured cell lysate (lysis buffer: 20 mM Tris HCl, pH 8, 137 mM NaCl, 1% NP-40, 2 mM EDTA, supplemented with proteinase and phosphatase inhibitors) of SH-SY5Y cells was used. NHS Magnetic Sepharose Beads (cat. # 28-9513-80; Cytiva) were equilibrated with ice-cold HCl solution (1 mM). For coupling of rhTIMP-1 to magnetic beads, rhTIMP-1 was diluted to a final concentration of 2,000 nM in a coupling buffer (200 mM NaCH3CO3, 500 mM NaCl, pH 8.3) and added to the beads for 1 h at RT while rotating (1,100 rpm). Control beads were incubated with a coupling buffer only. TIMP-1-conjugated and control beads were blocked employing repetitive washing steps (2x) using Blocking Buffer A (500 mM Ethanolamine; 500 nM NaCl) and Blocking Buffer B (100 mM NaCH3COO−, 500 mM NaCl, pH 4.0). After final incubation in Blocking Buffer A (15 min, RT, 1,100 rpm), beads were equilibrated with TBS (Tris-buffered saline, pH 7.5), and 100 µl of SH-SY5Y non-denatured cell lysate (labeled as “input,” 2 mg/ml) was incubated overnight at 4°C. Supernatants were collected (labeled as “output”), beads were washed three times with TBS-T (Tris-buffered saline supplemented with 0.05% [vol/vol] Tween 20, Sigma-Aldrich, pH 7.5), and proteins bound to TIMP-1 were eluted using loading Buffer (0.2 M Tris, 0.03% SDS, 0.07% Glycerin, 0.002% bromphenol blue, 0.05 β-mercaptoethanol) for 5 min at 95°C (labeled as “elution”). Samples were stored at −80°C and analyzed using Western blot.
Western blot
For Western blot analyses, equal amounts of protein were resuspended in loading buffer (0.2 M Tris, 0.03% SDS, 0.07% Glycerin, 0.002% bromphenol blue, 0.05 β-mercaptoethanol) and incubated for 5 min at 95°C. Samples were centrifuged (13,000 × g, 3 min, 4°C) and separated by a 12.5% SDS PAGE (for subsequent detection of TIMP-1, IL-6, and IL-1α) or 20% SDS PAGE (for subsequent detection of CCL20, CXCL1, and TNF-α). Proteins were transferred onto a nitrocellulose membrane (Amersham Bioscience) using a TransBlot semi-dry blotting system (BioRad Laboratories Inc.). After protein transfer, total protein was stained using the SYPRO Ruby Protein Blot stain (cat. S4817; Thermo Fisher Scientific Inc.) according to the manufacturer’s instructions. After total protein stain, membranes were blocked with 5% BSA in TBS-T (1× TBS containing 0.1% Tween 20) for 1 h at RT and incubated with primary antibodies against TIMP-1 (rabbit anti-human antibody; cat. #8946, Cell Signaling Technology), IL-6 (cat. #12153; Cell Signaling Technology), CXCL-1 (rabbit anti-human antibody; cat. #24376; Cell Signaling Technology), TNF-α (rabbit anti-human antibody; cat. #6945; Cell Signaling Technology), IL-1α (cat. #84618; Cell Signaling Technology), or CCL20 (goat anti-human antibody; cat. #BAF360; R&D Systems, Inc.) diluted in 5% BSA in TBS-T overnight at 4°C. Membranes were washed three times with TBS-T at RT and incubated with secondary goat anti-rabbit IgG HRP-conjugated antibody solutions (1:5,000; cat. #31462; Thermo Fisher Scientific Inc.) or streptavidin-HRP (1:5,000, cat. #43-4323; Thermo Fisher Scientific Inc.) for 1 h at RT. Membranes were washed three times with TBS-T and bands were visualized using the Pierce ECL substrate (Thermo Fisher Scientific Inc.). Bands were detected employing the ChemiDoc imaging system (BioRad Laboratories Inc.) and the ImageLab Software (BioRad Laboratories Inc.).
qRT-PCR
For qRT-PCR analysis, total RNA from THP-1 cells was isolated using TRIzol (Thermo Fisher Scientific) as described previously (Grünwald et al., 2016). Reverse transcription for subsequent analysis of mRNA expression levels was performed using the High Capacity cDNA Reverse Transcription Kit (cat. #4368814; Applied Biosystems) according to the manufacturer’s instructions. The following primers were used for qRT-PCR analysis: TIMP-1 (forward: 5′-TGCGGATACTTCCACAGGTC-3′, reverse: 5′-ATGGATAAACAGGGAAACACTGTGC-3′), human APP (forward: 5′-GCCCGAGATCCTGTTAAACT-3′, reverse: 5′-ACCTGCCTAAAGCCGACAG-3′), human 18S rRNA (forward: 5′-CCATCCAATCGGTAGTAGCG-3′, reverse: 5′-GTAACCCGTTGAACCCCATT-3′). Real-time qRT-PCR was performed using the LightCycler 480 (Roche Diagnostics) and the Takyon No ROX SYBR 2× MasterMix blue dTTP (cat. #UF-NSMT-B0710; Eurogentec) according to the manufacturer’s instructions. 18S ribosome was used as the reference gene for normalization.
Human XL cytokine array
The Proteome Profiler Human XL Cytokine Array (cat. #ARY022B; R&D Systems) was performed according to the manufacturer’s instructions. For sample preparation, primary human monocytes were isolated from healthy human donors, treated with 500 ng/ml rhTIMP-1 for 5 h in presence of Brefeldin A (cat. #00-4506-51; Thermo Fisher Scientific Inc.) and lysed using Lysis Buffer 17 (cat. #8995943; R&D Systems) supplemented with 10 μg/ml Aprotinin, 10 μg/ml Leupeptin, and 10 μg/ml Pepstatin. Each membrane was incubated with 170 µg total protein and developed using the ChemiDoc imaging system (BioRad Laboratories Inc.) and the ImageLab Software (BioRad Laboratories Inc.). For analysis, the intensity of each dot was determined, and the means of two dots corresponding to one defined cytokine were normalized to the means of all six reference spots to control for equal protein loading.
Intracellular cytokine measurement via flow cytometry
Intracellular cytokine stainings were performed employing the FIX & PERM Cell Fixation & Cell Permeabilization Kit (GAS004; Thermo Fisher Scientific Inc.) according to the manufacturer’s instructions. In short, primary human monocytes or THP-1 cells were treated with recombinant human TIMP-1 for 5 h in presence of Brefeldin A. THP-1 cells were starved for 24 h prior to stimulation in serum-free media supplemented with 5% BSA. Cells were fixed and stained for IL-6 (BV421, rat anti-human antibody; diluted 1:50 in permeabilization buffer, cat. #563279; BD Biosciences), IL-1α (FITC, mouse anti-human antibody; diluted 1:50 in permeabilization buffer, cat. #11711882; Thermo Fisher Scientific Inc.), TNF-α (mouse anti-human antibody; PE, diluted 1:50 in permeabilization buffer, cat. #12-7349-41; Thermo Fisher Scientific Inc.), CXCL1 (mouse anti-human antibody; PE, diluted 1:50 in permeabilization buffer, cat. #IC275P; R&D Systems, Inc.), or CCL20 (mouse anti-human antibody; ABIN192397, antikörper-online.de, Aachen, Deutschland) for 30 min at 4°C. Flow cytometric analysis was performed with the SA3800 Spectral Analyser (Sony Biotechnology Inc) and data were evaluated using FlowJo Software (version.10.6., Tree Star, Inc).
Cell-surface staining employing flow cytometry
For surface staining of human APP, cells were washed twice with PBS and incubated with anti-APP AlexaFluor488 antibodies (mouse anti-human antibody; 1:100, cat. #MAB348A4; Merck KGaA) in the presence of Fc Receptor Block (Human TruStain FcX, cat. #422302; Biolegend) for 30 min at 4°C. Flow cytometry was performed with the SA3800 Spectral Analyser (Sony Biotechnology Inc.) and analyzed using FlowJo Software (version.10.6.,1Tree Star, Inc., Ashland, OR).
Glucose uptake assay
For glucose uptake assays, freshly isolated primary human monocytes or THP-1 cells were stimulated with rhTIMP-1 for 3 h or 24 h at 37°C and 5% CO2, respectively. THP-1 cells were starved for 24 h prior to stimulation in serum-free media supplemented with 5% BSA. Afterward, 50 µM 2-NBDG (cat. #N13195; Thermo Fisher Scientific Inc.) was added for 30 min at 37°C, cells were washed twice with PBS, and glucose uptake was analyzed by flow cytometry using the SA3800 Spectral Analyser (Sony Biotechnology Inc) and FlowJo Software (version.10.6., Tree Star, Inc).
ELISA
ELISA measurements were performed as described previously (Schoeps et al., 2021a). ELISA reagents were prepared according to the instructions provided by the DuoSet ELISA Ancillary Reagent Kit 2 (cat. #DY008; R&D Systems, Inc.).
Human IL-6 ELISA
In pancreatic cancer patients, plasma IL-6 levels were determined using the Human IL-6 DuoSet ELISA Development System (cat. #DY206; R&D Systems). The ELISA was carried out according to the manufacturer’s protocol using a reagent diluent consisting of 1% BSA in PBS. In short, 96-well plates were overnight coated with the mouse anti-human IL-6 capture antibody (2 µg/ml in PBS, 100 µl per well), and afterward, the uncoated plastic surface was blocked using reagent diluent (300 µl per well) for 1 h at RT. 100 µl of either standard, reagent diluent (background measurement), positive control, or plasma samples (undiluted) were added in duplicates and incubated for 2 h at RT. The goat anti-human detection antibody (50 ng/ml in reagent diluent, 100 µl per well) was incubated for 2 h at RT. After each step, wells were washed three times with PBS and incubation occurred in the dark while the plate was shaken at 600 rpm.
Human sCD163 ELISA
Plasma TIMP-1 levels were determined in healthy human donors or PDAC patients using the Human CD163 DuoSet ELISA kit (cat. #DY1607-05; R&D Systems) according to the manufacturer’s instructions. In brief, anti-CD163 antibodies (2 µg/ml in PBS, 100 µl per well) were coated onto 96-well plates overnight at RT. Plasma samples (diluted 1:100 in reagent diluent) or reagent diluents (background measurement) were added to the wells in duplicates and incubated for 2 h at RT. After washing three times, anti-CD163 antibodies (1 µg/ml diluted in reagent diluent, 100 µl per well) were added to the wells and incubated for 2 h at RT in the dark.
Human TIMP-1 ELISA
TIMP-1 levels in conditioned medium from primary human monocytes or THP-1 cell lines (2*106 cells per well, cultivated in serum-free media complemented with 0.1% BSA for 24 h at 37°C, 5% CO2) as well as plasma TIMP-1 levels from PDAC patients were determined using the TIMP-1 DuoSet ELISA kit (cat. #DY970-05; R&D Systems) according to manufacturer’s instructions. In short, anti-TIMP-1 antibodies (2 µg/ml in PBS, 100 µl per well) were coated onto 96-well plates overnight at RT. Cell culture supernatants (diluted 1:10 in reagent diluent), plasma samples (1:500 dilution in reagent diluent), or reagent diluents (background measurement) were added to the wells in duplicates and incubated for 2 h at RT. After washing three times, anti-TIMP-1 antibodies (50 ng/ml diluted in reagent diluent, 100 µl per well) were added to the wells and incubated for 2 h at room temperature in the dark.
Immunostaining and confocal microscopy
Fluorescent labeling of rhTIMP-1 was performed by employing 100 μg of recombinant human TIMP-1, which was labeled using the Alexa Fluor555 Microscale Protein Labeling Kit (cat. #A30007; Thermo Fisher Scientific Inc.) according to the manufacturer’s instructions. For stimulation of cells with fluorescently labeled TIMP-1, 1 × 10⁶ freshly isolated primary human monocytes were stimulated with Alexa555TIMP-1 (70 nM) for 30 min on ice, and the non-bound ligand was rigorously washed off with ice-cold PBS (3×). Cells were fixed with 4% PFA for 15 min at RT, washed twice with PBS, and permeabilized by 0.5% Triton X-100 in PBS for 10 min at RT. After washing (2× with PBS), cells were blocked with 5% horse serum in PBS and stained for APP or APLP2 using anti-APP or anti-APLP2 antibodies (rabbit anti-APP; 1:50, cat. #NBP-76910; rabbit anti-APLP2: 1:100, cat. #NBP132814; both from Novus Biologicals) diluted in blocking solution overnight at 4°C. After washing (2× with PBS), cells were incubated with secondary antibody (1:500, cat. #SA5-10041, donkey anti-rabbit IgG-DyLight650, Thermo Fisher Scientific Inc.,) diluted in blocking solution for 1 h at RT. Nuclei were stained with DAPI (1:100, #A4099; AppliChem) for 10 min at RT and mounted using Roti-Mount FluorCare (Carl Roth), and the slides were stored at 4°C until imaging. Stainings were analyzed on an inverted TCS SP8 confocal microscope (Leica) for tiled imaging using an HC PL APO CORR CS2 63×/1.30NA objective at RT.
Image analysis
Adaptive image deconvolution was applied to acquired 3-D images using the Leica TCS SP8 LIGHTNING tool. Deconvoluted images were analyzed using Imaris 9.7. software (Bitplane). The Imaris surface generation tool was used to reconstruct 3-D surfaces for individual cells and subcellular structures.
Molecular docking
For in silico prediction of TIMP-1-APP complexes, the molecular docking software ClusPro 2.0 (Kozakov et al., 2013; Kozakov et al., 2017; Vajda et al., 2017; Desta et al., 2020) was used. The spatial coordinates for the molecular docking were retrieved from the Protein Data Bank for a 20 kD human TIMP-1 monomer (PDB accession no. 1UEA; Gomis-Rüth et al., 1997). Since no full-length structure of the APP is published, we used the ab initio prediction algorithm robetta (Song et al., 2013; Baek et al., 2021) to predict a full-length structure of the APP770 amino acid sequence. The best-ranked structure was used for the evaluation of the predicted APP structure. Already published structures of APP domains (E1-domain: 3KTM, 4PWQ; KPI-domain: 1AAP; E2-domain: 3NYL, 5TPT; trans-membrane domain: 6YHF) were retrieved from the Protein Data Bank and imported into UCSF Chimera X (version 1.15) together with the best-ranked predicted APP structure. Published structures were three-dimensionally aligned to the predicted APP structure using the Matchmaker function, and the root-mean square deviation (RMSD) of the aligned residues of the predicted APP structure to the published structures was determined. An RMSD >3 Å was used as a high three-dimensional similarity. Published structures showed high three-dimensional similarity with the predicted full-length structure and were further used for TIMP-1/APP docking experiments. Coordinates for TIMP-1 and APP as whole molecules as well as the respective active and passive residues were entered into the Cluspro 2.0 webserver, generating 70,000 complexes of TIMP-1 and APP. The 1,000 energetically most favorable complexes were then used for clustering based on the similarity of the respective TIMP-1/APP interaction. The three best-ranked structures (according to the energetically most favorable conformation) were employed for further analysis as visualized. The three lowest-scoring clusters (balanced mode) were used for interface analysis and visualization. For interface analysis, the DockScore webserver (Malhotra et al., 2015) was used. The respective complex coordinates were entered as whole complexes into the Dockscore software that calculated interface residues. A comparison of the interface residues on TIMP-1 and APP of the different complexes was conducted by Microsoft Excel. For the representation of complexes, UCSF Chimera X (version 1.15; Goddard et al., 2018; Pettersen et al., 2021) was used.
Analysis of patient-derived immune cell type-specific transcriptome data
For identification of the TICS, recently published RNA sequencing (RNA-seq) data (Monaco et al., 2019) derived from 29 immune cell types within the peripheral blood mononuclear cells (PBMC) fraction of four healthy donors were downloaded from the Gene Expression Omnibus (GEO) database (https://www.ncbi.nlm.nih.gov/geo/; accession no. GSE107011). The mean expression of each target gene was calculated for each immune cell type by employing the immune cell type-specific gene expression from the four different healthy donors.
Analysis of patient-derived bulk tumor transcriptome data
For correlation of TIMP-1 mRNA expression with expression of the genes comprising the TICS, published bulk tumor RNA-seq data from patients with invasive breast carcinoma (BRCA), colorectal adenocarcinoma (COADREAD), glioma (GBMLGG), kidney cancer (KIPAN), liver hepatocellular carcinoma (LIHC), lung adenocarcinoma (LUAD), pancreatic adenocarcinoma (PAAD), or skin cutaneous melanoma (SKCM) were downloaded from the FireBrowse database (http://firebrowse.org, accession no. BRCA, COADREAD, GBMLGG, KIPAN, LIHC, LUAD, PAAD, or SKCM, respectively). For each cancer patient cohort, only RNA-seq data derived from patient-derived primary tumor samples (sample type code “01”, i.e., “primary solid tumor”) was included for further analysis, while RNA-seq data derived from non-primary tumor samples (sample type code other than “01”) were excluded. An exception was the SKCM cohort, where RNA-seq data from primary tumor samples as well as from regional subcutaneous tumors was included for further analysis, while RNA-seq data from lymph nodes as well as distant metastases were excluded.
Gene Set Enrichment Analysis (GSEA) of primary tumor transcriptome data
To identify biological processes that are associated with TIMP-1 expression in different cancer entities, patient-derived primary tumor samples from FireBrowse cancer cohorts (BRCA, COADREAD, GBMLGG, KIPAN, LIHC, LUAD, PAAD, or SKCM) were separated by median normalized TIMP-1 mRNA count values into groups of either high (TIMP1hi) or low (TIMP1lo) expression, respectively. TIMP1hi versus TIMP1lo fold changes in gene expression were calculated by dividing the median values of each gene between both groups in each cohort. The statistical significance of differential gene expression between TIMP1hi and TIMP1lo patients was analyzed by Mann–Whitney U test to calculate P values. For subsequent GSEA, significantly different genes (P ≤ 0.05) were ranked by log2 fold changes between both groups, whereas non-significant genes (P > 0.05) were excluded from the analyses. Preranked GSEA (GSEA; version 4.2.3) was performed using the Gene Ontology “Biological Processes” (c5.go.bp.v2022.1.Hs.symbols.gmt) matrix as a reference gene set. The number of permutations was set to 1,000 and the “weighted” enrichment statistic was used for scoring. Gene Sets with sizes <15 or >500 were excluded from analyses.
Statistical analysis
Statistical analysis was performed using Graphpad Prism version 9.3.1. Normal distribution was tested by Shapiro–Wilk tests. Groups were compared using Student's t test for independent samples in the case of normal distribution or nonparametric Mann–Whitney test for independent variables in the absence of normal distribution. Spearman’s correlation was used in the absence of normal distribution. Statistical differences between groups were assessed with a one-way ANOVA Dunnett test for multiple comparisons between each group and the control. Time-dependent overall survival probabilities were estimated with the Kaplan–Meier method. The log-rank test (Mantel-Cox test) was used to compare statistically significant differences between independent subgroups, as previously described (Hermann et al., 2021).
Data availability
Further information and requests for resources and reagents should be directed to and will be fulfilled by the corresponding author Achim Krüger ([email protected]) upon reasonable request and if approved by the Ethics Committee of the Medical Faculty of the Technical University of Munich.
Acknowledgments
We thank Jonas Bayerl, Daniela Abele, and Katja Honert for expert technical assistance.
This work was supported by grants to A. Krüger from the Deutsche Forschungsgemeinschaft (DFG) (KR2047/1-3, KR2047/8-1, and KR2047/15-1) and the Wilhelm-Sander-Stiftung (2016.124.1 and 2016.124.2), as well as by grants to J.P. Böttcher from the DFG (project numbers 424926990 and 442405234) and an International Junior Research Group-grant to J.P. Böttcher of the Elite Network of Bavaria. I.E. Demir was supported by a grant of the DFG—Project-ID 329628492—SFB 1321. O. Prokopchuk was supported by a Clinical Leave Stipend from the German Center of Infection Research (DZIF, grant TI07.001). H. Hauner and S. Heisz were funded by the Else Kröner-Fresenius-Foundation. THP-1 cells were kindly provided by Ghislain Opdenakker (KU Leuven, Leuven, Belgium). SH-SY5Y cells were kindly provided by Stefan Lichtenthaler (DZNE, München; Chair for neuroproteomics at the Technical University of Munich). Molecular graphics were generated with UCSF ChimeraX, developed by the Resource for Biocomputing, Visualization, and Informatics at the University of California, San Francisco, USA, with support from the National Institutes of Health P41-GM103311.
Author contributions: C. Eckfeld and B. Schoeps designed and performed the experiments, C.D. Hermann and S. Heisz performed ELISA measurements. D. Häußler performed molecular docking analyses and produced recombinant human TIMP-1. C. Eckfeld, B. Schoeps, C.D. Hermann, J. Frädrich, and D. Häußler contributed to data analysis, discussion, and manuscript preparation. C.D. Hermann performed the survival analysis of pancreatic cancer patients. J. Frädrich performed GSEA. O. Prokopchuk provided patient material and clinical data. F. Bayerl and J.P. Böttcher performed confocal microscopy and contributed to the discussion of the manuscript. P. Knolle, H. Hauner, I.E. Demir, and E. Munkhbaatar contributed to discussion and manuscript preparation. A. Krüger designed and supervised the study, analyzed data, and recruited funding grants. A. Krüger and C. Eckfeld wrote the manuscript.

