


Nuclear pore complexes (NPCs) discriminate nonspecific macromolecules from importin and exportin receptors, collectively termed “karyopherins” (Kaps), that mediate nucleocytoplasmic transport. This selective barrier function is attributed to the behavior of intrinsically disordered phenylalanine-glycine nucleoporins (FG Nups) that guard the NPC channel. However, NPCs in vivo are typically enriched with different Kaps, and how they impact the NPC barrier remains unknown. Here, we show that two major Kaps, importinβ1/karyopherinβ1 (Kapβ1) and exportin 1/chromosomal maintenance 1 (CRM1), are required to fortify NPC barrier function in vivo. Their enrichment at the NPC is sustained by promiscuous binding interactions with the FG Nups, which enable CRM1 to compensate for the loss of Kapβ1 as a means to maintain NPC barrier function. However, such a compensatory mechanism is constrained by the cellular abundances and different binding kinetics for each respective Kap, as evidenced for importin-5. Consequently, we find that NPC malfunction and nucleocytoplasmic leakage result from poor Kap enrichment.
Introduction
Nucleocytoplasmic transport (NCT) regulates the partitioning of diverse signal-specific cargoes between the nucleus and cytoplasm (Görlich and Kutay, 1999; Macara, 2001). This provides important housekeeping in eukaryotic cells that is mediated by nuclear pore complexes (NPCs) within the nuclear envelope (NE) that form vital gateways to the genome (Allegretti et al., 2020). Crucially, aging (D’Angelo et al., 2009; Rempel et al., 2019), as well as pathologies ranging from cancer (Çağatay and Chook, 2018) to neurodegenerative disorders (Kim and Taylor, 2017) and viral pathogenesis (Yarbrough et al., 2014), including severe acute respiratory syndrome coronavirus 2 (SARS-CoV-2; Miorin et al., 2020), are linked to defective NCT and NPC malfunction. However, the selectivity mechanism in the NPC that confers exclusive access to cargo-carrying nuclear transport receptors, termed “karyopherins” (Kaps), while suppressing nonspecific entities remains incompletely understood.
Multiple NCT pathways are presided over by a family of 20 Kaps designated as importins, exportins, and transportins (Chook and Süel, 2011). Specifically, importins escort cytoplasmic cargoes bearing nuclear localization signals (NLSs) into the nucleus, and exportins usher nuclear export signal (NES) cargoes out of it, whereas transportins engage bidirectional cargoes (Twyffels et al., 2014). Examples of signal-specific cargoes include transcription factors, histones, ribosomal subunits, and mRNA, to name a few. The vast spectrum of Kap–cargo complexes (Baade and Kehlenbach, 2019) that converge on the NE are parallel processed for biochemical selectivity by numerous intrinsically disordered, phenylalanine-glycine (FG) repeat rich proteins called “FG nucleoporins” (FG Nups) within each NPC (Hoogenboom et al., 2021). Such multispecificity, also termed “binding promiscuity” (Schreiber and Keating, 2011), is underpinned by multivalent binding interactions between transiting Kaps and the FG repeats (Hough et al., 2015; Milles et al., 2015). The major importin receptor importinβ/Kapβ1 (Görlich et al., 1995) is estimated to harbor ∼10 hydrophobic grooves that engage individual FG repeats (Bayliss et al., 2000; Bednenko et al., 2003; Isgro and Schulten, 2005). Exportin 1/chromosomal maintenance 1 (CRM1; Dong et al., 2009; Stade et al., 1997), the major exportin receptor, can bind up to eight FG repeats (Port et al., 2015). By this means, Kaps traverse through the pore in a matter of milliseconds (Dange et al., 2008) and convey up to 1,000 cargoes per NPC per second (Ribbeck et al., 1998).
Apart from Kaps and their cargoes, the passage of large, nonspecific macromolecules (termed “nonspecific cargoes”) through the NPC is generally suppressed (Popken et al., 2015; Timney et al., 2016). This is due to an absence of FG repeat interactions but is also attributed to the FG Nups that function as a permeability barrier inside the pore (Hoogenboom et al., 2021). However, in contrast to advancements in visualizing NPC structure (Allegretti et al., 2020), the permeability barrier itself remains unresolved due to the inherent conformational flexibility and dynamic movements of the FG Nups (Sakiyama et al., 2016). NPC barrier function has therefore been modeled after the in vitro material characteristics of purified FG Nups (Hoogenboom et al., 2021) such as molecular brush layers (Lim et al., 2007), liquid droplets (Celetti et al., 2020), and hydrogels (Frey and Görlich, 2007, 2009; Milles et al., 2013).
Nevertheless, certain Kaps, such as Kapβ1 and CRM1, display a distinct steady-state localization at the NE in vivo (also termed “rim staining”; Kalita et al., 2021), signifying their enrichment at the NPCs (Kapinos et al., 2017; Kim et al., 2018). In other words, NPCs are predominantly crowded with Kaps that could potentially modulate FG Nup behavior to impact NPC function (Zilman, 2018). Indeed, recent findings suggest that Kapβ1 enrichment may reinforce the NPC permeability barrier and modulate NPC structure (Barbato et al., 2020; Kapinos et al., 2017; Lowe et al., 2015; Pulupa et al., 2020). Yet, not all Kaps exhibit the same enrichment behavior at the NPC (Kalita et al., 2021), despite sharing structural similarities with Kapβ1 and CRM1 (Christie et al., 2016; Conti et al., 2006). Thus, it remains unclear how the occupancy of different Kaps is regulated at the NPC and how this might impact NCT with respect to the functionality of the permeability barrier in vivo.
Here, we sought to investigate whether, how, and to what extent Kapβ1 and CRM1 regulate NPC barrier function in comparison with importin-5 (Imp5 or RanBP5; Jäkel and Görlich, 1998; Swale et al., 2020). Experimenting across biophysical, ex vivo, and in vivo regimes, we show that Kapβ1 reduction leads to increased NPC permeability and nuclear leakage of both NCT-specific and nonspecific cargoes. This appears to be coupled to a mechanism where CRM1 partially compensates for Kapβ1 upon depletion of the latter from the NPC. In contrast, a reduction of CRM1 is compensated by a marginal increase of Kapβ1. Although Kapβ1 and CRM1 share similar binding affinities, our results suggest that their in vivo behaviors stem from differences in their cellular concentrations where CRM1 is significantly less abundant than Kapβ1. Finally, we find that Imp5 is prone to displacement by Kapβ1 and CRM1 as a result of its faster dissociation rate from the FG Nups. Overall, our data show that Kapβ1 and CRM1 serve to fortify the NPC barrier against nucleocytoplasmic leakage.
Results
Binding of individual Kaps to NPCs in permeabilized cells
Kapβ1 and CRM1 are more strongly localized at the NE in vivo than Imp5, thereby signifying their enrichment at NPCs (Fig. 1, A and B). We sought to examine their ex vivo binding affinities to NPCs using digitonin-permeabilized HeLa cells treated with Ran mix to dissociate endogenous Kaps (endoKaps) from the NPCs (Barbato et al., 2020; Kapinos et al., 2017; Pulupa et al., 2020). However, because Ran mix may not completely deplete endoKaps (Kapinos et al., 2017), we first wanted to ascertain the relative amounts of transiently expressed fluorescently tagged Kaps that remained bound to NPCs after each treatment. Thereafter we found that 62% of Kapβ1-EGFP remained at NPCs after digitonin treatment and then reduced to 8.2% following Ran mix incubation (Fig. 1, C and D). This persistent fraction of Kapβ1-EGFP may remain associated with a pool of Kapα2 (Imp-α1) that binds with Nup153 and Nup50 through non-FG repeat interactions (Makise et al., 2012; Ogawa et al., 2012). For EGFP-CRM1, only 3.7% remained after digitonin treatment followed by 3% after Ran mix. In comparison, Imp5-mCherry was undetectable at the NPCs.

Kap enrichment in vivo and removal by Ran mix. (A) Transient transfections of MDCK cells with Kapβ1-EGFP, EGFP-CRM1, and Imp5-mCherry constructs reveal the subcellular localization of Kaps in vivo. Kapβ1 and CRM1 show visible nuclear rim stains indicating their enrichment at the NPCs, whereas Imp5 does not. (B) Fluorescence profiles obtained along the dashed lines shown in A. Kapβ1-EGFP and EGFP-CRM1 show fluorescence spikes (black) that coincide with the edges of the nuclear DAPI staining (blue), whereas similar features are lacking in the Imp5-mCherry signal. Line plots were created using Fiji after smoothing the images with a median filter (2-pixel radius) to minimize noise. (C) Retention of Kapβ1-EGFP, EGFP-CRM1, and Imp5-mCherry at NPCs following digitonin permeabilization and Ran mix treatments. Ran mix–treated cells are shown with original and brightness-adjusted settings for improved visualization. Each series of images was collected using the same imaging conditions. (D) Digitonin and Ran mix treatments significantly reduce the enriched pool of Kapβ1-EGFP (n = 10) and EGFP-CRM1 (n = 10) at the NE. Data points were normalized to the predigitonin NE fluorescence values of each cell. Note: Retention of Imp5-mCherry in digitonin-permeabilized HeLa cells lies below the detection limit, as shown with the brightness adjusted in C. The brightfield image confirms that cells were not removed from the field of view. Further quantification of Imp5-mCherry has been omitted. Error bars denote minimum and maximum measured values. Scale bars, 10 µm.
Kap enrichment in vivo and removal by Ran mix. (A) Transient transfections of MDCK cells with Kapβ1-EGFP, EGFP-CRM1, and Imp5-mCherry constructs reveal the subcellular localization of Kaps in vivo. Kapβ1 and CRM1 show visible nuclear rim stains indicating their enrichment at the NPCs, whereas Imp5 does not. (B) Fluorescence profiles obtained along the dashed lines shown in A. Kapβ1-EGFP and EGFP-CRM1 show fluorescence spikes (black) that coincide with the edges of the nuclear DAPI staining (blue), whereas similar features are lacking in the Imp5-mCherry signal. Line plots were created using Fiji after smoothing the images with a median filter (2-pixel radius) to minimize noise. (C) Retention of Kapβ1-EGFP, EGFP-CRM1, and Imp5-mCherry at NPCs following digitonin permeabilization and Ran mix treatments. Ran mix–treated cells are shown with original and brightness-adjusted settings for improved visualization. Each series of images was collected using the same imaging conditions. (D) Digitonin and Ran mix treatments significantly reduce the enriched pool of Kapβ1-EGFP (n = 10) and EGFP-CRM1 (n = 10) at the NE. Data points were normalized to the predigitonin NE fluorescence values of each cell. Note: Retention of Imp5-mCherry in digitonin-permeabilized HeLa cells lies below the detection limit, as shown with the brightness adjusted in C. The brightfield image confirms that cells were not removed from the field of view. Further quantification of Imp5-mCherry has been omitted. Error bars denote minimum and maximum measured values. Scale bars, 10 µm.
Next, we incubated endoKap-depleted permeabilized cells in separate solutions containing increasing concentrations of exogenous Kapβ1–Alexa Fluor 488, CRM1–Alexa Fluor 647, or Imp5–Alexa Fluor 647 (denoted exoKapβ1, exoCRM1, and exoImp5; Fig. 2 A). Despite the molecular complexity of the NPC, all three Kaps yielded characteristic binding curves based on their respective fluorescence signals (FNPC,norm), which indicated concentration-dependent enrichment at the NPCs (Fig. 2, B–E). Although the behavior of exoKapβ1 and exoCRM1 was consistent with in vivo observations (Fig. 1), the rim staining of exoImp5 was unexpected. We hypothesized that this behavior could arise from the absence of other Kaps that compete with Imp5 in vivo (see Competitive binding of Kaps to NPCs in permeabilized cells section). The apparent binding constant of each exoKap to the NPC (KD,NPC) was then determined by Langmuir isotherm analysis, giving 3.1 ± 1.2 µM, 0.50 ± 0.15 µM, and 0.68 ± 0.10 µM for exoKapβ1, exoCRM1, and exoImp5, respectively. Noting that exoKapβ1 gave the weakest KD,NPC value, we asked if the 8% retention of endoKapβ1 at the NPC could have impacted these measurements. Using surface plasmon resonance (SPR) data (Kapinos et al., 2017), we simulated a similar scenario by assigning the initial condition for Langmuir isotherm analyses at ∼10% Kapβ1 preloading (Fig. S1). (Note: Recall that the initial condition in a typical SPR measurement comprises a pristine FG Nup layer.) This analysis demonstrates that Kapβ1 preloading weakens binding (i.e., increases KD,NPC), being consistent with measurements of Kapβ1-FG Nup binding by SPR (Kapinos et al., 2017, 2014; Schoch et al., 2012; Wagner et al., 2015) and FG Nup-tethered nanopores (Malekian et al., 2018).

Kapβ1, CRM1, and Imp5 bind to NPCs in a concentration-dependent manner. (A) Experimental sequence. (B–D) Representative images of permeabilized HeLa cells incubated in increasing concentrations of (B) exoKapβ1, (C) exoCRM1, and (D) exoImp5. The concentration-dependent accumulation of each Kap is measured from their respective nuclear rim stainings. Cells in the first row are shown with the same dynamic range settings. The brightness is adjusted in the second row to improve visualization of the nuclear rim. Percentages indicate the laser power used to image the cells. Fluorescent beads were used for signal normalization to facilitate comparisons between images (see Materials and methods). Representative images were chosen from the same dataset. (E) Quantification of exoKapβ1 (green), exoCRM1 (blue), and exoImp5 (magenta) at the NPCs and normalized by the maximum fluorescence measured for each Kap at 10 μM. The apparent binding affinity of each Kap to the NPCs was obtained by fitting a single-component Langmuir isotherm to each respective dataset. Data points, error bars, and KD,NPC values were obtained by propagating means and errors across all replicates (n ≥ 3). Scale bars, 20 µm.
Kapβ1, CRM1, and Imp5 bind to NPCs in a concentration-dependent manner. (A) Experimental sequence. (B–D) Representative images of permeabilized HeLa cells incubated in increasing concentrations of (B) exoKapβ1, (C) exoCRM1, and (D) exoImp5. The concentration-dependent accumulation of each Kap is measured from their respective nuclear rim stainings. Cells in the first row are shown with the same dynamic range settings. The brightness is adjusted in the second row to improve visualization of the nuclear rim. Percentages indicate the laser power used to image the cells. Fluorescent beads were used for signal normalization to facilitate comparisons between images (see Materials and methods). Representative images were chosen from the same dataset. (E) Quantification of exoKapβ1 (green), exoCRM1 (blue), and exoImp5 (magenta) at the NPCs and normalized by the maximum fluorescence measured for each Kap at 10 μM. The apparent binding affinity of each Kap to the NPCs was obtained by fitting a single-component Langmuir isotherm to each respective dataset. Data points, error bars, and KD,NPC values were obtained by propagating means and errors across all replicates (n ≥ 3). Scale bars, 20 µm.

Effect of 10% Kapβ1 occupancy on Langmuir isotherm analysis simulated using SPR data. This simulation uses SPR data of Kapβ1 binding to a mixed FG Nup layer comprising cNup62, cNup98, cNup153, and cNup214. The Langmuir fit to the original data (black) gives KD1,SPR = 0.416 μM and KD2,SPR = 393 μM. These data are then offset by 10% occupancy to simulate the effect of 10% preloading in permeabilized cells (Fig. 2 E). The Langmuir fit to the offset data (red) gives KD = 1.11 μM. The original data (black) are taken from Kapinos et al. (2017).

Effect of 10% Kapβ1 occupancy on Langmuir isotherm analysis simulated using SPR data. This simulation uses SPR data of Kapβ1 binding to a mixed FG Nup layer comprising cNup62, cNup98, cNup153, and cNup214. The Langmuir fit to the original data (black) gives KD1,SPR = 0.416 μM and KD2,SPR = 393 μM. These data are then offset by 10% occupancy to simulate the effect of 10% preloading in permeabilized cells (Fig. 2 E). The Langmuir fit to the offset data (red) gives KD = 1.11 μM. The original data (black) are taken from Kapinos et al. (2017).
Competitive binding of Kaps to NPCs in permeabilized cells
Given that Kapβ1 and CRM1 coenrich at NPCs in vivo, we sought to test for their pairwise binding in endoKap-depleted permeabilized HeLa cells. Knowing the binding characteristics of standalone exoCRM1 (Fig. 2 E) allowed us to evaluate changes to its binding at NPCs within a constant background of 10 µM exoKapβ1. Conversely, changes in exoKapβ1 binding with respect to exoCRM1 binding were also monitored. However, only changes pertaining to their individual relative occupancies were considered because the fluorescence signals of exoKapβ1 and exoCRM1 were (1) derived from different fluorophores and labeling efficiencies and (2) independently normalized.
At 10 µM concentration, the relative occupancy of exoCRM1 reduced by 51 ± 23% from its standalone value and was coupled to a 62 ± 10% relative occupancy for exoKapβ1. This was accompanied by an increase in KD,NPC with respect to exoCRM1 binding to 2.8 ± 1.5 µM, which is approximately sixfold weaker than when exoKapβ1 was absent (Fig. 3, A and B). Separately, a pairwise binding of exoImp5 and exoKapβ1 resulted in a 84 ± 34% reduction in the relative occupancy of exoImp5, while the relative occupancy of exoKapβ1 stabilized at 72 ± 14%. KD,NPC for exoImp5 increased to 5.2 ± 2.5 µM, being approximately eightfold weaker than its standalone value (Fig. 3, C and D). The pairwise binding of exoImp5 and 10 µM exoCRM1 led to a 56 ± 35% decrease in the relative occupancy of exoImp5 and a 59 ± 26% relative occupancy of exoCRM1. This gave 2.0 ± 0.6 µM for KD,NPC for exoImp5, which is approximately threefold weaker than its standalone value. The global view provided by permeabilized cells underscores the promiscuous interactions of Kapβ1, CRM1, and Imp5 at NPCs. Although this analysis suggests that exoKapβ1 exhibits a higher propensity than exoCRM1 to outcompete against exoImp5, such competitive behavior is not apparent during the pairwise binding of exoKapβ1 and exoCRM1, nor exoImp5 and exoCRM1.

Pairwise binding reveals the relative occupancies of different Kaps. (A) exoCRM1 titration in the presence of 10 μM exoKapβ1. (B) Normalized fluorescence signals of exoCRM1 and exoKapβ1 plotted as a function of exoCRM1 concentration. The maximal observed change in the relative occupancy of exoCRM1 is obtained by subtracting its titration value (blue) from its standalone value (gray) at the highest concentration (i.e., 10 μM exoCRM1; blue arrow). The relative occupancy of exoKapβ1 obtained in the presence of 10 μM exoCRM1 is also shown (green arrow). A single-component Langmuir isotherm fit provides the KD,NPC of exoCRM1 in the presence of 10 μM exoKapβ1. (C) exoImp5 titration in the presence of 10 μM exoKapβ1. (D) Normalized fluorescence signals of exoImp5 and exoKapβ1 plotted as a function of exoImp5 concentration. The maximal observed change in the relative occupancy of exoImp5 is obtained by subtracting its titration value (magenta) from its standalone value (gray) at 10 μM exoImp5 (magenta arrow). The relative occupancy of exoKapβ1 obtained in the presence of 10 μM exoImp5 is also shown (green arrow). (E) Titration of exoImp5 in the presence of 10 μM exoCRM1. (F) Normalized fluorescence signals of exoImp5 and exoCRM1 plotted as a function of exoImp5 concentration. The maximal observed change in the relative occupancy of exoImp5 is obtained by subtracting its titration value (magenta) from its standalone value (gray) at 10 μM exoImp5 (magenta arrow). The relative occupancy of exoCRM1 obtained in the presence of 10 μM exoImp5 is also shown (blue arrow). Cells in the first row are visualized within the dynamic range shown. The brightness has been adjusted in each second row to better visualize the nuclear rim. Percentages above the panels indicate the laser power used to image the cells. Data points, error bars, and KD,NPC values were obtained by propagating means and errors across all replicates (n ≥ 3). Scale bars, 20 µm.
Pairwise binding reveals the relative occupancies of different Kaps. (A) exoCRM1 titration in the presence of 10 μM exoKapβ1. (B) Normalized fluorescence signals of exoCRM1 and exoKapβ1 plotted as a function of exoCRM1 concentration. The maximal observed change in the relative occupancy of exoCRM1 is obtained by subtracting its titration value (blue) from its standalone value (gray) at the highest concentration (i.e., 10 μM exoCRM1; blue arrow). The relative occupancy of exoKapβ1 obtained in the presence of 10 μM exoCRM1 is also shown (green arrow). A single-component Langmuir isotherm fit provides the KD,NPC of exoCRM1 in the presence of 10 μM exoKapβ1. (C) exoImp5 titration in the presence of 10 μM exoKapβ1. (D) Normalized fluorescence signals of exoImp5 and exoKapβ1 plotted as a function of exoImp5 concentration. The maximal observed change in the relative occupancy of exoImp5 is obtained by subtracting its titration value (magenta) from its standalone value (gray) at 10 μM exoImp5 (magenta arrow). The relative occupancy of exoKapβ1 obtained in the presence of 10 μM exoImp5 is also shown (green arrow). (E) Titration of exoImp5 in the presence of 10 μM exoCRM1. (F) Normalized fluorescence signals of exoImp5 and exoCRM1 plotted as a function of exoImp5 concentration. The maximal observed change in the relative occupancy of exoImp5 is obtained by subtracting its titration value (magenta) from its standalone value (gray) at 10 μM exoImp5 (magenta arrow). The relative occupancy of exoCRM1 obtained in the presence of 10 μM exoImp5 is also shown (blue arrow). Cells in the first row are visualized within the dynamic range shown. The brightness has been adjusted in each second row to better visualize the nuclear rim. Percentages above the panels indicate the laser power used to image the cells. Data points, error bars, and KD,NPC values were obtained by propagating means and errors across all replicates (n ≥ 3). Scale bars, 20 µm.
Comparing Kapβ1, CRM1, and Imp5 binding to FG Nups
SPR was then used to examine the binding of CRM1 and Imp5 to FG Nup layers of Nup62, Nup98, Nup153, and Nup214 (denoted as cNup62, cNup98, cNup153, and cNup214, respectively; Kapinos et al., 2014; Schoch et al., 2012; Fig. S2). Apparent equilibrium dissociation constants (KD,SPR; Fig. 4 A) show that CRM1 exhibits two-phase binding with cNup98 and cNup153 with KD,SPR values comparable to those of Kapβ1, but only single-phase binding to cNup62 and cNup214. For cNup62, CRM1 is significantly weaker (KD,SPR = 2.86 ± 0.38 µM) than the strong phase of Kapβ1. However, the binding of CRM1 to cNup214 (KD,SPR = 0.11 ± 0.02 µM) is comparably stronger than its binding to cNup62, consistent with previous reports (Port et al., 2015). Imp5 exhibits single-phase binding to the FG Nups with the exception of Nup153, with values that are compatible with the strong binding phase of Kapβ1.

Binding of CRM1 and Imp5 to FG Nup layers in vitro. (A and B) SPR response curves obtained for (A) CRM1 and (B) Imp5 binding to cNup153 (green), cNup62 (black), cNup98 (blue), and cNup214 (red). Vertical jumps in the signal correspond to triple BSA injections used to measure FG Nup layer height. RU, resonance units. (C) Equilibrium binding analysis of Kapβ1 (yellow), CRM1 (blue), and Imp5 (magenta) to cNup62, cNup98, cNup153, and cNup214. Lines represent single-component (solid) or two-component (dashed) Langmuir isotherm fits to the average SPR equilibrium response (Req). The mean apparent dissociation constant calculated from n ≥ 4 replicates was used for the fitting. For each replicate, data points were normalized to the maximum response value (Rmax) or their sum (Rmax1 and Rmax2) obtained from the equilibrium fit. Note: The Kapβ1 data were reproduced from Kapinos et al. (2017).

Binding of CRM1 and Imp5 to FG Nup layers in vitro. (A and B) SPR response curves obtained for (A) CRM1 and (B) Imp5 binding to cNup153 (green), cNup62 (black), cNup98 (blue), and cNup214 (red). Vertical jumps in the signal correspond to triple BSA injections used to measure FG Nup layer height. RU, resonance units. (C) Equilibrium binding analysis of Kapβ1 (yellow), CRM1 (blue), and Imp5 (magenta) to cNup62, cNup98, cNup153, and cNup214. Lines represent single-component (solid) or two-component (dashed) Langmuir isotherm fits to the average SPR equilibrium response (Req). The mean apparent dissociation constant calculated from n ≥ 4 replicates was used for the fitting. For each replicate, data points were normalized to the maximum response value (Rmax) or their sum (Rmax1 and Rmax2) obtained from the equilibrium fit. Note: The Kapβ1 data were reproduced from Kapinos et al. (2017).

Equilibrium and kinetic analysis of Kap-FG Nup binding interactions. (A) Equilibrium dissociation constants obtained for Kapβ1 (yellow), CRM1 (blue), and Imp5 (magenta) binding to cNup62, cNup98, cNup153, and cNup214. Boxplots denote the median and the first and third quartiles. KD,SPRs correspond to the mean values from n ≥ 4 measurements at each condition. Error bars denote SD. (B) Kinetic maps of Kapβ1 (yellow), CRM1 (blue), and Imp5 (magenta) binding to cNup62, cNup98, cNup153, and cNup214. Each map was constructed by averaging over at least four sensograms for every Kap-FG Nup pair. The color intensity indicates the fractional abundance of different kinetic states. All Kaps exhibit multivalent binding, and their kinetic behavior is characterized by different kinetic phases: high affinity (*), low affinity fast (▴), and low affinity slow (○). Arrowheads point to the mean fitted koff value for each Kap. The data for Kapβ1 have been reproduced from Kapinos et al. (2017).
Equilibrium and kinetic analysis of Kap-FG Nup binding interactions. (A) Equilibrium dissociation constants obtained for Kapβ1 (yellow), CRM1 (blue), and Imp5 (magenta) binding to cNup62, cNup98, cNup153, and cNup214. Boxplots denote the median and the first and third quartiles. KD,SPRs correspond to the mean values from n ≥ 4 measurements at each condition. Error bars denote SD. (B) Kinetic maps of Kapβ1 (yellow), CRM1 (blue), and Imp5 (magenta) binding to cNup62, cNup98, cNup153, and cNup214. Each map was constructed by averaging over at least four sensograms for every Kap-FG Nup pair. The color intensity indicates the fractional abundance of different kinetic states. All Kaps exhibit multivalent binding, and their kinetic behavior is characterized by different kinetic phases: high affinity (*), low affinity fast (▴), and low affinity slow (○). Arrowheads point to the mean fitted koff value for each Kap. The data for Kapβ1 have been reproduced from Kapinos et al. (2017).
Next, we analyzed the kinetic association (kon) and dissociation (koff) rate constants of CRM1 and Imp5 to and from the FG Nup layers and compared their behavior against Kapβ1 (Fig. 4 B). The resulting kinetic maps show a distribution of KDs (where KD = koff/kon) that manifest from a constellation of kon and koff values, being characteristic of multivalent binding (Svitel et al., 2003). Both CRM1 and Imp5 exhibit kinetic behavior that commences with a high-avidity slow phase (*, Fig. 4 B) at low concentrations that is characterized by fast kon (∼103 to 104 s−1 M−1) and slow koff (10−5 to 10−4 s−1). Increasing CRM1/Imp5 concentration toward the 10−6 M range brings about a steady reduction in kon toward 10 s−1 M−1 (○, Fig. 4 B), which indicates a decrease in binding avidity (increasing KD). This is accompanied by the emergence of a fast binding phase (▴, Fig. 4 B) that coincides with an increase in kon (>103 s−1 M−1) and a fast koff (>10−1 s−1). Indeed, the slow and fast phases are constrained by t1/2 values that span a range of between 20 h and 7 s, respectively, where t1/2 = ln(2)/koff. Hence, a key result is that Imp5 exhibits a higher propensity than Kapβ1 and CRM1 to depart from the FG Nups in the slow phase, given its faster koff, as evidenced by its low enrichment in vivo (Fig. 1). Otherwise, the transient binding fast phase that follows is qualitatively similar across all Kaps, although with a slight increase in the transient fraction of Imp5 over Kapβ1 and CRM1.
Biophysical basis of Kap competition at the NPC
Next, we sought a more holistic understanding of how the relative occupancies of different Kap pairs are influenced by their promiscuous binding with the FG Nups. This was not possible to measure by SPR due to similarities in molecular mass and KDs for Kapβ1, CRM1, and Imp5 (i.e., compared with Kapβ1 and NTF2; Wagner et al., 2015). Hence, we adopted a minimal theoretical model that is able to capture and explain the experimentally observed behavior of Kap partitioning into FG Nup assemblies (Vovk et al., 2016). In brief, the molecular details of Kap-FG Nup binding are subsumed into a phenomenological free energy parameter which accounts for the free energy upon the entry of a single Kap molecule into the NPC. This term implicitly accounts for multivalent binding between the Kaps and FG Nups, as well as the internal cohesiveness and the density of the FG Nups (see Materials and methods for details). Then, by specifying Kap volume ratios (Kapβ1:CRM1:Imp5 = 1:1.3:1.2; Protein Data Bank accession nos. 3ND2, 4FGV, 3W3T, respectively; Voss and Gerstein, 2010) and including the free energy cost of competition for space inside the NPC between Kap molecules, we could compute for changes in the relative occupancy of Kaps (i.e., Δ) during pairwise binding.
Interestingly, the model correctly predicts the Δ values for CRM1 and Imp5 during pairwise binding with Kapβ1 within the range of KD,SPR values (Fig. 5, A and B). The same is true for the pairwise binding of Imp5 and CRM1 (Fig. 5 C). Likewise, the model also predicts the corresponding relative changes in Kapβ1 occupancy with respect to the experimental results of its pairwise binding with Imp5 and CRM1, respectively (Fig. S3). Hence, this analysis complements and consolidates our experimental findings (Fig. 3), where exoKapβ1 efficiently outcompetes exoImp5 but not exoCRM1, and exoCRM1 does not outcompete exoImp5. Taken together, the relative occupancy of different Kaps at the NPC is balanced by Kap size, Kap abundance, and their binding affinity to the FG Nups and provides a basis for further, more detailed modeling.

Promiscuous binding is balanced by Kap size, binding affinity, and abundance. (A) Theoretically predicted shift in the occupancy of CRM1 from its standalone value at 10 µM CRM1 compared with the presence of 10 µM Kapβ1 background (blue arrow in Fig. 3 B) as a function of CRM1 and Kapβ1 KD values. (B) Theoretically predicted shift in the pore occupancy of Imp5 from its standalone value at 10 µM Imp5 to when a background of 10 µM Kapβ1 is present (magenta arrow in Fig. 3 D) as a function of Imp5 and Kapβ1 KD values. (C) Theoretically predicted shift in the relative occupancy of Imp5 from its standalone value at 10 µM Imp5 to when a background of 10 µM CRM1 is present (magenta arrow in Fig. 3 F) as a function of Imp5 and CRM1 KD values. The bounded regions (black) indicate the KD values, which are consistent with SPR measurements and are within 1 SD of experimentally measured occupancy shifts. Dashed contour lines indicate the KD values that result in the average experimentally measured shift (white), and the KD values that result in 1 SD from these relative occupancy values (gray). Note: The color scale of each heatmap is different.
Promiscuous binding is balanced by Kap size, binding affinity, and abundance. (A) Theoretically predicted shift in the occupancy of CRM1 from its standalone value at 10 µM CRM1 compared with the presence of 10 µM Kapβ1 background (blue arrow in Fig. 3 B) as a function of CRM1 and Kapβ1 KD values. (B) Theoretically predicted shift in the pore occupancy of Imp5 from its standalone value at 10 µM Imp5 to when a background of 10 µM Kapβ1 is present (magenta arrow in Fig. 3 D) as a function of Imp5 and Kapβ1 KD values. (C) Theoretically predicted shift in the relative occupancy of Imp5 from its standalone value at 10 µM Imp5 to when a background of 10 µM CRM1 is present (magenta arrow in Fig. 3 F) as a function of Imp5 and CRM1 KD values. The bounded regions (black) indicate the KD values, which are consistent with SPR measurements and are within 1 SD of experimentally measured occupancy shifts. Dashed contour lines indicate the KD values that result in the average experimentally measured shift (white), and the KD values that result in 1 SD from these relative occupancy values (gray). Note: The color scale of each heatmap is different.

Reduction of Kapβ1 occupancy in response to CRM1 and Imp5 binding. (A) Theoretically predicted shift in the occupancy of Kapβ1 calculated between its standalone value at 10 µM Kapβ1 and in the presence of 10 µM CRM1 background (Fig. 3 B, green trace) as a function of Kapβ1 and CRM1 KD values. (B) Same as A, except a background of 10 µM Imp5 is assumed (Fig. 3 D, green trace). See Fig. 5 in the main text. The marked region (black) indicates the KD values, which are consistent with SPR measurements and are within 1 SD of experimentally measured occupancy shifts. Dashed contour lines indicate the pairs of KD values that result in the average experimentally measured shift (white) and the KD pairs that correspond to the 1 SD from the values of the average relative occupancy (gray). Note: The color scale in each heat map is different.

Reduction of Kapβ1 occupancy in response to CRM1 and Imp5 binding. (A) Theoretically predicted shift in the occupancy of Kapβ1 calculated between its standalone value at 10 µM Kapβ1 and in the presence of 10 µM CRM1 background (Fig. 3 B, green trace) as a function of Kapβ1 and CRM1 KD values. (B) Same as A, except a background of 10 µM Imp5 is assumed (Fig. 3 D, green trace). See Fig. 5 in the main text. The marked region (black) indicates the KD values, which are consistent with SPR measurements and are within 1 SD of experimentally measured occupancy shifts. Dashed contour lines indicate the pairs of KD values that result in the average experimentally measured shift (white) and the KD pairs that correspond to the 1 SD from the values of the average relative occupancy (gray). Note: The color scale in each heat map is different.
Evidence of Kap compensation at the NPC
Next, we asked if one Kap could compensate for another Kap following a reduction of the latter at the NPC in vivo. We used three different silencing conditions (denoted as siRNA1 55 pmol, siRNA2 55 pmol, and siRNA2 110 pmol; Table S1) to deplete endoKapβ1 in MDCK cells (Fig. S4 A). siRNA-treated cells were identified by the fluorescence of Cy5-modified oligonucleotides. Depending on the specific siRNA condition, we found that the immunofluorescence (IF) signal of Kapβ1 at the NE had reduced to 82–88% in silenced cells, accompanied by an ∼30% increase in its NE-to-cytoplasm ratio (NE/C; Fig. 6 A). Interestingly, this coincided with an increase in the NE signal of CRM1 of up to 121% together with an ∼14% increase in its NE-to-nucleus (NE/N) ratio. This suggests that the available pool of soluble Kapβ1 in the cytoplasm was deployed to replenish and reinforce the NPCs, resulting in the higher NE/C ratio. Still, the resulting enrichment of Kapβ1 was limited by its reduced abundance and was not able to return to presilencing levels. Likewise, the increase in NE/N ratio for CRM1 suggests that additional CRM1 molecules were recruited from within the nucleus to fortify the NPC.
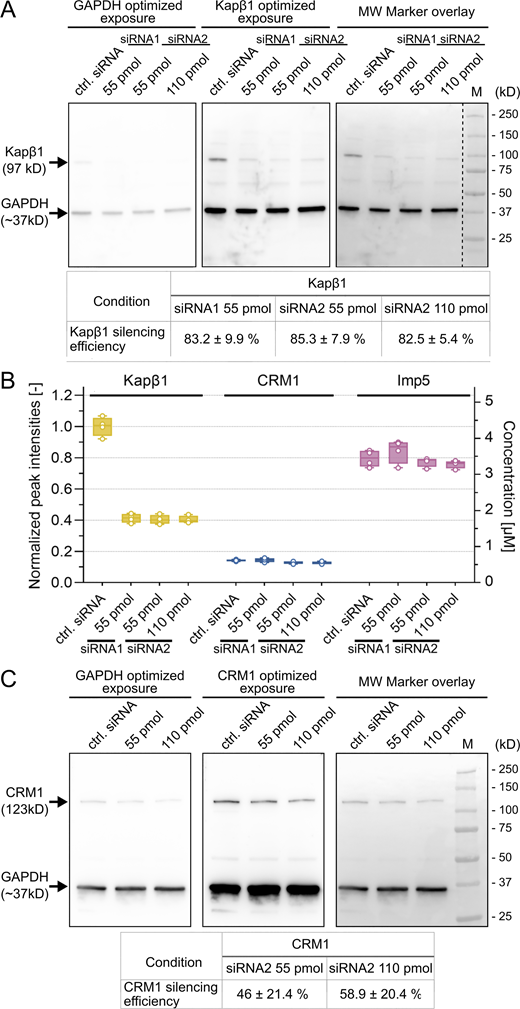
Quantitative analysis of MDCK cells after siRNA treatment. (A) Quantification of Kapβ1 silencing in MDCK cells after treatment with Kapβ1-specific siRNA1 or siRNA2 at the amounts shown. The dashed line indicates the removal of unrelated sample lanes that were probed on the same membrane. (B) Proteomic analysis of Kapβ1, CRM1, and Imp5 cellular abundance before and after Kapβ1 silencing. Only Kapβ1 was significantly reduced in MDCK cells, whereas CRM1 and Imp5 levels were not affected. All data points were normalized to the mean value of Kapβ1 abundance in control siRNA cells (n = 4). (C) Analysis of CRM1 silencing efficiency in MDCK cells after treatment with CRM1-specific siRNA. See Materials and methods for details. Note: In all cases, the chemiluminescent signal was recorded using different exposure times to optimally visualize GAPDH or a given Kap. CRM1 and Kapβ1 signals were normalized to the corresponding GAPDH signal from the same lane. MW, molecular weight; M, marker. Source data are available for this figure: SourceData FS4.

Quantitative analysis of MDCK cells after siRNA treatment. (A) Quantification of Kapβ1 silencing in MDCK cells after treatment with Kapβ1-specific siRNA1 or siRNA2 at the amounts shown. The dashed line indicates the removal of unrelated sample lanes that were probed on the same membrane. (B) Proteomic analysis of Kapβ1, CRM1, and Imp5 cellular abundance before and after Kapβ1 silencing. Only Kapβ1 was significantly reduced in MDCK cells, whereas CRM1 and Imp5 levels were not affected. All data points were normalized to the mean value of Kapβ1 abundance in control siRNA cells (n = 4). (C) Analysis of CRM1 silencing efficiency in MDCK cells after treatment with CRM1-specific siRNA. See Materials and methods for details. Note: In all cases, the chemiluminescent signal was recorded using different exposure times to optimally visualize GAPDH or a given Kap. CRM1 and Kapβ1 signals were normalized to the corresponding GAPDH signal from the same lane. MW, molecular weight; M, marker. Source data are available for this figure: SourceData FS4.

Evidence of Kap compensation at the NPC. (A) A significant fraction of Kapβ1 is depleted from the NE following Kapβ1 silencing. This correlates with (1) an increased enrichment of CRM1 at the NE and (2) increases in both the NE/C and NE/N ratios of Kapβ1 and CRM1, respectively. This suggests that the cytoplasmic pool of Kapβ1, together with the nuclear pool of CRM1, has been recruited to compensate for the depleted Kapβ1 molecules at the NPCs. (B) A small fraction of CRM1 is reduced at the NE following CRM1 silencing. This correlates with (1) an enriched pool of Kapβ1 at the NE that is relatively unchanged, (2) no change to the NE/N ratio of CRM1, and (3) a slight increase in the NE/C ratio of Kapβ1. This suggests that only a small fraction of Kapβ1 is being recruited from the cytoplasm to compensate for depleted CRM1 molecules at the NPCs. For explanation, see the main text. Statistical analysis was performed using the Kruskal-Wallis test. P adjusted values were calculated using the Benjamini-Hochberg procedure (****, P = 0.0001; **, P = 0.0021; * P = 0.0332; ns = 0.1). Scale bars, 10 µm.
Evidence of Kap compensation at the NPC. (A) A significant fraction of Kapβ1 is depleted from the NE following Kapβ1 silencing. This correlates with (1) an increased enrichment of CRM1 at the NE and (2) increases in both the NE/C and NE/N ratios of Kapβ1 and CRM1, respectively. This suggests that the cytoplasmic pool of Kapβ1, together with the nuclear pool of CRM1, has been recruited to compensate for the depleted Kapβ1 molecules at the NPCs. (B) A small fraction of CRM1 is reduced at the NE following CRM1 silencing. This correlates with (1) an enriched pool of Kapβ1 at the NE that is relatively unchanged, (2) no change to the NE/N ratio of CRM1, and (3) a slight increase in the NE/C ratio of Kapβ1. This suggests that only a small fraction of Kapβ1 is being recruited from the cytoplasm to compensate for depleted CRM1 molecules at the NPCs. For explanation, see the main text. Statistical analysis was performed using the Kruskal-Wallis test. P adjusted values were calculated using the Benjamini-Hochberg procedure (****, P = 0.0001; **, P = 0.0021; * P = 0.0332; ns = 0.1). Scale bars, 10 µm.
Given that Kapβ1 and CRM1 bind comparably to the FG Nups, we rationalized that their observed behaviors might stem from differences in their cellular abundances. Indeed, the average cellular concentration of Kapβ1 was determined to be 4.3 ± 2.5 µM by quantitative mass spectrometry (MS), from which its quantity was ∼1.7 µM after knockdown (with 60% silencing efficiency; Fig. S4 B). This is consistent with previous estimates of Kapβ1, although their exact quantities depend on organism and cell type (Quan et al., 2008; Wang et al., 2015). Notably, Kapβ1 silencing did not affect the cellular concentrations of CRM1 and Imp5, which were estimated to be 0.61 ± 0.02 µM and 3.4 ± 0.2 µM, respectively. Thus, we predict that Kapβ1 outnumbers CRM1 within the NPC under WT conditions (i.e., before silencing). After silencing, there still remains a sufficiently large pool of Kapβ1 to replenish the NPC, albeit together with a larger fraction of CRM1 due to a shift in their binding equilibrium.
For this reason, we hypothesized that silencing CRM1 ought not to result in an increase of its NE/N ratio. As anticipated, ∼50% CRM1 silencing (by Western blot analysis; Fig. S4 C) resulted in a slight reduction of its NE signal and NE/N ratio (Fig. 6 B). This was accompanied by a small increase in the NE/C ratio of Kapβ1, which indicates that the soluble pool of CRM1 is insufficient to compensate for a reduction of its bound fraction at the NPC because (1) its concentration is below KD (Fig. 2 E), and (2) it is greatly outnumbered by Kapβ1.
Kapβ1 depletion weakens NPC barrier function in vivo
Thereafter, we assessed whether Kap enrichment fortifies the NPC permeability barrier in vivo. Here, MDCK cells stably expressing 2xEGFP-NES (∼55 kD) were depleted of endoKapβ1 using the same siRNA conditions as above. We deliberately chose 2xEGFP-NES as a reporter for NPC leakage because it is disconnected from nuclear import and decouples the role of Kapβ1 as a barrier reinforcement from its import activity. Compared to control cells, Kapβ1 silencing resulted in a 16% average increase in the N/C ratio of 2xEGFP-NES from 0.37 up to 0.43 across the three silencing conditions (Fig. 7 A). This signifies a passive leakage of 2xEGFP-NES back into the nucleus that corresponds to a 27% increase in NPC permeability based on analysis using a nucleocytoplasmic exchange model (Cardarelli et al., 2009; see Materials and methods). We observed a similar, though less prominent, backflow of 3xEGFP-NES (∼81 kD) into the nucleus, given that its N/C ratio increased from 0.28 to 0.31 (11%) after Kapβ1 silencing (Fig. 7 B). This corresponds to a 15% increase in NPC permeability being consistent with a soft barrier whose effectiveness against passive diffusion gradually increases with molecule size (Timney et al., 2016). Another key point to note following Kapβ1 silencing is that CRM1-mediated export remains active but is insufficient to mitigate the backflow of NES cargoes. As a positive control, we silenced CRM1 (Fig. S4 C) to check how impairing 3xEGFP-NES export compares with its passive leakage into the nucleus. This resulted in a 29% increase in the N/C ratio from 0.28 to 0.36, which is three times stronger than Kapβ1 silencing. Hence, Kapβ1 depletion impairs NPC barrier function despite a partial compensation by CRM1 (Fig. 6 A).

Kap enrichment fortifies the NPC permeability barrier in vivo. (A) Silencing Kapβ1 shifts the steady-state distribution (N/C ratio) of 2xEGFP-NES into the nucleus as a result of increased NPC permeability (i.e., leak). (B) An increase of NPC permeability due to Kapβ1 silencing also results in a shift of 3xEGFP-NES into the nucleus. Impairing 3xEGFP-NES export via CRM1 silencing results in a qualitatively similar but larger shift in the N/C ratio. (C) Silencing CRM1 does not show any detectable change to the N/C ratio of 2xEGFP-NLS. Statistical analysis was performed using the Kruskal-Wallis test. P adjusted values were calculated using the Benjamini-Hochberg procedure (****, P = 0.0001; ***, P = 0.0002; **, P = 0.0021; *, P = 0.0332; ns = 0.1). Scale bars, 10 µm.
Kap enrichment fortifies the NPC permeability barrier in vivo. (A) Silencing Kapβ1 shifts the steady-state distribution (N/C ratio) of 2xEGFP-NES into the nucleus as a result of increased NPC permeability (i.e., leak). (B) An increase of NPC permeability due to Kapβ1 silencing also results in a shift of 3xEGFP-NES into the nucleus. Impairing 3xEGFP-NES export via CRM1 silencing results in a qualitatively similar but larger shift in the N/C ratio. (C) Silencing CRM1 does not show any detectable change to the N/C ratio of 2xEGFP-NLS. Statistical analysis was performed using the Kruskal-Wallis test. P adjusted values were calculated using the Benjamini-Hochberg procedure (****, P = 0.0001; ***, P = 0.0002; **, P = 0.0021; *, P = 0.0332; ns = 0.1). Scale bars, 10 µm.
Using the same rationale as above, 2xEGFP-NLS is excluded from nuclear export and therefore decouples the role of CRM1 as a potential barrier reinforcement from its export activity. However, in contrast to Kapβ1, CRM1 silencing had little to no effect on lowering the N/C ratio of 2xEGFP-NLS (Fig. 7 C). This suggests that any leakage out of the nucleus was below the detection limit due to an insufficient silencing efficiency of CRM1 siRNA. Further attempts to increase its silencing efficiency resulted in cell death.
FRAP analysis of nonspecific diffusion
To further verify if Kaps tighten NPC permeability, we performed FRAP in MDCK cells stably expressing 2xEGFP nonspecific cargoes (Video 1). Briefly, FRAP affects the fluorescence properties of 2xEGFP without disturbing its biochemical attributes or its transport dynamics (Bizzarri et al., 2012). Applying the same three Kapβ1 silencing conditions as above enabled us to evaluate the recovery time of 2xEGFP in the nucleus before and after Kapβ1 depletion (Fig. 8). In comparison with control cells, we observed a shorter t1/2 recovery (τ) after Kapβ1 depletion, which signified an increase in passive nucleocytoplasmic exchange. The mean τ value reduced from 582 ms to 527 ms, 462 ms, or 380 ms, depending on the silencing condition. These data allowed us to compute the permeability coefficient that describes passive diffusion through the NE (Cardarelli et al., 2009; see Materials and methods). Consequently, this analysis showed an increased permeability, which ranged from 18% to 27% and 52% over control cells, depending on the silencing condition used. Hence, a loss of Kapβ1 enrichment results in NPCs that are more amenable to the exchange of passive cargoes.
Representative video clip showing the recovery of 2xEGFP signal (green) in the nucleus after photobleaching in a control MDCK cell. The clip was collected using a spinning disk confocal microscope. See also Fig. 8 in the main text. Scale bar, 10 µm; exposure time, 20 ms; interval, 1 s; frame rate, 30 frames/s.
Representative video clip showing the recovery of 2xEGFP signal (green) in the nucleus after photobleaching in a control MDCK cell. The clip was collected using a spinning disk confocal microscope. See also Fig. 8 in the main text. Scale bar, 10 µm; exposure time, 20 ms; interval, 1 s; frame rate, 30 frames/s.

Kapβ1 depletion softens the NPC permeability barrier to nonspecific cargoes in vivo. (A) Representative image sequence showing the recovery of 2xEGFP in the nucleus obtained during a FRAP experiment in control siRNA-treated cells. Lightning indicates the nuclear photobleaching event at t = 0. Scale bar, 10 µm. (B) Fluorescence recovery curves (symbols) and their fits (black lines) as obtained in individual cells. In all cases, an increase in nuclear fluorescence (normalized fluorescence <1) correlates to a concomitant decrease in cytoplasmic fluorescence (normalized fluorescence >1). Both nuclear recovery and cytoplasmic loss of fluorescence are characterized by similar time constants because Kaps do not play a role in the passive diffusion of 2xEGFP. For clarity, only every 10th data point is shown. (C) Kapβ1 silencing expedites the passive exchange of 2xEGFP cargoes across NPCs. (D) Kapβ1 silencing leads to an increase in NPC permeability for 2xEGFP cargoes. Statistical analysis was performed using ordinary one-way ANOVA. P adjusted values were calculated using the Benjamini-Hochberg procedure (***, P = 0.0002; **, P = 0.0021; *, P = 0.0332; ns = 0.1). See main text for details.
Kapβ1 depletion softens the NPC permeability barrier to nonspecific cargoes in vivo. (A) Representative image sequence showing the recovery of 2xEGFP in the nucleus obtained during a FRAP experiment in control siRNA-treated cells. Lightning indicates the nuclear photobleaching event at t = 0. Scale bar, 10 µm. (B) Fluorescence recovery curves (symbols) and their fits (black lines) as obtained in individual cells. In all cases, an increase in nuclear fluorescence (normalized fluorescence <1) correlates to a concomitant decrease in cytoplasmic fluorescence (normalized fluorescence >1). Both nuclear recovery and cytoplasmic loss of fluorescence are characterized by similar time constants because Kaps do not play a role in the passive diffusion of 2xEGFP. For clarity, only every 10th data point is shown. (C) Kapβ1 silencing expedites the passive exchange of 2xEGFP cargoes across NPCs. (D) Kapβ1 silencing leads to an increase in NPC permeability for 2xEGFP cargoes. Statistical analysis was performed using ordinary one-way ANOVA. P adjusted values were calculated using the Benjamini-Hochberg procedure (***, P = 0.0002; **, P = 0.0021; *, P = 0.0332; ns = 0.1). See main text for details.
In contrast, an overexpression of Kapβ1 tagged with near-infrared fluorescent protein (Kapβ1-iRFP) in MDCK cells did not result in an increase of τ or a decrease in NE permeability, suggesting that Kapβ1 enrichment is near or at saturation levels in NPCs under physiological conditions (Fig. S5). This is evident from equilibrium binding analysis (Fig. 2 E), which shows that further increases in Kap occupancy at NPCs is modest once saturation is reached.

Fluorescence recovery of 2xEGFP within the nucleus in cells overexpressing Kapβ1-iRFP. Top: The time elapsed per frame is 1 s. Kapβ1-iRFP fluorescence is visualized in the last panel. Lightning indicates the nuclear photobleaching event at t = 0. Scale bar, 10 µm. Bottom: τ (left) and permeability (right) of 2xEGFP do not change significantly following Kapβ1-iRFP overexpression. Statistical analysis was performed using a nonparametric (Mann-Whitney) two-tailed test. Error bars denote minimum and maximum measured values.

Fluorescence recovery of 2xEGFP within the nucleus in cells overexpressing Kapβ1-iRFP. Top: The time elapsed per frame is 1 s. Kapβ1-iRFP fluorescence is visualized in the last panel. Lightning indicates the nuclear photobleaching event at t = 0. Scale bar, 10 µm. Bottom: τ (left) and permeability (right) of 2xEGFP do not change significantly following Kapβ1-iRFP overexpression. Statistical analysis was performed using a nonparametric (Mann-Whitney) two-tailed test. Error bars denote minimum and maximum measured values.
Discussion
NPCs convey a continuous flux of up to 1,000 cargoes per NPC per second (Ribbeck et al., 1998). Hence, NPCs are predominantly crowded with Kaps. This lies in marked contrast to NPC models that are generally conceived from the material characteristics of purified FG Nups. One common characteristic that is worth noting, however, is the ability for Kaps to permeate and enrich within the FG Nups in vitro, despite of their initial phase behaviors (Celetti et al., 2020; Frey and Görlich, 2007, 2009; Jovanovic-Talisman et al., 2009; Kapinos et al., 2014). In this regard, our study verifies that Kaps function as integral constituents of the NPC to fortify the permeability barrier. This also validates previous studies in permeabilized cells, which showed that depleting endoKapβ1 abrogated NPC barrier function, whereas adding back exoKapβ1 rescued it (Kapinos et al., 2017). Likewise, adding Kapβ1 (Lowe et al., 2015) and transportin (Mohr et al., 2009) further reduced NPC permeability against passive cargoes. Besides fortifying NPC barrier function, Kapβ1 enrichment may alter NPC structure (Pulupa et al., 2020) and as such may regulate the efficiency of NCT (Yang and Musser, 2006). Similarly, we speculate that Kap enrichment may be altered by mechanical perturbations to the NPC that impact NCT (Elosegui-Artola et al., 2017). Kapβ1 enrichment may also selectively restrict the uncontrolled leakage of Ran (i.e., due to their binding) to maintain the steep Ran gradient across the NE (Barbato et al., 2020). Taken together, this indicates that NPC permeability barrier function is optimized in synergy with Kaps (i.e., “Kap-centric control”; Lim et al., 2015).
The nature of NCT requires different Kaps to traverse the NPCs to transport their specific cargoes. However, it is unknown how many Kap molecules reside at the NPC or how they compete for binding with the FG Nups at steady state in vivo. This depends on the size of each Kap, the Kaps’ respective cellular abundances, and FG Nup binding characteristics. As a simple illustration, different Kaps that would have the same cellular abundance and FG Nup binding affinities would occupy the NPC with the same number of molecules if only their volumes were the same. Subtler features such as the number of FG repeat binding pockets, molecular flexibility, and shape (Christie et al., 2016; Conti et al., 2006) should also influence the binding kinetics and occupancy of specific Kaps. This may explain why Imp5 lacks enrichment in vivo (Fig. 1) and why >80% of its standalone pool is outcompeted by Kapβ1 ex vivo (Fig. 3 D). Here, we show that Kapβ1 and CRM1 exhibit varying degrees of occupancy at the NPC and that CRM1 can compensate for the loss of Kapβ1 (Fig. 6 A and Fig. 9). Although CRM1 and Kapβ1 exhibit similar binding properties with the FG Nups, CRM1 does not fully compensate for Kapβ1 depletion in vivo, because its cellular concentration (0.61 ± 0.02 µM; Fig. S4 B) is significantly lower than that of Kapβ1. At this concentration, CRM1 enrichment in the NPC may attain 50–60% of its maximum occupancy (see Fig. 2 B). Conversely, depleting CRM1 does not elicit any detectable change to the permeability barrier due to its low WT occupancy. Moreover, competition with Kapβ1 and other Kaps may further diminish this value (see Fig. 3 B).

Summary of Kap enrichment and compensation at the NPC permeability barrier. (A) Enrichment of Kapβ1 and CRM1 at the NPC under WT conditions based on their respective cellular abundances (CKap), apparent binding affinities (KD,Kap) to the FG Nups, and molecular volumes. (B) Depleting Kapβ1 significantly reduces its occupancy at the NPC, thereby allowing more CRM1 molecules to bind to the FG Nups. However, CRM1 compensation is constrained by its cellular concentration. (C) Depleting CRM1 does not elicit any detectable change to the permeability barrier due to (1) its low WT occupancy and (2) dominance of Kapβ1. Note that the size of CRM1 is larger than Kapβ1.
Summary of Kap enrichment and compensation at the NPC permeability barrier. (A) Enrichment of Kapβ1 and CRM1 at the NPC under WT conditions based on their respective cellular abundances (CKap), apparent binding affinities (KD,Kap) to the FG Nups, and molecular volumes. (B) Depleting Kapβ1 significantly reduces its occupancy at the NPC, thereby allowing more CRM1 molecules to bind to the FG Nups. However, CRM1 compensation is constrained by its cellular concentration. (C) Depleting CRM1 does not elicit any detectable change to the permeability barrier due to (1) its low WT occupancy and (2) dominance of Kapβ1. Note that the size of CRM1 is larger than Kapβ1.
Preferential FG Nup–specific interactions may influence the binding and occupancy of specific Kaps at the NPC, although molecular level evidence is so far lacking. As a case in point, a 50% deletion of FG Nups in Saccharomyces cerevisiae mutant strains impaired the import activity of Kap104 (yeast homologue of Kapβ2/transportin) and Kap121 (yeast homologue of Imp5) but not Kap95 (yeast homologue of Kapβ1; Strawn et al., 2004). This suggests that the coexistence of different Kaps or their competition at NPCs might depend on binding to distinct combinations of FG Nups (Strawn et al., 2004; Terry and Wente, 2007). Kap occupancy may be further linked to cell function. For example, Imp5 is required over a short period of time to import proteasomes following NE formation during mitosis, but not in G0/G1 phase up to late anaphase (Spits et al., 2019). Kapβ1-dependent import, however, remains functional throughout the entire cell cycle (Yasuhara et al., 2004). Further, competitive behavior between Kapβ1 and CRM1 may be important for RanBP2/Nup358 localization during mitosis to impact development and cell fate (Gilistro et al., 2017).
Kap expression levels and localization can change according to the physiological needs of a cell or in disease (Fallini et al., 2020). This makes our observations important for the understanding how Kaps could be involved in these processes. In our study, we have shown that a loss of Kap enrichment results in leaky NPCs and unsolicited NCT leakage of both specific and nonspecific cargoes as direct consequences of reduced Kapβ1 cellular levels. This may have key implications in postmitotic (chronological) aging cells, where NPCs are prone to leakage due to oxidative damage–induced defects in the permeability barrier (D’Angelo et al., 2009). Strikingly, an age-dependent loss of nucleocytoplasmic partitioning has been linked to progressively reduced levels of RanBP17, which is an importin that localizes at the NE in neurons (Mertens et al., 2015). This is also consistent with the down-regulation and mislocalization of Kaps in neurodegenerative disease (Guo et al., 2019; Pasha et al., 2021) and the reduced expression of most nucleoporin and Kap genes in senescence (Kim et al., 2010). Diminished Kapβ1 binding at the NE has also been linked to NPC leakage as a consequence of increased proteolysis under severe oxidative stress (Kodiha et al., 2004). Coincidentally, oxidative stress has also been associated with an increase of CRM1 binding at the NE (Crampton et al., 2009).
Still, NCT functions in a closely interconnected system with a large but finite number of parts, and perturbations to individual elements of the transport machinery may impact Kap enrichment, leading to NPC barrier leakage and decreased NCT function or vice versa. For instance, specific FG Nups have been shown to be mislocalized by phospho-tau in Alzheimer’s disease (Eftekharzadeh et al., 2018) and mutant huntingtin in Huntington’s disease (Grima et al., 2017). Arginine-rich polydipeptide repeats inhibit nuclear import by binding to Kapβ1 in amyotrophic lateral sclerosis and frontotemporal dementia (Hayes et al., 2020). In amyotrophic lateral sclerosis and frontotemporal dementia, transactive response DNA-binding protein-43 disrupts NCT by sequestering and mislocalizing both nucleoporins and Kaps to cytoplasmic aggregates (Chou et al., 2018). Even viruses can subvert NCT by degrading FG Nups (Gustin and Sarnow, 2002; Watters and Palmenberg, 2011), or they can inhibit the binding of Kapβ1 and its adaptor Kapα2 (KPNA2; Impα1) to the NPC, as is the case for both SARS-CoV (Frieman et al., 2007) and SARS-CoV-2 (Miorin et al., 2020). Further experimentation will be required to glean deeper insights into the role of Kap enrichment at the NPC and how its disruption is linked to defective NCT, nuclear leakage, and disease.
On a technical note, permeabilized cells provide a powerful means of assaying Kap behaviour directly at the NPC level, such as by super resolution microscopy (Chowdhury et al., 2022). However, as our results show, a considerable fraction of Kapβ1 is retained at NPCs following digitonin permeabilization (62%; Fig. 1 D). Hence, additional care should be taken to account for the presence of endogenous Kaps at the pore, as these might influence ex vivo experimental outcomes. Moreover, because Kap occupancy is concentration-dependent, it will be useful to study their ensuing motilities and translocation pathways within the NPC at physiological concentrations.
Materials and methods
Protein expression and purification
Cysteine-tagged FG domains of human Nup62 (1–240 aa; cNup62), Nup98 (1–498 aa; cNup98), Nup153 (874–1,475 aa; cNup153), and Nup214 (1,809–2,090 aa; cNup214), were expressed and purified as described previously (Kapinos et al., 2014). Briefly, additional cysteine residues were added (3xCys at the N-termini of cNup98 and cNup153, 1xCys at the N-terminus of cNup214, 1xCys at the C-terminus of cNup62) to enable covalent binding to gold sensor surfaces during SPR. The constructs were cloned into pPEP-TEV (cNup62, cNup98, and cNup153) or PETM11 (cNup214) vectors. Recombinant N-terminal His-tagged FG Nups were expressed in Escherichia coli BL21 (DE3) upon addition of 0.5 mM IPTG. All four FG Nups were purified under denaturing conditions (8 M urea, 100 mM NaH2PO4, 10 mM Tris base, pH 8.0) using a HisTrap HP column (GE Healthcare), followed by His tag removal with TEV protease and a second run on the HisTrap HP column. Purity of the collected fractions was verified using gel electrophoresis (12% PAGE at 0.1% SDS). Selected fractions were combined, concentrated, and frozen until further use.
All Kaps were expressed in E. coli BL21 (DE3) upon induction with 0.5 mM IPTG (Kapβ1 and Imp5) or 0.1 mM IPTG (CRM1) at 20–22°C. Kapβ1 (1–876 aa) was purified with an N-terminal His tag (10 mM Tris, pH 7.5, 100 mM NaCl, 1 mM DTT, 10 mM imidazole; eluted with 500 mM imidazole) from pETM-11 vector followed by gel filtration (Superdex 200; GE Healthcare). Imp5 (1–1,097 aa, SC118726; OriGene) was purified following the same procedure, except a pPEP-TEV expression vector was used. Full-length codon-optimized CRM1 (1–1,071 aa) was a kind gift from A. Dickmanns (University of Göttingen, Göttingen, Germany). CRM1 with a C-terminal His tag was purified from pET21a vector as described (Shaikhqasem et al., 2020). Briefly, cleared protein lysate was first applied to an HisTrap HP column (50 mM Hepes, pH 7.5, 500 mM NaCl, 10 mM imidazole, 2 mM MgCl2, 10% glycerol, 4 mM β-mercaptoethanol) and eluted by stepwise increase of imidazole concentration up to 500 mM. After that, the collected fractions were desalted via dialysis (50 mM Hepes, pH 7.5, 50 mM NaCl, 2 mM MgCl2, 5% glycerol, 4 mM β-mercaptoethanol), with remaining impurities being removed by anion exchange chromatography (HiTrap Q HP Column; GE Healthcare). Protein elution was performed in a 0–70% gradient of low-salt (50 mM Hepes, pH 7.8, 50 mM NaCl, 2 mM MgCl2, 6 mM β-mercaptoethanol) to high-salt buffer (50 mM Hepes, pH 7.8, 400 mM NaCl, 2 mM MgCl2, 6 mM β-mercaptoethanol). Purified Kapβ1, Imp5, and CRM1 were analyzed by gel electrophoresis (12% PAGE at 0.1% SDS). Selected fractions were then pooled together, concentrated, and stored at −80°C until needed. The concentration of the recombinant proteins was determined by absorption measurements at 280 nm (A0.1%Kapβ1 = 0.820, A0.1%Imp5 = 0.918, A0.1%CRM1 = 0.940).
Other SPR materials
BSA (Sigma-Aldrich) was dissolved in filtered and degassed PBS (Gibco/Life Technologies) to a final concentration of 1% (wt/vol). Hydroxyl-terminated triethylene glycol undecanethiol or HS-[CH2]-[OCH2CH2]3-OH (abbreviated as PUT; 67311; Sigma-Aldrich) was dissolved in ethanol to obtain 100 mM stock, which was then diluted in ethanol to 10 mM concentration and further in PBS to 1 mM before experimentation.
SPR sensor preparation
SPR gold sensor chips (SIA Kit Au; GE Healthcare) were stored under vacuum. Before use, chips were sequentially sonicated in acetone, 2-propanol, and high-purity ethanol for 15 min each followed by immediate drying in a nitrogen gas stream. Sensors were then UV ozone-cleaned for 40 min (model 42A-220; Jelight) and sonicated again for 15 min in ethanol. The gold sensors were mounted on the sample holder immediately after drying under a nitrogen gas stream.
SPR measurements
All SPR measurements were performed at 25°C in a four-flow cell Biacore T200 (GE Healthcare) instrument as described before (Kapinos et al., 2014; Schoch et al., 2012). Flow chambers 1 and 2 were used as a reference and were passivated with PUT (2 µl/min for 30 min). In chambers 3 and 4, FG Nups were first immobilized (2 µl/min for 40 min) followed by PUT (2 min, 2 µl/min) passivation to minimize the effect of analyte unspecific binding to the sensor’s surface. Measurements were performed in filtered and degassed PBS buffer, pH 7.2 (Gibco/Life Technologies). Prior to experimentation, all proteins were dialyzed against PBS and diluted to the desired concentrations. Resulting solutions were centrifuged for 15 min at 15,000 ×g to remove particles and bubbles. Due to its low purification efficiency and stability, the maximum CRM1 concentration used for SPR measurements was 8 µM. Each association and dissociation phase was recorded for 10 min and 7 min, respectively, at a flow rate of 10 µl/min. At the end of every Kap binding step, three consecutive BSA injections (10 µl/min, 30 s) were performed to measure the FG Nup layer height change. In the last cycle, all Kap molecules were removed from the surface by treatment with 0.2 M NaOH solution (10 µl/min for 10 min) followed by a 30-min buffer wash. This regeneration step ensured that all Kaps could bind reversibly to the FG Nups.
Fluorescent labeling of Kaps
Recombinant Kapβ1 was labeled with Alexa Fluor 488 C5 maleimide dye (A10254, Invitrogen), CRM1 with Alexa Fluor 647 N-hydroxysuccinimide ester (A20006, Invitrogen) dye, and Imp5 with either Alexa Fluor 488 C5 maleimide or Alexa Fluor 647 C2 maleimide (A20347, Invitrogen) dyes, depending on its final use. For Kapβ1 and Imp5, dyes were added in 10-fold excess, and the reaction was incubated overnight at 4°C, while a 2-fold excess of dye and 2-h incubation at RT was optimal for CRM1 labeling. CENTRI-SEP spin columns (Princeton Separations) were used to remove free dye. Protein concentration and labeling efficiency were calculated following NanoDrop UV-Vis spectrometry to measure the respective dye and protein absorptions. If needed, labeled proteins were concentrated further using Pierce polyethersulfone protein concentrators of 10 kD molecular weight cutoff (88513, Thermo Fisher Scientific). Labeled Kaps were snap frozen and stored at −80°C until further use.
Cell culture
MDCK cells (a kind gift from I. Näthke, University of Dundee, Dundee, UK) and HeLa cells (CCL-2; American Type Culture Collection) were cultured in MEM (M4655; Sigma-Aldrich) and high-glucose DMEM with GlutaMAX supplement (61965026; Thermo Fisher Scientific), respectively, supplemented with 10% FBS (Thermo Fisher Scientific). Cells were kept at 37°C with 5% CO2. Transfections for all the plasmids and siRNA were carried out using jetPRIME reagent (Polyplus-transfection SA) according to the manufacturer’s instructions. 2xEGFP-NES, 3xEGFP-NES, 2xEGFP-NLS, and 2xEGFP stable cell lines were obtained by selecting transfected cells with 6–7 μg/ml puromycin (A11138-03; Gibco) or 700 μg/ml neomycin (G418, 10131-019; Gibco), followed by FACS. For transient transfections (Fig. 1), Kapβ1-EGFP, EGFP-CRM1, or Imp5-mCherry constructs cloned into pcDNA3.1(−) vector were used.
Permeabilized cell assay
HeLa cells were plated on glass coverslips (#1.5) 1 d before experimentation. Cells were washed twice with PBS (Sigma-Aldrich) and permeabilized for 5 min with 40 µg/ml digitonin as reported previously (Adam et al., 1990). After three 5-min washes with PBS, cells were incubated with Ran mix (2 mM GTP, 0.1 mM ATP, 4 mM creatine phosphate, 20 U/ml creatine kinase, 5 µM RanGDP, 4 µM NTF2, and 1 mM DTT) for 1 h at RT to deplete endogenous Kaps. Following another triple-washing step in PBS of 5 min each, cells were incubated for 1 h in varying concentrations of fluorescently labeled Kapβ1, CRM1, and Imp5 or their combinations to study their repopulation at the NPCs. After a triple-washing step in PBS of 5 min each, cells were fixed with 4% formalin for 15 min and stained with DAPI. The cells then underwent a final triple-washing step in PBS before being mounted in VECTASHIELD antifade mounting medium (H-1000, Vector Laboratories) mixed with fluorescent calibration beads (InSpeck Green Fluorescent beads, Thermo Fisher Scientific; MESF Alexa Fluor 647 beads, Bang Laboratories). A similar procedure was performed to estimate the level of Kap retention at the NPCs following Ran mix treatment. First, HeLa cells were plated into eight-well ibidi dishes and transfected with the fluorescent constructs of Kapβ1-EGFP, EGFP-CRM1, or Imp5-mCherry. The next day, cells were permeabilized and incubated with Ran mix while the fluorescence was monitored at each stage of the treatment using confocal microscopy.
Mean-field model of Kap accumulation within a pore
The minimal model of Kap accumulation in the FG Nup assembly of the NPC is based on previously developed models (Opferman et al., 2013; Vovk et al., 2016). For each pairwise competition experiment (Fig. 3), two different Kaps with respective volumes and were modeled, where . The interactions of a Kap of type with the FG Nup milieu inside the NPC is represented by a phenomenological free energy gain Here, is related to the equilibrium dissociation constant KD of Kaps interacting with the FG Nups and can be estimated from in vitro SPR experiments (Fig. 4). Once within the pore, the Kaps compete for space inside it, represented via excluded volume interactions.
Accumulation of a single type of particle
The equilibrium solution is obtained by minimizing the free energy over the particle concentration within the pore by setting , which gives: where the last equality arises from the definition of and defines the effective dissociation constant . The superscript indicates that it is a solution for single particle species.
Accumulation of two types of particles
The quantity (Fig. 5) is given by for CRM1 and Imp5 on a background of Kapβ1 (where Kapβ1 is the smaller Kap), respectively, and for Imp5 on a background of CRM1 (where CRM1 is the larger Kap) computed at the endpoint of the experimental concentration range where both and are 10 µM. The volume of each different Kap was calculated from its known crystal structure (Protein Data Bank accession nos. 3ND2 [Kapβ1], 4FGV [CRM1], and 3W3T [Imp5]). Calculations of the reduction of Kapβ1 occupancy in competition with CRM1 and Imp5 binding are also consistent with experimental results (Fig. S3) and serve as a “bootstrapping” verification of the model.
To test the robustness of the model predictions with respect to the choice of the model and its assumptions, several other models of the same family were investigated (not shown). We found that our results are robust with respect to the model choice, as long as a model accounts for the same salient physical variables: attractive interaction of the Kaps with the FG Nup milieu inside the pore and the competition for space. These models provide a foundation for more detailed descriptions that will include spatial inhomogeneity of the FG Nup assembly in the pore and specifics of the binding site distributions on the FG Nups and the Kaps.
siRNA design and validation
The siRNAs against dog Kapβ1 (F6X637_CANLF) and CRM1 (E2R9K4_CANLF) were designed using the InvivoGen siRNA design tool (https://www.invivogen.com/sirnawizard/design.php; Table S1). For both proteins, two or three different oligonucleotides were selected and synthetized (Microsynth AG), and their efficiency was tested via immunoblotting. MDCK cells were transfected with the siRNA oligonucleotides at 40–50% confluency the day after passaging. 24 h later, they were passaged again. Cell lysis and Western blotting were performed 2 d after transfection. The most efficient oligonucleotides were chosen for further experiments. siRNA oligonucleotides were modified with Cy5 at the 3′ end of their antisense strand to visualize the cells affected by siRNA treatment.
Western blotting
Western blotting was used to confirm the silencing efficiency of the designed siRNA oligonucleotides. The day after transfection, cells were split into wells of a 6-well plate and lysed 24 h later. Lysis was performed in radioimmunoprecipitation assay buffer (89900; Thermo Fisher Scientific) supplemented with cOmplete protease inhibitor cocktail (11873580001; Roche), benzonase (Novagen), and phosphatase inhibitors 2 and 3 (P5726 and P0044, respectively; Sigma-Aldrich). Lysates were spun down for 15 min at 15,000 × g at 4°C, and total protein concentration was determined using a Pierce bicinchoninic acid assay (23227; Thermo Fisher Scientific). For each sample, the same total amount of proteins was resolved by SDS-PAGE (12% PAGE at 0.1% SDS) and transferred onto nitrocellulose membranes (Trans-Blot Turbo Midi 0.2 µm, 1704158; Bio-Rad Laboratories) using a Trans-Blot Turbo transfer system. After the transfer, membranes were blocked with 0.1% (wt/vol) blocking reagent (11096176001; Roche) in TBS with Tween 20 (TBST) solution for at least 1 h at RT and probed for Kapβ1 [ab2811 (3E9); Abcam] or CRM1 (ABIN2778849; Antikörper). Simultaneously, membranes were probed for GAPDH (α-rabbit, PA1-987, Thermo Fisher Scientific; α-mouse, 60004-1-Ig; ProteinTech) to allow for signal normalization and quantification. ECL-conjugated anti-mouse (NA931V; GE Healthcare) and anti-rabbit (ab6721; Abcam) secondary antibodies were used for immunodetection. Finally, membranes were developed in a Fusion FX (Vilber Lourmat) system, and resulting chemiluminescent signals were quantified using Fiji (ImageJ).
IF
MDCK cells were plated on glass coverslips (#1.5) and allowed to adhere for ∼24 h. Afterward, cells were rinsed twice with PBS (Sigma-Aldrich) and fixed in 4% PFA (HT501128; Sigma-Aldrich) for 15 min at RT. Next, samples were washed three times for 5 min each with PBS and permeabilized with 0.2% Triton-X (in PBS). After three more washes with 1% BSA (A9647; Sigma-Aldrich) in PBS for 5 min each, coverslips were left for >1 h in 1% BSA solution for blocking. Subsequently, primary antibodies against Kapβ1 [ab2811 (3E9); Abcam] and CRM1 (rabbit antibody; kind gift from R. Kehlenbach, University of Göttingen, Göttingen, Germany) in 1% BSA were applied for 1 h at RT. Following another triple-washing step (three times for 5 min each in 1% BSA), the samples were incubated with secondary antibodies: goat anti-mouse Alexa Fluor 568 (A11004; Thermo Fisher Scientific), goat anti-rabbit Alexa Fluor 488 (A11034; Thermo Fisher Scientific), and DAPI (62248; Thermo Fisher Scientific) solution in 1% BSA for 1 h at RT and protected from light. After the last washing step (three times for 5 min each in 1% BSA), coverslips were mounted onto glass slides with VECTASHIELD medium and sealed with nail polish.
Knockdown of Kapβ1 and CRM1
MDCK stable cell lines expressing NLS or NES cargoes were plated in a 12-well plate and transfected with siRNA oligonucleotides the next day. Cells expressing NES cargoes were treated with siRNA1_KPNB1 (55 pmol) or siRNA2_KPNB1 (55 or 110 pmol), and siRNA2_CRM1_Clupus (55 or 110 pmol) was added to the cells expressing NLS cargo. The day after, transfected cells were split onto 18-mm round glass coverslips and fixed with PFA 24 h later. Subsequently, cells were incubated in 1% (mass/vol) BSA in PBS for 30 min at RT and with DAPI (5 μg/ml in 1% BSA) for 15–20 min at RT. Coverslips were mounted using VECTASHIELD and sealed using nail polish.
Confocal microscopy, imaging, and analysis
Fluorescence images of fixed samples and permeabilized cells were obtained at RT using an LSM 880 inverted confocal microscope and Zeiss ZEN 2.3 software. The system was equipped with an oil-immersed 63×/1.4 NA Plan Apochromat objective, a widefield camera, and an Airyscan detector (Zeiss). Fluorescence quantification of IF staining and cargo leakage experiments was performed using CellProfiler software (Kamentsky et al., 2011). The DAPI channel was used for initial image segmentation. For IF staining of Kaps, NE, nucleus, and cytoplasmic regions of interest (ROIs) were created by shrinking or expanding the original DAPI-defined regions. In cargo leakage experiments, only nuclear and cytoplasmic ROIs were specified. In both types of experiments, the ROIs were used to quantify the mean fluorescence intensity across all channels. The number of analyzed cells per condition is specified in the figures. The NE fluorescence intensity from the permeabilized cell assay was quantified using custom Fiji macros. First, images were smoothed (median filter of 10-pixel radius) and automatically segmented based on the DAPI signal using the Otsu method. The NE ROI was defined by combined enlarging and shrinking of the original DAPI ROI. Because of the small but not negligible chromatic shift and discontinuities in the NE, in some cases, the NE ROIs had to be manually adjusted by translation and/or removal of nonfluorescent subsegments. Because of the broad range of Kap concentrations used in the permeabilized cell assays, the laser power had to be adjusted for each Kap titration condition. To correct for these variations, Green InSpeck beads (Thermo Fisher Scientific) and MESF Alexa Fluor 647 beads (Bang Laboratories) were premixed with the samples and imaged with increasing laser power. Changes in bead fluorescence were then used to obtain calibration curves, which allowed the normalization of the Kap fluorescent signal at the NE.
Statistical analysis
Statistical analyses was performed using the Kruskal-Wallis test, except for FRAP measurements, where ordinary one-way ANOVA and nonparametric (Mann-Whitney) two-tailed tests were applied to test for differences between Kapβ1-depleted or Kapβ1-overexpressing cells, respectively. P adjusted values were calculated using the Benjamini-Hochberg procedure. Outliers were removed (robust regression and outlier removal method; Q = 1%) before statistical analysis, after which the data were tested for normality using a built-in function of GraphPad Prism software.
Model of NPC permeability
FRAP experiments
MDCK cells stably expressing 2xEGFP were transfected with Kapβ1-iRFP plasmid or siRNA oligonucleotides against Kapβ1 or CRM1. After 24 h, the cells were plated in an eight-well µ-Slide (ibidi) at ∼15,000 cells/cm2 density, and, on the next day, FRAP experiments were performed in a Phenol Red–free medium (51200046; Thermo Fisher Scientific). Cells treated with siRNA against Kapβ1 were visualized using SlideBook software and photobleached using a 3i spinning disk confocal setup built on a Zeiss Axio Observer stand (Intelligent Imaging Innovations). The system was equipped with a 1.4 NA/63× Plan Apochromat objective, EM charge-coupled device camera (Evolve 512; Photometrics), and a humidified climate control system (37°C, 5% CO2; Okolab). The experimental settings are summarized in Table S2. Videos from at least three independent experiments were collected and analyzed (see supplemental material). Owing to differences in experimental design, statistical analysis of Kapβ1 silencing experiments was performed with control siRNA-treated cells as the reference, whereas Kapβ1-iRFP overexpression experiments were compared with the mock-transfected cells.
Analysis of FRAP decay time and changes to NPC permeability
Subsequently, distributions of the data points were checked for normality, and statistical analysis was performed using one-way ANOVA corrected for multiple comparisons (false discovery rate [FDR]) using the Benjamini-Hochberg procedure.
Cell collection for MS
Control and siRNA-treated MDCK cells were collected 48 h after transfection. Cells were washed with PBS, trypsinized (T3924-100ML; Sigma-Aldrich), and automatically counted (LUNA-FL Dual Fluorescence Cell Counter; Logos Biosystems) following the Trypan blue (T8154; Sigma-Aldrich) staining protocol. Next, 200,000 cells from each sample were collected and washed twice with cold PBS followed by a 5-min spin at 10,000 ×g at 4°C. Cell pellets were frozen at −80°C until needed.
Sample preparation for liquid chromatography tandem MS (LC-MS/MS)
Once all necessary biological replicates were collected, samples were processed according to the whole-cell lysis and digestion using sodium deoxycholate, chloroacetamide, and PreOmics cartridges for the LC-MS/MS protocol. Cell pellets were thawed on ice, and 50 µl of lysis buffer [1% sodium deoxycholate, 10 mM tris(2-carboxyethyl)phosphine, 100 mM Tris, pH 8.5] was added to each sample. Cells were lysed by sonication (30 s on, 30 s off, 10 cycles), spun down, and heated for 10 min at 95°C with shaking at 300 rpm. After cooling down, 1 µl of chloroacetamide solution was added to the samples and incubated at 37°C for 30 min at 500 rpm. Next, the pH of the samples was checked and adjusted with 1 M ammonium bicarbonate if needed. Subsequently, samples were digested into peptides by overnight incubation with trypsin at 37°C. The next day, obtained peptides were purified via solid-phase extraction using PR-sulfonate cartridges (SDB-RPS; PreOmics). First, 5% trifluoroacetic acid (TFA) was added to the samples followed by addition of the wash buffer 1 (1% TFA in 2-propanol). In the next step, samples were transferred into the cartridges, spun down, and washed two more times with wash buffer 1. Then two washes were performed with wash buffer 2 (0.2% TFA in water), and purified peptides were eluted in two steps with the elution buffer (1% vol/vol ammonium hydroxide, 19% water, and 80% acetonitrile). Collected eluates containing purified peptides were dried under a vacuum and stored at −20°C. Subsequently, peptides were dissolved in LC buffer A (0.15% formic acid, 2% acetonitrile), sonicated, and mixed at 1,400 rpm at 25°C for 5 min. The final peptide concentration was determined using the SpectroStar NanoDrop analyzer (BMG Labtech). Dissolved peptides were stored in LC vials at −20°C until MS analysis.
LC-MS/MS
Dried peptides were resuspended in 0.1% aqueous formic acid and subjected to LC-MS/MS analysis using an Orbitrap Fusion Lumos mass spectrometer fitted with an EASY-nLC 1200 (both from Thermo Fisher Scientific) and a custom-made column heater set to 60°C. Peptides were resolved using a reverse-phase high-performance LC (RP-HPLC) column (75 µm × 36 cm) packed in-house with C18 resin (ReproSil-Pur C18-AQ, 1.9 µm resin; Dr. Maisch GmbH) at a flow rate of 0.2 µl/min. The following gradient was used for peptide separation: from 5% B to 12% B over 5 min to 35% B over 90 min to 50% B over 25 min to 95% B over 2 min followed by 18 min at 95% B. Buffer A was 0.1% formic acid in water, and buffer B was 80% acetonitrile and 0.1% formic acid in water.
The mass spectrometer was operated in data-dependent acquisition mode with a cycle time of 3 s between master scans. Each master scan was acquired in the Orbitrap at a resolution of 120,000 full width at half maximum (FWHM; at 200 mass-to-charge ratio [m/z]) and a scan range from 375 to 1,500 m/z followed by MS2 scans of the most intense precursors in the linear ion trap at a “Rapid” scan rate with an isolation width of the quadrupole set to 1.4 m/z. Maximum ion injection time was set to 50 ms (MS1) and 35 ms (MS2) with an automatic gain control (AGC) target set to 1e6 and 1e4, respectively. Only peptide ions with charge states 2–5 were included in the analysis. Monoisotopic precursor selection was set to peptide, and the intensity threshold was set to 5e3. Peptides were fragmented by higher-energy collisional dissociation with collision energy set to 35%, and one microscan was acquired for each spectrum. The dynamic exclusion duration was set to 30 s.
The acquired raw files were imported into the Progenesis QI software (version 2.0; Nonlinear Dynamics), which was used to extract peptide precursor ion intensities across all samples applying the default parameters. The generated mgf files were searched using MASCOT against a decoy database containing normal and reverse sequences of the predicted SwissProt entries of Canis lupus familiaris (https://www.ebi.ac.uk; release date November 6, 2019) and commonly observed contaminants (51,776 sequences in total) generated using the SequenceReverser tool from the MaxQuant software (version 1.0.13.13). The search criteria were set as follows: full tryptic specificity was required (cleavage after lysine or arginine residues, unless followed by proline), three missed cleavages were allowed, carbamidomethylation (C) was set as a fixed modification, oxidation (M) and acetylation (protein N-term) were applied as variable modifications, and mass tolerance of 10 ppm (precursor) and 0.6 D (fragments). The database search results were filtered using the ion score to set the FDR to 1% on the peptide and protein levels, respectively, based on the number of reverse protein sequence hits in the datasets. An in-house script was then used to convert the relative quantitative data to absolute protein estimates (intensity-based absolute quantification values; Ahrné et al., 2016).
Targeted LC-MS analysis
Targeted MS quantification was basically performed as recently described (Schmidt et al., 2020). Parallel reaction monitoring (Peterson et al., 2012) assays were generated from a mixture containing 50 fmol of each proteotypic heavy reference peptide (VAAGLQIK* and VLANPGNSQVAR*; JPT Peptide Technologies). Therefore, the 100 fmol of peptides were analyzed using a Q Exactive HF coupled to an EASY nano-LC 1000 system (both from Thermo Fisher Scientific) equipped with a heated RP-HPLC column (75 µm × 30 cm) packed in-house with 1.9 µm C18 resin (Reprosil-AQ Pur; Dr. Maisch GmbH). Peptides were analyzed per LC-MS/MS run using a linear gradient ranging from 95% solvent A (0.15% formic acid, 2% acetonitrile) and 5% solvent B (98% acetonitrile, 2% water, 0.15% formic acid) to 30% solvent B over 60 min at a flow rate of 200 nl/min. The mass spectrometer was operated in data-dependent acquisition mode with a cycle time of 3 s between master scans. Each master scan was acquired in the Orbitrap at a resolution of 120,000 FWHM (at 200 m/z) and a scan range from 300 to 1,600 m/z followed by MS2 scans of the most intense precursors in the Orbitrap at 30,000 FWHM (at 200 m/z) resolution with an isolation width of the quadrupole set to 1.4 m/z. Maximum ion injection time was set to 50 ms (MS1) and 50 ms (MS2) with AGC targets set to 1e6 and 1e5, respectively. Only peptides with charge states 2–5 were included in the analysis. Peptides were fragmented by higher-energy collisional dissociation with collision energy set to 28%, and one microscan was acquired for each spectrum. The dynamic exclusion duration was set to 30 s.
The acquired raw files were searched using the MaxQuant software (version 1.6.2.3) against the same C. lupus familiaris database mentioned above using default parameters, except that protein, peptide, and site FDR were set to 1 and Lys8 and Arg10 were added as variable modifications. The best six transitions for each peptide were selected automatically using an in-house software tool and imported into SpectroDive (version 10; Biognosys). An unscheduled mass isolation list containing all peptide ion masses was exported from SpectroDive and imported into the Orbitrap Lumos operating software for parallel reaction monitoring analysis.
Here, to each peptide sample, an aliquot of a heavy reference peptide mix containing chemically synthesized proteotypic peptides (Spike-Tides; JPT) was spiked into each sample at a concentration of 2 fmol of heavy reference peptides per 1 µg of total endogenous protein mass.
Aliquots containing 1 μg of peptides were subjected to targeted LC-MS analysis using Q Exactive HF coupled to an EASY nano-LC 1000 system (both from Thermo Fisher Scientific), equipped with a heated RP-HPLC column (75 µm × 30 cm) packed in-house with 1.9 µm C18 resin (Reprosil-AQ Pur; Dr. Maisch GmbH). Peptides were analyzed per LC-MS/MS run using a linear gradient ranging from 95% solvent A (0.15% formic acid, 2% acetonitrile) and 5% solvent B (98% acetonitrile, 2% water, 0.15% formic acid) to 30% solvent B over 60 min at a flow rate of 200 nl/min. For MS2, the resolution of the Orbitrap was set to 120,000 FWHM (at 200 m/z), the fill time was set to 250 ms to reach an AGC target of 3e6, the normalized collision energy was set to 28%, the ion isolation window was set to 0.4 m/z, and the first mass was fixed to 100 m/z. An MS1 scan from 350 to 1,600 m/z at 120,000 resolution (at 200 m/z), AGC target 3e6, and fill time of 100 ms was included in each MS cycle. All raw files were imported into SpectroDive for protein/peptide quantification using default settings. To control for variation in injected sample amounts, the total ion chromatogram (only comprising ions with two to five charges) of each sample was determined using Progenesis as described above and used for normalization. All follow-up peptide abundance calculations were performed in Microsoft Excel, given that MDCK cells contain ∼20% proteins per cell volume (Erlinger and Saier, 1982) and that protein cellular concentration is 300 mg/ml (Wiśniewski et al., 2014).
Online supplemental material
Fig. S1 shows the effect of Kapβ1 preloading on KD as obtained by Langmuir isotherm fitting. Fig. S2 shows SPR measurements and equilibrium binding analysis for each Kap-FG Nup pair. Fig. S3 shows mean field model predictions for the reduction of Kapβ1 occupancy in response to the binding of CRM1 and Imp5. Fig. S4 shows characterization of Kapβ1 and CRM1 abundance after siRNA treatment. Fig. S5 shows the results of FRAP experiments after Kapβ1-iRFP overexpression in MDCK cells. Table S1 lists sequences of siRNA oligonucleotides. Table S2 lists FRAP settings used in the experiments. Video 1 shows a representative time-lapse clip of fluorescence recovery after photobleaching of 2xEGFP in the nucleus.
Data availability
Mass spectrometry data files have been deposited to the ProteomeXchange Consortium via the PRIDE partner repository with the dataset identifier PXD028074 and 10.6019/PXD028074. Raw image data files are available in the Zenodo public repository under the identifier 10.5281/zenodo.5574569. All other supporting data is available in the main text or supplemental material.
Acknowledgments
We thank A. Dickmanns (University of Göttingen, Göttingen, Germany) for the CRM1 expression plasmid and R. Kehlenbach (University of Göttingen, Göttingen, Germany) for the CRM1 antibody. We also acknowledge the Imaging, Biophysics and Proteomics core facilities at the Biozentrum for their support and assistance.
This work is supported by the Biozentrum and the Swiss Nanoscience Institute. R.Y.H. Lim acknowledges funding support from the Schweizerischer Nationalfonds zur Förderung der Wissenschaftlichen Forschung (Swiss National Science Foundation; grant no. 310030_201062). A. Zilman acknowledges the support from the National Science and Engineering Council of Canada (NSERC). J. Kalita is funded by a Biozentrum PhD Fellowship Program.
The authors declare no competing financial interests.
Author contributions: J. Kalita, L.E. Kapinos, and R.Y.H. Lim conceptualized the project, scrutinized data, and wrote the manuscript. J. Kalita designed and performed experiments as well as analyzed data. Computational modeling was performed by T. Zheng and A. Zilman. C. Rencurel expressed and purified proteins. All authors commented on the manuscript.

