


Acquisition of nonprofessional phagocytic cell fate plays an important role in sculpting functional metazoan organs and maintaining overall tissue homeostasis. Though physiologically highly relevant, how the normal epithelial cells acquire phagocytic fate is still mostly unclear. We have employed the Drosophila ovary model to demonstrate that the classical ecdysone signaling in the somatic epithelial follicle cells (AFCs) aids the removal of germline nurse cells (NCs) in late oogenesis. Our live-cell imaging data reveal a novel phenomenon wherein collective behavior of 4–5 AFCs is required for clearing a single NC. By employing classical genetics, molecular biology, and yeast one-hybrid assay, we demonstrate that ecdysone modulates the phagocytic disposition of AFCs at two levels. It regulates the epithelial–mesenchymal transition of the AFCs through Serpent and modulates the phagocytic behavior of the AFCs through Croquemort and Draper. Our data provide unprecedented novel molecular insights into how ecdysone signaling reprograms AFCs toward a phagocytic fate.
Introduction
Ingestion of defective or redundant cells by other host cells is called cellular cannibalism or phagoptosis. This is observed during several physiological processes involving the clearing of aged or stressed red blood cells, refining of neural circuits during dendritic pruning, engulfment, and clearance of pathogens (Olsson and Oldenborg, 2008; Shi and Pamer, 2011; Yu and Schuldiner, 2014). Under diseased conditions, it is also linked to acts of misrecognition and neurodegeneration (Mason and Mcgavern, 2022; Elguero et al., 2023). Professional phagocytes mainly mediate the engulfment and ingestion of cells (Boada-Romero et al., 2020). However, recent reports suggest phagoptosis can also be performed by nonprofessional phagocytes. Some tumor cells phagocytose other tumor cells, and there are instances when host cells are also detected within the tumor cells (Fais and Overholtzer, 2018; Lugini et al., 2006; Mackay and Muller, 2019; Overholtzer and Brugge, 2008). Since many solid tumors have an epithelial origin, it is intriguing how the tumor cells acquire the ability to internalize other cells. Interestingly, nonprofessional phagocytosis behavior is exhibited by normal epithelial or mesenchymal cells (Boada-Romero et al., 2020). Like blastocyst cells engulf luminal epithelial cells to facilitate embryo implantation in the mammalian uterus (Li et al., 2015). In addition, nonprofessional phagocytosis behavior has been observed in smooth muscle cells, renal cells, and hepatocytes too (Ichimura et al., 2008; Davies et al., 2018; Sandison et al., 2016). Incidentally, this phenomenon is also observed in the invertebrates. Developing worms clear excess cells by this process, and the Drosophila gametes become fertile once the unwanted germ cells are ingested by the overlying somatic follicle epithelial cells or the cyst cells (Timmons et al., 2016; Reddien et al., 2001; Zohar-Fux et al., 2022; Hoeppner et al., 2001). Overall, phagoptosis is universal and is seen both in vertebrates and in invertebrates. Since the phenomenon of epithelial cells acquiring phagocytic fate is quite a recent finding, the underlying mechanism of how these cells acquire the ability to engulf and ingest fellow cells is unclear.
Drosophila oogenesis has emerged as an excellent genetic model for understanding various aspects of metazoan development and diseases (Armstrong, 2020; Montell, 2008; Naora and Montell, 2005). Of all the morphogenetic events being studied involving the fly eggs, lately, researchers have focused on understanding how phagoptosis aids in clearing the excess germline cells as the oocyte enters the final stages of maturation (Chasse et al., 2024; Lebo and McCall, 2021). A developing fly egg typically consists of 16 interconnected germline cells enveloped by somatic epithelial follicle cells that grow through 14 developmental stages to form the mature egg. As the oogenesis progresses, one germline cell acquires the oocyte fate, while the remaining 15 called the nurse cells (NCs) endoreplicate and nourish the growing oocyte (Hinnant et al., 2020; Mahajan-Miklos and Cooley, 1994). Around stage 11, the anterior follicle cells (AFCs) surrounding the 15 germline cells initiate the secretion of lysosomal contents into the NCs once maternal components are dumped into the oocyte (Mondragon et al., 2019). This step acidifies NC nuclei and disrupts their nuclear membrane. Concomitantly, the AFCs ingest and clear all the NCs by stage 14. We know that parallel activation of phagocytic receptor gene, Draper, and Rac GTPase modulator, Ced-12/ELMO, is required in the AFCs for NC engulfment and clearance (Timmons et al., 2016). Though we have some information on how the AFCs acquire the phagocytic fate, it is unclear which signals trigger this transformation. To understand this aspect, we specifically examined the ecdysone signaling that is active in the AFCs and temporally overlaps with the phase when they acquire the phagocytic fate. Ecdysone is a steroid hormone that binds the nuclear receptor ecdysone receptor (EcR) and activates several downstream genes by complexing with its partner ultraspiracle (Usp). The EcR signaling regulates several physiological processes in flies spanning reproduction, behavior, cell cycle, and metamorphosis (Yamanaka et al., 2013; Jiang et al., 1997; Carney and Bender, 2000; Qian et al., 2015; Schwedes et al., 2011).
Here, we examined the role of EcR signaling in cell death (phagoptosis), and strikingly, human orthologs of this gene are implicated in Parkinson’s disease, Oguchi disease-2, congestive heart failure, and hypertension (Sharma et al., 2022; Shao et al., 2021; Szanto et al., 2004; Maden, 2002; Preston et al., 2005). Thus, any attempt to understand how one group of cells engulfs and kills other host cells will not only shed light on basic cellular biology but would also have implications in targeting proliferative, degenerative, infectious, and autoimmune disorders, including cancer, arthritis.
Results
Ecdysone regulates developmental cell death during Drosophila oogenesis
The Drosophila egg chambers undergo conspicuous shape change as they transition from the previtellogenic to the vitellogenic phase during mid-oogenesis. This is followed by the NCs transferring the maternal components into the growing oocyte. By stage 11, as the dumping process draws to a close, the NCs start shrinking in size. Concomitantly, the overlying squamous AFCs engulf, encapsulate, and initiate the clearance of the shriveling NCs (Timmons et al., 2016) (Fig. 1, A–C″). Incidentally, the ecdysone signaling that is activated in the AFCs of the vitellogenic egg chambers (stage 9) is also associated with orchestrating their shape from the cuboidal to squamous fate and initiating collective cell movement of a subset of AFCs called the border cells (Buszczak et al., 1999; Belles and Piulachs, 2015; Hackney et al., 2007; Domanitskaya et al., 2014; Jang et al., 2009; Jia et al., 2022; Ghosh et al., 2023, Preprint). We were drawn by the AFC expression of EcRE-lacz, a reporter of ecdysone signaling, that persisted beyond stage 11 (Ghosh et al., 2023, Preprint). This expression of the EcRE-lacz in the AFCs coincided with the phase when the NCs are actively cleared from the maturing eggs in late oogenesis (stage 11–14 egg chambers) (Fig. 1, D1–E2 and Fig. S1, A1–D2). Since ecdysone signaling is associated with cell removal and tissue remodeling in Drosophila larvae (Jiang et al., 1997; Lee et al., 2002; Winbush and Weeks, 2011; Zirin et al., 2013), we were curious to check whether it plays any role in the clearance of NCs.

Ecdysone signaling modulates NC removal. (A) Schematic diagram of NC encapsulation by 4–5 AFCs during late oogenesis (stage 11 to late stage 12). (B′–C″) Immunostained egg chambers depicting follicle cells in the act of enveloping the NCs. Stage 11 egg chambers exhibit small fingerlike projections (B′ and B″). Stage 13 egg chamber where the NC is completely enveloped by the overlying follicle cells (C′ and C″). Nuclei are shown in red, and follicle cells are marked with mCD8GFP in green. (D1–E2) Stagewise activation of ecdysone signaling in the AFCs during late oogenesis. EcRE-lacz is marked in green, and nuclei are marked in red. Stage 11 egg chamber (D1 and D2) and stage 12 egg chamber (E1 and E2). (D2and E2) are LUT images of EcRE-lacz. (F′–I″) Stage 14 egg chambers of indicated genotypes. Persisting NC nuclei are marked by a yellow arrowhead. DAPI is in red, and Armadillo is in green. Images show control (F′ and F″), EcRRNAi (G′ and G″), EcRB1DN (H′ and H″), and UspRNAi of genotype GR1-Gal4/UspRNAi (I′ and I″). (J) Quantification of persisting NC nuclei in stage 14 egg chambers of indicated genotypes. “n” stands for the number of egg chambers analyzed. (K) Alternative quantification of PN in stage 14 egg chambers. The number of PN was categorized into bins of 0 PN, 1–3 PN, 4–6 PN, 7–10 PN, 11–15 PN. The percentage of stage 14 egg chambers exhibiting PN in each bin was calculated. n represents the number of egg chambers analyzed. Error bars represent the SEM, and **** represents the level of significance P < 0.0001.
Ecdysone signaling modulates NC removal. (A) Schematic diagram of NC encapsulation by 4–5 AFCs during late oogenesis (stage 11 to late stage 12). (B′–C″) Immunostained egg chambers depicting follicle cells in the act of enveloping the NCs. Stage 11 egg chambers exhibit small fingerlike projections (B′ and B″). Stage 13 egg chamber where the NC is completely enveloped by the overlying follicle cells (C′ and C″). Nuclei are shown in red, and follicle cells are marked with mCD8GFP in green. (D1–E2) Stagewise activation of ecdysone signaling in the AFCs during late oogenesis. EcRE-lacz is marked in green, and nuclei are marked in red. Stage 11 egg chamber (D1 and D2) and stage 12 egg chamber (E1 and E2). (D2and E2) are LUT images of EcRE-lacz. (F′–I″) Stage 14 egg chambers of indicated genotypes. Persisting NC nuclei are marked by a yellow arrowhead. DAPI is in red, and Armadillo is in green. Images show control (F′ and F″), EcRRNAi (G′ and G″), EcRB1DN (H′ and H″), and UspRNAi of genotype GR1-Gal4/UspRNAi (I′ and I″). (J) Quantification of persisting NC nuclei in stage 14 egg chambers of indicated genotypes. “n” stands for the number of egg chambers analyzed. (K) Alternative quantification of PN in stage 14 egg chambers. The number of PN was categorized into bins of 0 PN, 1–3 PN, 4–6 PN, 7–10 PN, 11–15 PN. The percentage of stage 14 egg chambers exhibiting PN in each bin was calculated. n represents the number of egg chambers analyzed. Error bars represent the SEM, and **** represents the level of significance P < 0.0001.

Ecdysone–Usp axis regulates NC removal. (A 1 –D 2 ) Ecdysone signaling is visualized in egg chambers: stage 10B (A1 and A2); stage 11 (B1 and B2), stage 13 (C1 and C2), late stage 13 (D1 and D2). EcRE-lacz is in green (or in LUT), and DAPI is in red. (E′–G″) Representative image of types of defects of stage 14 egg chambers when ecdysone signaling is downregulated. These are classified into 3 types: only PN (E′ and E″); mild dumping defect (F′ and F″); and dumpless or high dumping defect (G′ and G″). A bright-field image of the egg chamber is shown in the inset (G′). Egg chambers were stained with Arm in green and DAPI in red. (H) Quantification of defects of stage 14 egg chambers. Stage 14 egg chambers were categorized into bins of number of defects: PN only; mild dumping defect; and dumpless or dumping defect. n indicates the number of egg chambers analyzed. (I′ and I″) Representative image of stage 14 egg chambers. Clonal cells are marked in green (GFP) and are also overexpressing EcRRNAi. DAPI is in red. White arrowheads mark the PN in the anterior end. (J) Number of PN in stage 14 egg chambers of indicated genotypes as categorized into various bins. The percentage of stage 14 egg chambers in each bin was calculated. n indicates the number of egg chambers analyzed. (K–N) Activity of the ecdysone pathway decreases upon downmodulation of the ecdysone receptor by EcRRNAi (L–L″) and EcRB1DN (M–M″) with respect to control (K–K″) in motile border cells. Quantification of normalized EcRE-lacz in indicated genotypes (N). Border cells are marked by UAS mCD8GFP in green, EcRE-lacz in magenta, and DAPI in cyan. Border cells are encircled by a white dotted line. The mean value of normalized EcRE-lacz expression is depicted in graph. n indicates the number of egg chambers analyzed. (O1–P) Stage 14 egg chambers. Yellow arrowheads mark persisting NC nuclei. DAPI is in red, and GFP is in green. Egg chambers of genotype: slbo Gal4/UAS GFP (O1), slbo-Gal4/EcRB1DN (O2), cy2 Gal4/EcRB1DN (P). (Q) Quantification of persisting NC nuclei in stage 14 egg chambers of indicated genotypes. n indicates the number of egg chambers analyzed. The mean number of PN is provided in the graph. (R) Alternative quantification of PN. The number of PN in stage 14 egg chambers as categorized into various bins, and the percentage of stage 14 egg chambers in each bin was calculated. (S) Number of PN in stage 14 egg chambers as categorized into various bins t, and the percentage of stage 14 egg chambers in each bin was calculated. Error bars represent the SEM. ****P ≤ 0.0001 represents the level of significance.
Ecdysone–Usp axis regulates NC removal. (A 1 –D 2 ) Ecdysone signaling is visualized in egg chambers: stage 10B (A1 and A2); stage 11 (B1 and B2), stage 13 (C1 and C2), late stage 13 (D1 and D2). EcRE-lacz is in green (or in LUT), and DAPI is in red. (E′–G″) Representative image of types of defects of stage 14 egg chambers when ecdysone signaling is downregulated. These are classified into 3 types: only PN (E′ and E″); mild dumping defect (F′ and F″); and dumpless or high dumping defect (G′ and G″). A bright-field image of the egg chamber is shown in the inset (G′). Egg chambers were stained with Arm in green and DAPI in red. (H) Quantification of defects of stage 14 egg chambers. Stage 14 egg chambers were categorized into bins of number of defects: PN only; mild dumping defect; and dumpless or dumping defect. n indicates the number of egg chambers analyzed. (I′ and I″) Representative image of stage 14 egg chambers. Clonal cells are marked in green (GFP) and are also overexpressing EcRRNAi. DAPI is in red. White arrowheads mark the PN in the anterior end. (J) Number of PN in stage 14 egg chambers of indicated genotypes as categorized into various bins. The percentage of stage 14 egg chambers in each bin was calculated. n indicates the number of egg chambers analyzed. (K–N) Activity of the ecdysone pathway decreases upon downmodulation of the ecdysone receptor by EcRRNAi (L–L″) and EcRB1DN (M–M″) with respect to control (K–K″) in motile border cells. Quantification of normalized EcRE-lacz in indicated genotypes (N). Border cells are marked by UAS mCD8GFP in green, EcRE-lacz in magenta, and DAPI in cyan. Border cells are encircled by a white dotted line. The mean value of normalized EcRE-lacz expression is depicted in graph. n indicates the number of egg chambers analyzed. (O1–P) Stage 14 egg chambers. Yellow arrowheads mark persisting NC nuclei. DAPI is in red, and GFP is in green. Egg chambers of genotype: slbo Gal4/UAS GFP (O1), slbo-Gal4/EcRB1DN (O2), cy2 Gal4/EcRB1DN (P). (Q) Quantification of persisting NC nuclei in stage 14 egg chambers of indicated genotypes. n indicates the number of egg chambers analyzed. The mean number of PN is provided in the graph. (R) Alternative quantification of PN. The number of PN in stage 14 egg chambers as categorized into various bins, and the percentage of stage 14 egg chambers in each bin was calculated. (S) Number of PN in stage 14 egg chambers as categorized into various bins t, and the percentage of stage 14 egg chambers in each bin was calculated. Error bars represent the SEM. ****P ≤ 0.0001 represents the level of significance.
To test our hypothesis, we overexpressed EcR RNAi in follicle cells by the pan-follicle cell driver GR1-Gal4 to downregulate the ecdysone signaling. We also included the tubp-Gal80TS repressor in this genetic background to circumvent the early lethality associated with EcR downregulation in other tissues. We observed that the downregulation of EcR function in the follicle cells resulted in the retention of approximately nine NC nuclei in stage 14 egg chambers compared with the control (control: 0.44 ± 0.07; EcRRNAi: 9.17 ± 0.28) (Fig. 1, F′–G″ and J; and Fig. S1 J). The potency of the EcRRNAi construct was validated by measuring the intensity of EcRE-lacz in the motile border cells that overexpressed the EcRRNAi. It suggested that EcRRNAi indeed downregulates the EcR pathway (UAS Dicer II: 1 ± 0.12; UAS EcRRNAi: 0.23 ± 0.05) (Fig. S1, K–N).
Henceforth, the egg chambers wherein the EcR function is downregulated in the AFCs are referred to as EcR-depleted egg chambers. This prompted us to validate our findings through a different approach as the location of EcR in the genome precludes any kind of mutant analysis. We perturbed EcR function by overexpressing a dominant-negative (DN) construct in the follicle cells. The EcR DN construct contains a point mutation in the ligand binding domain, which arrests ecdysone signaling in a cell-autonomous manner (Cherbas et al., 2003). Similar to EcRRNAi, the overexpression of the DN construct resulted in the retention of NC nuclei in stage 14 egg chambers (UAS mCD8GFP: 0.44 ± 0.07; UAS mCherryRNAi: 0.24 ± 0.06; EcRB1DN: 9.3 ± 0.15) (Fig. 1, H′, H″, J, and K). Since the follicle cells undergo a couple of major morphogenetic changes as they mature into flat squamous epithelial cells in stage 10 egg chambers, we were curious whether the NC nucleus retention phenotype was an outcome of early morphogenetic defects. To test this, we examined the status of two major morphogenetic events during Drosophila oogenesis (Grammont, 2007; Shcherbata et al., 2004). First is the mitotic-to-endocycle switch in stage 6, followed by the cuboidal-to-squamous fate transition in stage 9–10 egg chambers (Shcherbata et al., 2004; Grammont, 2007). We have previously shown that AFCs’ mitotic-to-endocycle switch is not dependent on the ecdysone pathway (Ghosh et al., 2023, Preprint). Subsequently, we checked whether EcR depletion affects the fate transition of AFCs as they change their shape from cuboidal to squamous fate. The TGF-β pathway is activated in the AFCs as they transition from the cuboidal to squamous fate (Brigaud et al., 2015). We evaluated the status of two molecular readouts for the TGF-β pathway, dad-lacz and pMad, in EcR-depleted follicle cells. Significantly, we did not observe any change in the expression of dad-lacz nor in the levels of pMad in EcRB1DN-depleted egg chambers (Fig. S3, A1–C2). Since the EcR-depleted follicle cells express the marker for the squamous fate, we believe that the phenotype of NC nuclear retention is not an outcome of the follicle cell differentiation defect. However, we also repeated experiments with late-expressing Gal4 constructs. cy2-GAL4 and slbo-Gal4 start expressing in the AFCs in stage 8 and late-stage 10 egg chambers, respectively. When we depleted EcR function in the AFCs by cy2 and slbo-GAL4, we found almost 5–6 NC nuclei were retained in stage 14 egg chambers (slbo Gal4/UAS GFP: 0.36 ± 0.05; slbo-Gal4/EcRB1DN: 5.9 ± 0.28; cy2-Gal4/UAS mCherryRNAi: 0.22 ± 0.05; cy2-Gal4/EcRB1DN: 5.3 ± 0.39) (Fig. S1, O1–S). From these results, we exclude the possibility that the NC retention defect observed is an outcome of cell fate differentiation defect of the AFCs.
Next, we categorized the observed NC retention defects under three categories: (1) heavy dumping defect or dumpless (dorsal appendage formation is also defective) (control: 0%; EcRB1DN: 26.4%), (2) mild dumping defect (incomplete cytoplasmic transport) with persisting nuclei (PN) (control: 0%; EcRB1DN: 33.8%), and (3) only PN (control: 22%; EcRB1DN: 39%) (Fig. S1, E′–H).
To evaluate the persisting NC nuclei for all experiments, including the ones reported above with cy2-GAL4 and slbo-GAL4 driver, we considered only those stage 14 egg chambers that belonged to either the second or third category and exhibited at least four persisting NC nuclei (Fig. S1, E′–F″, U, and V). To further substantiate our finding with another driver, we randomly generated large clones of EcRRNAi in the egg chambers. We observed the retention of large nuclei abutting the EcR-depleted AFCs (n = 10 egg chambers) (Fig. S1, I′ and I″).
Next, we were curious to check whether the classical ecdysone signaling was playing a role in mediating the NC clearance. We know activation of ecdysone signaling aids the transport of EcR into the nucleus and, along with coreceptor Usp, induces several downstream target genes. We reasoned that if the canonical ecdysone pathway is indeed important for NC removal, then downregulation of Usp should also phenocopy the NC retention phenotype as observed in EcR depletion background. Indeed, it was the case as overexpression of UspRNAi in the AFCs resulted in 6–7 persisting NC nucleus stage 14 egg chambers (control: 0.25 ± 0.07; UspRNAi: 8.4 ± 0.28) (Fig. 1, I′–J and Fig. S1 J). Altogether, our data above suggest that EcR and Usp function in the AFCs aid in the removal of the NC in late oogenesis.
Downregulation of EcR function perturbs NC actin, nuclear envelope breakdown, and DNA fragmentation
NC clearance is a stepwise process aided by lysosomal vesicles being exported by the overlying AFCs into the germline NCs. This is followed by the permeabilization of the NC nuclear membrane and activation of DNA fragmentation both culminating in the removal of unnecessary cytoplasmic material (Mondragon et al., 2019). This process begins in late stage 10 when the F-actin network supporting the large polyploid NC nuclei during dumping begins to compress and permeabilize their nuclear envelope (Yalonetskaya et al., 2020). This allows access to the NC nuclear content to the lysosomal vesicles, acidifying the environment, activating cathepsins, and starting the process of nuclear envelope degradation (visualized by lamin) (Timmons et al., 2016; Mondragon et al., 2019). Previously, it has been shown that the stretched follicle cells (AFCs) maintain the F-actin network in the NCs (Timmons et al., 2016). We first tested whether the ecdysone signaling in the follicle cells modulates F-actin distribution in the NCs. We used phalloidin to label the F-actin and observed fine actin bundles in the NC nuclei of late-stage 11 egg chambers. When we downregulated ecdysone signaling in the AFCs, we observed almost negligible F-actin filaments in the adjoining NCs (Fig. 2, A and B). This observation suggests that ecdysone signaling in the follicle cells helps in the maintenance of NC F-actin, which is probably a prerequisite for initiating the NC dumping process. We also assessed the acidification status of the NCs in late-stage egg chambers. This is primarily because we know that during stages 12–13, mobile acidic vesicles exported from the follicle cells congregate around the NCs, acidifying them and rendering the environment conducive to their degradation (Fig. 2 C) (Timmons et al., 2016). When we downregulated ecdysone signaling in the follicle cells, we observed significantly less acidified NC nuclei in the stage 13 chambers. We observed ∼7% of the NCs were acidified (LysoTracker-positive) in EcR-depleted stage 13 egg chambers compared with 92% observed in the control (Fig. 2, D′–F). Based on these data, we propose that ecdysone signaling in the AFCs modulates the acidification of NCs in late-stage egg chambers. Since the acidification of NCs is critical for the fragmentation of the nuclear envelope by cysteine protease 1 (CP1), we evaluated the integrity of the NC nuclear envelope (Mondragon et al., 2019). Lamin is one of the main structural components of the nuclear envelope. When we immunostained the egg chambers with lamin antibody, we observed an intact NC nuclear envelope in the early stages of oogenesis. From stage 11 onward, the lamin staining in the NC nucleus appears perforated and it disappears by the time an egg chamber progresses to late stage 13 or early stage 14 (Fig. 2 G). Contrarily, in the EcR-depleted egg chambers, we observed the lamin staining persisted in the NC nuclear envelope even in late-stage 13 egg chambers, suggesting that the nuclear envelope was intact and did not undergo fragmentation (Fig. 2, H′–I″). We also evaluated the status of DNA fragmentation by the terminal deoxynucleotidyl transferase–mediated dUTP nick-end labeling (TUNEL) assay (Lechardeur et al., 2005). The TUNEL assay is used to label 3′-OH ends of fragmented DNA. Unlike the control NC nuclei that were TUNEL-positive in late-stage egg chambers, we failed to detect any TUNEL-positive nuclei in EcR-depleted stage 13 egg chambers (Fig. 2, J′–K″). Altogether, the results above suggest that the ecdysone signaling in the follicle cells non–cell-autonomously modulates NC F-actin organization, their acidification, nuclear envelope permeabilization, and DNA fragmentation, a prerequisite for efficient NC clearance.

Ecdysone pathway controls NC death–associated events. (A and B) Depth-coded actin distribution in the NCs of stage 11 egg chambers (upper surface in red, lower surface in cyan) in control (A) and EcRB1DN (B). (C) Schematic mechanism of NC acidification during stages 12–13. Blue dots indicate acidic vesicles. (D′–E″) Stage 13 egg chamber of indicated genotypes with NC nuclei stained with LysoTracker dye. LysoTracker is in green, and DAPI is in Red. Yellow arrowheads mark LysoTracker-positive NC nuclei in control (D′ and D″), while white arrowheads mark the absence of LysoTracker in EcRB1DN egg chamber (E′ and E″). (F) Quantification of the percentage of LysoTracker-positive NCs in stage 13 egg chambers. n indicates the number of egg chambers analyzed. (G–I″) Stage 13 egg chambers depicting the status of lamin in control (H′ and H″) and EcRB1DN (I′ and I″). Lamin is in green, and DAPI is in red. A schematic of loss of nuclear integrity in stage 13 egg chambers is shown (G). A white arrowhead indicates loss of lamin in control (H′ and H″), and a yellow arrowhead shows retention of lamin in stage 13 in EcRB1DN-overexpressing egg chambers (I′ and I″). (J′–K″) TUNEL assay for stage 13 egg chamber depicting fragmented DNA. Depletion of ecdysone signaling downmodulates DNA fragmentation. TUNEL is shown in green, and DAPI is in red. A yellow arrowhead marks TUNEL-positive nuclei (J′ and J″) in control, and the white arrowheads indicate the absence of TUNEL in EcRB1DN-overexpressing egg chambers (K′ and K″). Error bars represent the SEM, and **** represents the level of significance P < 0.0001.
Ecdysone pathway controls NC death–associated events. (A and B) Depth-coded actin distribution in the NCs of stage 11 egg chambers (upper surface in red, lower surface in cyan) in control (A) and EcRB1DN (B). (C) Schematic mechanism of NC acidification during stages 12–13. Blue dots indicate acidic vesicles. (D′–E″) Stage 13 egg chamber of indicated genotypes with NC nuclei stained with LysoTracker dye. LysoTracker is in green, and DAPI is in Red. Yellow arrowheads mark LysoTracker-positive NC nuclei in control (D′ and D″), while white arrowheads mark the absence of LysoTracker in EcRB1DN egg chamber (E′ and E″). (F) Quantification of the percentage of LysoTracker-positive NCs in stage 13 egg chambers. n indicates the number of egg chambers analyzed. (G–I″) Stage 13 egg chambers depicting the status of lamin in control (H′ and H″) and EcRB1DN (I′ and I″). Lamin is in green, and DAPI is in red. A schematic of loss of nuclear integrity in stage 13 egg chambers is shown (G). A white arrowhead indicates loss of lamin in control (H′ and H″), and a yellow arrowhead shows retention of lamin in stage 13 in EcRB1DN-overexpressing egg chambers (I′ and I″). (J′–K″) TUNEL assay for stage 13 egg chamber depicting fragmented DNA. Depletion of ecdysone signaling downmodulates DNA fragmentation. TUNEL is shown in green, and DAPI is in red. A yellow arrowhead marks TUNEL-positive nuclei (J′ and J″) in control, and the white arrowheads indicate the absence of TUNEL in EcRB1DN-overexpressing egg chambers (K′ and K″). Error bars represent the SEM, and **** represents the level of significance P < 0.0001.
Ecdysone pathway–depleted AFCs exhibit defect in engulfment of NCs in real-time analysis
Since depletion of EcR function in AFCs non–cell-autonomously perturbs the acidification and fragmentation of NCs, we were curious to examine the behavior of the AFCs in real time as it initiates the NC engulfment and their subsequent clearance. To check this, we captured the AFCs overexpressing mCD8GFP (UAS mCD8GFP driven by the pan-follicle cell driver GR1-Gal4) by live-cell imaging. We observed that the AFCs of late-stage 10B egg chambers are present on the outer surface of the NCs, while the inner surfaces of the NCs are in direct contact with each other. At this stage, the stretched AFCs seem to cover the underlying NCs superficially. As the egg chamber development progressed, around stage 11, we observed conspicuous membrane extensions from the stretched AFCs that interdigitated between two NC surfaces, something similar to what has been reported in fixed samples (Fig. 3 B1_1) (Timmons et al., 2016). By stage 12, membrane extensions from the AFCs completely surround individual NCs (Fig. 3, B1_1–B5_2 and Video 1). Since the follicle cells are quite small compared with the NCs, we checked how many AFCs are required to encapsulate a single NC before the clearance process starts. We used puckered-lacz, a reporter of the JNK pathway that specifically labels the AFCs, and we observed almost 5 puckered-positive follicle cells surrounding one NC (Fig. 3 A1). Contrary to the classical model of phagocytosis, where one cell engulfs another, here we observe a collective behavior of 4–5 AFCs is required for encapsulating each NC prior to their clearance (Fig. 3, A–A4; and Videos 2 and 3). This event has been previously described as “phagoptosis”; cell engulfing another live cell fated to die (Timmons et al., 2016).

Time-lapse imaging of stretched follicle cells invading between NCs. (A) Stage 12 egg chambers stained with F-actin in green, and DAPI marks the nuclei in white. Stretched follicle cell nuclei are marked with puc-lacz in magenta. (A1–A3) 3D rendered image of stretched follicle cell nuclei (puc-lacz in magenta) and NC nuclei. Stretched cells surround an NC. DAPI is in white, and phalloidin is in green. Yellow arrowheads marked stretched follicle cell nuclei. Yellow (in A1) and black (in A2 and A3) dotted lines encircle the same NC nuclei across the panel. White (in A1), magenta (in A2), and blue (in A3) dotted lines encircle the same stretched follicle cell nuclei across the panel. (A4) Quantification of the number of stretched follicle cells surrounding one NC nuclei. (B1_1–B5_2) Montage of control egg chambers of genotype Dicer2; GR1-Gal4, UAS mCD8GFP captured in real time. AFCs marked in white extend fingerlike projections between two adjacent NCs. DAPI marks the nuclei in cyan. Yellow arrowheads mark the follicle cell membrane (in white) interdigitating between the NCs. (C1_1–C5_2) Montage of EcR-depleted egg chambers. AFCs exhibit reduced fingerlike projections in between NCs. AFCs are marked in white. A magenta arrowhead marks very small fingerlike projections. DAPI labels the nuclei in cyan.
Time-lapse imaging of stretched follicle cells invading between NCs. (A) Stage 12 egg chambers stained with F-actin in green, and DAPI marks the nuclei in white. Stretched follicle cell nuclei are marked with puc-lacz in magenta. (A1–A3) 3D rendered image of stretched follicle cell nuclei (puc-lacz in magenta) and NC nuclei. Stretched cells surround an NC. DAPI is in white, and phalloidin is in green. Yellow arrowheads marked stretched follicle cell nuclei. Yellow (in A1) and black (in A2 and A3) dotted lines encircle the same NC nuclei across the panel. White (in A1), magenta (in A2), and blue (in A3) dotted lines encircle the same stretched follicle cell nuclei across the panel. (A4) Quantification of the number of stretched follicle cells surrounding one NC nuclei. (B1_1–B5_2) Montage of control egg chambers of genotype Dicer2; GR1-Gal4, UAS mCD8GFP captured in real time. AFCs marked in white extend fingerlike projections between two adjacent NCs. DAPI marks the nuclei in cyan. Yellow arrowheads mark the follicle cell membrane (in white) interdigitating between the NCs. (C1_1–C5_2) Montage of EcR-depleted egg chambers. AFCs exhibit reduced fingerlike projections in between NCs. AFCs are marked in white. A magenta arrowhead marks very small fingerlike projections. DAPI labels the nuclei in cyan.
Anterior stretched follicle cells engulf NCs. Time-lapse imaging of stretched follicle cells (marked by mCD8GFP in green) extending fingerlike projections leading to the encapsulation of NCs. Nuclei (in cyan) are in control. The frames were captured every 5 min using a 40X objective lens in a spinning disk confocal microscope. The speed of the movie is 15 FPS. This video corresponds to the images shown in Fig. 3, B1_1–B5_2. FPS, frames per second.
Anterior stretched follicle cells engulf NCs. Time-lapse imaging of stretched follicle cells (marked by mCD8GFP in green) extending fingerlike projections leading to the encapsulation of NCs. Nuclei (in cyan) are in control. The frames were captured every 5 min using a 40X objective lens in a spinning disk confocal microscope. The speed of the movie is 15 FPS. This video corresponds to the images shown in Fig. 3, B1_1–B5_2. FPS, frames per second.
Position of stretched follicle cells in stage 12. More than one stretched follicle cell surrounds one large NC nucleus. 3D rendered movie of puc-lacz–positive AFCs that engulf one NC nucleus. Nucleus is in white, and puc-lacz is in magenta. This video corresponds to the images shown in Fig. 3, A–A3.
Position of stretched follicle cells in stage 12. More than one stretched follicle cell surrounds one large NC nucleus. 3D rendered movie of puc-lacz–positive AFCs that engulf one NC nucleus. Nucleus is in white, and puc-lacz is in magenta. This video corresponds to the images shown in Fig. 3, A–A3.
3D rendered movie of puc-lacz–positive AFCs.puc-lacz is in magenta. This video corresponds to the images shown in Fig. 3, A–A3.
3D rendered movie of puc-lacz–positive AFCs.puc-lacz is in magenta. This video corresponds to the images shown in Fig. 3, A–A3.
In Drosophila oogenesis, exocytosis of vesicles from AFCs is required to acidify the NC nuclei. This is critical for activating the enzymes for fragmenting the DNA and triggering developmental cell death of NCs (Timmons et al., 2016; Timmons et al., 2017). As we were able to capture the dynamics of the NC clearance process in real time, we aimed to establish the temporal sequence of loss of their nuclear membrane integrity with their acidification. To achieve this, we used BB127-lacz, an enhancer trap that typically labels the NC nuclei and has been used to check the nuclear permeability of the NCs (Cooley et al., 1992; Timmons et al., 2016). During late stage 11, as NC nuclei lose their permeability, the BB127-lacz staining transitions from nuclear to cytoplasmic staining and becomes quite diffuse. When we costained with LysoTracker, we observed a loss of nuclear permeability before the uptake of LysoTracker dye by the NC nuclei (Fig. S2, A1–C3). Significantly, the EcR-depleted egg chambers that are deficient in engulfing the NC also exhibit unacidified NC nuclei, unlike those observed in the controls. This suggested that the loss of nuclear permeability is probably a prerequisite for acidification. Since the acidification of the NC nucleus occurs after they are completely covered by the AFCs, we believe that the encapsulation of the NC precedes NC acidification (Fig. S2, G1–G6 and Video 4).

NC acidification is dependent on their envelopment by the overlying AFCs. (A 1 –C 3 ) Stagewise expression pattern of BB127-lacz and LysoTracker during late oogenesis: stage 11 (A1–A3), stage 12 (B1–B3), stage 13 (C1–C3) egg chambers. White arrowheads mark the presence of BB127-lacz (in A2, B2, and C2), and yellow arrowheads mark the LysoTracker-positive NCs in stage 13 egg chambers (C3). Egg chambers were costained with LysoTracker in red, BB127-lacz in green, and DAPI in white. (D1–E2) Depletion of EcR does not induce Dcp-1 expression in stage 11 egg chambers. DAPI is in red, and Dcp-1 is in green. The merged image is shown in the inset. (F) Quantification of the number of AFCs in stage 11 egg chambers captured from the superficial layer to the midplane. n indicates the number of egg chambers analyzed. The mean number of AFC nuclei is provided in the graph. (G1–G6) Montage of control egg chambers of genotype Dicer2; GR1-Gal4, UAS mCD8GFP. AFCs marked in green by GFP are trying to surround the NCs. Acidification of NCs is indicated by the uptake of LysoTracker DYE in red. Yellow arrowheads and white arrowheads mark acidified and nonacidified NCs, respectively. (H1–H6) Montage of EcR-depleted egg chambers. AFCs exhibit a lack of envelopment of NCs. AFCs are marked by GFP in green. White arrowheads mark NCs that are either incompletely acidified or nonacidified.
NC acidification is dependent on their envelopment by the overlying AFCs. (A 1 –C 3 ) Stagewise expression pattern of BB127-lacz and LysoTracker during late oogenesis: stage 11 (A1–A3), stage 12 (B1–B3), stage 13 (C1–C3) egg chambers. White arrowheads mark the presence of BB127-lacz (in A2, B2, and C2), and yellow arrowheads mark the LysoTracker-positive NCs in stage 13 egg chambers (C3). Egg chambers were costained with LysoTracker in red, BB127-lacz in green, and DAPI in white. (D1–E2) Depletion of EcR does not induce Dcp-1 expression in stage 11 egg chambers. DAPI is in red, and Dcp-1 is in green. The merged image is shown in the inset. (F) Quantification of the number of AFCs in stage 11 egg chambers captured from the superficial layer to the midplane. n indicates the number of egg chambers analyzed. The mean number of AFC nuclei is provided in the graph. (G1–G6) Montage of control egg chambers of genotype Dicer2; GR1-Gal4, UAS mCD8GFP. AFCs marked in green by GFP are trying to surround the NCs. Acidification of NCs is indicated by the uptake of LysoTracker DYE in red. Yellow arrowheads and white arrowheads mark acidified and nonacidified NCs, respectively. (H1–H6) Montage of EcR-depleted egg chambers. AFCs exhibit a lack of envelopment of NCs. AFCs are marked by GFP in green. White arrowheads mark NCs that are either incompletely acidified or nonacidified.
Encapsulation of NC by AFCs is a prerequisite for NC acidification. Time-lapse imaging shows NC acidification marked by LysoTracker dye uptake (in red) in control. Stretched follicle cells are marked by mCD8GFP (in green). The frames were captured every 5 min using a 40X objective lens in a spinning disk confocal microscope. The speed of the movie is 15 FPS. This video corresponds to the images shown in Fig. S2 G1_6. FPS, frames per second.
Encapsulation of NC by AFCs is a prerequisite for NC acidification. Time-lapse imaging shows NC acidification marked by LysoTracker dye uptake (in red) in control. Stretched follicle cells are marked by mCD8GFP (in green). The frames were captured every 5 min using a 40X objective lens in a spinning disk confocal microscope. The speed of the movie is 15 FPS. This video corresponds to the images shown in Fig. S2 G1_6. FPS, frames per second.
Unlike the fingerlike projections observed in the control follicle cells that invade in between the NC-NC junction (Fig. 3, B1_1–B5_2 and Video 1), we did not observe significant GFP marked cellular extensions from the EcR-depleted stretched AFCs (Fig. 3, C1_1–C5_2 and Video 5). We also did not observe complete envelopment of the NC nuclei by overlying follicle cells in the EcR-depleted egg chambers. Coincidently, the acidification of the NC nuclei of the EcR-depleted egg chambers was impeded, too (Fig. S2, H1–H6 and Video 6). This suggests that ecdysone signaling in the AFCs aids the formation of membrane extensions that interdigitate between two NCs and help them to cover them so that their clearance process is initiated and efficiently executed. To cross-check whether the lack of membrane extension observed in EcR-depleted follicle cells is not due to a small number of AFCs, we immunostained the egg chambers with death caspase-1 (Dcp-1), a reporter for cells undergoing apoptosis (Song et al., 1997). Since we did not observe any difference in the expression of Dcp-1 between AFCs of stage 11–12 control and EcR-depleted egg chambers, we conclude that there is no significant cell death associated with the overexpression of EcRB1DN in the AFCs (Fig. S2, D1–E2). In addition, we counted the number of AFCs and did not observe any difference in their numbers between the control and EcRB1DN-overexpressing AFCs (Dicer II: 27.14 ± 1.1; EcRB1DN: 26.38 ± 1.0) (Fig. S2 F). The results above suggest that the downregulation of ecdysone signaling indeed impedes membrane extensions from AFCs.
Ecdysone pathway modulates the engulfment of NC nucleus. Contrary to the control, time-lapse imaging of stretched follicle cells (in green) overexpressing EcRB1DN cannot engulf the large NC nuclei (in cyan). The frames were captured every 5 min using a 40X objective lens in a spinning disk confocal microscope. The speed of the movie is 15 FPS. This video corresponds to the images shown in Fig. 3, C1_1–C5_2. FPS, frames per second.
Ecdysone pathway modulates the engulfment of NC nucleus. Contrary to the control, time-lapse imaging of stretched follicle cells (in green) overexpressing EcRB1DN cannot engulf the large NC nuclei (in cyan). The frames were captured every 5 min using a 40X objective lens in a spinning disk confocal microscope. The speed of the movie is 15 FPS. This video corresponds to the images shown in Fig. 3, C1_1–C5_2. FPS, frames per second.
Perturbation of EcR abrogates NC acidification. In EcRB1DN-overexpressing egg chambers, uptake of LysoTracker dye (in red) is abrogated. Stretched follicle cells are marked by mCD8GFP (in green). The frames were captured every 5 min using a 40X objective lens in a spinning disk confocal microscope. The speed of the movie is 15 FPS. This video corresponds to the images shown in Fig. S2 H1_6. FPS, frames per second.
Perturbation of EcR abrogates NC acidification. In EcRB1DN-overexpressing egg chambers, uptake of LysoTracker dye (in red) is abrogated. Stretched follicle cells are marked by mCD8GFP (in green). The frames were captured every 5 min using a 40X objective lens in a spinning disk confocal microscope. The speed of the movie is 15 FPS. This video corresponds to the images shown in Fig. S2 H1_6. FPS, frames per second.
Altogether, our data suggest that invasion and encapsulation events by the AFCs are essential for initiating the sequential molecular steps associated with NC clearance, which include their acidification and DNA fragmentation. In the context of the results above, we were curious how ecdysone signaling aids the AFCs in enveloping and clearing the NCs in late oogenesis.
Phagocytic receptors contribute to NC death
We know that the cellular microenvironment balances the number of viable cells in any context to maintain tissue homeostasis. In the process of eliminating cells that are superfluous or damaged, the tissue undergoes programmed cell death. Subsequently, the dead cellular material is cleared by the phagocytic cells. The phagocytic behavior of glial cells of the brain and the macrophages in the circulatory fluid is pretty conspicuous and well-studied (Shklyar et al., 2014; Wood and Martin, 2017). Aside from professional phagocytes, there are instances where some epithelial or mesenchymal cells acquire phagocytic fate in the metazoans to clear damaged, unwarranted cells (Shklover et al., 2015). Our live imaging data suggested that epithelial follicle cells engulf and clear the NCs that are no longer required in late oogenesis (Fig. 3, B1_1–B5_1). Since the stretched AFCs exhibit macrophage-like behavior, we checked whether these cells indeed acquire the phagocytic fate. We examined the status of some of the molecular markers of Drosophila macrophages (hemocytes) such as Croquemort (Crq, homolog of CD36) and Serpent (Srp, GATA factor). Crq is a scavenger receptor that aids the hemocytes in clearing the apoptotic cells and facilitates dendritic pruning by the glial cells (Franc and Dimarcq, 1996). Srp is a transcription factor required for the development of mesodermal structures, including the hemocytes (Rehorn et al., 1996; Riechmann et al., 1998; Lebestky et al., 2000; Holz et al., 2003). Interestingly, Serpent is expressed in the nuclei of follicle cells (Lepesant et al., 2020). Since Srp regulates the expression of Crq, we checked whether Crq is expressed in the Drosophila egg chambers. We examined the expression of crq-Gal4 and observed that in stage 10 egg chambers, it is indeed expressed in a small subset of AFCs, which are in direct contact with NCs (Fig. 4 A). By stage 13, Crq expression is detected in all the AFCs that envelop the NCs (Fig. 4, B and C). Since molecular markers of phagocytic fate Crq and Srp are activated in the AFCs, we were curious whether they had any role in NC clearance. We downregulated Srp function in the follicle cells by three independent RNAi constructs and observed ∼6 NC nuclei persisted in stage 14 egg chambers compared with the control (control: 0.21 ± 0.04; SrpRNAi_1: 7.0 ± 0.13; SrpRNAi_2: 7.22 ± 0.14; SrpRNAi_3: 5.88 ± 0.22) (Fig. 4, D′–E″ and I; and Fig. S3 D). While this work was under review, Serpent was recently shown to affect NC clearance (Zeng et al., 2025). Staining with LysoTracker dye revealed a significant reduction in the number of acidified NCs compared with the control egg chambers (Fig. S3, E′–G) (control: 90.2 ± 3.14%; SrpRNAi: 46.5 ± 5.0%).

Transition from epithelial to nonprofessional phagocyte helps to remove NCs. (A–C) Expression pattern of crq-Gal4 during different stages of oogenesis: stage 10 (A), stage late 11 (B), and stage 13 (C). Note: UAS mCD8GFP is driven by crq-Gal4 (in magenta). DAPI marks the nuclei in white. (D′–H″) Representative images of stage 14 egg chambers of indicated genotypes in control (D′ and D″), SrpRNAi (E′ and E″), DrprRNAi (F′ and F″), CrqRNAi (G′ and G″), and CrqRNAi_2 (H′ and H″). Yellow arrowheads mark persisting NC nuclei. (I) Quantification of persisting NC nuclei in stage 14 egg chambers of indicated genotypes. (I)n indicates the number of egg chambers analyzed. The mean of PN of indicated genotypes is mentioned in the graph. (J) Quantification of the number of PN for indicated genotypes. Stage 14 egg chambers were categorized into three groups: 0 PN (without defect), 1–2 PN (mild defect), and PN ≥ 3 (defective egg chambers), and the percentage of stage 14 egg chambers in each bin was calculated. n indicates the number of egg chambers analyzed. (K) Quantification of persisting NC nuclei in stage 14 egg chambers of indicated genotypes. The mean of PN of indicated genotypes is mentioned in the graph. Error bars represent the SEM. ****P ≤ 0.0001, ***P ≤ 0.001, **P ≤ 0.001 represent the level of significance.
Transition from epithelial to nonprofessional phagocyte helps to remove NCs. (A–C) Expression pattern of crq-Gal4 during different stages of oogenesis: stage 10 (A), stage late 11 (B), and stage 13 (C). Note: UAS mCD8GFP is driven by crq-Gal4 (in magenta). DAPI marks the nuclei in white. (D′–H″) Representative images of stage 14 egg chambers of indicated genotypes in control (D′ and D″), SrpRNAi (E′ and E″), DrprRNAi (F′ and F″), CrqRNAi (G′ and G″), and CrqRNAi_2 (H′ and H″). Yellow arrowheads mark persisting NC nuclei. (I) Quantification of persisting NC nuclei in stage 14 egg chambers of indicated genotypes. (I)n indicates the number of egg chambers analyzed. The mean of PN of indicated genotypes is mentioned in the graph. (J) Quantification of the number of PN for indicated genotypes. Stage 14 egg chambers were categorized into three groups: 0 PN (without defect), 1–2 PN (mild defect), and PN ≥ 3 (defective egg chambers), and the percentage of stage 14 egg chambers in each bin was calculated. n indicates the number of egg chambers analyzed. (K) Quantification of persisting NC nuclei in stage 14 egg chambers of indicated genotypes. The mean of PN of indicated genotypes is mentioned in the graph. Error bars represent the SEM. ****P ≤ 0.0001, ***P ≤ 0.001, **P ≤ 0.001 represent the level of significance.
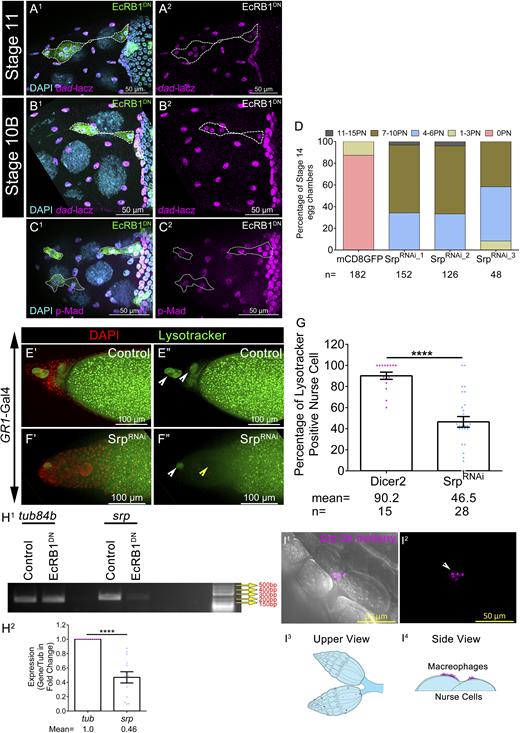
Serpent regulates NC removal and acidification. (A1–B2) Status of dad-lacz in clonal cells of EcRB1DN and nonclonal control cells in stage 11 (A1 and A2) and stage 10B (B1 and B2). Clonal cells are marked by mCD8GFP in green. Egg chambers are stained with anti-βGAL in magenta and DAPI in cyan. Cloned cells are marked by mCD8GFP in green and encircled by a white dotted line. (C1 and C2) Status of pMad in clonal cells of EcRB1DN and nonclonal control cells in stage 10B. Clonal cells are marked by mCD8GFP in green. Egg chambers are stained with anti-pMad in magenta and DAPI in cyan. Clonal cells are encircled by a white dotted line. (D) Number of PN in stage 14 egg chamber of indicated genotypes as categorized into bins. The percentage of stage 14 egg chambers in each bin was calculated. n indicates the number of egg chambers analyzed. (E′–G) Status of acidified nuclei in control (E′ and E″) and in SrpRNAi (F′ and F″). LysoTracker is in green and DAPI is in red. Yellow arrowheads mark acidified nuclei, and white arrowheads mark nonacidified nuclei. Quantification of the percentage of LysoTracker-positive NC nuclei in control and SrpRNAi (G). n indicates the number of egg chambers analyzed and the mean percentage of LysoTracker-positive nuclei in stage 13 egg chambers of indicated genotypes. (H1and H2) EcRB1DN exhibits reduced levels of Srp transcripts; tub84b is the loading control. Quantification of the Srp transcripts in the EcRB1DN-overexpressing egg chambers with respect to the control. (I1–I4)srp3X-mCherry marks circulatory macrophages in magenta. Macrophages are present outside the ovarian sheath (I1 and I2). White arrowhead marks the Srp-positive small macrophages. Schematic diagram of ovary and macrophages in magenta: top view (I3) and side view (I4). Error bars represent the SEM. ****P ≤ 0.0001 represents the level of significance. Source data are available for this figure: SourceData FS3.
Serpent regulates NC removal and acidification. (A1–B2) Status of dad-lacz in clonal cells of EcRB1DN and nonclonal control cells in stage 11 (A1 and A2) and stage 10B (B1 and B2). Clonal cells are marked by mCD8GFP in green. Egg chambers are stained with anti-βGAL in magenta and DAPI in cyan. Cloned cells are marked by mCD8GFP in green and encircled by a white dotted line. (C1 and C2) Status of pMad in clonal cells of EcRB1DN and nonclonal control cells in stage 10B. Clonal cells are marked by mCD8GFP in green. Egg chambers are stained with anti-pMad in magenta and DAPI in cyan. Clonal cells are encircled by a white dotted line. (D) Number of PN in stage 14 egg chamber of indicated genotypes as categorized into bins. The percentage of stage 14 egg chambers in each bin was calculated. n indicates the number of egg chambers analyzed. (E′–G) Status of acidified nuclei in control (E′ and E″) and in SrpRNAi (F′ and F″). LysoTracker is in green and DAPI is in red. Yellow arrowheads mark acidified nuclei, and white arrowheads mark nonacidified nuclei. Quantification of the percentage of LysoTracker-positive NC nuclei in control and SrpRNAi (G). n indicates the number of egg chambers analyzed and the mean percentage of LysoTracker-positive nuclei in stage 13 egg chambers of indicated genotypes. (H1and H2) EcRB1DN exhibits reduced levels of Srp transcripts; tub84b is the loading control. Quantification of the Srp transcripts in the EcRB1DN-overexpressing egg chambers with respect to the control. (I1–I4)srp3X-mCherry marks circulatory macrophages in magenta. Macrophages are present outside the ovarian sheath (I1 and I2). White arrowhead marks the Srp-positive small macrophages. Schematic diagram of ovary and macrophages in magenta: top view (I3) and side view (I4). Error bars represent the SEM. ****P ≤ 0.0001 represents the level of significance. Source data are available for this figure: SourceData FS3.
Similarly, the downregulation of Crq function in the follicle cells, too, resulted in the retention of at least three NC nuclei in stage 14 egg chambers (control: 16.85%; CrqRNAi: 55.15 %) (Fig. 4, J and K). This suggests that the function of the phagocytic genes, Crq and Srp, is required in the AFCs for NC clearance. This is similar to Draper, a transmembrane receptor that has been shown to function in the AFCs for NC clearance (Timmons et al., 2016).
We know that ecdysone is required for the motility and phagocytic ability of pupal hemocytes during metamorphosis (Regan et al., 2013). We carried out KEGG analysis for the apoptosis-related genes identified in the microarray analysis on EcR-depleted hemocytes (Fig. S4, A and E; and Table S2) (Regan et al., 2013). Our gene ontology (GO) enrichment analysis further identified 20 GO terms linked to cellular processes associated with engulfment and death (Fig. S4 E). We narrowed down to 398 genes that are directly or indirectly associated with cell death (Table S3). Further analysis of these genes using the STRING database demonstrated that 55 genes are involved in processes related to apoptotic cell engulfment and clearance of apoptotic cells, or are modulators of the JNK cascade, effectors of the innate immune response, or regulators of apoptosis (Fig. S4, B and C; and Table S4). From this subset, we shortlisted 17 genes that were specifically associated with the GO terms for apoptotic cell engulfment (GO:0043652), cell clearance (GO:0043277), and mediators of apoptotic processes (GO:0006915). Notably, the genes crq, eiger, and Mekk1 (mitogen-activated protein kinase kinase kinase) were common across all three GO domains (Fig. S4 D and Table S4). Altogether, our in silico analysis suggested that the ecdysone pathway likely exerts an influence on the organization of the cytoskeleton, which may directly or indirectly impact the process of phagocytosis (Fig. S4 E).

KEGG and GO analysis of downregulated genes in EcRB1 DN macrophages during larval and pupal stages. (A) KEGG analysis of downregulated genes upon expression of DN EcR in pupal macrophages. (B) STRING analysis of genes that are affected by EcRB1DN. Genes are directly related to cell death processes. (C) Fold changes of upregulated genes during larval and pupal transition in macrophages and downregulated genes in control and EcRB1DN pupal macrophage. Genes are related to cell death, JNK pathway, efferocytosis, and cytoskeleton rearrangement. Data are adapted from the Regan et. al. (2013) microarray data. (D) Venn diagram of three GO groups: apoptotic cell engulfment (GO:0043652), cell clearance (GO:0043277), and apoptotic processes (GO:0006915). (E) List of GO groups related to cell death and are affected by EcRB1DN
KEGG and GO analysis of downregulated genes in EcRB1 DN macrophages during larval and pupal stages. (A) KEGG analysis of downregulated genes upon expression of DN EcR in pupal macrophages. (B) STRING analysis of genes that are affected by EcRB1DN. Genes are directly related to cell death processes. (C) Fold changes of upregulated genes during larval and pupal transition in macrophages and downregulated genes in control and EcRB1DN pupal macrophage. Genes are related to cell death, JNK pathway, efferocytosis, and cytoskeleton rearrangement. Data are adapted from the Regan et. al. (2013) microarray data. (D) Venn diagram of three GO groups: apoptotic cell engulfment (GO:0043652), cell clearance (GO:0043277), and apoptotic processes (GO:0006915). (E) List of GO groups related to cell death and are affected by EcRB1DN
The activation of specific receptors present on the surface of the hemocytes often triggers phagocytosis. After ligand interaction, these phagocytic receptors facilitate downstream signaling that stimulates engulfment and uptake of the cellular material. Notably, quite a few of the engulfment-associated receptors like Draper, Crq, PGRP-LC, Nimc4 are altered in EcR-depleted pupal hemocytes (Regan et al., 2013; Awasaki et al., 2006). To check whether some of these phagocytic receptors do have a role in the follicle cells to clear NCs, we shortlisted 12 genes based on their predicted phagocytic function and particularly focused on those that either function as a scavenger or phagocytic receptors (Crq, NimC1, and Eater) or mark the targets for phagocytosis (such as Tep4) or are immune receptors recognizing various kinds of peptidoglycans (Melcarne et al., 2019). In this list, we added the transmembrane phagocytic receptor Draper, which is expressed in the follicle cells and has an established role in aiding the clearance of NCs (Timmons et al., 2016). We downregulated the function of these 12 genes (Table S1) by driving specific RNAi constructs for each gene with pan-follicle cell Gal4 driver GR1 and evaluated the number of persisting NC nuclei in stage 14 egg chambers. We observed 8 NC nuclei persisting in stage 14 egg chambers when Drpr function was downregulated in the AFCs compared with 1 observed in the control population. In addition, we observed downregulation of Crq, NimC1, Eater, Tep4, and PGRP-LC resulted in significant NC nucleus retention in stage 14 egg chambers (Fig. 4, F′–H″, J, and K; and Fig. S5, A–G). Altogether, our results suggest that quite a few phagocytic genes that function in the classical hemocytes play a role in assisting the AFCs in clearing unwarranted NCs in late-stage egg chambers. This suggests that AFCs may acquire nonprofessional phagocytic fate in late-stage egg chambers to clear the superfluous germline NCs.

Ecdysone regulates Eip93F and JNK signaling in the AFCs. (A–E) Representative image of stage 14 egg chambers of indicated genotypes. Egg chambers are stained with DAPI in red. A yellow arrowhead marks the PN in the anterior end. (F and G) Downregulation of phagocytic receptors by RNAi using GR1-Gal4. Quantification of persisting NC nuclei in stage 14 egg chambers of indicated genotypes. n indicates the number of egg chambers analyzed (F). The number of PN in stage 14 egg chamber was categorized into bins (G). The percentage of stage 14 egg chambers in each bin was calculated. n indicates the number of egg chambers analyzed. Please note that these phagocytic receptors probably do not have a significant role in NC clearance in late oogenesis. (H) Number of PN in stage 14 egg chamber of indicated genotypes was categorized into bins. The percentage of stage 14 egg chambers in each bin was calculated. (I1–J3) Ecdysone modulates the JNK pathway. The status of puc-lacz is in green in control (I1–I3) and EcRB1DN (J1–J3). DAPI is in red. (K) Quantification of normalized puc-lacz expression in control and EcRB1DN. (L1and L2) EcRB1DN exhibits reduced levels of Eip93F transcripts; tub84b is the loading control. Quantification of the Eip93F transcripts in the EcRB1DN-overexpressing egg chambers with respect to the control. (M) Number of PN in stage 14 egg chamber of indicated genotypes was categorized into bins, and the percentage of stage 14 egg chambers in each bin is listed. (N) Number of PN in stage 14 egg chamber of indicated genotypes was categorized into bins, and the percentage of stage 14 egg chambers in each bin is listed. n indicates the number of egg chambers analyzed. Error bars represent the SEM. ****P ≤ 0.0001, **P ≤ 0.001, ns = nonsignificant represent the level of significance.
Ecdysone regulates Eip93F and JNK signaling in the AFCs. (A–E) Representative image of stage 14 egg chambers of indicated genotypes. Egg chambers are stained with DAPI in red. A yellow arrowhead marks the PN in the anterior end. (F and G) Downregulation of phagocytic receptors by RNAi using GR1-Gal4. Quantification of persisting NC nuclei in stage 14 egg chambers of indicated genotypes. n indicates the number of egg chambers analyzed (F). The number of PN in stage 14 egg chamber was categorized into bins (G). The percentage of stage 14 egg chambers in each bin was calculated. n indicates the number of egg chambers analyzed. Please note that these phagocytic receptors probably do not have a significant role in NC clearance in late oogenesis. (H) Number of PN in stage 14 egg chamber of indicated genotypes was categorized into bins. The percentage of stage 14 egg chambers in each bin was calculated. (I1–J3) Ecdysone modulates the JNK pathway. The status of puc-lacz is in green in control (I1–I3) and EcRB1DN (J1–J3). DAPI is in red. (K) Quantification of normalized puc-lacz expression in control and EcRB1DN. (L1and L2) EcRB1DN exhibits reduced levels of Eip93F transcripts; tub84b is the loading control. Quantification of the Eip93F transcripts in the EcRB1DN-overexpressing egg chambers with respect to the control. (M) Number of PN in stage 14 egg chamber of indicated genotypes was categorized into bins, and the percentage of stage 14 egg chambers in each bin is listed. (N) Number of PN in stage 14 egg chamber of indicated genotypes was categorized into bins, and the percentage of stage 14 egg chambers in each bin is listed. n indicates the number of egg chambers analyzed. Error bars represent the SEM. ****P ≤ 0.0001, **P ≤ 0.001, ns = nonsignificant represent the level of significance.
Ecdysone regulates the expression of phagocytic receptors: Drpr and Crq
Previously, it was shown that ecdysone signaling modulates Crq expression under both in vivo (in plasmatocytes) and in vitro (l[2]mbn cell lines) conditions (Regan et al., 2013; Manaka et al., 2004). In addition, the genes shortlisted above (except for Drpr) were identified as targets of ecdysone in a microarray experiment conducted on the hemocytes (Shklover et al., 2015). Thus, we were curious to check whether these genes were also under EcR modulation in the AFCs. Based on the severity of the phenotype induced by DrprRNAi and CrqRNAi, we compared the transcript levels of these 2 genes (drpr, crq) between control and EcR-depleted egg chambers. We observed both drpr and crq transcripts were almost 0.6-fold lower in the EcR-depleted egg chambers compared with that observed in the controls (tub84b: 1.0; drpr: 0.59 ± 0.01, P = 0.0017; crq: 0.64 ± 0.01, P = 0.0012) (Fig. 5, A and B). We also observed lower levels of the Drpr protein in the follicle cells of EcR-depleted egg chambers (Dicer II: 633.8 ± 70.29 A.U.; EcRB1DN: 241.3 ± 67.71 A.U.) (Fig. 5, C1–E). On another note, we also found that srp transcripts were almost 0.5-fold lower in EcRB1DN background than that observed in the controls, suggesting ecdysone regulates the Srp expression in the egg chambers too (Fig. S3, H1 and H2) (tub84b: 1.0; srp: 0.46 ± 0.07). Strikingly, Srp mediates the loss of polarity of epithelial cells and is considered a marker for epithelial-to-mesenchymal transition (EMT) in development. Thus, our result suggests that EcR modulates the EMT of the AFCs to facilitate acquisition of phagocytic fate.
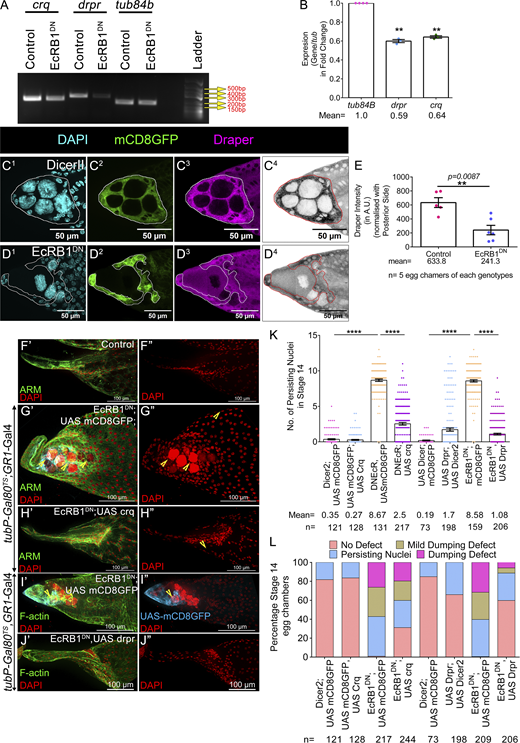
Ecdysone pathway regulates the expression of Draper and Croquemort to facilitate NC removal. (A and B) EcRB1DN exhibits reduced Crq and Drpr expression; tub84b is the loading control. Quantification of the transcripts in the EcRDN-overexpressing egg chambers with respect to the control. (C1–D4) Ecdysone modulates Drpr expression in late-stage 12 egg chambers. Draper is in magenta (C3 and D3) or LUT (C4 and D4), and DAPI is in cyan (C1 and D1). The AFC membrane is marked by mCD8GFP in green (C2 and D2). AFCs are encircled by a white line (C1–C3 and D1–D3) and by a red line (in C4 and D4). (E) Quantification of Draper in control and EcRB1DN. Draper staining in the AFCs is normalized to the background staining of posterior follicle cells. Please note the Draper is lower in EcRDN-overexpressing egg chambers. (F′–J″) Overexpression of Crq and Drpr individually rescues NC clearance defect exhibited by EcRB1DN-overexpressing egg chambers. Yellow arrowheads mark PN. Representative image of stage 14 egg chambers of the indicated genotypes in control (F′ and F″), EcRB1DN; UAS mCD8GFP (G′, G″, I′, and I″), EcRB1DN; UAS CrqHA (H′ and H″), and EcRB1DN; UAS Drpr (J′ and J″). Egg chambers were stained for Arm or F-actin in green, and DAPI is in red. (K) Quantification of persisting NC nuclei in stage 14 egg chambers of indicated genotypes. The mean number of PN for each genotype is represented. (L) Number of PN in stage 14 egg chamber of indicated genotypes as categorized into bins of 0 PN, 1–3 PN, 4–6 PN, 7–10 PN, 11–15 PN, and the percentage of stage 14 egg chambers in each bin is depicted. Error bars represent the SEM. ****P ≤ 0.0001, **P ≤ 0.001 represent the level of significance. Source data are available for this figure: SourceData F5.
Ecdysone pathway regulates the expression of Draper and Croquemort to facilitate NC removal. (A and B) EcRB1DN exhibits reduced Crq and Drpr expression; tub84b is the loading control. Quantification of the transcripts in the EcRDN-overexpressing egg chambers with respect to the control. (C1–D4) Ecdysone modulates Drpr expression in late-stage 12 egg chambers. Draper is in magenta (C3 and D3) or LUT (C4 and D4), and DAPI is in cyan (C1 and D1). The AFC membrane is marked by mCD8GFP in green (C2 and D2). AFCs are encircled by a white line (C1–C3 and D1–D3) and by a red line (in C4 and D4). (E) Quantification of Draper in control and EcRB1DN. Draper staining in the AFCs is normalized to the background staining of posterior follicle cells. Please note the Draper is lower in EcRDN-overexpressing egg chambers. (F′–J″) Overexpression of Crq and Drpr individually rescues NC clearance defect exhibited by EcRB1DN-overexpressing egg chambers. Yellow arrowheads mark PN. Representative image of stage 14 egg chambers of the indicated genotypes in control (F′ and F″), EcRB1DN; UAS mCD8GFP (G′, G″, I′, and I″), EcRB1DN; UAS CrqHA (H′ and H″), and EcRB1DN; UAS Drpr (J′ and J″). Egg chambers were stained for Arm or F-actin in green, and DAPI is in red. (K) Quantification of persisting NC nuclei in stage 14 egg chambers of indicated genotypes. The mean number of PN for each genotype is represented. (L) Number of PN in stage 14 egg chamber of indicated genotypes as categorized into bins of 0 PN, 1–3 PN, 4–6 PN, 7–10 PN, 11–15 PN, and the percentage of stage 14 egg chambers in each bin is depicted. Error bars represent the SEM. ****P ≤ 0.0001, **P ≤ 0.001 represent the level of significance. Source data are available for this figure: SourceData F5.
Given that the levels of Drpr and Crq were lower in the EcRB1DN background, we were curious whether they were indeed the limiting factor impeding NC clearance in late-stage egg chambers. We co-expressed Drpr and Crq individually with EcRB1DN in the follicle cells to check whether they rescued the NC clearance defect observed in the EcR-depleted egg chambers. Our premise was that if they are indeed the limiting factor, increasing their levels in the EcR-depleted follicle cells will be sufficient to rescue the NC clearance defect. Indeed, it was the case, as the overexpression of either Crq or Drpr-I in the EcR-depleted follicle cells rescued the NC retention defects in late oogenesis (control: 0.35 ± 0.07; UAS Crq-HA: 0.27 ± 0.06; EcRB1DN: 8.6 ± 0.16; EcRB1DN; UAS Crq: 2.5 ± 0.17; control: 0.19 ± 0.05; UAS Drpr: 1.7 ± 0.22; EcRB1DN: 8.5 ± 0.15; EcRB1DN, UAS Drpr: 1.08 ± 0.12) (Fig. 5, F′–L and Fig. S5 H). This suggests that EcR modulates the levels of the phagocytic genes, Drpr and Crq, in the AFCs to facilitate the clearance of NCs in late oogenesis. We also observed that the overexpression of Drpr in the wild-type follicle cells in stage 8 egg chambers mediates precocious NC death, as reported earlier (Etchegaray et al., 2012). Moreover, we observed stronger rescue of the NC cell retention defect when Drpr was overexpressed compared with that observed for the overexpression of Crq. This suggests that Drpr may perform a dominant role in NC clearance than Crq in developing eggs. The previous reports show that the JNK pathway positively regulates Drpr (Timmons et al., 2016). So, we sought to check the status of the JNK signaling in the EcRB1DN background during late oogenesis. We evaluated the expression of the JNK reporter construct puckered-lacz (puc-lacz) in the AFCs. Puckered is expressed in stretched follicle cells only after stage 10B, which helps them to engulf NCs between stages 12 and 13 (Timmons et al., 2016). In the EcRB1DN background, we observed a lower level of puc-lacz in the follicle cells compared with the control (Dicer II: 9.2 ± 0.4 A.U; EcRB1DN: 4.0 ± 0.42 A.U) (Fig. S5, I1–K). Altogether, our results suggest that Crq and Drpr have crucial roles in NC clearance, with Drpr playing a dominant role compared with Crq. Interestingly, both of these receptors are transcriptionally regulated by the ecdysone signaling.
Ecdysone modulates Draper and Croquemort expression through Eip93F
As the ecdysone pathway regulates Crq and Drpr expression at the transcriptional level, we were curious how EcR can modulate their expression in the AFCs. Of all the early downstream transcription factors activated by EcR, we focused on Eip93F, which is highly enriched in the stretched follicle cells as reported in the single-cell transcriptomics analysis and is one of the downstream molecules that help in hemocyte activity (Fig. S4, B and C) (Jevitt et al., 2020). We evaluated the levels of Eip93F transcripts in Drosophila oogenesis and found it to be almost threefold lower in the EcR-depleted egg chambers compared with that observed in the controls (tub84b: 1.0; eip93F: 0.29 ± 0.08) (Fig. S5, L1 and L2), suggesting the Eip93F transcription is modulated by EcR in the developing egg chambers. To further validate this finding, we immunostained the egg chambers to check the expression pattern of Eip93F in Drosophila oogenesis (Uyehara et al., 2017). We observed that the Eip93F protein is nuclear in the AFCs of stage 11–13 egg chambers (Fig. 6, A1–D3). Next, we were curious to check whether Eip93F expression in the AFC is under EcR regulation. So, when we immunostained the stage 11–12 egg chambers, we failed to detect any nuclear signal of Eip93F in the AFC-overexpressing EcRB1DN (Fig. 6, E1–H3). These data suggest that EcR modulates the expression of the Eip93F transcription factor in the AFCs of the developing egg chambers. We wondered whether this signaling axis in AFCs was indeed important for NC clearance in late oogenesis. To check this, we downregulated Eip93F function by driving Eip93FRNAi by GR1-Gal4 and observed 4–5 NC nuclei persisting in stage 14 egg chambers, supporting the fact that Eip93F does have a role in NC removal in late-stage egg chambers (control: 0.45 ± 0.10; Eip93FRNAi: 5.08 ± 0.26; Eip93FRNAi_R2: 3.6 ± 0.24) (Fig. 6, I′–L).
![Ecdysone pathway facilitates NC removal through Eip93F (E93). (A1–D3) Expression of Eip93F during different stages of late oogenesis: stage 10 (A1–A3), stage 11 (B1–B3), stage 12 (C1–C3), stage 13 (D1–D3). The expression of Eip93F starts after stage 11 only in the AFCs. White and magenta arrowheads mark AFC nuclei that express Eip93F. Eip93F is in green, and DAPI is in red. (E1–H3) Ecdysone modulates Eip93 expression in late-stage egg chambers. Eip93F is in green, and DAPI is in red. A white arrowhead marks the presence of Eip93F in Dicer II (stage 11 [E1–E3] and stage 12 [G1–G3]) or in EcRB1DN-overexpressing egg chambers (stage 11 [F1–F3] and stage 12 [H1–H3]); red arrowhead marks the absence of Eip93F in EcRB1DN. A magenta arrowhead marks the position of nuclei in the egg chambers. (I′–J″) Eip93F function in the follicle cell mediates NC removal. Representative image of stage 14 egg chambers of control (I′ and I″) and Eip93RNAi (J′ and J″). Egg chambers were stained with DAPI in red and Armadillo in green. (K and L) Quantification of persisting NC nuclei in stage 14 egg chambers of indicated genotypes. n indicates the number of egg chambers analyzed. The mean number of PN is provided in the graph. (K) Alternative quantification of PN. The number of PN in stage 14 egg chambers was categorized into various bins of 0 PN, 1–3 PN, 4–6 PN, 7–10 PN, 11–15 PN, and the percentage of stage 14 egg chambers in each bin was calculated (L). (M′–P″) Representative image of stage 14 egg chambers stained with Armadillo is in green and DAPI is in red. The overexpression of Eip93F in EcRDN background rescues the clearance defect of NC nuclei in stage 14 egg chambers. A yellow arrowhead indicates PN in stage 14 egg chambers. (Q) Quantification of persisting NC nuclei in stage 14 of indicated genotypes. Error bars represent the SEM. ****P ≤ 0.0001 represent the level of significance.](https://cdn.rupress.org/rup/content_public/journal/jcb/224/8/10.1083_jcb.202411073/1/m_jcb_202411073_fig6.png?Expires=1768146444&Signature=AcY~06kYY6hH4tptVtYci0bCFqgyRomXy~wWFRIBWoNiBteJFGtXW-VCg5ijSgs-Ht1ROBDKwoKaUywz9YVZQrub96lLiplT9HLHnlOgfs-4eIjQHoKEsw~N0myfCX1NQqA8UEezwTDatcf1VJvHixjBPihAtoVAjULd6z~h7sJb66aW~EhAtxBcsojV03mL28T73Ts-5iLYk5sHMWdVInFUAu-SHHidpm4ixQ2LkKq5aiNOQ6Zz5CsYukWCU2-xFAGF5TyHStbrHbqRhztLwxJkGs~sc0QAVKDz7Er3HT5RVZMClp9h6CcR2fyA4Ny2ydxDnMe~jBVpXITGHkdAsg__&Key-Pair-Id=APKAIE5G5CRDK6RD3PGA)
Ecdysone pathway facilitates NC removal through Eip93F (E93). (A 1 –D 3 ) Expression of Eip93F during different stages of late oogenesis: stage 10 (A1–A3), stage 11 (B1–B3), stage 12 (C1–C3), stage 13 (D1–D3). The expression of Eip93F starts after stage 11 only in the AFCs. White and magenta arrowheads mark AFC nuclei that express Eip93F. Eip93F is in green, and DAPI is in red. (E1–H3) Ecdysone modulates Eip93 expression in late-stage egg chambers. Eip93F is in green, and DAPI is in red. A white arrowhead marks the presence of Eip93F in Dicer II (stage 11 [E1–E3] and stage 12 [G1–G3]) or in EcRB1DN-overexpressing egg chambers (stage 11 [F1–F3] and stage 12 [H1–H3]); red arrowhead marks the absence of Eip93F in EcRB1DN. A magenta arrowhead marks the position of nuclei in the egg chambers. (I′–J″) Eip93F function in the follicle cell mediates NC removal. Representative image of stage 14 egg chambers of control (I′ and I″) and Eip93RNAi (J′ and J″). Egg chambers were stained with DAPI in red and Armadillo in green. (K and L) Quantification of persisting NC nuclei in stage 14 egg chambers of indicated genotypes. n indicates the number of egg chambers analyzed. The mean number of PN is provided in the graph. (K) Alternative quantification of PN. The number of PN in stage 14 egg chambers was categorized into various bins of 0 PN, 1–3 PN, 4–6 PN, 7–10 PN, 11–15 PN, and the percentage of stage 14 egg chambers in each bin was calculated (L). (M′–P″) Representative image of stage 14 egg chambers stained with Armadillo is in green and DAPI is in red. The overexpression of Eip93F in EcRDN background rescues the clearance defect of NC nuclei in stage 14 egg chambers. A yellow arrowhead indicates PN in stage 14 egg chambers. (Q) Quantification of persisting NC nuclei in stage 14 of indicated genotypes. Error bars represent the SEM. ****P ≤ 0.0001 represent the level of significance.
Ecdysone pathway facilitates NC removal through Eip93F (E93). (A 1 –D 3 ) Expression of Eip93F during different stages of late oogenesis: stage 10 (A1–A3), stage 11 (B1–B3), stage 12 (C1–C3), stage 13 (D1–D3). The expression of Eip93F starts after stage 11 only in the AFCs. White and magenta arrowheads mark AFC nuclei that express Eip93F. Eip93F is in green, and DAPI is in red. (E1–H3) Ecdysone modulates Eip93 expression in late-stage egg chambers. Eip93F is in green, and DAPI is in red. A white arrowhead marks the presence of Eip93F in Dicer II (stage 11 [E1–E3] and stage 12 [G1–G3]) or in EcRB1DN-overexpressing egg chambers (stage 11 [F1–F3] and stage 12 [H1–H3]); red arrowhead marks the absence of Eip93F in EcRB1DN. A magenta arrowhead marks the position of nuclei in the egg chambers. (I′–J″) Eip93F function in the follicle cell mediates NC removal. Representative image of stage 14 egg chambers of control (I′ and I″) and Eip93RNAi (J′ and J″). Egg chambers were stained with DAPI in red and Armadillo in green. (K and L) Quantification of persisting NC nuclei in stage 14 egg chambers of indicated genotypes. n indicates the number of egg chambers analyzed. The mean number of PN is provided in the graph. (K) Alternative quantification of PN. The number of PN in stage 14 egg chambers was categorized into various bins of 0 PN, 1–3 PN, 4–6 PN, 7–10 PN, 11–15 PN, and the percentage of stage 14 egg chambers in each bin was calculated (L). (M′–P″) Representative image of stage 14 egg chambers stained with Armadillo is in green and DAPI is in red. The overexpression of Eip93F in EcRDN background rescues the clearance defect of NC nuclei in stage 14 egg chambers. A yellow arrowhead indicates PN in stage 14 egg chambers. (Q) Quantification of persisting NC nuclei in stage 14 of indicated genotypes. Error bars represent the SEM. ****P ≤ 0.0001 represent the level of significance.
Eip93F encodes a transcription factor that localizes to nuclei and binds to specific sites on the polytene chromosomes, indicating a potential role in gene regulation (Lee et al., 2000). Next, we tested whether Eip93F functions downstream of the ecdysone signaling by the overexpression of Eip93F in the EcR-depleted follicle cells (EcRB1DN). As per our expectation, Eip93F overexpression rescued the NC retention defect of EcRB1DN, suggesting that the Eip93F functions downstream of EcR in the follicle cells and this aids in NC clearance in late oogenesis (control: 0.53 ± 0.12; UAS Eip93F: 1.2 ± 0.25; EcRB1DN: 8.71 ± 0.23; EcRB1DN; UAS Eip93F: 1.8 ± 0.18) (Fig. 6, M′–Q and Fig. S5 M). Additionally, the ectopic overexpression of Eip93F in the follicle cells of EcRB1DN rescued the late-stage dumping defect, which is crucial for egg chamber maturation (Fig. S5 N). Next, we asked whether Eip93F modulates crq and drpr transcriptionally. To address it, we carried out semi-quantitative RT-PCR for evaluating crq and drpr mRNA levels in the ovaries where Eip93F function was depleted in the follicle cells. We observed approximately fivefold and threefold reduction in the levels of drpr and crq mRNA, respectively, compared with the control, suggesting that Eip93F regulates both these genes transcriptionally (tub84b: 1.0; drpr: 0.21 ± 0.08; crq: 0.37 ± 0.05) (Fig. 7, A and B).
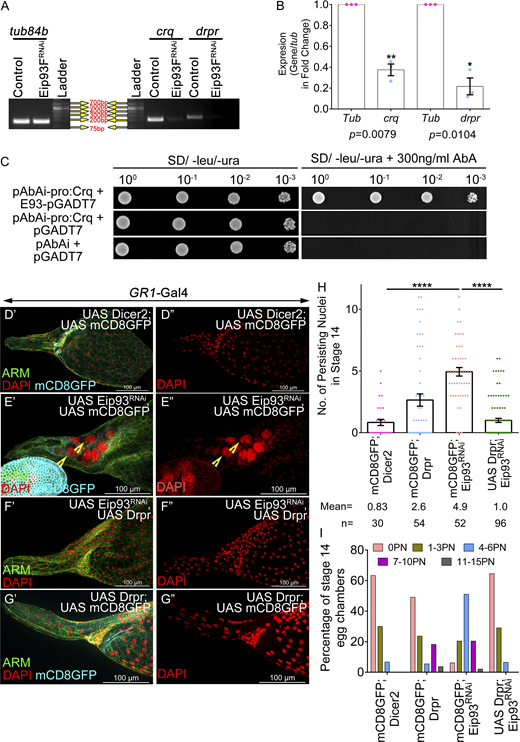
E93 regulates Draper and Crq to facilitate NC death. (A and B) Eip93FRNAi exhibits reduced levels of Crq and Drpr transcripts; tub84b is the loading control. Quantification of the transcripts in the Eip93FRNAi-overexpressing egg chambers with respect to the control. (C) Eip93F physically interacts with Crq promoter in yeast. Overnight grown cultures of Y1H Gold yeast strain containing bait (pABAi-CrqPromoter2.2KB) and prey (pGADT7-E93) constructs that were diluted to an OD600 of 1. 3× serial dilutions (10−1, 10−2, 10−3) were spotted on double dropout medium supplemented without and with aureobasidin inhibitor (300 ng/ml). Pictures were taken after 5 days of incubation at 30°C. (D′–G″) Representative image of stage 14 egg chambers of control (D′ and D″), Eip9F3RNAi; UAS mCD8GFP (E′ and E″), UAS Drpr; UAS Eip93FRNAi (F′ and F″), UAS Drpr; UAS mCD8GFP (G′ and G″). Arm is in green, DAPI is in red, and GFP is in cyan. Yellow arrowheads mark the persisting NC nuclei. (H) Quantification of persisting NC nuclei in stage 14 egg chambers of indicated genotypes. n stands for the number of egg chambers analyzed and the mean number of PN observed for each genotype. (I) Number of PN in stage 14 egg chamber as categorized into bins of 0 PN, 1–3 PN, 4–6 PN, 7–10 PN, 11–15 PN, and the percentage of stage 14 egg chambers in each bin was calculated. Error bars represent the SEM. ****P ≤ 0.0001, **P ≤ 0.001, *P ≤ 0.05 represent the level of significance. Source data are available for this figure: SourceData F7.
E93 regulates Draper and Crq to facilitate NC death. (A and B) Eip93FRNAi exhibits reduced levels of Crq and Drpr transcripts; tub84b is the loading control. Quantification of the transcripts in the Eip93FRNAi-overexpressing egg chambers with respect to the control. (C) Eip93F physically interacts with Crq promoter in yeast. Overnight grown cultures of Y1H Gold yeast strain containing bait (pABAi-CrqPromoter2.2KB) and prey (pGADT7-E93) constructs that were diluted to an OD600 of 1. 3× serial dilutions (10−1, 10−2, 10−3) were spotted on double dropout medium supplemented without and with aureobasidin inhibitor (300 ng/ml). Pictures were taken after 5 days of incubation at 30°C. (D′–G″) Representative image of stage 14 egg chambers of control (D′ and D″), Eip9F3RNAi; UAS mCD8GFP (E′ and E″), UAS Drpr; UAS Eip93FRNAi (F′ and F″), UAS Drpr; UAS mCD8GFP (G′ and G″). Arm is in green, DAPI is in red, and GFP is in cyan. Yellow arrowheads mark the persisting NC nuclei. (H) Quantification of persisting NC nuclei in stage 14 egg chambers of indicated genotypes. n stands for the number of egg chambers analyzed and the mean number of PN observed for each genotype. (I) Number of PN in stage 14 egg chamber as categorized into bins of 0 PN, 1–3 PN, 4–6 PN, 7–10 PN, 11–15 PN, and the percentage of stage 14 egg chambers in each bin was calculated. Error bars represent the SEM. ****P ≤ 0.0001, **P ≤ 0.001, *P ≤ 0.05 represent the level of significance. Source data are available for this figure: SourceData F7.
Previous studies have demonstrated that the ecdysone-induced protein 93F (E93) binds to 21C on the second chromosome, where the Crq gene is located (Lee et al., 2000). The Eip93F protein has been shown to specifically bind to a particular sequence motif (CC[G/A/C]AAA[A/G/T]) (Uyehara et al., 2017). We carried out a bioinformatics analysis of the upstream regions of the Crq and Drpr genes for the Eip93F binding motif. We identified only one potential Eip93F binding motif 720 base pairs upstream of the start codon (ATG) of the Crq gene. We were curious whether Eip93F physically interacts with Crq regulatory sequences. To test this, we performed the yeast one-hybrid (Y1H) assay to detect interactions between the transcription factor Eip93F and the Crq regulatory sequences harboring the tentative Eip93F binding site. Briefly, the Eip93F protein is fused with the strong transcriptional activation domain (AD) of the yeast Gal4 transcription factor. The physical interaction of fused Eip93F with the Crq regulatory sequence activates the downstream reporter gene AUR1-C in yeast and renders resistance to the antibiotic aureobasidin. We transformed yeast with Eip93F-AD (coding sequence) and Crq regulator sequence (2.2 Kb upstream of Crq) and plated the yeast on double dropout media (lacking uracil and leucine) containing the inhibitor aureobasidin (300 ng/ml). Strikingly, we observed yeast growth on the plates containing the inhibitor aureobasidin, suggesting that Eip93F-AD directly binds to the Crq regulatory sequences, which may probably regulate its transcription (Fig. 7 C).
Additionally, we observed that the NC retention defect of egg chambers with Eip93F-depleted follicle cells was rescued by overexpressing phagocytic receptor Drpr (Fig. 7, D′–I) (control: 0.83 ± 0.24; UAS Eip93FRNAi: 4.9 ± 0.34; UAS Drpr: 2.6 ± 0.4; UAS Drpr; UAS Eip93FRNAi: 1.0 ± 0.16). From the results mentioned above, we can conclude that ecdysone signaling functioning through the transcription factor Eip93F regulates Crq and Drpr transcription in the follicle cells. The presence of the Eip93F binding motif upstream of Crq, too, supports our proposition that Eip93F probably directly regulates the expression of Crq. As the overexpression of Drpr rescues the NC clearance defect of egg chambers with Eip93F-depleted follicle cells, it supports our model that ecdysone assigns nonprofessional phagocytic fate to the stretched AFCs by modulating the expression of the phagocytic receptors Drpr and Crq. This expression of Drpr and Crq aids the stretched AFCs to envelop the NCs. This is followed by extracellular acidification and initiation of clearance of the NCs by nuclear fragmentation and DNA breakdown. However, we cannot rule out the involvement of other factors downstream of EcR in mediating NC clearance.
Discussions
Ecdysone modulates the phagocytic cell fate in diverse cell types, including immune cells (hemocytes), normal epithelial cells, and the glia (Zhu et al., 2019; Awasaki et al., 2006). Of the various processes regulated by ecdysone, metamorphosis plays a critical role in the development transition of insects, wherein cellular remodeling orchestrated by apoptosis forms an integral step (Jiang et al., 1997; Zirin et al., 2013; Awasaki et al., 2006). In this study, we demonstrate that ecdysone plays a vital role in assigning nonprofessional phagocytic fate to the AFCs that help them to envelop and stimulate clearance of unwarranted germline cells in late oogenesis. Unlike classical phagocytosis, where macrophages internalize dying cells or cell debris, the follicle cells completely envelop viable NCs, destroy them, and mediate their clearance. This is believed to be stimulated by signals from the viable cells, which attract the phagocytes and initiate their clearance. Our results suggest that ecdysone induces EMT of the AFCs and transforms them to send fingerlike projections to engulf the NCs destined to die. Since we observed that downregulation of individual phagocytic receptors Drpr, Crq, Eater, Tep4, and Srp in the AFCs too exhibits NC clearance defect, it supports our hypothesis that the follicle cells do acquire a nonprofessional phagocytic fate to clear the NC. Strikingly, we observed 4–5 follicle cells come together to encapsulate one NC, followed by exocytosis of their lysosomal contents and initiation of the NC clearance. Our rescue data suggest that ecdysone modulates the expression of phagocytic receptors Crq and Drpr in the follicle cells through its transcription factor Eip93 to facilitate the clearance of the NCs (Fig. 8).

Schematic of the proposed model. EcR signaling function in the AFCs modulates the clearance of underlying germline NCs in late oogenesis. EcR signaling function through Eip93F modulates the expression of phagocytic receptors (Drpr and Crq) in the AFC. This assists the invasion of AFCs between the germline NCs, which helps 4–5 AFCs to envelop a single NC. This stimulates the process of NC clearance with the initiation of extracellular acidification, NC nuclear membrane disassembly, and DNA fragmentation.
Schematic of the proposed model. EcR signaling function in the AFCs modulates the clearance of underlying germline NCs in late oogenesis. EcR signaling function through Eip93F modulates the expression of phagocytic receptors (Drpr and Crq) in the AFC. This assists the invasion of AFCs between the germline NCs, which helps 4–5 AFCs to envelop a single NC. This stimulates the process of NC clearance with the initiation of extracellular acidification, NC nuclear membrane disassembly, and DNA fragmentation.
How do our results stand out in the context of the available information? Ecdysone has been linked with assigning nonprofessional phagocytic fate to the astrocytes in flies (Zhu et al., 2019; Awasaki et al., 2006). However, the outcome of the phagocytic fate is different in late oogenesis. The follicle cells that acquire phagocytic fate envelop live NCs, while the astrocytes engulf synaptic and neuronal debris. Unlike the characteristic one-is-to-one correspondence of astrocytes and the neuronal debris, in this context, we observe 4–5 follicle cells come together to completely envelop one viable NC before collectively initiating the elimination process, including pumping of lysosomal contents and activating NC clearance. How is this function of ecdysone different from other classical roles it plays during oogenesis? Ecdysone signaling modulates the previtellogenic-to-vitellogenic transition of egg chambers, the timing of border cell migration, and the cuboidal-to-squamous shape transition of AFCs (Jang et al., 2009; Jia et al., 2022; Ghosh et al., 2023, Preprint; Gaziova et al., 2004; Buszczak et al., 1999; Terashima and Bownes, 2006; Terashima and Bownes, 2004; Carney and Bender, 2000). Here, we demonstrate a unique function of ecdysone that is required in late egg chambers that enables the stretched AFCs to encapsulate and clear unwarranted NCs. Thus, it would be worth examining how ecdysone signaling spatially and temporally modulates diverse aspects of egg chamber development before they mature and are ready for fertilization.
Acquisition of nonprofessional phagocytic fate by the normal cells plays an important role in clearing worn-out, injured, or superfluous cells from a system. Though ecdysone signaling is also associated with the hemocytic fate in general, our results unequivocally establish that ecdysone signaling modulates the nonprofessional phagocytic fate of the AFCs. The acquisition of phagocytic fate by the follicle cell enables them to encapsulate and initiate the clearance of NC so that eggs mature before fertilization. The question is why this mechanism is favored when the system already has professional phagocytes. We know that the fly ovary is covered by a muscular sheath that is impregnable to the freely moving hemocytes (Fig. S3, I1–I4). Since the normal phagocytes do not have access to the maturing eggs, this is probably the only way forward, wherein transforming the AFCs to phagocytic fate aids the system in clearing the NCs that are not required any further in developed egg chambers. Strikingly, Drosophila testis too exhibits phagoptosis and employs the same phagocytic receptor Draper in the somatic cyst cells to assist non–cell-autonomous removal of the germline progenitor cells by acidification, DNA fragmentation, and degradation (Zohar-Fux et al., 2022). Given that the phenomenon of nonprofessional phagocytic behavior is not unique to flies, one is curious how comparable are the molecules that orchestrate similar phenomena in other systems. Coincidently, Stewart et al. (2024) have recently shown that the combined action of RARγ-RXR activates phagocytic behavior in the hair follicle stem cells (HFSc) of mice. This activity is required to clear the dead part of the upper root sheath to facilitate the growth of the follicle (Stewart et al., 2024). Given the Drosophila homolog of RXR, Usp, aids in NC clearance in Drosophila eggs, it is satisfying to observe that a similar mechanism may be operational in the higher system (Hult et al., 2011; Tocchini-Valentini et al., 2009). However, it is important to note that the final execution may be slightly different. In the fly ovary, 4–5 follicle cells that come together to encapsulate one viable NC exhibit phagoptosis, while the HFScs clear the dead part of the upper root sheath by phagocytosis (Stewart et al., 2024). Nevertheless, similar gene products can assign nonprofessional phagocytic fate to stretched AFCs in flies and HFScs in mice. Next question: is this behavior of clearance of unwarranted germline cells observed in any other organism? In mice, the cyst cells that do not take oocyte fate function as NCs, and they, too, die through a similar mechanism as reported in flies (Niu and Spradling, 2022). In mouse ovaries, pregranulosa cells export acidic vesicles and cathepsins into the NCs to initiate programmed cell death (Niu and Spradling, 2022). Altogether, there are similarities both at the molecular and at the cellular levels between Drosophila and mice.
In summary, we found that in contrast to professional phagocytes, stretched AFCs fine-tune the NC removal after their normal task of nourishing and cushioning the growing NCs is over (Brennan et al., 1982). Since multiple factors can activate the ecdysone signaling, it will be of interest to identify those activators and the diverse downstream modulators that have different manifestations and cellular outcomes to the steroid hormone ecdysone. We do not rule out the possibility of additional signals that may function along with ecdysone in the stretched follicle cells to facilitate NC clearance.
What are the future implications of our study? As phagoptosis controls the number of aged, diseased, stressed, and excess cells in a body, any misregulation can kill normal host cells, contribute to hemorrhagic conditions, or be associated with neuronal loss (Brown and Neher, 2012). In addition, the cancer cells evade phagoptosis by expressing “EAT me not signal” (Khalaji et al., 2023; Barkal et al., 2019). Thus, it is important for us to understand the mechanism of phagoptosis to harness or tame it for therapeutic purposes. Strikingly, the mammalian homologs of EcR, the liver X receptors (LXRα and LXRβ), function in the macrophages to assist in apoptotic cell clearance (A-González and Castrillo, 2011; Derangère et al., 2014). LXRs are a nuclear receptor family of transcription factors that modulate lipid metabolism and have recently been shown also to have an anti-inflammatory role (Hong et al., 2011; Schulman, 2017; Joseph et al., 2004). Cell-in-cell structures are quite prevalent in solid tumors that aid cancer progression (Druzhkova et al., 2023). Typically, the cells internalized could be tumor cells or other cells, including the immune cells, and this gives the tumor cells a survival advantage (Lugini et al., 2006). Thus, it would be worth examining whether LXR function in the tumor cells helps them eliminate cells that impede their growth or survival.
Materials and methods
Fly strains
All stocks and crosses were maintained at 25°C. Overexpression experiments involving the RNAi and/ or the transgene constructs were fattened at 29°C for 22–24 h. Experiments involving the overexpression of EcRB1DN, EcRRNAi with the GR1-Gal4 driver were fattened at 31°C for 16–20 h. Flies arising out of the cross involving the slbo-GAL4 and cy2-GAL4 were fattened for 14–15 h at 29°C and 31°C, respectively.
Flies used for this work are given in Table 1.
Flies used for this work
| Number | Genotype | Fly lines |
|---|---|---|
| BL-58286 | y[1] v[1]; P{y[+t7.7] v[+t1.8] = TRiP.HMJ22371}attP40 | UAS EcRRNAi |
| BL-27258 | y1 v1; P{TRiP.JF02546}attP2 | UAS UspRNAi |
| BL-34623 | y1 sc* v1 sev21; P{TRiP.HMS01298}attP2 | UAS SrpRNAi |
| BL-34080 | y1 sc* v1 sev21; P{TRiP.HMS01083}attP2 | UAS SrpRNAi |
| BL-35813 | y1 sc* v1 sev21; P{TRiP.HMS01208}attP2 | UAS SrpRNAi |
| BL-40831 | y1 v1; P{TRiP.HMS01997}attP40 | UAS CrqRNAi |
| Bl-42811 | y1 v1; P{TRiP.GL01185}attP2 | UAS CrqRNAi_2 |
| NIG-31655R-1 | UAS CrqRNAi_NIG_R1 | |
| NIG-31655R-2 | UAS CrqRNAi_NIG_R2 | |
| BL-33383 | y1 sc* v1 sev21; P{TRiP.HMS00259}attP2 | UAS PGRP-LCRNAi |
| BL-67236 | y1 sc* v1 sev21; P{TRiP.HMC06337}attP40 | UAS PGRP-LBRNAi |
| BL-60038 | y1 sc* v1 sev21; P{TRiP.HMC05031}attP40 | UAS PGRP-LERNAi |
| BL-25787 | y1 v1; P{TRiP.JF01793}attP2 | UAS NimC1RNAi |
| BL-61866 | y1 v1; P{TRiP.HMJ23355}attP40 | UAS NimC4RNAi |
| BL-25960 | y1 v1; P{TRiP.JF01980}attP2 | UAS NimC2RNAi |
| BL-25863 | y1 v1; P{TRiP.JF01884}attP2 | UAS EaterRNAi |
| BL-67218 | y[1] sc[*] v[1] sev[21]; P{y[+t7.7] v[+t1.8] = TRiP.HMC06319}attP40 | UAS Tep 4RNAi |
| BL-57868 | y[1] sc[*] v[1] sev[21]; P{y[+t7.7] v[+t1.8] = TRiP.HMC04773}attP40 | UAS Eip93FRNAi |
| NIG 18389R-2 | UAS Eip93FRNAi_NIG_R2 | |
| BL-6872 | w[1118]; P{w[+mC] = UAS-EcR.B1-DeltaC655.W650A}TP1-9 | DN EcR |
| BL-67035 | y1 w*; P{UAS-drpr.I}2 | Overexpression of Drpr |
| F000587 | M{UAS-Eip93F.ORF.3xHA.GW}ZH-86Fb | Overexpression of E93 |
| F000957 | M{UAS-crq.ORF.3xHA}ZH-86Fb | Overexpression of Crq |
| BL-7019 | w[*]; P{w[+mC] = tubP-GAL80[ts]}20 | |
| BL-36287 | w[*]; P{w[+mW.hs] = GawB}GR1 | GR1-Gal4 |
| BL-6458 | w*; P{GAL4-slbo.2.6}1206 | Slbo-Gal4 |
| BL-25041 | y[1] w[*]; P{w[+mC] = crq-GAL4}2 | Crq-Gal4 |
| BL-78361 | w[1118]; P{w[+mC] = srpHemo-H2A.3XmCherry}2/CyO; Pri[1] Dr[1]/TM3, Ser[1] | srpHemo-H2A.3XmCherry |
| UAS mCD8GFP | ||
| UAS Dicer2 | ||
| puc-lacz |
Immunostaining and image acquisition
Ovaries of female flies were dissected in Schneider’s medium supplemented with 10% FBS. Ovaries were fixed in 4% paraformaldehyde solution (158127; Sigma-Aldrich) for 15–20 min. The blocking solution contained 5% BSA (A5256801; Gibco), 0.3% Triton X-100 (X100; Sigma-Aldrich) in 1X phosphate-buffered saline (PBS, P3813; Sigma-Aldrich). For Eip93F staining, we used 0.5% Triton X-100. Staining was performed using the standard protocol (Felix et al., 2015). In brief, ovaries were incubated in primary antibodies in 5% BSA, 0.3% Triton X-100, and 1X PBS for 12–14 h. For phalloidin staining, desired tissues were incubated in rhodamine phalloidin (1:500) (A12379 or R415; Invitrogen) for 30–40 min at room temperature with DAPI (D1306; Invitrogen) or Hoechst (33342, Thermo Fisher Scientific) in 0.3% Triton X-100 and 1X PBS. Followed by overnight incubation, ovaries were washed four times in 0.3% Triton X-100 in 1XPBS solution for 15 min each. After washing, samples were incubated in secondary antibodies for 2 h in the blocking solution. Subsequently, the samples were washed four times in 0.3% Triton X-100 in 1X PBS solution for 15 min each. The penultimate washing solution contained DAPI. After the desired staining, samples were incubated in VectaShield (Vector Laboratories) overnight at 4°C before mounting on slides.
For lamin staining, ovaries from female flies were dissected in 1X PEM buffer (pH 6.8; 60 mM PIPES, 25 mM HEPES, 10 mM EGTA, 4 mM MgSO4, 5 M NaOH). The ovaries were then fixed in 8% formaldehyde solution in 1X BRB80 buffer (0.1 M PIPES, 0.5 mM MgSO4, 2 mM EGTA, 0.5 mM EDTA) and 1X PBS with 1% Tween-20 (1× PBS + 1% Tween-20) for 20 min. After removing the fix solution, the ovaries were washed in 1% PBS/Tween-20 (1× PBS + 1% Tween-20) and 1X BRB80 buffer at 4°C. Next, the ovaries were blocked for 3 h in a cocktail containing 0.5% BSA and 5% NGS in 1X BRB80 buffer and 1% PBS/Tween (1× PBS + 1% Tween-20). The ovaries were incubated with lamin antibody in the blocking solution for 2 days at 4°C. Following incubation, the ovaries were washed four times in 0.5% Tween-20 in 1X PBS for 15 min each. After washing, the samples were incubated with secondary antibodies for 2 h in the blocking solution. They were then washed four times in 0.5% Tween-20 in 1X PBS for 15 min each. The penultimate wash contained DAPI. Finally, after staining, the samples were incubated in 1–2 drops of VectaShield (Vector Laboratories) overnight at 4°C before mounting on slides.
For Draper staining, we have followed the same procedure that is mentioned in an earlier paragraph, but we used 5% BSA, 0.1% Triton X-100 in 1X PBS (P3813; Sigma-Aldrich) as a blocking solution. And all washes were carried out in 1XPBS.
Mounted egg chambers were imaged using either an Apotome.2 microscope (Carl Zeiss) or a CLSM 710 confocal microscope (Carl Zeiss) for specific images (e.g., Fig. 3, A–A3). For the CLSM 710 microscope, 16-bit images with a frame size of 512 × 512 pixels were acquired using a Plan-Apochromat 63× oil immersion objective (NA 1.4) with the following pinhole settings: 488-nm argon laser: 1.12 A.U.; 405-nm laser: 1.4 A.U.; and 561-nm laser: 0.93 A.U. For images captured with the Apotome.2 microscope, 16-bit images with a frame size of 1,024 × 1,024 pixels were used.
The primary antibodies used for this work are given in Table 2.
Primary antibodies used for this work
| Antibody/dye name | Dilution | Source |
|---|---|---|
| Mouse anti-Armadillo (N2 7A1) | 1:100 | DSHB |
| Mouse anti-Draper (5D14) | 1:50 | DSHB |
| Rabbit anti-β-galactosidase(A-11132) | 1:400 | Invitrogen |
| Rabbit anti-GFP (A-11122) | 1:1,000 | Invitrogen |
| Lamin (ADL 195) | 1:20 | DSHB |
| Anti-pMad (AB52903) | 1:50 | Abcam |
| Anti-Eip93F | 1:100 | (Uyehara et al., 2017) |
The secondary antibodies used for this work are given in Table 3.
Secondary antibodies used for this work
| Antibody/dye name | Dilution | Source |
|---|---|---|
| Goat anti-mouse IgG (H+L) Cross-adsorbed secondary antibody, Alexa Fluor 594 (A11005) | 1:500 | Invitrogen |
| Goat anti-mouse IgG (H+L) Cross-adsorbed secondary antibody, Alexa Fluor 488 (A11001) | 1:500 | Invitrogen |
| Goat anti-rabbit IgG (H+L) Cross-adsorbed secondary antibody, Alexa Fluor 568 (A11011) | 1:500 | Invitrogen |
| Chicken anti-rabbit IgG (H+L) Cross-adsorbed secondary antibody, Alexa Fluor 488 (A21441) | 1:500 | Invitrogen |
Quantification of PN
To assess the defect of NC removal at stage 14 of oogenesis, we quantified the number of egg chambers exhibiting an NC retention defect. Only those egg chambers with properly developed dorsal appendages were included for analysis. As an alternative approach to quantifying defective phenotypes, we categorized the observed abnormalities into three distinct groups: (1) PN: in this category, dorsal appendages were properly formed, and cytoplasmic transport to the oocyte was efficient; however, the removal of NCs from the anterior region was impaired; (2) mild defect with PN: dorsal appendages were formed correctly, but both cytoplasmic transport to the oocyte and NC removal were inefficient; and (3) dumping defect (dumpless): this group exhibited complete failure in all three processes: dorsal appendage formation, cytoplasmic transport, and NC removal.
In addition, we classified the PN defect based on the number of nuclei present at the anterior end of the egg chamber. This defect was subdivided into five categories: 0 PN, 1–3 PN, 4–6 PN, 7–10 PN, and 11–15 PN. For Fig. 4 I, we further categorized the defect into three groups: (1) without defect (0 PN), (2) mild defect (0 < PN < 3), and (3) high defect (PN > 3). For Fig. S1 U, we further categorized the defect into three groups: (1) without defect (0 PN), (2) PN, and (3) high dumping defect.
TUNEL staining
The fixed ovary tissue was washed thrice in PBS for 10 min each. Then, the tissue was permeabilized with 1× PBS + 0.3% Triton X-100 (0.3% PT) for 15 min and washed twice more in 0.3% PT (1× PBS + 0.3% Triton X-100) for 5 min each. The ovaries were treated with sodium citrate at 65°C for 30 min and washed once with 0.1% PT (1× PBS + 0.1% Triton X-100). The samples were incubated with the TUNEL mix (12156792910; Merck) at 37°C for 3 h as per the manufacturer’s instructions. After a final wash with 0.1% PT and staining with DAPI, the ovaries were stored in VectaShield for same-day imaging.
LysoTracker staining
Ovaries were isolated in Schneider’s S2 medium supplemented with 15% FBS(dissection medium) to maintain tissue integrity. Following dissection, the samples were incubated in LysoTracker solution (L7528; Thermo Fisher Scientific) (1:200 dilution in dissection medium) for 10 min at 25°C to label acidic compartments. After incubation, the samples were thoroughly washed in PBS containing 0.3% Triton X-100 to remove any unbound LysoTracker. The tissues were then fixed in 4%PFA. For nuclear staining, the samples were incubated with DAPI in PBS to label DNA, facilitating the visualization of the nuclei. Finally, the samples were mounted in VectaShield mounting media and imaged.
KEGG and GO analysis
We utilized the GEO database (accession number GSE49326) for KEGG and GO analyses, focusing on downregulated genes identified in the dataset by Regan et al. (2013). For KEGG pathway analysis, we employed ShinyGO 0.80, applying a false discovery rate cutoff of 0.05 and displaying the top 20 pathways. For GO analysis, we used g: Profiler (https://biit.cs.ut.ee/gprofiler/gost), with a threshold of 0.05, analyzing only annotated genes across three categories: GO molecular function, GO cellular component, and GO biological process (Reimand et al., 2007). We specifically extracted gene groups related to cell death, cytoskeleton, and the JNK pathway from the GO analysis. To further refine our analysis, we used the STRING database (https://string-db.org) to explore protein–protein interactions and narrow down key gene nodes. From the STRING analysis, we focused on terms relevant to apoptotic cell engulfment (GO:0043652), cell clearance (GO:0043277), and apoptotic processes (GO:0006915).
Coverslip and confocal dish preparation for live-cell imaging
Coverslips were cleaned with 70% EtOH and spotted with poly-D-lysine (Cat #P7280; Sigma-Aldrich) solution (100 µg/ml) in water at the center of the coverslip, followed by microwaving for 45–60 s until it was fully dry or drying O/N in 37°C incubators. Live imaging was performed essentially as reported earlier (Prasad et al., 2007). Briefly, fly ovaries were dissected in S2 medium supplemented with 15% FBS, penicillin–streptomycin, and 100 μg/ml insulin. Ovaries were then incubated and imaged in S2 medium supplemented with 15% FBS, penicillin–streptomycin, and 100 μg/ml insulin to maintain live conditions.
Live imaging setup, processing, and analysis
Live imaging was performed on a spinning disk confocal. Samples were imaged with a 40X objective, 5 min apart, with a z-step size of 4 μm (pinhole 1 A.U). The stack was refocused time to time to keep region of interest in frame.
Quantification of EcRE-lacz in border cells
To quantify lacZ levels, we imaged migrating border cells overexpressing EcRRNAi and EcRDN constructs in fixed samples. We maintained identical technical conditions for the immunostaining and followed the same imaging parameters for the experiment and the control. All images were acquired at 40X magnification with a z-step of 0.34 μm, and the z-planes were merged to generate a 2D image. Border cells, marked with mCD8GFP, were outlined as a single region of interest (ROI). Background correction was performed using the mean LacZ intensity of NCs. The corrected lacZ intensity for control and experimental samples was plotted as fold change, with the control set to 1, and statistical tests were applied. Imaging was conducted using a Zeiss Axio Observer 7 with the Apotome.2 module, and data analysis was performed with Zen 2012.
Draper quantification
Egg chambers are co-immunostained with GFP and Draper. All images were acquired at 60X magnification with a z-step of 0.4 μm, and the z-planes were merged to generate a 2D image. We used mCD8GFP to check the AFCs. We outlined the AFCs by checking the GFP. Background normalization was performed for the Draper staining using the average intensity observed in the posterior follicle cells. The corrected raw Draper intensity for control and experimental samples was plotted in A.U. Assessment was done in Fiji/ImageJ.
Quantification of AFC nuclei of stage 11 egg chambers
The nuclei were labeled with DAPI. Images were acquired at regular z intervals of 0.4 μm in a Nikon confocal microscope from the upper layer to the midplane of egg chambers and analyzed with Fiji/ImageJ. For each z-plane, an ROI was selected and only nuclei that were in focus were counted. Overlapping nuclei across the z-planes were counted only once.
Quantification of puc-lacz in AFCs
To quantify lacz levels, we imaged AFCs overexpressing EcRDN constructs. We maintained identical technical conditions for the immunostaining and followed the same imaging parameters for the experiment and the control. Then, z-planes were merged to generate a 2D image. We made free-hand ROI to mark the nuclei by checking the Lacz pattern (especially for experiment). We did normalization by mean intensity of DAPI. The corrected raw lacZ intensity for control and experimental samples was plotted, and statistical tests were applied. Imaging was conducted in spinning disk confocal, and the data analysis was done using ImageJ.
Y1H assay
The Y1H assay was performed following the Matchmaker Gold Y1H system user manual (Takara Bio). Briefly, the full-length coding sequence of the gene E93 was cloned into the bait vector pGADT7. The Crq promoter sequence containing 2,200 bp upstream of the ATG site was cloned into the pABAi vector. For checking the DNA–protein interactions, different combinations of bait and prey constructs were cotransformed into Y1H Gold yeast strain (YM4271; Clontech) using Yeastmaker Yeast Transformation Kit (630439; Takara), and transformants were selected on double dropout medium SD/-Leu/-Ura at 30°C for 3 days. For confirmation of protein–DNA interactions, overnight grown double dropout screened yeast cells were diluted to an OD600 of 1.0 with 4X serial dilutions that were spotted on double dropout SD/-Leu/-Ura supplemented with 300 ng/ml aureobasidin (630499; Takara). Plates were grown at 30°C for 72 h before acquiring the picture. E93 cDNA was cloned by the Gibson assembly (M5510A; NEB) method, and the promoter of Crq (2,000 bp upstream of the start site) was cloned between the HindIII and KpnI site.
RNA isolation and semi-quantitative RT-PCR
RNA was isolated from the whole ovaries of adult flies using TRIzol Reagent (Cat #15596026; Invitrogen). Then, cDNA was prepared from 1 µg of total RNA using RevertAid Reverse Transcriptase (Cat #EP0441; Thermo Fisher Scientific). The full reaction was loaded for analysis. Semi-quantitative RT-PCR evaluated the status of the transcripts that are given in Table 4.
List of primers sequences for semi-quantitative RT-PCR
| Gene | Primers | Annealing temperature |
|---|---|---|
| Crq Left | 5′-CCGAGACAAAGCACCCATTT-3′ | 56°C |
| Crq Right | 5′-CGTCATCGGGCTCAATCATC-3′ | |
| Draper Left | 5′-CCTGCCCAACAATATGCGTT-3′ | 56°C |
| Draper Right | 5′-TCCTTGTAGCCCTCCTTGTG-3′ | |
| PGRP-LB Left | 5′-AAGAACCTGATCGCCTTTGG-3′ | 56°C |
| PGRP-LB Right | 5′-GGATTGGTGCGGCTTTTGT-3′ | |
| Tub84b Left | 5′-CCTTCGTCCACTGGTACGTT-3′ | 59°C |
| Tub84b Right | 5′-GGCGTGACGCTTAGTACTC-3′ | |
| Serpent Left | 5′-GCAACAGCTTCCACAGTACC-3′ | 57°C |
| Serpent Right | 5′-GTTTGAGTTGGGCGACATGT-3′ | |
| Eip93F Left | 5′-GCAATGCCCTCAAGAACCAA-3′ | 53°C |
| Eip93F Left | 5′-CTACCGTTGCTGCCATTACG-3′ |
Tub84b was used as a housekeeping control.
The gene and primer sequences used for the Y1H experiment are given in Table 5.
Gene and primer sequences used for the Y1H experiment
| Gene | Primers | Annealing temperature |
|---|---|---|
| Crq FP-hind3 | 5′-CCCAAGCTTTGCTTACAGTGCTGTTACAG-3′ | 61.5°C |
| Crq RP-kpn1 | 5′-CGGGGTACCGGTGGATACGTAGGATTCC-3′ | |
| E93gibson-For | 5′-AGTACCCATACGACGTACCAGATTACGCTCAGATGGCCGATTGTTCATATGT-3′ | 64°C |
| E93gibson_Rev | 5′-TTCAGTATCTACGATTCATCTGCAGCTCGACTATAACTGATCCGCCTGGT-3′ |
Statistical tests
Difference of means was analyzed by Student's two-tailed t test of unequal variance with the Mann–Whitney test in GraphPad Prism 6.0 or in Excel. Graphs were plotted using GraphPad Prism. * indicates P < 0.05, ** indicates P < 0.01, *** indicates P < 0.001, and **** indicates P < 0.0001. SEM was calculated and represented for each data.
The list of molecular biology grade reagents used for this work is given in Table 6.
List of molecular biology grade reagents
| Reagent | Catalog No. | Source |
|---|---|---|
| Poly-D-lysine | P7280 | Sigma-Aldrich |
| RevertAid Reverse Transcriptase | EP0441 | Thermo Fisher Scientific |
| TRIzol Reagent | 15596026 | Invitrogen |
| DreamTaq DNA Polymerase | EP0703 | Thermo Fisher Scientific |
| dNTP | 18427013 | Thermo Fisher Scientific |
| PBS | P3813 | Sigma-Aldrich |
| Triton X-100 | X100 | Sigma-Aldrich |
| Hoechst | 33342 | Thermo Fisher Scientific |
| FBS | A5256801 | Gibco |
| Paraformaldehyde | 158127 | Sigma-Aldrich |
| VectaShield | H-1000 | Vector Laboratories |
| PIPES | P6757 | Sigma-Aldrich |
| HEPES | 391340 | Sigma-Aldrich |
| MgSO4 | M1880 | Sigma-Aldrich |
| Tween-20 | 0777-1L | AMRESCO |
| Phusion High-Fidelity DNA Polymerase | F530S | Thermo Fisher Scientific |
| LysoTracker Red DND-99 | L7528 | Thermo Fisher Scientific |
| PureLink Quick Gel Extraction Kit | K210012 | Invitrogen |
| GeneJET Plasmid Miniprep Kit | K0502 | Thermo Fisher Scientific |
| RiboLock RNase inhibitor | EO0381 | Thermo Fisher Scientific |
| Oligo(dT)18 primer | SO132 | Thermo Fisher Scientific |
| TUNEL | 12156792910 | Merck |
| Gibson reagent | M5510A | NEB |
| Hind3 | R3104 | NEB |
| Kpn1 | R3142 | NEB |
| T4 DNA ligase | EL0011 | Thermo Fisher Scientific |
| pAGDT7 plasmid | - | Matchmaker Takara |
| pAbAi plasmid | - | Matchmaker Takara |
| Yeast strain | YM4271 | |
| GeneRuler 1 Kb Plus DNA Ladder | SM1331 | Thermo Fisher Scientific |
| BioLit ProxiO Low DNA Ladder | 68905 | SRL |
Online supplemental material
Fig. S1 shows that classical ecdysone functioning through Usp regulates NC removal in late oogenesis. Fig. S2 shows that NC acidification is a prerequisite for encapsulation by the overlying follicle cells. Fig. S3 demonstrates that the function of transcription factor Serpent in the AFC regulates NC removal and acidification. In Fig. S4, employing KEGG and string analysis on the downregulated genes in EcRB1DN-overexpressing macrophages in larval and pupal stages, a group of genes related to cell death and those affected by EcRB1DN were identified and are listed. Fig. S5 shows ecdysone function through the transcription factor Eip93F mediates NC clearance. Table S1 shows genes of phagocytic receptors for mini screen during NC removal. Table S2 shows KEGG analysis of microarray data by ShinyGO. Table S3 shows gene profiler analysis of microarray data. Table S4 shows string analysis of microarray data. Video 1 captures the real-time encapsulation of the NC by the overlying anterior stretched follicle cells. Video 2 is a 3D rendered movie of puc-lacz–positive AFCs engulfing one NC nucleus. Video 3 is just a representation of Video 2 in a single channel. By using LysoTracker, Video 4 demonstrates that acidification of the NC precedes their encapsulation by overlying the AFCs. Video 5 demonstrates EcR function in the anterior stretched follicle cells is required for NC encapsulation. Video 6 shows that EcR depletion in the follicle cells impedes NC acidification.
Data availability
The data supporting the findings of this study are available from the corresponding author upon reasonable request.
Acknowledgments
We thank Mr. Ritabrata Ghosh and Ms. Shreya Ghosh for their help with imaging, members of the Morphogenesis Lab for their input and support, Mr. S. Halder and Mr. S. Kar for illustration assistance, Prof. Rupak Datta for TUNEL reagent, Prof. Daniel J. Mckay for the Eip93F antibody, BDSC and DSHB for essential strains and reagents, respectively, and DBT-Builder (BT/INF/22/SP45383/2022) for the super-resolution imaging facility.
G. Ghosh was supported by the Senior Research Fellowship from the Council of Scientific & Industrial Research, India, from the Government of India. D. Das and A. Nandi were supported by the Senior Research Fellowship from IISER Kolkata. Ms. Shreya Ghosh was supported as DBT project JRF (BT/INF/22/SP45383/2022).
Author contributions: G. Ghosh: conceptualization, data curation, formal analysis, investigation, methodology, validation, visualization, and writing—original draft, review, and editing. D. Das: data curation, formal analysis, investigation, methodology, validation, and visualization. A. Nandi: data curation, formal analysis, investigation, methodology, and visualization. S. De: data curation, formal analysis, investigation, and methodology. S.N. Gangappa: investigation, resources, supervision, and writing—review and editing. M. Prasad: conceptualization, funding acquisition, project administration, supervision, validation, visualization, and writing—original draft, review, and editing.
