Excess dietary intake of saturated fatty acids (SFAs) induces glucose intolerance and metabolic disorders. In contrast, unsaturated fatty acids (UFAs) elicit beneficial effects on insulin sensitivity. However, it remains elusive how SFAs and UFAs signal differentially toward insulin signaling to influence glucose homeostasis. Here, using a croaker model, we report that dietary palmitic acid (PA), but not oleic acid or linoleic acid, leads to dysregulation of mTORC1, which provokes systemic insulin resistance. Mechanistically, we show that PA profoundly elevates acetyl-CoA derived from mitochondrial fatty acid β oxidation to intensify Tip60-mediated Rheb acetylation, which triggers mTORC1 activation by promoting the interaction between Rheb and FKBPs. Subsequently, hyperactivation of mTORC1 enhances IRS1 serine phosphorylation and inhibits TFEB-mediated IRS1 transcription, inducing impairment of insulin signaling. Collectively, our results reveal a conserved molecular insight into the mechanism by which Tip60-mediated Rheb acetylation induces mTORC1 activation and insulin resistance under the PA condition, which may provide therapeutic avenues to intervene in the development of T2D.
Introduction
Insulin resistance, which is considered as a dominant hallmark of type 2 diabetes (T2D) (Fazakerley et al., 2018), is related to a variety of metabolic disorders, such as obesity, atherosclerosis, and hypertension (Reaven, 1988; Schenk et al., 2008). The pathogenesis of insulin resistance is associated with genetic mutations including PPARG, IRS1, TCF7L2, and OTUD3. However, behavioral and environmental factors can also contribute to insulin resistance in numerous ways (Murea et al., 2012; Zhou et al., 2022). Accumulating evidence has shown that elevated dietary intake of saturated fatty acids (SFAs) is closely correlated with an increased risk of T2D (Martínez-González et al., 2014; Vessby et al., 2001), and palmitic acid (PA), as one of the most abundant circulating SFAs, is also known to trigger the development of insulin resistance (Gao et al., 2010; Nakamura et al., 2009; Sanchez-Alegria et al., 2021; Ubhayasekera et al., 2013; Yu et al., 2002). On the contrary, dietary intake of unsaturated fatty acids (UFAs) has not been associated with inducing glucose intolerance and may even be beneficial for insulin sensitivity (Palomer et al., 2018). However, the precise mechanisms underlying the different effects of SFAs and UFAs on insulin signaling and glucose homeostasis are not well established.
Eukaryotes cells have evolved a well-established mechanism to sense the availability of certain nutrients in the diet to maintain metabolic homeostasis. mTORC1, a central hub of nutrient signaling, integrates a variety of environmental inputs to control cell growth and metabolism (Kim and Guan, 2019; Saxton and Sabatini, 2017). Dysregulation of mTORC1 is associated with a variety of diseases, including T2D, cancer, nonalcoholic fatty liver disease, Huntington’s disease, and Parkinson’s disease (Gosis et al., 2022; Pryor et al., 2014; Zoncu et al., 2011). The correlation between mTORC1 and T2D is mainly dependent on the existence of several negative feedback mechanisms from mTORC1 and its downstream targets to insulin signaling, which restrain the hyperactivation of mitogenic and anabolism signaling to maintain cellular homeostasis under physiological conditions (Ardestani and Maedler, 2018). Ribosomal S6 kinase (S6K), which is a pivotal downstream of mTORC1, has been shown to impair insulin signaling by inducing phosphorylation-dependent degradation of insulin receptor substrate 1 (IRS1) (Shah et al., 2004; Um et al., 2004). Moreover, mTORC1 mediates the phosphorylation and activation of growth factor receptor-bound protein 10 (Grb10), also resulting in the suppression of insulin signaling (Hsu et al., 2011; Yu et al., 2011). Furthermore, imidazole propionate, a metabolite produced by the gut microbiota, is reported to provoke insulin resistance by inducing mTORC1 activation and subsequent phosphorylation and degradation of IRS1 (Koh et al., 2018). A growing body of evidence has elucidated that mTORC1-induced insulin resistance is related to the phosphorylation and degradation of IRS1. However, whether mTORC1 can affect IRS1 in other manners such as transcriptional regulation under physiological or pathological conditions remains elusive.
As the major regulator of cell growth and metabolism, mTORC1 activity is tightly controlled by a diverse set of upstream signals. Two sets of small G proteins, termed the Rheb and Rag GTPases which integrate the signals from growth factors and nutrients to modulate mTOR kinase activity and intracellular localization respectively, form a center of the regulatory network for mTORC1 (Garami et al., 2003; Inoki et al., 2003; Kim et al., 2008; Sancak et al., 2008, 2010; Tee et al., 2003). In addition to the two direct modulations, the acetylation modifications of mTORC1 components and their associated proteins have been shown to play a vital role in the regulation of mTORC1 activity (Yin et al., 2021). For instance, increased acetylation of Raptor by leucine has been demonstrated to activate mTORC1 signaling by regulating the interaction between Raptor and Rag complex (Son et al., 2019, 2020). Moreover, increased acetylation of Rheb is also associated with the activation of mTORC1 (Hu et al., 2021). The onset of acetylation modification requires acetyl-CoA as its substrate, and fatty acid oxidation is an important source for the production of acetyl-CoA. However, it is still unclear whether acetylation modification is involved in the regulation of mTORC1 signaling under fatty acid stimulation. Simultaneously, the acetylation modifications also require the involvement of acetyltransferases. The HIV-1 Tat-interacting protein 60 kD (Tip60) is the catalytic subunit of the highly conserved NuA4 acetyltransferase complex, playing vital roles in DNA damage repair, apoptosis, and autophagy via direct interacting and acetylating multiple proteins (Li et al., 2018). However, the role of Tip60 in regulating mTORC1 signaling and insulin sensitivity remains poorly understood.
Teleost fish have evolved conserved systems for nutrient- and pathogen-sensing (Hotamisligil, 2006), which play a central role in maintaining energy homeostasis and resisting pathogenic infection. In addition, our previous work found that teleost fish evolved well-conserved lipid metabolism and acetylation modification systems (Chen et al., 2021, 2022; Xu et al., 2020). However, teleost fish have a poor capacity to utilize glucose and are considered to be susceptible to insulin resistance under numerous pathological conditions (Moon, 2001; Palmer and Ryman, 1972). Thus, these properties make teleost fish an appropriate model for investigating the pathogenesis of insulin resistance. In this study, using croaker as an in vivo model combined with croaker myocyte and mouse C2C12 myotube as in vitro models, we reveal a conserved acetylation-dependent mechanistic insight for understanding the link between fatty acids intake and insulin resistance, which mediates by acetyl-CoA derived from mitochondrial fatty acid β oxidation and Tip60-mediated Rheb acetylation. Therefore, our study may provide an attractive strategy to intervene in the development of T2D.
Results
PA, but not oleic acid or linoleic acid, induces systemic and cellular insulin resistance
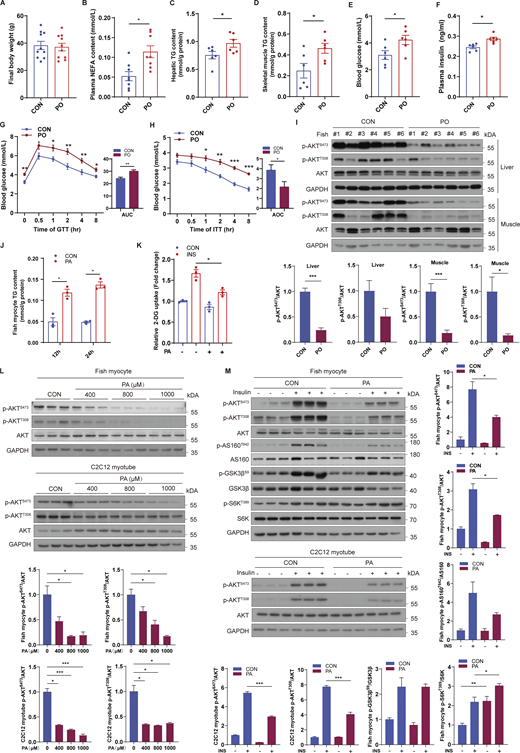
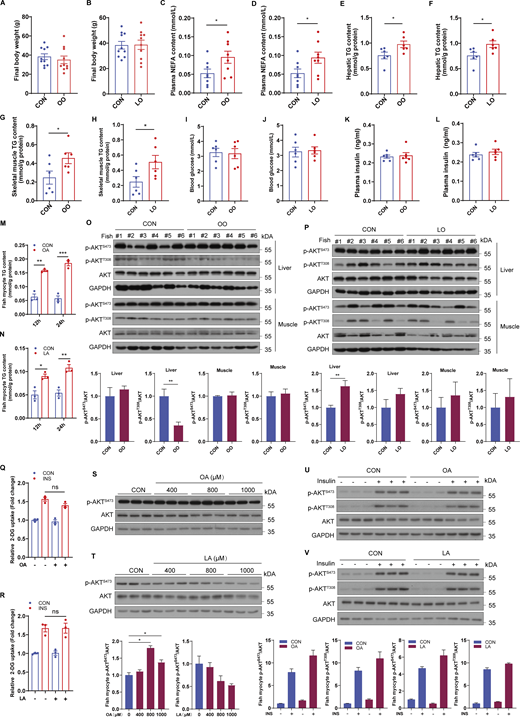
To investigate which fatty acids can provoke insulin resistance, we challenged croakers with a control (CON), PA rich (PO), oleic acid (OA) rich (OO), or linoleic acid (LA) rich (LO) diet for 10 wk. There was no significant difference in the final body weight between fish fed CON diet and PO, OO, or LO diet (Fig. 1 A; and Fig. S1, A and B). However, the levels of nonesterified free fatty acid (NEFA) in plasma (Fig. 1 B; and Fig. S1, C and D) and triglyceride (TG) in liver (Fig. 1 C; and Fig. S1, E and F) and skeletal muscle (Fig. 1 D; and Fig. S1, G and H) were elevated significantly in fish fed PO, OO, or LO diet compared with CON diet, indicating that PA, OA, and LA rich feeding may induce aberrant lipid deposition. As abnormal accumulation of intracellular lipids is associated with the development of insulin resistance (Korenblat et al., 2008; Samuel et al., 2010), we assayed the effect of dietary different fatty acids on glucose homeostasis and insulin sensitivity. Compared with the CON diet, the PO diet strongly elevated fasting blood glucose levels (Fig. 1 E) and plasma insulin concentrations (Fig. 1 F), whereas OO or LO diets had no significant effects (Fig. S1, I–L). Moreover, glucose tolerance (Fig. 1 G) and insulin tolerance (Fig. 1 H) were impaired by the PO diet, as revealed via the glucose tolerance test (GTT) and the insulin tolerance test (ITT). Furthermore, immunoblotting assays also showed that the PO diet, but not the OO or LO diet, diminished the phosphorylation levels of AKT in liver and skeletal muscle (Fig. 1 I; and Fig. S1, O and P), which plays a vital role in insulin signaling. These results suggest that dietary PA leads to systemic insulin resistance in fish, but not OA or LA.
To further investigate the role of PA in glucose homeostasis and insulin sensitivity, fish myocytes and mouse-differentiated C2C12 myotubes were treated with PA. In line with the in vivo results, PA treatment increased the TG levels of fish myocytes (Fig. 1 J). Moreover, glucose uptake stimulated by insulin was inhibited under PA treatment in fish myocytes (Fig. 1 K), as unveiled by 2-deoxy-D-glucose (2-DG) uptake assays. Likewise, PA treatment reduced the phosphorylation levels of AKT in a dose-dependent manner (Fig. 1 L) and impeded insulin from boosting the phosphorylation of AKT in fish myocytes and C2C12 myotubes (Fig. 1 M). To determine whether OA or LA can impair cellular insulin signaling, we also treated cells with OA or LA and found that OA or LA treatment also increased the TG levels of fish myocytes (Fig. S1, M and N). However, both OA and LA treatments failed to inhibit glucose uptake (Fig. S1, Q and R) and phosphorylation of AKT with or without insulin stimulation (Fig. S1, S–V). Together, these results indicate that PA provokes systemic and cellular insulin resistance, whereas OA or LA had no effect on glucose homeostasis and insulin sensitivity.
Hyperactivation of mTORC1 contributes to PA-induced insulin resistance
To elucidate the underlying mechanism of insulin resistance induced by PA, we assayed the phosphorylation levels of AKT downstream pathways under PA treatment. Notably, unlike other AKT downstream substrates (GSK3β and AS160), PA treatment increased the levels of phosphorylated S6K, an indicator of mTORC1 activity, under insulin stimulation (Fig. 1 M). Considering that mTORC1 can lead to feedback inhibition of insulin signaling (Harrington et al., 2004; Yu et al., 2011), we speculated that mTORC1 is involved in PA-induced insulin resistance. To confirm this hypothesis, we therefore estimated the effect of PO diet on mTORC1 signaling and found that the phosphorylation levels of S6K and S6 were strongly promoted in skeletal muscle of fish fed PO diet (Fig. 2 A). Moreover, in cultured cells, PA treatment elevated the phosphorylation levels of S6K and S6 in a time- and dose-dependent manner (Fig. 2, B and C), revealing that PA can provoke hyperactivation of mTORC1.
To further investigate the role of mTORC1 during PA-induced insulin resistance, fish myocytes and C2C12 myotubes were incubated with rapamycin, a partial mTOR inhibitor. The results showed that rapamycin treatment indeed prevented PA-induced mTORC1 activation (Fig. 2 D). Meanwhile, the suppression of insulin-stimulated glucose uptake by PA treatment was restored upon rapamycin treatment (Fig. 2 E). Furthermore, insulin-intensified phosphorylation of AKT was improved when mTORC1 was inhibited by rapamycin (Fig. 2 F). These results indicate that PA-induced insulin resistance is associated with the activation of mTORC1. Further confirming this notion, fish myocytes were treated with the mTORC1 activator MHY1485. As expected, MHY1485 treatment enhanced mTORC1 activity (Fig. 2 G) and restrained insulin from boosting the phosphorylation of AKT in the presence or absence of PA (Fig. 2 H). Given that OA or LA did not alter glucose homeostasis and insulin sensitivity, we also assayed the effect of OA or LA on mTORC1 signaling. The results showed that OA and LA failed to induce mTORC1 activity in vivo (Fig. S2, A and B) and in vitro (Fig. S2, C and D). These results suggest that the difference in mTORC1 regulation among PA, OA, or LA may lead to divergent effects on insulin signaling, and further illustrate the relevance between activation of mTORC1 and SFAs diet-induced insulin resistance.
Mitochondrial fatty acid β oxidation is required for PA-induced mTORC1 activation and insulin resistance
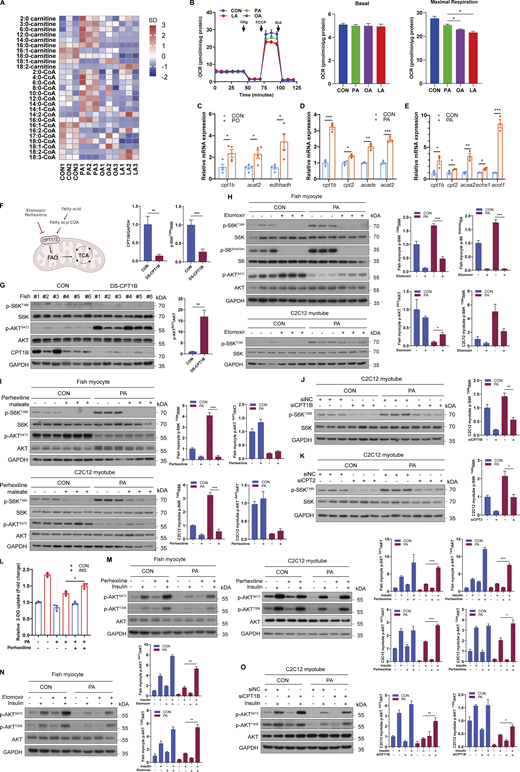
The above results showed that the induction of mTORC1 signaling occurred after 8 h of PA stimulation (Fig. 2 B). Thus, we speculated that activation of mTORC1 by PA may not be related to its role as a signaling molecule but is dependent on its metabolic pathway. Considering that fatty acids must first form fatty acid-CoA for anabolism or catabolism to proceed, we detected the contents of acyl-CoA and acylcarnitine using LC-MS. The results showed that PA treatment increased the contents of short/medium-chain acyl-CoA and acylcarnitine (Fig. 3 A and Fig. S3 A), indicating that PA may induce mitochondrial fatty acid β oxidation. Moreover, seahorse real-time cell metabolic analysis showed that the PA treatment group had higher mitochondrial OCR and maximal oxygen consumption rates compared with the OA or LA treatment group (Fig. 3 B). Furthermore, using [1-14C]-palmitic acid or [1-14C]-oleic acid to measure the fatty acid oxidation, we found that PA produced more [14C]-acid soluble metabolites (ASMs) and [14C]-CO2 than OA (Fig. S3 B), which was consistent with the results in human myotubes (Bakke et al., 2012). Similarly, in comparison with the CON diet, fish-fed PO diet exhibited higher mRNA expression levels of fatty acid β oxidation-related genes in muscle (Fig. 3 C). However, OO or LO diet failed to increase mRNA levels of fatty acid β oxidation-related genes (Fig. S3, C and D). Compared with OA or LA treatment, PA-induced increase of fatty acid oxidation gene expressions was also more robust in vitro (Fig. 3, D and E; and Fig. S3, E and F). Thus, these results reveal that PA, OA, and LA have different effects on the mitochondrial fatty acid β oxidation, which may contribute to the differences in their effects on the mTORC1 pathway.
Considering that CPT1B and CPT2 are rate-limiting enzymes of fatty acid β oxidation in muscle, we suppressed CPT1B and CPT2 by pharmacological inhibition or genetic knockdown to block fatty acid oxidation (Fig. 3 F). The results showed that intraperitoneal injection of dsCPT1B in fish strongly reduced the expression of CPT1B and inhibited the activity of mTORC1 in muscle (Fig. 3 G). Moreover, respectively incubating fish myocytes and C2C12 myotubes with etomoxir or perhexiline maleate, two potent CPT1 inhibitors, attenuated the induction of mTORC1 signaling under PA treatment (Fig. 3, H and I). Similarly, CPT1B and CPT2 knockdown by small interfering RNA (siRNA) (Fig. S3, G–J) also abrogated the activation of mTORC1 under PA treatment in C2C12 myotubes (Fig. 3, J and K). These results suggest that PA-provoked mTORC1 activation is dependent on mitochondrial fatty acid β oxidation and that the different effects of fatty acid β oxidation among PA, OA, or LA may contribute to divergent effects on mTORC1 regulation.
Given that hyperactivation of mTORC1 signaling may account for insulin resistance, we validated whether the inhibition of mitochondrial fatty acid β oxidation contributed to the recovery of insulin sensitivity under PA treatment. As expected, the suppression of insulin-stimulated glucose uptake by PA treatment was relieved in fish myocytes with pharmacological inhibition of fatty acid β oxidation (Fig. 3 L). Consistently, the phosphorylation levels of AKT were enhanced in the muscle of fish with intraperitoneal injection of dsCPT1B (Fig. 3 G). Furthermore, inhibition of CPT1 by pharmacological inhibitors or siRNA knockdown also improved the suppression of insulin-increased phosphorylation of AKT under PA treatment in fish myocytes and C2C12 myotubes (Fig. 3, M–O). Collectively, these results demonstrate that mitochondrial fatty acid β oxidation plays a vital role in PA-induced mTORC1 activation and subsequent insulin resistance.
Acetyl-CoA derived from mitochondrial fatty acid β oxidation triggers mTORC1 activation and insulin resistance under PA condition
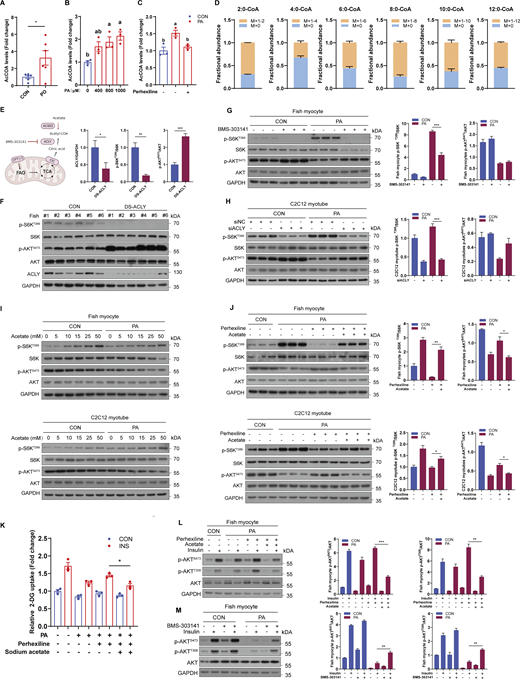
As acetyl-CoA is the major and final metabolite of mitochondrial fatty acid β oxidation (Pougovkina et al., 2014), we investigated whether fatty acid β oxidation-produced acetyl-CoA mediated the induction of mTORC1 signaling and insulin resistance. Compared with CON diet, PO diet strongly increased acetyl-CoA levels in muscle (Fig. 4 A). Likewise, PA treatment significantly elevated the levels of intracellular acetyl-CoA in a dose-dependent manner in fish myocytes (Fig. 4 B). Moreover, blocked fatty acid β oxidation by perhexiline maleate diminished the induction of acetyl-CoA levels under PA treatment (Fig. 4 C). Furthermore, we directly measured the contribution of PA to the total cellular acetyl-CoA pool using metabolic flux assays. The results showed that exceeding 60% of the acetyl-CoA pool was PA derived and exceeding 50% of the other short/medium-chain fatty acid-CoA pools were PA derived (Fig. 4 D). Thus, these results indicate that acetyl-CoA derived from mitochondrial fatty acid β oxidation may play a potential role in PA-induced hyperactivation of mTORC1. Given that ATP citrate lyase (ACLY) governs “citrate transport” and is responsible for acetyl-CoA transfer from mitochondria (Fig. 4 E), dsRNA-mediated ACLY knockdown was performed in vivo. The results showed that dsACLY decreased the activity of mTORC1 in muscles (Fig. 4 F). Similarly, inhibition of ACLY with BMS-303141 restrained the induction of mTORC1 under PA treatment in fish myocytes (Fig. 4 G), and ACLY knockdown by siRNA (Fig. S3, K and L) also abrogated PA-induced mTORC1 activation in C2C12 myotubes (Fig. 4 H). Furthermore, sodium acetate treatment which can enhance acetyl-CoA levels via acetyl-CoA synthetase 2 (ACSS2) promoted mTORC1 activation in a dose-dependent manner in fish myocytes and C2C12 myotubes (Fig. 4 I). Notably, impaired PA-induced mTORC1 activation by the inhibition of fatty acid β oxidation was rescued by sodium acetate addition in fish myocytes and C2C12 myotubes (Fig. 4 J). These results indicate that PA-provoked mTORC1 activation is dependent on the acetyl-CoA derived from mitochondrial fatty acid β oxidation.
Next, we investigated the role of acetyl-CoA in PA-induced insulin resistance. As expected, the phosphorylation levels of AKT were enhanced in the muscle of fish with dsACLY injection (Fig. 4 F), and sodium acetate addition blocked the recovery of insulin-stimulated glucose uptake and phosphorylation levels of AKT by perhexiline maleate under PA condition (Fig. 4, K and L). Moreover, inhibition of ACLY with BMS-303141 promoted insulin-stimulated phosphorylation levels of AKT in the presence of PA (Fig. 4 M). These results indicate that acetyl-CoA derived from fatty acid β oxidation mainly mediates PA-induced mTORC1 activation and insulin resistance.
PA enhances acetylation of Rheb at lysine 8 (K8) to induce mTORC1 activation and insulin resistance
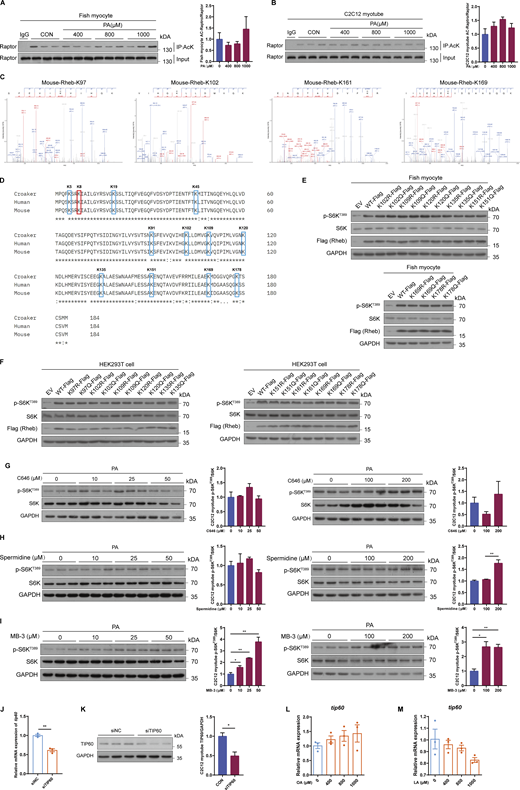
Considering that acetyl-CoA is the direct acetyl donor of acetylation (Menzies et al., 2016) and that previous studies have demonstrated that the increase of Rheb or Raptor acetylation could induce mTORC1 activation (Hu et al., 2021; Son et al., 2019), we evaluated the acetylation levels of Rheb and Raptor under PA treatment to further investigate the exact mechanism of acetyl-CoA-mediated mTORC1 activation. The results showed that PA treatment elevated the acetylation levels of Rheb in a dose-dependent manner (Fig. 5, A and B), but had no effect on the acetylation levels of Raptor (Fig. S4, A and B). Moreover, dietary PO diet also elevated the acetylation levels of Rheb in the muscle of fish (Fig. 5 C). However, inhibition of fatty acid β oxidation by perhexiline maleate attenuated PA-induced Rheb acetylation (Fig. 5, D and E). In contrast, sodium acetate addition enhanced Rheb acetylation in fish myocytes and C2C12 myotubes (Fig. 5 F). Together, these results suggest that the acetylation levels of Rheb are associated with the content of acetyl-CoA derived from fatty acid oxidation under PA condition. Thus, we speculated that Rheb acetylation may mediate acetyl-CoA-induced mTORC1 activation.
To confirm this hypothesis, we first identified the acetylation sites of Rheb. Mass spectrometry analysis (MS) showed one potential acetylation site (K8) in Rheb of large yellow croaker (Fig. 5 G) and five potential acetylation sites (K8, K97, K102, K161, and K169) in Rheb of mouse (Fig. 5 H and Fig. S4 C). Moreover, by conducting sequence alignment of Rheb from the human, mouse, and large yellow croaker, we found 12 conserved lysines (Fig. S4 D). Therefore, to further confirm the acetylation sites of Rheb, we respectively mutated these lysines (K5, K8, K19, K45, K91, K102, K109, K120, K135, K151, K169, and K178) in Rheb of croaker into arginine to mimic deacetylation, or into glutamine to mimic permanent acetylation. Simultaneously, we also separately mutated these lysines (K5, K8, K19, K45, K91, K97, K102, K109, K120, K135, K151, K161, K169, and K178) in Rheb of mouse into arginine or glutamine. Subsequently, we evaluated the effects of these mutants on the activity of mTORC1. We found that compared with Rheb-WT, Rheb-K8R mutant inhibited mTORC1 pathway in fish myocytes and HEK293T cells (Fig. 5, I and J). In contrast, Rheb-K8Q mutant induced mTORC1 activation in fish myocytes and HEK293T cells (Fig. 5, I and J). However, other mutants had little effect on the mTORC1 activity (Fig. 5, I and J; and Fig. S4, E and F). Meanwhile, to reliably validate the importance of lysine 8 acetylation of Rheb in affecting mTORC1 activation, we also ectopically expressed Rheb-K8R mutant or Rheb-K8Q mutant in Rheb knockout (KO) HEK293T cells. The results showed that compared with Rheb-WT, Rheb-K8R mutant significantly reduced mTORC1 activity, but Rheb-K8Q mutant remarkably elevated mTORC1 activity in Rheb KO HEK293T cells (Fig. 5 K). Notably, Rheb-K8R mutant also abolished PA-induced mTORC1 activation in Rheb KO HEK293T cells (Fig. 5 L). Furthermore, we found that mutating K8 to arginine reduced the acetylation levels of Rheb (Fig. 5 M). Therefore, these results demonstrate that K8 is a major acetylation site in Rheb and is highly conserved among species. In addition, the K8 acetylation of Rheb plays a vital role in mTORC1 activation.
Subsequently, we further investigated the mechanism of Rheb K8 acetylation-induced mTORC1 activation. Considering that preceding studies have indicated that Rheb could bind to FK506-binding protein (FKBP) family members, such as FKBP12 and FKBP38, impeding its inhibitory effects on mTORC1 activity (Bai et al., 2007; Hu et al., 2021), we evaluated the effect of Rheb-K8 mutants on the interaction between Rheb and FKBP12 or FKBP38. The results exhibited that Rheb-K8R mutant reduced the interaction between Rheb and FKBP12, or Rheb and FKBP38, whereas Rheb-K8Q mutant had the opposite effects (Fig. 5, N and O). Moreover, we also found that Rheb-K8R mutant induced the interaction between mTOR and FKBP38 (Fig. 5 P). In contrast, Rheb-K8Q mutant reduced the interaction between mTOR and FKBP38 (Fig. 5 P). Together, these results suggest that the K8 acetylation of Rheb promotes its interaction with FKBP family members such as FKBP12 and FKBP38, which hinders the binding and inhibitory effects of FKBP family members on mTORC1, inducing mTORC1 activation.
Given that our above results indicate that acetyl-CoA-induced mTORC1 activation is related to insulin resistance, we assayed the effect of Rheb acetylation on insulin sensitivity. The results showed that Rheb-K8R mutant elevated insulin-stimulated glucose uptake and phosphorylation of AKT, but Rheb-K8Q mutant had the opposite effects (Fig. 5, Q and R). Thus, these results indicate that Rheb acetylation could impair insulin signaling by triggering mTORC1 activation.
Tip60 interacts with and acetylates Rheb to regulate mTORC1 activity and insulin sensitivity under PA condition
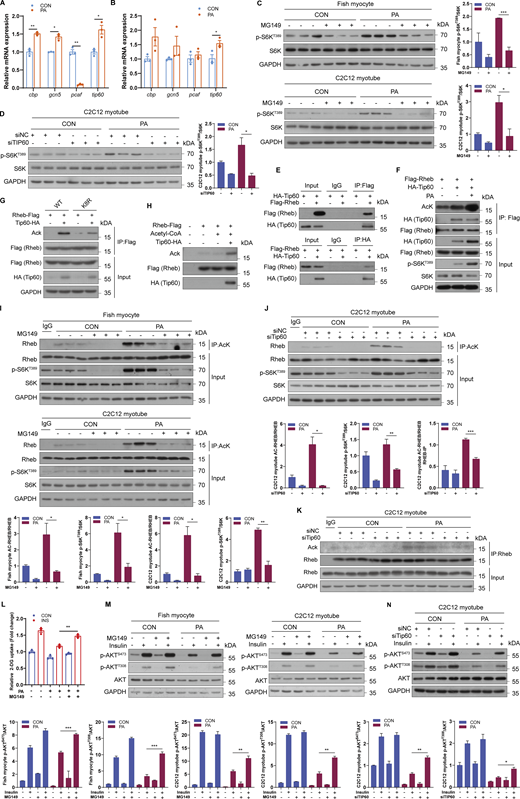
As an increase in acetyl-CoA can activate lysine acetyltransferases (KATs) which are responsible for protein acetylation (Pietrocola et al., 2015), we further identified which KATs mediated the acetylation of Rheb under PA treatment. The mRNA expression levels of cbp, gcn5, and tip60 were elevated under PA treatment (Fig. 6, A and B). Therefore, inhibitors of CBP/P300 (C646 and spermidine), GCN5 (MB-3), and Tip60 (MG149) were used to evaluate whether these KATs mediated the regulation of mTORC1 pathway under PA condition. Inhibiting CBP/P300 or GCN5 did not reduce the activity of mTORC1 under PA condition in C2C12 myotubes (Fig. S4, G–I). However, treated fish myocytes and C2C12 myotubes with Tip60 inhibitor MG149 prevented the induction of mTORC1 activity under PA treatment (Fig. 6 C). Moreover, Tip60 knockdown by siRNA also blocked PA-induced mTORC1 activation in C2C12 myotubes (Fig. 6 D; and Fig. S4, J and K), suggesting that Tip60 may be a potential acetyltransferase to regulate Rheb acetylation and mTORC1 activity under PA condition. To further confirm this hypothesis, we conducted co-immunoprecipitation assays to analyze the interaction between Tip60 and Rheb. The results showed that Tip60 can interact with Rheb in HEK293T cells (Fig. 6 E). Moreover, overexpressed Tip60 reinforced the acetylation of Rheb and phosphorylation levels of S6K in HEK293T cells (Fig. 6 F). However, compared with Rheb-WT, Rheb-K8R mutant abolished Tip60-induced Rheb acetylation (Fig. 6 G), indicating that Tip60 mainly acetylated Rheb at K8. Simultaneously, using the in vitro acetylation assay, we further validated that Tip60 could acetylate Rheb in vitro (Fig. 6 H). Furthermore, pharmacological inhibition of Tip60 by MG149 treatment or Tip60 knockdown by siRNA also impaired PA-induced acetylation of Rheb (Fig. 6, I–K). Notably, OA and LA treatments had no effect on the mRNA expression of tip60, further confirming the role of Tip60 in the regulation of mTORC1 signaling (Fig. S4, L and M). Collectively, these results demonstrate that Tip60 induces mTORC1 activation by acetylating Rheb under PA condition.
Since the above results suggested that Rheb acetylation is associated with insulin resistance in PA condition, we explored whether Tip60 was a potential therapeutic target for insulin resistance. The results showed that inhibited Tip60 by MG149 attenuated PA-induced suppression of insulin-stimulated glucose uptake in fish myocytes (Fig. 6 L). Consistently, inhibited Tip60 by MG149 treatment or siRNA knockdown restored insulin-stimulated phosphorylation of AKT in the presence of PA (Fig. 6, M and N). Together, these results suggest that Tip60, which mediates the regulation of Rheb acetylation, maybe a novel therapeutic target for insulin resistance.
Negative regulation of IRS1 by mTORC1 is associated with PA-induced insulin resistance
To further investigate the mechanism of insulin resistance induced by mTORC1 activation under PA treatment, we measured the effect of PA on IRS1 phosphorylation, considering that mTORC1 signaling is reported to provoke the serine phosphorylation of IRS1 (Leontieva et al., 2014; Ozes et al., 2001). The results showed that dietary PO diet intensified the S636/S639 phosphorylation of IRS1 in fish muscle compared with CON diet (Fig. 7 A). In line with the in vivo results, PA treatment elevated S636/S639 phosphorylation but decreased the Y612 phosphorylation of IRS1 in a dose-dependent manner in fish myocytes and C2C12 myotubes (Fig. 7 B). Moreover, incubating fish myocytes and C2C12 myotubes with rapamycin or Torin1 (mTOR inhibitor) blocked the increase of IRS1 S636/S639 phosphorylation levels induced by PA treatment (Fig. 7 C), but MHY1485 treatment aggravated the induction of IRS1 S636/S639 phosphorylation levels under PA treatment (Fig. 7 D). Thus, these results indicated that PA-induced alteration of IRS1 phosphorylation is dependent on mTORC1 signaling, which may contribute to insulin resistance. Intriguingly, we further detected the mRNA levels of irs1 under PA condition and found that fish fed PO diet had significantly lower mRNA levels of irs1 in muscle compared with the CON diet (Fig. 7 E). Likewise, PA treatment strongly reduced the mRNA levels of irs1 in fish myocytes and C2C12 myotubes (Fig. 7, F and G). Nevertheless, PA had little effect on the mRNA levels of insr and irs2 in vivo and in vitro (Fig. 7, E–G). Furthermore, rapamycin and Torin1 treatments attenuated the decrease of irs1 mRNA levels under PA treatment in fish myocytes and C2C12 myotubes (Fig. 7 H). These results indicate that PA-induced mTORC1 activation contributes to the inhibition of IRS1 transcription. Given the role of IRS1 in insulin signaling, we also analyzed the expression of IRS1 under OA and LA treatments. The results showed that OA or LA treatment failed to reduce the mRNA levels of irs1 in vivo (Fig. S5 A) and in vitro (Fig. S5 B). Collectively, these results imply that alterations of IRS1 phosphorylation and transcription by mTORC1 are involved in the insulin resistance induced by PA.
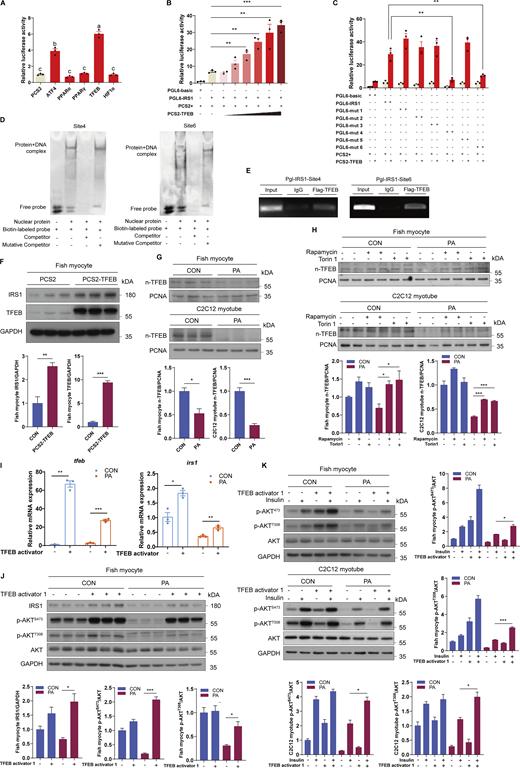
PA inhibits the nuclear translocation of TFEB to impede IRS1 transcription
Given that downstream transcription factors of mTORC1 may mediate the regulation of gene transcription, we explored which downstream transcription factor was involved in the inhibition of IRS1 transcription under PA treatment. Dual luciferase experiments in HEK293T cells showed that TFEB had the strongest ability to elevate the luciferase activity of the IRS1 promoter among the crucial downstream transcription factors of mTORC1 (Fig. 8 A). Moreover, TFEB enhanced the promoter activity of IRS1 in a dose-dependent manner (Fig. 8 B), and mutations of the predicted TFEB binding site 4 and site 6 in IRS1 promoter significantly reduced the promoter activity of IRS1 in HEK293T cells (Fig. 8 C). Furthermore, chromatin immunoprecipitation assay (ChIP) and electrophoretic mobility shift assay (EMSA) in HEK293T cells verified that TFEB can directly bind to the IRS1 promoter at site 4 and site 6 (Fig. 8, D and E). Importantly, overexpression of TFEB in fish myocytes also strongly increased the protein expression levels of IRS1 (Fig. 8 F). These results suggest that TFEB can promote IRS1 transcription by binding to the IRS1 promoter region. Next, the effect of PA on TFEB cellular localization was assayed via cell fractionation analyses and the results showed that PA treatment prevented the nuclear translocation of TFEB in fish myocytes and C2C12 myotubes (Fig. 8 G). Considering that mTORC1 controls TFEB nuclear translocation by phosphorylating TFEB at Ser211 (Martina et al., 2012), fish myocytes and C2C12 myotubes were treated with rapamycin or Torin1 in the presence of PA. These two inhibitors improved the nuclear translocation of TFEB under PA treatment (Fig. 8 H), suggesting that PA-induced mTORC1 activation contributes to defective nuclear translocation of TFEB, which may induce suppression of IRS1 transcription and subsequent insulin resistance. To further prove this notion, cultured cells were treated with TFEB activator 1, a synthesized curcumin derivative that can specifically bind to TFEB and induce TFEB nuclear translocation (Song et al., 2016). The results showed that TFEB activator 1 treatment blocked the decline in IRS1 mRNA and protein expression levels under the PA condition (Fig. 8, I and J). Furthermore, insulin-stimulated phosphorylation levels of AKT in the presence of PA were improved by TFEB activator 1 treatment in fish myocytes and C2C12 myotubes (Fig. 8 K). Taken together, these results indicate that PA-induced mTORC1 activation leads to cytoplasmic localization of TFEB, which inhibits IRS1 transcription and causes insulin resistance.
Discussion
Dietary habits can affect metabolic homeostasis and are associated with multiple diseases. Previous studies in mammals have shown that dietary HFD can lead to insulin resistance and glucose intolerance (Hancock et al., 2008; Matsuzawa-Nagata et al., 2008), indicating a strong correlation between lipid overload and the development of T2D (Palomer et al., 2018). However, not all types of fatty acids can induce insulin resistance. Studies in humans have shown that replacing a monounsaturated fatty acid (MFA) diet with an SFA diet could lead to the impairment of the insulin pathway, and dietary PA diet also induced more extreme insulin resistance in human skeletal muscle than dietary OA diet (Sarabhai et al., 2022; Vessby et al., 2001). These above studies suggest that the divergent effects of fatty acids on insulin signaling may depend on saturation, whereas the underlying mechanisms remain largely obscure. Here, consistent with previous studies, we found that PA contributed to systemic and cellular insulin resistance, but OA or LA had little impact on insulin sensitivity in vivo and in vitro. Notably, we observed that in contrast to other AKT downstream kinases, the activity of mTORC1 was boosted in a time- and dose-dependent manner under PA treatments. However, OA and LA failed to promote mTORC1 activity. Moreover, inhibition of mTORC1 by rapamycin attenuated PA-induced insulin resistance, while activating mTORC1 by MHY1485 aggravated PA-induced insulin resistance. These results indicate that SFA-induced insulin resistance is dependent on the hyperactivation of mTORC1.
mTORC1 is a critical connection between nutritional status and metabolic regulation. As more and more amino acid sensors have been identified in recent years, the mechanisms of amino acid–induced mTORC1 activation have been well established (Saxton and Sabatini, 2017). However, progress in determining the mechanisms of fatty acid-induced mTORC1 activation is limited. A recent study suggested that PA can induce the activation of mTORC1 through regulating STING1-TBK1-SQSTM1 pathway (Liu et al., 2022). Another study indicated that fatty acid–mediated regulation of mTORC1 activity was dependent on the de novo synthesis of phosphatidic acid (Menon et al., 2017). However, it is still unknown whether there are other mechanisms involved in the activation of mTORC1 by fatty acids. In this study, we found that PA-induced mTORC1 activation was dependent on mitochondrial fatty acid β oxidation. Moreover, our results also showed that acetyl-CoA derived from mitochondrial fatty acid β oxidation induced mTORC1 activation under PA treatment, indicating that acetyl-CoA may be a novel insight linking fatty acid β oxidation and mTORC1 signaling. Consistent with our study, a study in prostate cancer cells suggested that inhibited fatty acid β oxidation by etomoxir reduced mTORC1 activity (Schlaepfer et al., 2014), and another study found that deleting CPT1B specifically in skeletal muscle of mice suppressed mTORC1 by provoking AMPK activation (Vandanmagsar et al., 2016). Paradoxically, unlike other studies, a recent study found that mice with heart-specific CPT2-deficient exhibited the induction of mTORC1 pathway (Pereyra et al., 2017). Thus, the effects of fatty acid β oxidation on mTORC1 pathway are complicated and may differ under variable physiological and pathological conditions. Further studies are needed to further determine the sophisticated role of fatty acid β oxidation in the regulation of mTORC1 signaling.
In this study, using LC–MS we showed that PA treatment increased the contents of short/medium-chain acyl-CoA and acylcarnitine in comparison with OA or LA treatment. Moreover, seahorse real-time cell metabolic analysis showed that the PA treatment group had higher mitochondrial OCR and maximal oxygen consumption rates than the OA or LA treatment group. Likewise, PA-induced increase of fatty acid oxidation-related gene expressions was more robust than OA or LA in vivo and in vitro. Importantly, using [1-14C]-palmitic acid or [1-14C]-oleic acid, we found that PA produced more [14C]-CO2 and [14C]-ASMs than OA in fish myocytes. Consistent with our results, Bakke et al. (2012) demonstrated that PA showed a lower accumulation than OA, but PA was oxidized to a relatively higher extent than OA in human myotubes. Moreover, considering that the β-oxidation of UFAs requires the additional involvement of 2,4-dienoyl-CoA reductase (You et al., 1989), the β-oxidation of SFAs may be more efficient. Thus, we speculate that skeletal muscle cells may prefer to utilize PA for fatty acid oxidation. Previous studies have found that OA is more inclined to synthesize triglycerides to induce the formation of lipid droplets than PA (Chen et al., 2023; Plötz et al., 2016). Likewise, we also found that OA significantly increased the contents of 18:1-CoA in comparison with PA. Thus, we speculate that skeletal muscle cells may prefer to utilize OA to synthesize triglyceride for storage. Meanwhile, LA is considered to be a precursor of arachidonic acid and can be converted to a myriad of bioactive compounds called eicosanoids (Whelan and Fritsche, 2013). Considering the results showed that LA markedly elevated the contents of 18:2-CoA and 18:3-CoA, we conjecture that skeletal muscle cells may prefer to utilize LA to synthesize functional lipids. Thus, the differences in the preference of fatty acid oxidation for PA, OA, and LA in skeletal muscle cells may lead to variations in their effects on mTORC1 activity. However, the current understanding of differences in fatty acid oxidation between SFAs and UFAs is insufficient, so more studies are needed in the future to further explore the underlying mechanisms behind these differences.
Acetyl-CoA is not only a metabolite of the TCA cycle but also serves as a substrate for acetylation modification. A previous study reported that acetyl-CoA derived from fatty acid oxidation promoted lymphangiogenesis by facilitating p300-mediated acetylation of histones at lymphangiogenic genes (Wong et al., 2017). Moreover, another study showed that acetyl-CoA produced by fatty acid oxidation contributed to the aggressive growth of glioblastoma multiforme by upregulating NF-κB/RelA acetylation (Jiang et al., 2022). Similarly, a previous study in our lab also showed that acetyl-CoA derived from fatty acid oxidation could increase p65 acetylation to intensify inflammation (Chen et al., 2021). In this study, we found that acetyl-CoA derived from fatty acid oxidation could induce Rheb acetylation to trigger mTORC1 activation and insulin resistance. Thus, it is noteworthy that acetyl-CoA derived from fatty acid oxidation may play a crucial role in the regulation of cellular function and metabolism by affecting specific protein acetylation under multiple physiological or pathological conditions.
Recently, Hu et al. (2021) reported that K8 was a major acetylation site for Rheb in humans. Moreover, they found that promoting K8 acetylation of Rheb could induce mTORC1 activation by keeping FKBP12 away from mTORC1 to abolish its inhibitory effect on mTORC1 (Hu et al., 2021). Consistent with these results, our study also identified K8 as a conserved acetylation site for Rheb in large yellow croaker and mouse. Notably, using point mutation assay, we found that K8 acetylation of Rheb played a vital role in PA-induced mTORC1 activation. Simultaneously, we demonstrated that K8 acetylation of Rheb also induced the interaction between Rheb with FKBP12. Together, our results, along with the results from Hu et al., indicate that K8 acetylation of Rheb may induce mTORC1 activation by hindering FKBP12 to inhibit mTORC1. Considering that Bai et al. (2007) demonstrated that Rheb could also interact with another FKBP family member FKBP38 to impede the suppressive effect of FKBP38 on mTORC1 and induce mTORC1 activation, we further evaluated the effects of K8 acetylation of Rheb on the interaction between Rheb and FKBP38, or FKBP38 and mTOR. The results showed that K8 acetylation indeed promoted the binding of Rheb and FKBP38, which reduced the interaction between FKBP38 and mTOR. Therefore, we consider that FKBP family members, such as FKBP12 and FKBP38, may be pivotal mediators linking Rheb K8 acetylation to mTORC1 activation. In addition, the results from Bai et al. also showed that serum or amino acid stimulation could induce the interaction between Rheb and FKBP38 to trigger mTORC1 activation, but the underlying mechanism remained not fully understood (Bai et al., 2007). Interestingly, another study by Hu et al. found that serum or amino acid stimulation could promote the acetylation of Rheb (Hu et al., 2021). Thus, the induction of Rheb acetylation may also provide one piece of evidence for why serum or amino acid stimulation promoted the interaction between Rheb and FKBP38.
In addition to the involvement of substrate acetyl-CoA, acetylation modification usually requires the engagement of acetyltransferases. A recent study showed that CBP has the strongest ability to acetylate Rheb in HEK293T cells (Hu et al., 2021). However, in our study, inhibition of CBP by C646 or spermidine failed to alleviate PA-induced mTORC1 activation, suggesting that other acetyltransferases may mediate Rheb acetylation under the PA condition. Subsequently, we found that suppression of Tip60 by pharmacological inhibitor or siRNA knockdown relieved the induction of Rheb acetylation and mTORC1 activation under PA condition. In contrast, overexpression of Tip60 induced the acetylation of Rheb-WT but had little effect on the acetylation of Rheb-K8R. Additionally, Co-IP assays and in vitro acetylation assays further indicated that Tip60 could acetylate Rheb to activate mTORC1 signaling. Thus, our study identified a novel role for Tip60 in regulating mTORC1 signaling and insulin sensitivity. In line with our results, a recent study also found that Tip60 can regulate triacylglycerol synthesis by acetylating lipin 1 in response to fatty acids stimulation (Li et al., 2018). Therefore, Tip60 may be a vital node connecting fatty acid sensing and acetylation modification. Furthermore, we also found that reducing Rheb acetylation by inhibiting ACLY or Tip60 ameliorated PA-induced insulin resistance. Considering that chronic suppression of mTORC1 by pharmacological inhibitors such as rapamycin leads to glucose intolerance through hindering mTORC2, targeting mitochondrial fatty acid β oxidation mediated acetyl-CoA production or Tip60-mediated Rheb acetylation may provide novel therapeutic opportunities for lipid surplus-induced T2D.
Aberrant regulation of mTORC1 is associated with the development of T2D. Numerous studies have unveiled that mTORC1 activation induces phosphorylation-dependent degradation of IRS1 to impede insulin signaling (Shah et al., 2004; Um et al., 2004). However, whether mTORC1 signaling could regulate the transcription of IRS1 remains elusive. Consistent with previous studies, our current results also showed that PA reinforced the S636/S639 phosphorylation of IRS1 in a mTORC1-dependent manner. Notably, the mRNA expression of irs1 was decreased by PA. However, rapamycin or Torin1 treatment upregulated the mRNA expression of irs1 under PA treatment, indicating that mTORC1 signaling also mediated the transcriptional regulation of IRS1. Furthermore, by using dual luciferase experiments, we also identified that TFEB may play an important role in regulating IRS1 transcription, and this notion was strongly supported by the results from ChIP and EMSA assays. Moreover, our study also showed that PA treatment inhibited the nuclear translocation of TFEB by activating mTORC1 pathway. However, promoted TFEB expression by TFEB activator 1 attenuated PA-induced insulin resistance. Consistent with our results, a study in adipose tissue macrophages showed that lysosomal stress response activated TFEB–GDF15 pathway to protect against obesity and insulin resistance (Kim et al., 2021). Therefore, besides regulating lysosomal biogenesis and autophagy, TFEB may also serve as a vital modulator of glucose homeostasis and insulin sensitivity, which may provide a novel mechanistic clue for developing therapeutic strategies to combat T2D.
In summary, our work unveiled that PA increased the production of acetyl-CoA from mitochondrial fatty acid β oxidation and enhanced Tip60-mediated Rheb acetylation, which induced the interaction between Rheb and FKBPs, promoting the activation of mTORC1. Subsequently, hyperactivation of mTORC1 boosted serine phosphorylation of IRS1 and inhibited TFEB-mediated transcription of IRS1, leading to insulin resistance (Fig. 9). Our results provide molecular insights into the mechanism by which acetylated Rheb induces mTORC1 activation and insulin resistance and uncover a novel role of Tip60 in regulating the mTORC1 pathway and insulin sensitivity. In addition, our findings may provide one piece of conserved mechanism for SFA-induced insulin resistance and open a promising therapeutic avenue to improve insulin sensitivity.
Materials and methods
Animal studies
4-mo-old large yellow croakers of similar size (mean weight 15.67 ± 0.11 g) were obtained from the Aquatic Seeds Farm of the Marine and Fishery Science and Technology Innovation Base (Ningbo, China) and bred in floating sea cages at 26.8 ± 3°C, 30.8–35.7‰ salinity and 6–7 mg/l dissolved oxygen. The fish were randomly divided into four groups that were fed diverse experimental diets. Four isonitrogenous (42% crude protein) and isolipidic (12% crude lipid) experimental diets were formulated containing a control diet (fish oil as a source of dietary fat), which is suitable for large yellow croaker growth, PA-rich diet (palm oil as a source of dietary fat), OA rich diet (olive oil as a source of dietary fat), and LA rich diet (soybean oil as a source of dietary fat). The fatty acid profiles of these four diets are listed in Table S1. The male and female fish were fed each diet twice a day at 05:00 and 17:00 for 10 wk. At the end of the feeding trial, MS222 (1:10,000; Sigma-Aldrich) was used to anesthetize the fish, and the liver, muscle, and plasma of the fish were sampled for subsequent analysis.
DsRNA was synthesized using the TranscriptAid T7 High Yield Transcription Kit (Thermo Fisher Scientific) according to the manufacturer’s instructions. Fish were intraperitoneally injected with dsRNA-control, dsRNA-CPT1B, or dsRNA-ACLY for 36 h at a dose of 2 μg/g according to the body weight. The sampling collection was the same as described above.
In the current study, all experimental procedures performed on fish were conducted in strict accordance with the Management Rule of Laboratory Animals (Chinese Order No. 676 of the State Council, revised 1 March 2017).
Cell culture
Fish myocytes were isolated from large yellow croaker according to the following methods. Muscle tissues were removed and placed in sterile phosphate buffer (PBS; Biological Industries) containing penicillin (Solarbio) and streptomycin (Solarbio). Then, tissues were cut into small pieces in Dulbecco’s modified Eagle medium/Ham’s F12 medium (1:1) (DMEM/F12; Biological Industries) and washed twice with DMEM/F12 medium to remove serum. Subsequently, tissues were digested with 0.2% trypsin (Thermo Fisher Scientific) for 20 min and washed twice with DMEM/F12 medium. Later, after digestion with 0.1% trypsin for another 10 min and neutralization with DMEM/F12 medium with fetal bovine serum (FBS; Biological Industries), the cell precipitates were resuspended in DMEM complete medium composed of DMEM/F12 medium supplemented with 15% FBS, 100 U penicillin, and 100 mg/ml streptomycin. After cell passaging, fish myocytes were seeded into culture plates and incubated at 28°C under 5% CO2.
Mouse C2C12 myoblast cells were obtained from the Cell Bank of the Chinese Academy of Sciences (Shanghai, China) and were cultured in Dulbecco’s modified Eagle medium (DMEM; Biological Industries) supplemented with 10% FBS, 100 U/ml penicillin, and 100 mg/ml streptomycin within an atmosphere of 5% CO2 at 37°C. To induce differentiation and myotube formation, 10% FBS was substituted by 2% horse serum (Gibco) in DMEM with penicillin and streptomycin. After 5 days, the differentiated myotubes were used for subsequent assays.
HEK293T cells were obtained from the Cell Bank of the Chinese Academy of Sciences (Shanghai, China) and were cultured in DMEM supplemented with 10% FBS, 100 U/ml penicillin, and 100 mg/ml streptomycin at 37°C with 5% CO2.
Rheb KO HEK293T cells were obtained from Beyotime Biotechnology and were cultured in DMEM supplemented with 10% FBS, 100 U/ml penicillin, 100 mg/ml streptomycin, and 1 µg/ml puromycin at 37°C with 5% CO2.
Cell treatments
For PA, OA, or LA in vitro treatment, fatty acid–free BSA (Equitech-Bio) was dissolved in FBS-free DMEM at room temperature according to the ratio 1:100 (1 g fatty-acid free BSA: 100 ml FBS-free DMEM). 500 mg PA (Cat#P0500; Merck), OA (Cat#O1008; Merck), or LA (Cat#L1376; Merck) was dissolved in 10 ml ethanol to obtain PA, OA, or LA stock solution, respectively. Then PA, OA, or LA stock solution was blow-dried with nitrogen gas, dissolved in 0.1 M NaOH, and warmed at 75°C until clear to obtain 100 mM PA, OA, or LA solution. Subsequently, 100 mM PA, OA, or LA solution was added to 1% BSA solution according to the ratio 1:100 (100 mM PA:1% BSA, vol/vol) at 50°C. Finally, the mixture was filtered using a 0.45 μM filter and stored at −20°C. Fatty acid treatment was carried out by incubating fish myocytes, C2C12 myotubes, HEK293T cells, or Rheb KO HEK293T cells with serum-free media containing the indicated concentrations of PA, OA, or LA for 12–24 h.
For insulin in vitro treatment, insulin powder (Merck) was dissolved in hydrochloric acid (pH = 2) to obtain 1 mg/ml stock solution. Insulin stimulation was performed by treating fish myocytes or C2C12 myotubes with 100 nM insulin for 5 min.
For rapamycin or Torin1 in vitro treatment, rapamycin (#HY-10219; Med Chem Express) or Torin1 (#HY-13003; Med Chem Express) was dissolved in dimethyl sulfoxide (DMSO; Solarbio) to obtain 1 mM stock solution respectively. To inhibit mTORC1, 500 nM rapamycin or 500 nM Torin1 treatment was added to the culture medium of fish myocytes or C2C12 myotubes for 12 h in the presence or absence of PA.
For MHY1485 in vitro treatment, MHY1485 (#HY-B0795; Med Chem Express) was dissolved in DMSO (Solarbio) to obtain 10 mM stock solutions. To activate mTORC1, 10 μM MHY1485 was added to the culture medium of fish primary myocyte for 12 h in the presence or absence of PA.
For etomoxir or perhexiline maleate in vitro treatments, etomoxir (#HY-50202; Med Chem Express) or perhexiline maleate (#HY-B1334A; Med Chem Express) was dissolved in DMSO (Solarbio) to obtain 50 mM stock solution, respectively. To inhibit mitochondrial fatty acid β oxidation, 50 μM etomoxir or 25 μM perhexiline maleate was added to the culture medium of fish myocytes or C2C12 myotubes for 12 h in the presence or absence of PA.
For BMS-303141 treatment, BMS-303141 (#HY-16107; Med Chem Express) was dissolved in DMSO (Solarbio) to obtain 25 mM stock solutions. To inhibit ACLY, 25 μM BMS-303141 was added to the culture medium of fish myocytes for 12 h in the presence or absence of PA.
For sodium acetate treatment, sodium acetate (#S2889; Merck) was dissolved in ultrapure water from a Milli-Q water system to obtain a 5 M stock solution. To increase the content of cellular acetyl-CoA, the indicated concentrations of sodium acetate were added to the culture medium of fish myocytes and C2C12 myotubes for 12 h in the presence or absence of PA.
For C646, spermidine, or MB-3 treatment, C646 (#HY-13823; Med Chem Express), spermidine (#HY-B1776; Med Chem Express), or MB-3 (#M2449; Merck) was dissolved in DMSO (Solarbio) to obtain 50 mM stock solution, respectively. To inhibit CBP/P300, the indicated concentrations of C646 or spermidine were added to the culture medium of C2C12 myotubes for 12 h in the presence of PA. To inhibit GCN5, the indicated concentrations of MB-3 were added to the culture medium of C2C12 myotubes for 12 h in the presence of PA.
For MG149 treatment, MG149 (#HY-15887; Med Chem Express) was dissolved in DMSO (Solarbio) to obtain a 150 mM stock solution. To inhibit Tip60, 150 μM MG149 was added to the culture medium of fish myocytes or C2C12 myotubes for 12 h in the presence or absence of PA.
For TFEB activator 1 treatment, TFEB activator 1 (#HY-135825; Med Chem Express) was dissolved in DMSO (Solarbio) to obtain 10 mM stock solution. To activate TFEB, 15 μM TFEB activator 1 was added to the culture medium of fish myocytes and C2C12 myotubes for 12 h in the presence or absence of PA.
siRNA transfection
C2C12 cells were seeded in plates with DMEM containing 10% FBS and then differentiated for 5 days with DMEM containing 2% horse serum. Differentiated myotubes were transiently transfected with siRNAs (siRNAs against CPT1B, CPT2, ACLY, or Tip60 and scramble siRNA were commercially synthesized [GenePharma]) using Lipofectamine RNAiMAX (Invitrogen) according to the manufacturer’s instructions. Knockdown efficiency was verified by quantitative PCR and immunoblotting. The siRNA sequences used are listed in Table S2.
NEFA, TG, glucose, and insulin content assays
The plasma NEFA level was measured by the non-esterified fatty acids (NEFA) assay kit according to the manufacturer’s instructions (Nanjing Jiancheng Bio-Engineering Institute, Nanjing, China). The TG content was analyzed by the triglyceride (TG) content assay kit (Applygen Technologies Inc.). The fasted blood glucose and insulin contents were tested by the glucose assay kit (Applygen Technologies Inc.) and fish INS ELISA assay kit (CUSABIO Technology) according to the manufacturer’s instructions.
ITT and GTT
Assays were carried out on large yellow croaker fed CON diet or PO diet after 10 wk. For GTTs, fish were fasted for 24 h and then intraperitoneally injected with glucose (0.9 g/kg body weight). Blood was sampled at 0, 0.5, 1, 2, 4, and 8 h after injection with glucose. For ITTs, fish were fasted for 24 h and then intraperitoneally injected with insulin (0.052 mg/kg body weight). Blood was sampled at 0, 0.5, 1, 2, 4, and 8 h after injection with insulin.
Glucose uptake
Glucose uptake was detected by 2-DG uptake assays using a Glucose Uptake-Glo Assay (J1341; Promega) according to the manufacturer’s instructions. In brief, cells plated in 96-well plates were incubated with the indicated treatments without serum or glucose and stimulated with 100 nM insulin for 1 h. Then after treatment with 2-DG for 10 min, cells were lysed in stop buffer and neutralized with neutralization buffer. The lysates were treated with 2DG6P detection reagent and luminescence was recorded in 0.5-s intervals.
Acyl-CoA and acyl-carnitine quantification by LC/MS
Fish myocytes were incubated with 800 μM PA, OA, or LA for 12 h before collection and freezing. Analysis of acyl-CoAs and acyl-carnitines was carried out at LipidALL Technologies as previously described (Lam et al., 2020). Briefly, 300 μl of extraction buffer containing isopropanol, 50 mM KH2PO4, and 50 mg/ml BSA (25:25:1 vol/vol/vol) acidified with glacial acetic acid was added to cells. Next, 19:0-CoA and d3-16:0-carnitine were added as internal standards and lipids were extracted by incubation at 4°C for 1 h at 1,500 rpm. Following this, 300 μl of petroleum ether was added and the sample was centrifuged at 12,000 rpm for 2 min at 4°C. The upper phase was removed. The samples were extracted two more times with petroleum ether as described above. To the lower phase finally remaining, 5 μl of saturated ammonium sulfate was added followed by 600 μl of chloroform:methanol (1:2 vol/vol). The sample was then incubated on a thermomixer at 450 rpm for 20 min at 25°C, followed by centrifugation at 12,000 rpm for 5 min at 4°C. Clean supernatant containing long-chain acyl-CoAs was transferred to a fresh tube and subsequently dried in the SpeedVac under OH mode (Genevac). To improve the recovery of polar short-chain CoAs, the remaining pellet was extracted with 1 ml trichloroacetic acid. The acidic extract was purified by solid phase extraction using Oasis HLB 1 cm3 (30 mg) SPE columns from Waters. The purified extract containing polar CoAs was dried in a SpeedVac under OH mode. The two extracts were combined and resuspended in methanol:water (9:1 vol/vol) containing 0.05% acetic acid and analyzed on a Shimadzu 40X3B-UPLC coupled to Sciex QTRAP 6500 Plus.
Metabolic flux analysis
For metabolic-tracing analyses, fish myocytes were exposed to 800 μM [U-13C16]-palmitate (#605573; Merck) for 24 h. Analysis of acyl-CoAs was carried out at LipidALL Technologies as previously described (Lam et al., 2020) and followed the same steps as described in the acyl-CoA and acyl-carnitine quantification by LC/MS.
Oxygen consumption rate (OCR) measurement
Oxygen consumption rate (OCR) was measured using the seahorse XF 24 Flux Analyzer (Seahorse Biosciences) according to the manufacturer’s protocol. Briefly, fish myocytes were planted in a XF24-well plate (Seahorse Biosciences) and were treated with PA, OA, or LA for 12 h before OCR measurement. Then myocytes were incubated with unbuffered assay media at 37°C in ambient CO2 for 1 h. The OCRs of different states were measured by treating myocytes with oligomycin (1.5 μM), FCCP (2 μM), and antimycin and rotenone (0.5 μM), respectively. Myocytes were then collected for the determination of protein content (BCA).
RNA extraction and reverse transcriptase-quantitative PCR (RT-qPCR)
Total RNA from tissues and cells was extracted using TRIzol reagent (Takara) and reversed transcribed into first-strand cDNA using the PrimeScript RT Reagent Kit (Takara) according to the manufacturer’s instructions. RT-qPCR was carried out using SYBR qPCR MasterMix (Vazyme). To calculate the expression of genes, the mRNA expression of genes was normalized to the expression of the β-actin gene, and the comparative cycle threshold (CT) method (2−ΔΔCT method) was employed. The primers used for qPCR are listed in Table S2.
Acetyl-CoA measurement
The intracellular acetyl-CoA content was assayed using an Acetyl-Coenzyme A Assay Kit (MAK039; Sigma-Aldrich) according to the manufacturer’s instructions. Briefly, the samples were deproteinized by perchloric acid and Acetyl-CoA Quencher, and Quench Remover were added to the samples to correct for background. Then the samples were mixed with reaction buffer and incubated for 10 min at 37°C. The fluorescence was tested using a plate reader and the following settings: λex535 nm; λem 587 nm.
In vitro acetylation assay
Recombinant Rheb was isolated from Escherichia coli. Tip60-HA was purified from HEK293T with anti-HA beads. Recombinant Rheb was incubated with Tip60-HA and acetyl-CoA in HAT buffer (50 mM Tris-HCl, pH 8.0, 5% glycerol, 0.1 mM EDTA, 50 mM KCl, 1 mM DTT, 1 mM PMSF, 10 mM sodium butyrate) for 1 h at 37°C. After incubation, the reaction was terminated by the addition of 5× SDS loading buffer and subjected to SDS-PAGE analysis.
Western blot analysis
Total proteins were extracted from tissues and cells using RIPA lysis buffer (Solarbio) containing protease and phosphatase inhibitors (Roche). Nuclear protein was collected using NE-PER Nuclear and Cytoplasmic Extraction Reagents (Thermo Fisher Scientific) according to the manufacturer’s instructions. Equivalent amounts of denatured protein homogenate were resolved by SDS-PAGE on polyacrylamide gels and transferred to a polyvinylidene difluoride membrane (Millipore). After blocking at room temperature for 2 h, the membranes were incubated with primary antibodies overnight. Then the membranes were incubated with secondary antibodies and visualized with BeyoECL Plus Reagent (Beyotime Biotechnology). Antibodies against Phospho-AKT (Ser473) (#4060), Phospho-AKT (Thr308) (#13038), AKT (#9272), Phospho-S6K (Thr389) (#9205), S6K (#9202), Phospho-S6 (Ser240/244) (#5364), S6 (#2217), Phospho-GSK-3β (Ser9) (#5558), GSK-3β (#12456), Phospho-AS160 (Thr642) (#8881), AS160 (#2670), Rheb (#13879), Raptor (#2280), Phospho-IRS-1 (Ser636/639) (#2388), IRS1 (#3407), PCNA (#13110), Acetylated-Lysine (#9441), DYKDDDDK Tag (#14793), and HA Tag (#3724) were purchased from Cell Signaling Technology. Antibodies against CPT1B (#22170-1-AP), CPT2 (#26555-1-AP), and Tip60 (#10827-1-AP) were purchased from Proteintech. Antibodies against Phospho-IRS1 (Y612) (#MAB7314) were purchased from RnD systems. Antibody against TFEB (#NB100-1030) was obtained from Novus. Antibody against GAPDH (#TA-08) and HRP-conjugated secondary antibodies were purchased from Golden Bridge Biotechnology.
Plasmid constructs
For expression plasmids, the open reading frames (ORFs) of Rheb, Tip60, ATF4, PPARα, PPARγ, TFEB, and HIF1α of the large yellow croaker were amplified and subcloned into the PCS2 vector. A FLAG tag was inserted into the pcDN13.1-TFEB (croaker) expression plasmid or PCS2-Rheb (croaker) expression plasmid. A HA tag was inserted into PCS2-Tip60 (croaker) expression plasmid. The pcDNA3.1-Tip60 (mouse)-HA plasmid was purchased from Youbio. The pEnCMV-Rheb (mouse)-3×Flag and the pLV3-CMV-Mtor (mouse)-3×Flag plasmids were purchased from Miaolingbio. The ORFs of FKBP12 and FKBP38 of the mouse or croaker were amplified and subcloned into the PCS2 vector. A HA tag was inserted into the PCS2-FKBP12 (mouse), PCS2-FKBP12 (croaker), or PCS2-FKBP38 (mouse) expression plasmid. For reporter plasmids, the IRS1 wild-type promoter fragment was cloned from the large yellow croaker genomic DNA and then subcloned into the PGL6 vector. The TFEB binding sites on the IRS1 promoter fragment were predicted using the online JASPAR (http://jaspar.genereg.net/) and the IRS1 mutated-type promoter fragments (PGL6-1-mut, PGL6-2-mut, PGL6-3-mut, PGL6-4-mut, PGL6-5-mut, and PGL6-6-mut) were generated by in vitro site-directed mutagenesis (Vazyme). The PCS2-Rheb (croaker)-Flag mutated fragments and the pEnCMV-Rheb (mouse)-3×Flag mutated fragments were also generated by in vitro site-directed mutagenesis (Vazyme). The primers used are listed in Table S2.
Immunoprecipitation (IP) and co-immunoprecipitation (Co-IP)
For IP analyses, after treatment, cells were lysed with Cell Lysis Buffer for western Blotting and IP (Beyotime Biotechnology) for 20 min. Then, moderate amounts of anti-AcK beads (Cytoskeleton, Inc.) or antibodies to Rheb (#13879; Cell Signaling Technology) were added to the lysate and incubated for 12 h at 4°C. The immunoprecipitates were washed five times with lysis buffer and mixed with loading buffer. Then, the denatured mixture was analyzed by immunoblotting.
For Co-IP, HEK293T cells were lysed with Cell Lysis Buffer for western Blotting and IP (Beyotime Biotechnology) for 20 min after transfection with the indicated plasmids for 48 h. Then, the lysates were incubated with ANTI-Flag M2 Affinity Gel (Sigma-Aldrich) or Pierce anti-HA agarose (Thermo Fisher Scientific) at 4°C for 8–12 h. After washing with the lysis buffer and TBST five times, the binding components were eluted using the Flag peptide (MedChem Express) or HA peptide (MedChem Express) and analyzed by immunoblotting.
Mass spectrometry analysis (MS)
For mass spectrometry analysis, 10-cm dishes of HEK293T cells were transfected with Rheb (mouse)-3×Flag or Rheb (croaker)-Flag. After 36 h transfection, the anti-Flag immunoprecipitations (IP) were performed with the whole cell lysates derived from the HEK293T cells in the presence of Deacetylase Inhibitor Cocktail (#HY-K0030; Med Chem Express). The immunoprecipitate was resolved by SDS-PAGE and the acetylation site was detected by mass spectrum analysis (supported by PTM Biolabs, Inc.).
Radioactive fatty acid oxidation measurements
For measurement of palmitic acid and oleic acid oxidation, cells were incubated in DMEM/F12 medium supplied with 0.5 μCi/ml [1-14C]-palmitic acid or [1-14C]-oleic acid (PerkinElmer), 1 mM nonradioactive palmitic acid or oleic acid, 10 mM HEPES, and 1% fatty acid–free BSA (Equitech-Bio). Produced 14CO2 on the filter paper and 14C-ASM in the supernatant were determined by scintillation counting (PerkinElmer). Values were normalized to protein quantification of cell lysates.
Dual-luciferase reporter assay
HEK293T cells were seeded in 24-well plates and transfected with the expression vector, the promoter reporter vector, and the pRL-CMV Renilla luciferase plasmid using Lipofectamine 2000 reagent (Invitrogen). After transfection for 24 h, cells were harvested and the luciferase activity was measured using the Dual-Luciferase Reporter Assay SystemKit (TransGen Biotech Co., Ltd.) according to the manufacturer’s instructions.
Chromatin immunoprecipitation assay (ChIP)
The pcDNA3.1-TFEB-Flag vector and the PGL6-IRS1 promoter vector were co-transfected into HEK293T cells. After 48 h, the HEK293 cells were fixed with formaldehyde at 37°C for 10 min and were analyzed using a ChIP Assay kit (Beyotime Biotechnology) according to the manufacturer’s instructions. The immunoprecipitated DNA was assayed using primers specific for the IRS1 promoter region by PCR. The primers used for ChIP are listed in Table S2.
Electrophoretic mobility shift assay (EMSA)
HEK293T cells were transfected with the PCS2-TFEB vector. After 48 h, the nuclear protein was collected with NE-PER Nuclear and Cytoplasmic Extraction Reagents (Thermo Fisher Scientific). The sequences of 5′-biotin-labeled double-stranded oligomers are listed in Table S2. Then, the DNA–protein interaction was detected with a LightShiftTM Chemiluminescent electrophoretic mobility shift assay (EMSA) kit (Thermo Fisher Scientific). The primers used for EMSA are listed in Table S2.
Statistical analysis
The data are presented as the means ± SEM and were analyzed using independent t tests for two groups and one-way ANOVA with Tukey’s test for multiple groups in SPSS 23.0 software. P < 0.05 was considered to indicate statistical significance. The number of replicates for each experiment is indicated in the figure legends.
Online supplemental material
Fig. S1 shows that OA and LA have no effect on systemic and cellular glucose homeostasis and insulin sensitivity, related to Fig. 1. Fig. S2 shows that OA and LA have no effect on mTORC1 activity, related to Fig. 2. Fig. S3 shows that acetyl-CoA derived from mitochondrial fatty acid β oxidation triggers mTORC1 activation and insulin resistance under PA condition, related to Fig. 3 and Fig. 4. Fig. S4 shows that Tip60 regulates mTORC1 activity and insulin sensitivity through acetylating Rheb under PA treatment, related to Fig. 5 and Fig. 6. Fig. S5 shows the effect of OA and LA on the relative mRNA expression levels of irs1, related to Fig. 7. Table S1 lists fatty acid profiles of the experimental diets used in this study. Table S2 lists sequences of the primers used in this study. Table S3 shows the data of acyl-CoA and acyl-carnitine quantification by LC-MS. Table S4 shows the data of metabolic flux analysis fractional abundance.
Data availability
All data are available from the corresponding author upon request.
Acknowledgments
We also acknowledge Patrick J. Stover (Texas A&M University), Shihuan Kuang (Purdue University), Xiaowei Chen (Peking University), Zhaocai Zhou (Fudan University), Li Xu (Tsinghua University), and Baowei Jiao (Kunming Institute of Zoology, Chinese Academy of Sciences) for their constructive suggestions on the experimental design and revising article. We thank Yanjiao Zhang, Jianlong Du, Yongnan Li, Xiang Xu, Shangzhe Han, and Wencong Lai from the Ocean University of China for their experimental assistance.
This work was supported by the Key Program of the National Natural Science Foundation of China (31830103), the National Science Fund for Distinguished Young Scholars of China (31525024), the Ten-thousand Talents Program (2018–29), the Agriculture Research System of China (CARS47-11), and Scientific and Technological Innovation of Blue Granary (2018YFD0900402).
Author contributions: Z. Zhao: Conceptualization, Data curation, Formal analysis, Investigation, Methodology, Validation, Visualization, Writing - original draft, Writing - review & editing, Q. Chen: Investigation, Validation, X. Xiang: Investigation, Validation, W. Dai: Conceptualization, Writing - review & editing, W. Fang: Investigation, K. Cui: Investigation, B. Li: Validation, Q. Liu: Investigation, Y. Liu: Validation, Y. Shen: Validation, Y. Li: Writing - review & editing, W. Xu: Writing - review & editing, K. Mai: Supervision, Writing - review & editing, Q. Ai: Conceptualization, Funding acquisition, Project administration, Resources, Supervision, Writing - original draft, Writing - review & editing.
References
Author notes
Disclosures: The authors declare no competing interests exist.