


Under endoplasmic reticulum (ER) stress (ERS), cells initiate the unfolded protein response (UPR) to maintain ER homeostasis. Recent studies revealed ERS transmission between cells and tissues, by activating the cell-nonautonomous UPR in cells that do not experience ERS directly. Here, we report that ERS triggers a rapid release of ceramide independent of the UPR, but requiring the acid sphingomyelinase activity. Carried by lipoproteins, ceramide is delivered to receiving cells to induce the UPR and regulate cell functions at multiple aspects, including lipid accumulation, cell death, and cytokine production. Mechanistically, extracellular ceramide stimulates ceramide synthesis at the transcription level in receiving cells, leading to ceramide accumulation in the ER so as to reduce membrane fluidity to disrupt ER calcium homeostasis, thus activating the UPR. Sphingomyelin counterbalanced the effect of ceramide. UPR induction is the frontline response to protect cells from ceramide insult. Our study suggests ceramide-mediated ERS transmission as a universal cell–cell communication model regulating a wide range of physiological events.
Introduction
The endoplasmic reticulum (ER) plays a central role in protein folding and trafficking. Disruption of these processes may result in the accumulation of misfolded proteins in the ER lumen, a condition called “ER stress (ERS).” Upon ERS, cells initiate the unfolded protein response (UPR) that consists of three branches—IRE1α, PERK, and ATF6—to assist in protein folding and secretion. Stemming from the ER, the UPR is not only important for the maintenance of the ER homeostasis, but also a multifaceted regulator of many physiological events, for example, cell differentiation, inflammation, metabolism, and brain physiology (Hetz et al., 2020).
In recent years, accumulating evidence suggests that the impact of ERS can go beyond individual cells. In particular, cells undergoing ERS propagate the UPR signals to other cells or tissues, which has been observed in various systems, ranging from neuron–intestine to tumor–immune cell interactions (Avril et al., 2017; Imanikia et al., 2019; Mahadevan et al., 2011, 2012; McNally et al., 2022; Ozbey et al., 2020; Sprenkle et al., 2019; Taylor and Dillin, 2013; Tirosh et al., 2020; Wei et al., 2019; Williams et al., 2014; Zhang et al., 2017). In some cases, the origin of the intercellular UPR propagation has been attributed to the XBP1 signaling downstream of IRE1α in neurons as donor cells (Ozbey et al., 2020; Taylor and Dillin, 2013; Williams et al., 2014). A study in Caenorhabditis elegans revealed tyramine as the intertissue signaling molecule secreted by interneurons to elicit the intestinal UPR (Ozbey et al., 2020). Work on mammals showed that palmitate-stimulated myotubes secret long-chain ceramide (Cer) to activate the UPR in nonstressed myotubes (McNally et al., 2022). However, whether such a mechanism also applies to other systems is still unknown.
Previous studies have revealed the link between ERS and metabolic diseases. UPR markers are observed in adipose tissue, liver, pancreatic islets, and hypothalamus in obesity, indicating the onset of ERS (Boden et al., 2008; Chan et al., 2013; Fu et al., 2011; Gregor et al., 2009; Nakatani et al., 2005; Ozcan et al., 2004, 2009; Sharma et al., 2008). Genetic ablation of the UPR components impairs β-cell function (Harding et al., 2001; Hassler et al., 2015; Lee et al., 2011) and hepatic lipid homeostasis (Lee et al., 2008; Rutkowski et al., 2008; Wang et al., 2012; Yamamoto et al., 2010). Many metabolic diseases, including diabetes, obesity, and fatty liver disease, are characterized by complex systematic disorders in multiple tissues and organs. Therefore, a study on the intercellular crosstalk in the context of ERS could advance our understanding of the pathology of such diseases.
Here, we reported that adipocyte that experiences ERS delivers Cer, in the form of lipoprotein, to hepatocyte, leading to the UPR activation via decreasing the membrane fluidity. The release of Cer is a rapid process at the post-transcriptional level. Sphingomyelin (SM) counterbalanced the effect of Cer. Lipid-mediated ERS transmission between various types of cells regulates cell function at multiple aspects, suggesting the universality and importance of Cer signaling between cells.
Results
Lipid-mediated cell-nonautonomous UPR is universal among various types of cells
To study the mechanism of cell-nonautonomous UPR, we generated conditioned medium (CM) by pretreating differentiated mouse adipocyte 3T3-L1 for 2 h with thapsigargin (Tg), a sarco/endoplasmic reticulum calcium ATPase (SERCA) inhibitor that induces ERS, followed by culturing cells in fresh medium for another 6 h to allow the “transmissible factor” to secrete. A <1-min treatment of Tg was applied to produce the control medium (Ctrl). CM or Ctrl was then transferred to the mouse hepatocyte AML12, and the UPR signal in AML12 was examined (Fig. 1 A). Treatment with differentiated 3T3-L1–derived CM for 6 h elicited robust Xbp1 splicing in AML-12, the hallmark of the UPR, which was not seen in Ctrl treatment (Fig. 1 B). In addition, the UPR markers, including mRNA of Bip, Chop, Pdi, and Erdj4, and the level of phosphorylated IRE1α (p-IRE1α) and PERK (p-PERK), as well as the protein level of XBP1s and BiP, were markedly upregulated (Fig. 1, C and D). Transcriptome profiling and the KEGG enrichment analysis revealed significant enrichment of differentially expressed genes in protein processing in the ER in CM-treated AML12 (Fig. 1 E). In primary hepatocytes isolated from C57BL/6 mice, CM also led to a significant elevation of IRE1α and PERK phosphorylation, as well as XBP1s and BiP expression (Fig. 1 F). To rule out the possibility of the pleiotropic effect of Tg, we utilized tunicamycin (Tm), another ERS inducer that inhibits N-linked glycosylation to generate CM, and found that CM produced in such a way activated the UPR in AML12 cells similar to that generated using Tg (Fig. S1 A).
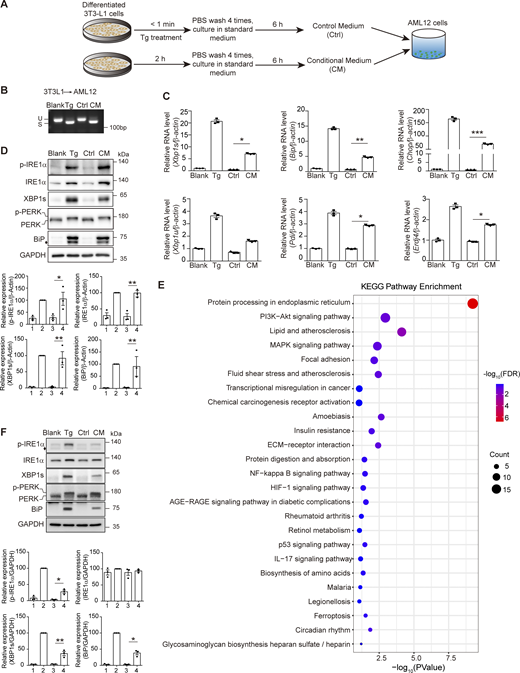
Adipocytes undergoing ERS release functional molecular parts to induce the UPR in hepatocytes. (A) Schematic of the experimental design. (B) Agarose gel of Xbp1 cDNA amplicons from Ctrl/CM-treated AML12. Cells with no treatment (Blank) or 0.2 μM Tg treatment (Tg) are for controls. U, unspliced Xbp1; S, spliced Xbp1. (C) RT-qPCR of mRNA of the UPR markers in AML12 treated as in B. The statistical analyses were performed using an unpaired t test, two-tailed. Data were shown as the mean ± SEM, n = 3. *P < 0.05, **P < 0.01, ***P < 0.001. (D) Upper panel, western blot of p-IRE1α, XBP1s, p-PERK, and BiP in AML12 treated as in B. p-PERK was determined by a slower band shift due to phosphorylation. The diamond indicates the nonspecific band. Lower panel, quantification of protein levels. Lanes were numbered from left to right, with the ratio in lane 2 (Tg treatment) set as 100. The statistical analyses were performed using an unpaired t test, two-tailed. Data were shown as the mean ± SEM, n = 3. *P < 0.05, **P < 0.01. (E) KEGG enrichment analysis of genes with |log2 (fold change)| >0.5 in AML12 treated with CM for 6 h, with Ctrl treatment as the control. FDR, false discovery rate. (F) Upper panel, western blot of p-IRE1α, XBP1s, p-PERK, and BiP in primary mouse hepatocytes treated as in B. p-PERK was determined by a slower band shift due to phosphorylation. The diamond indicates the nonspecific band. Lower panel, quantification of protein levels. Lanes were numbered from left to right, with the ratio in lane 2 (Tg treatment) set as 100. The statistical analyses were performed using an unpaired t test, two-tailed. Data were shown as the mean ± SEM, n = 3. *P < 0.05, **P < 0.01. Source data are available for this figure: SourceData F1.
Adipocytes undergoing ERS release functional molecular parts to induce the UPR in hepatocytes. (A) Schematic of the experimental design. (B) Agarose gel of Xbp1 cDNA amplicons from Ctrl/CM-treated AML12. Cells with no treatment (Blank) or 0.2 μM Tg treatment (Tg) are for controls. U, unspliced Xbp1; S, spliced Xbp1. (C) RT-qPCR of mRNA of the UPR markers in AML12 treated as in B. The statistical analyses were performed using an unpaired t test, two-tailed. Data were shown as the mean ± SEM, n = 3. *P < 0.05, **P < 0.01, ***P < 0.001. (D) Upper panel, western blot of p-IRE1α, XBP1s, p-PERK, and BiP in AML12 treated as in B. p-PERK was determined by a slower band shift due to phosphorylation. The diamond indicates the nonspecific band. Lower panel, quantification of protein levels. Lanes were numbered from left to right, with the ratio in lane 2 (Tg treatment) set as 100. The statistical analyses were performed using an unpaired t test, two-tailed. Data were shown as the mean ± SEM, n = 3. *P < 0.05, **P < 0.01. (E) KEGG enrichment analysis of genes with |log2 (fold change)| >0.5 in AML12 treated with CM for 6 h, with Ctrl treatment as the control. FDR, false discovery rate. (F) Upper panel, western blot of p-IRE1α, XBP1s, p-PERK, and BiP in primary mouse hepatocytes treated as in B. p-PERK was determined by a slower band shift due to phosphorylation. The diamond indicates the nonspecific band. Lower panel, quantification of protein levels. Lanes were numbered from left to right, with the ratio in lane 2 (Tg treatment) set as 100. The statistical analyses were performed using an unpaired t test, two-tailed. Data were shown as the mean ± SEM, n = 3. *P < 0.05, **P < 0.01. Source data are available for this figure: SourceData F1.
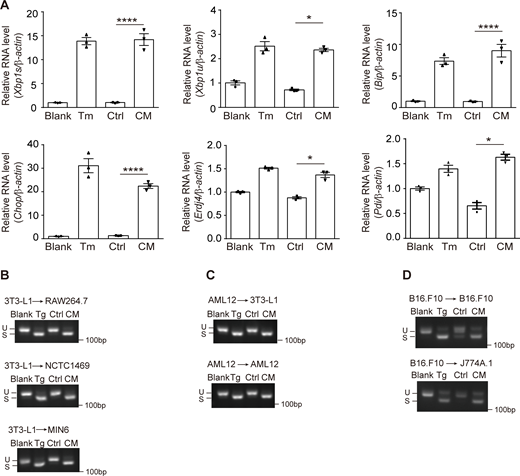
Cell-nonautonomous UPR activation occurred in different types of donor-receiving cells. (A) RT-qPCR of UPR marker genes in AML12 treated with Ctrl/CM derived from 5 μg/ml Tm-challenged 3T3-L1. The statistical analyses were performed using unpaired t tests, two-tailed. Data were shown as the mean ± SEM, n = 3. *P < 0.05, ****P < 0.0001. (B–D) Agarose gel of Xbp1 cDNA amplicons in Ctrl/CM-treated cells. Donor and receiving cells were indicated as donor → receiving cell. Source data are available for this figure: SourceData FS1.
Cell-nonautonomous UPR activation occurred in different types of donor-receiving cells. (A) RT-qPCR of UPR marker genes in AML12 treated with Ctrl/CM derived from 5 μg/ml Tm-challenged 3T3-L1. The statistical analyses were performed using unpaired t tests, two-tailed. Data were shown as the mean ± SEM, n = 3. *P < 0.05, ****P < 0.0001. (B–D) Agarose gel of Xbp1 cDNA amplicons in Ctrl/CM-treated cells. Donor and receiving cells were indicated as donor → receiving cell. Source data are available for this figure: SourceData FS1.
We employed various cell lines including the murine macrophage RAW267.4, murine liver cell line NCTC1469, and pancreatic β cell line MIN6 as the receiving cell, and found that all of them exhibited Xbp1 splicing upon 3T3-L1–derived CM treatment (Fig. S1 B). With AML12 being the donor cell, we saw CM-induced Xbp1 splicing in both 3T3-L1 and AML12 (Fig. S1 C). CM-induced UPR also occurred between tumor cell line (mouse melanoma cell line B16.F10) and macrophage (J774A.1), as well as 293T and 293T cells (Fig. S1 D and Fig. S2 A). Therefore, the phenomenon that ER-stressed cell–derived CM provokes the UPR in receiving cells is universal among different types of cells.
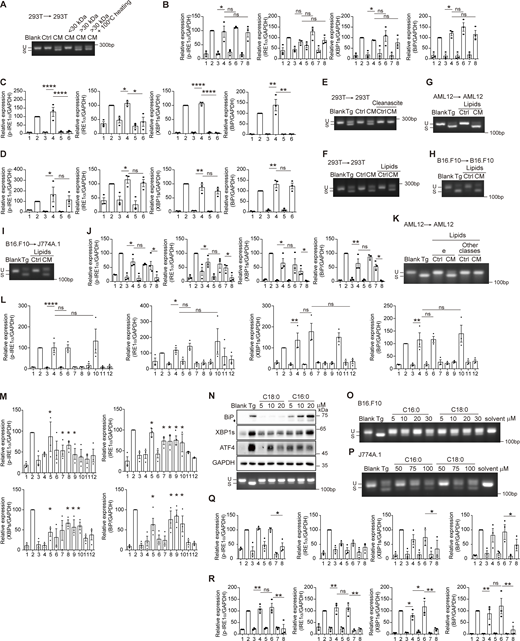
Lipid-mediated cell-nonautonomous UPR activation in different types of donor-receiving cells. (A) Agarose gel of Xbp1 cDNA amplicons in Ctrl/CM-treated cells 293T → 293T, medium fractions with M.W. > 30 kDa and/or 100°C heating were used. U, unspliced Xbp1; S, spliced Xbp1. (B–D) Quantification of protein levels in Fig. 2 A (B), Fig. 2 B (C), and Fig. 2 C (D). The statistical analyses were calculated by one-way ANOVA. Lanes were numbered from left to right, with the ratio in lane 2 (Tg treatment) set as 100. Data were shown as the mean ± SEM, n = 3. *P < 0.05; **P < 0.01; ***P < 0.001; ****P < 0.0001; ns, not significant. (E–I) Agarose gel of Xbp1 cDNA amplicons in receiving cells with different donor → receiving cell systems. Cleanascite-treated medium (E) and lipid extracts from medium (F–I) were used. (J) Quantification of protein levels in Fig. 2 D. The statistical analyses were calculated by one-way ANOVA. Lanes were numbered from left to right, with the ratio in lane 2 (Tg treatment) set as 100. Data were shown as the mean ± SEM, n = 3. *P < 0.05; **P < 0.01; ns, not significant. (K) Agarose gel of Xbp1 cDNA amplicons from AML12 treated by various species of CM-extracted lipids. CM was derived from AML12. Lipids were fractionated as in Fig. 2 E. Other classes was a combination of FA+PhL+Residue+a+b+c+d. (L) Quantification of protein levels in Fig. 2 F. The statistical analyses were calculated by one-way ANOVA. Lanes were numbered from left to right, with the ratio in lane 2 (Tg treatment) set as 100. Data were shown as the mean ± SEM, n = 3. *P < 0.05; **P < 0.01; ****P < 0.0001; ns, not significant. (M) Quantification of protein levels in Fig. 2 I. Lanes were numbered from left to right, with the ratio in lane 2 (Tg treatment) set as 100. The statistical analyses were calculated using an unpaired t test, two-tailed. Each lane (3–12) was compared with lane 1, and only significant upregulation was denoted. Data were shown as the mean ± SEM, n = 3. *P < 0.05. (N) Western blot of BiP, XBP1s, and ATF4 (upper panel) and agarose gel of Xbp1 cDNA amplicons (lower panel) in AML12 treated with Cer. C18:0, Cer d18:1/18:0; C16:0, Cer d18:1/16:0. The diamond indicates the nonspecific band. (O and P) Agarose gel of Xbp1 cDNA amplicons in B16.F10 (O) and J774A.1 (P) treated with Cer for 6 h. (Q) Quantification of protein levels in Fig. 2 L. Lanes were numbered from left to right. The statistical analyses were calculated using an unpaired t test, two-tailed. Only lanes 6 and 8 are compared. Data were shown as the mean ± SEM, n = 3. *P < 0.05; ns, not significant. (R) Quantification of protein levels in Fig. 2 M. Lanes were numbered from left to right, with the ratio in lane 2 (Tg treatment) set as 100. The statistical analyses were calculated using one-way ANOVA. Data were shown as the mean ± SEM, n = 3. *P < 0.05; **P < 0.01; ns, not significant. Source data are available for this figure: SourceData FS2.
Lipid-mediated cell-nonautonomous UPR activation in different types of donor-receiving cells. (A) Agarose gel of Xbp1 cDNA amplicons in Ctrl/CM-treated cells 293T → 293T, medium fractions with M.W. > 30 kDa and/or 100°C heating were used. U, unspliced Xbp1; S, spliced Xbp1. (B–D) Quantification of protein levels in Fig. 2 A (B), Fig. 2 B (C), and Fig. 2 C (D). The statistical analyses were calculated by one-way ANOVA. Lanes were numbered from left to right, with the ratio in lane 2 (Tg treatment) set as 100. Data were shown as the mean ± SEM, n = 3. *P < 0.05; **P < 0.01; ***P < 0.001; ****P < 0.0001; ns, not significant. (E–I) Agarose gel of Xbp1 cDNA amplicons in receiving cells with different donor → receiving cell systems. Cleanascite-treated medium (E) and lipid extracts from medium (F–I) were used. (J) Quantification of protein levels in Fig. 2 D. The statistical analyses were calculated by one-way ANOVA. Lanes were numbered from left to right, with the ratio in lane 2 (Tg treatment) set as 100. Data were shown as the mean ± SEM, n = 3. *P < 0.05; **P < 0.01; ns, not significant. (K) Agarose gel of Xbp1 cDNA amplicons from AML12 treated by various species of CM-extracted lipids. CM was derived from AML12. Lipids were fractionated as in Fig. 2 E. Other classes was a combination of FA+PhL+Residue+a+b+c+d. (L) Quantification of protein levels in Fig. 2 F. The statistical analyses were calculated by one-way ANOVA. Lanes were numbered from left to right, with the ratio in lane 2 (Tg treatment) set as 100. Data were shown as the mean ± SEM, n = 3. *P < 0.05; **P < 0.01; ****P < 0.0001; ns, not significant. (M) Quantification of protein levels in Fig. 2 I. Lanes were numbered from left to right, with the ratio in lane 2 (Tg treatment) set as 100. The statistical analyses were calculated using an unpaired t test, two-tailed. Each lane (3–12) was compared with lane 1, and only significant upregulation was denoted. Data were shown as the mean ± SEM, n = 3. *P < 0.05. (N) Western blot of BiP, XBP1s, and ATF4 (upper panel) and agarose gel of Xbp1 cDNA amplicons (lower panel) in AML12 treated with Cer. C18:0, Cer d18:1/18:0; C16:0, Cer d18:1/16:0. The diamond indicates the nonspecific band. (O and P) Agarose gel of Xbp1 cDNA amplicons in B16.F10 (O) and J774A.1 (P) treated with Cer for 6 h. (Q) Quantification of protein levels in Fig. 2 L. Lanes were numbered from left to right. The statistical analyses were calculated using an unpaired t test, two-tailed. Only lanes 6 and 8 are compared. Data were shown as the mean ± SEM, n = 3. *P < 0.05; ns, not significant. (R) Quantification of protein levels in Fig. 2 M. Lanes were numbered from left to right, with the ratio in lane 2 (Tg treatment) set as 100. The statistical analyses were calculated using one-way ANOVA. Data were shown as the mean ± SEM, n = 3. *P < 0.05; **P < 0.01; ns, not significant. Source data are available for this figure: SourceData FS2.
We next tried to characterize the signaling molecules in CM that elicited cell-nonautonomous UPR. After filtration, the effective part resided in the fraction with a molecular mass >30 kDa and showed resistance to heating at 100°C (Fig. 2 A; and Fig. S2, A and B). Interestingly, treatment with a lipid removal reagent Cleanascite eliminated the effect of CM in inducing Xbp1 splicing (Fig. 2 B and Fig. S2 C). Meanwhile, lipids extracted from CM fully recapitulated the effect of CM (Fig. 2 C and Fig. S2 D). The role of lipids was further confirmed by taking 293T-293T, AML12-AML12, B16.F10-B16.F10, and B16.F10-J774A.1 as donor-receiving cells (Fig. S2, E–I). The above results pinpointed lipids as the universal factor to relay the ERS signals between cells.
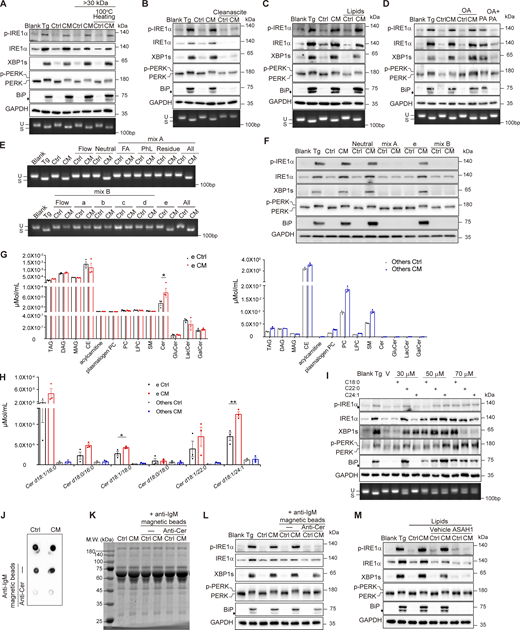
Adipocytes undergoing ERS release Cer to induce the UPR in hepatocytes. (A–C) Western blot of p-IRE1α, XBP1s, p-PERK, and BiP (upper panel) and agarose gel of Xbp1 cDNA amplicons (lower panel) from AML12 treated as in Fig. 1 B. As a substitution for regular Ctrl/CM, fractions with M.W. >30 kDa and/or 100°C heating (A), medium after lipid removal with Cleanascite (Cleanascite: sample, 1:2, vol/vol) (B), or lipid extracts from equivalent volume of original medium (C) were used. The diamond indicates the nonspecific band. (D) Western blot of p-IRE1α, XBP1s, p-PERK, and BiP (upper panel) and agarose gel of Xbp1 cDNA amplicons (lower panel) from Ctrl/CM-treated AML12, with or without OA (200 μM). PA (500 μM) ± OA treatments were used as controls. The diamond indicates the nonspecific band. OA, oleic acid; PA, palmitic acid. (E) Agarose gel of Xbp1 cDNA amplicons from AML12 treated by various species of CM-extracted lipids. CM was derived from 3T3-L1. (Upper panel) Effect of flow-through (Flow), neutral lipids (Neutral), fatty acids (FA), phospholipids (PhL), and residual species (Residue) separated using the Bond Elut NH2 column. Lipid fractions were combined and examined (All). (Lower panel) Neutral lipids were further fractionated into a–e according to lipid polarities and examined. (F) Western blot of p-IRE1α, XBP1s, p-PERK, and BiP in AML12 treated by various species of CM extracted as in E. (G) Bar graph of lipidomics data (μmol/ml) of part e and all the other lipid classes (FA+PhL+Residue+a+b+c+d) from (E). The statistical analyses were performed using an unpaired t test, two-tailed. Data were shown as the mean ± SEM, n = 3. *P < 0.05. (H) Bar graph of Cer (μmol/ml) of part e and other lipid classes from E. The statistical analyses were performed using an unpaired t test, two-tailed. Data were shown as the mean ± SEM. *P < 0.05, **P < 0.01. (I) Western blot of p-IRE1α, XBP1s, p-PERK, and BiP (upper panel) and agarose gel of Xbp1 cDNA amplicons (lower panel) from AML12 treated with Cer alone for 4 h. The diamond indicates the nonspecific band. V, vehicle of Cer; C18:0, Cer d18:1/18:0; C22:0, Cer d18:1/22:0; C24:1, Cer d18:1/24:1. (J–L) Cer in 3T3-L1–derived Ctrl/CM were eliminated by anti-Cer antibody. (J) Dot blot analysis of Cer content in Ctrl/CM before and after Cer depletion. (K) Coomassie brilliant blue staining of Ctrl/CM before and after Cer depletion. (L) Western blot of p-IRE1α, XBP1s, p-PERK, and BiP in AML12 treated with Ctrl/CM obtained as in J and K. The diamond indicates the nonspecific band. (M) Western blot of p-IRE1α, XBP1s, p-PERK, and BiP in AML12 treated with 1 μg acid ceramidase (ASAH1)–pretreated Ctrl/CM-extracted lipids. The diamond indicates the nonspecific band. Source data are available for this figure: SourceData F2.
Adipocytes undergoing ERS release Cer to induce the UPR in hepatocytes. (A–C) Western blot of p-IRE1α, XBP1s, p-PERK, and BiP (upper panel) and agarose gel of Xbp1 cDNA amplicons (lower panel) from AML12 treated as in Fig. 1 B. As a substitution for regular Ctrl/CM, fractions with M.W. >30 kDa and/or 100°C heating (A), medium after lipid removal with Cleanascite (Cleanascite: sample, 1:2, vol/vol) (B), or lipid extracts from equivalent volume of original medium (C) were used. The diamond indicates the nonspecific band. (D) Western blot of p-IRE1α, XBP1s, p-PERK, and BiP (upper panel) and agarose gel of Xbp1 cDNA amplicons (lower panel) from Ctrl/CM-treated AML12, with or without OA (200 μM). PA (500 μM) ± OA treatments were used as controls. The diamond indicates the nonspecific band. OA, oleic acid; PA, palmitic acid. (E) Agarose gel of Xbp1 cDNA amplicons from AML12 treated by various species of CM-extracted lipids. CM was derived from 3T3-L1. (Upper panel) Effect of flow-through (Flow), neutral lipids (Neutral), fatty acids (FA), phospholipids (PhL), and residual species (Residue) separated using the Bond Elut NH2 column. Lipid fractions were combined and examined (All). (Lower panel) Neutral lipids were further fractionated into a–e according to lipid polarities and examined. (F) Western blot of p-IRE1α, XBP1s, p-PERK, and BiP in AML12 treated by various species of CM extracted as in E. (G) Bar graph of lipidomics data (μmol/ml) of part e and all the other lipid classes (FA+PhL+Residue+a+b+c+d) from (E). The statistical analyses were performed using an unpaired t test, two-tailed. Data were shown as the mean ± SEM, n = 3. *P < 0.05. (H) Bar graph of Cer (μmol/ml) of part e and other lipid classes from E. The statistical analyses were performed using an unpaired t test, two-tailed. Data were shown as the mean ± SEM. *P < 0.05, **P < 0.01. (I) Western blot of p-IRE1α, XBP1s, p-PERK, and BiP (upper panel) and agarose gel of Xbp1 cDNA amplicons (lower panel) from AML12 treated with Cer alone for 4 h. The diamond indicates the nonspecific band. V, vehicle of Cer; C18:0, Cer d18:1/18:0; C22:0, Cer d18:1/22:0; C24:1, Cer d18:1/24:1. (J–L) Cer in 3T3-L1–derived Ctrl/CM were eliminated by anti-Cer antibody. (J) Dot blot analysis of Cer content in Ctrl/CM before and after Cer depletion. (K) Coomassie brilliant blue staining of Ctrl/CM before and after Cer depletion. (L) Western blot of p-IRE1α, XBP1s, p-PERK, and BiP in AML12 treated with Ctrl/CM obtained as in J and K. The diamond indicates the nonspecific band. (M) Western blot of p-IRE1α, XBP1s, p-PERK, and BiP in AML12 treated with 1 μg acid ceramidase (ASAH1)–pretreated Ctrl/CM-extracted lipids. The diamond indicates the nonspecific band. Source data are available for this figure: SourceData F2.
ERS stimulates the release of Cer that activates cell-nonautonomous UPR
Adipocyte produces a large amount of saturated fatty acid (SFA), which has been reported to induce the UPR (Salvadó et al., 2013). If it were SFA that elicited the cell-nonautonomous UPR, the effect of CM would be reversed by oleic acid (OA), an unsaturated fatty acid that has been shown to alleviate the lipotoxicity and mitigate the SFA-evoked UPR. However, although OA was able to repress the palmitate (one kind of SFA)-induced Xbp1 splicing, it could not mask the effect of CM (Fig. 2 D and Fig. S2 J).
To identify the active lipid species, CM-extracted lipids were separated into neutral lipids, fatty acids, and phospholipids. By examining the UPR induction ability in each eluent, we narrowed down the scope of the candidate to neutral lipids, which were further fractionated into five parts according to the molecular polarity. For both differentiated 3T3-L1– and AML12-derived CM, part e was exclusively sufficient to elicit Xbp1 splicing (Fig. 2 E and Fig. S2 K). Part e also induced IRE1α and PERK phosphorylation, as well as XBP1s and BiP expression (Fig. 2 F and Fig. S2 L). Lipidomics mass spectrometry analysis revealed an increased amount of Cer in part e from CM compared with that from Ctrl. Notably, Cer was merely detected in other parts (Fig. 2 G). Among the species of Cer that were detected in our experiment, five out of six was mainly eluted in part e, among which Cer d18:1/18:0 and Cer d18:1/24:1 showed increased concentration in CM-derived part e than that from Ctrl, while Cer d18:1/16:0, Cer d18:0/16:0, and Cer d18:1/22:0 had a trend of an increase in amount (Fig. 2 H). Adding different species of Cer (d18:1/16:0, d18:1/18:0, d18:1/22:0, and d18:1/24:1) to cell culture medium was able to induce the UPR in various types of cells, although the high concentration of Cer is required (Fig. 2 I and Fig. S2, M–P). To clarify whether Cer is necessary for the UPR induction, we used anti-Cer antibody to deplete Cer from the CM without altering the protein amount (Fig. 2, J and K). This greatly crippled the UPR induction ability of CM (Fig. 2 L and Fig. S2 Q). Moreover, pretreatment with human N-acylsphingosine amidohydrolase (acid ceramidase) 1 (ASAH1) also reduced the effect of CM-extracted lipids in the UPR induction (Fig. 2 M and Fig. S2 R). We then concluded that Cer was the key factor in CM that induces the UPR in the receiving cells.
ERS stimulates an acid sphingomyelinase–dependent, rapid release of Cer in an UPR-independent way, which does not require transcriptional upregulation of Cer synthesis–related genes
We wondered whether the UPR activation in donor cells accounted for ERS transmission. To this end, we blocked three UPR branches individually using genetic or pharmacological methods. Knocking out IRE1α, knocking down XBP1, and inhibition of IRE1α with KIRA8, although successfully depleted the IRE1α-XBP1 pathway, did not impair the UPR induction ability of CM (Fig. 3 A). Knocking out PERK or blocking PERK phosphorylation using GSK2606414 also failed to cripple the effect of CM (Fig. 3 B). The activation of ATF6, evidenced by its nuclear translocation, was blocked by ceapin-A7, yet ending up with CM was able to elicit the UPR same as that from ATF6-competent cells (Fig. 3 C). In addition, pretreatment with inhibitors of IRE1α, PERK, and ATF6 in combination also left the UPR induction ability of CM intact (Fig. 3 D). These results suggested that ERS transmission that we observed may not require the three UPR pathways in donor cells. To further clarify this, we performed a transcriptome analysis by RNA-seq on 3T3-L1 cells treated with different doses of Tg, with or without all the three UPR inhibitors. The Xbp1 splicing induction abilities of the CM derived from each condition were also examined. As a result, a 2-h treatment with Tg at either 0.02 μM or 0.2 μM elicited the expression of proteostasis-related genes to almost the same level, yet only the CM from 0.2 μM Tg-treated cells was able to induce Xbp1 splicing (Fig. 3, E and F). In addition, while the UPR inhibitor cocktail only marginally decreased the efficacy of the CM, it almost fully suppressed the Tg-induced expression of the proteostasis-related genes (Fig. 3, E and F). The resistance of the CM efficacy to the UPR blockage, and the inconsistence of the expression level of proteostasis-related genes in donor cells and the induction of Xbp1 splicing in receiving cells argued against the involvement of the three known UPR pathways in the regulation of Tg-induced ERS transmission.
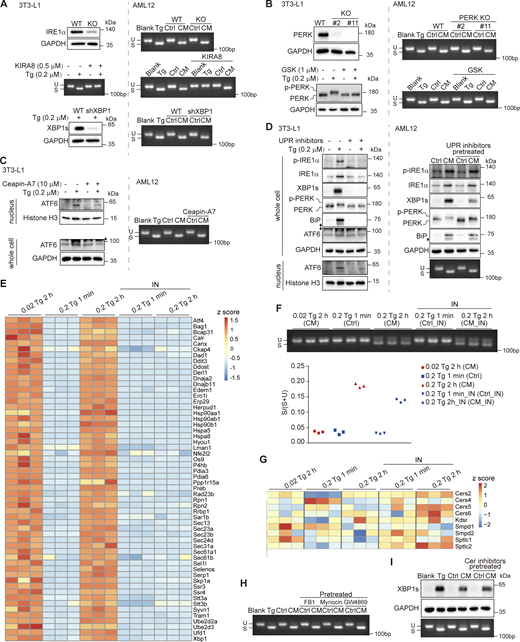
ERS transmission is independent of Cer biosynthesis or UPR activation in donor cells. (A) Ctrl/CM were derived from IRE1α pathway–deficient 3T3-L1 cells. To block IRE1α pathway, IRE1α KO (upper panel), 0.5 μM KIRA8 treatment (middle panel), and XBP1 knockdown by shRNA (lower panel) were used. The blockage efficiency was examined by western blot and PCR of Xbp1 cDNA amplicons shown on the left. The xbp1 splicing–inducing effect of CM in AML12 cells was shown on the right. U, unspliced Xbp1; S, spliced Xbp1. (B) Ctrl/CM were derived from PERK pathway–deficient 3T3-L1 cells. To block the PERK pathway, PERK KO (upper panel) and 1 μM GSK2606414 (GSK) treatment (lower panel) were used. The blockage efficiency was examined by western blot shown on the left. The xbp1 splicing–inducing effect of CM in AML12 cells was shown on the right. U, unspliced Xbp1; S, spliced Xbp1. (C) Ctrl/CM were derived from ATF6 pathway–deficient 3T3-L1 cells. Ceapin-A7 (10 μM) was used to block the activation and nuclear translocation of ATF6. The blockage efficiency was examined by western blot of nuclear and whole cell proteins shown on the left. The xbp1 splicing–inducing effect of CM in AML12 cells was shown on the right. U, unspliced Xbp1; S, spliced Xbp1. (D) Ctrl/CM were derived from 3T3-L1 cells that have all the three UPR pathways blocked with KIRA8, GSK2606414 (GSK), and ceapin-A7 in combination. The blockage efficiency was examined by western blot of p-IRE1α, XBP1s, p-PERK, BiP, ATF6, and nuclear ATF6 in 3T3-L1 shown on the left. The UPR induction effect of CM in AML12 cells was detected by western blot of p-IRE1α, XBP1s, p-PERK, and BiP and agarose gel of Xbp1 cDNA amplicons shown on the right. U, unspliced Xbp1; S, spliced Xbp1. The diamond indicates the nonspecific band. (E) Heatmap (shown as z-score) for proteostasis-related genes in 3T3-L1 with indicated treatment. For UPR inhibitors (IN), KIRA8, GSK2606414, and ceapin-A7 were used in combination. (F) Agarose gel of Xbp1 cDNA amplicons (upper panel) and ratio of the band intensities for S/(S+U) quantified using ImageJ (lower panel). cDNA was from AML12 treated with Ctrl/CM generated as in E. (G) Heatmap (shown as z-score) for Cer synthesis–related genes in 3T3-L1 treated as in E. (H) Ctrl/CM were derived from FB1 (10 μM)-, myriocin (10 μM)-, or GW4869 (20 μM)-pretreated 3T3-L1. Agarose gel of Xbp1 cDNA amplicons from AML12 treated with regular Ctrl/CM or Ctrl/CM as specified. (I) Western blot of XBP1s (upper panel) and agarose gel of Xbp1 cDNA amplicons (lower panel) from AML12 treated with regular or Cer inhibitor–pretreated Ctrl/CM. Cer inhibitors indicate a combination of FB1, myriocin, and GW4869. Source data are available for this figure: SourceData F3.
ERS transmission is independent of Cer biosynthesis or UPR activation in donor cells. (A) Ctrl/CM were derived from IRE1α pathway–deficient 3T3-L1 cells. To block IRE1α pathway, IRE1α KO (upper panel), 0.5 μM KIRA8 treatment (middle panel), and XBP1 knockdown by shRNA (lower panel) were used. The blockage efficiency was examined by western blot and PCR of Xbp1 cDNA amplicons shown on the left. The xbp1 splicing–inducing effect of CM in AML12 cells was shown on the right. U, unspliced Xbp1; S, spliced Xbp1. (B) Ctrl/CM were derived from PERK pathway–deficient 3T3-L1 cells. To block the PERK pathway, PERK KO (upper panel) and 1 μM GSK2606414 (GSK) treatment (lower panel) were used. The blockage efficiency was examined by western blot shown on the left. The xbp1 splicing–inducing effect of CM in AML12 cells was shown on the right. U, unspliced Xbp1; S, spliced Xbp1. (C) Ctrl/CM were derived from ATF6 pathway–deficient 3T3-L1 cells. Ceapin-A7 (10 μM) was used to block the activation and nuclear translocation of ATF6. The blockage efficiency was examined by western blot of nuclear and whole cell proteins shown on the left. The xbp1 splicing–inducing effect of CM in AML12 cells was shown on the right. U, unspliced Xbp1; S, spliced Xbp1. (D) Ctrl/CM were derived from 3T3-L1 cells that have all the three UPR pathways blocked with KIRA8, GSK2606414 (GSK), and ceapin-A7 in combination. The blockage efficiency was examined by western blot of p-IRE1α, XBP1s, p-PERK, BiP, ATF6, and nuclear ATF6 in 3T3-L1 shown on the left. The UPR induction effect of CM in AML12 cells was detected by western blot of p-IRE1α, XBP1s, p-PERK, and BiP and agarose gel of Xbp1 cDNA amplicons shown on the right. U, unspliced Xbp1; S, spliced Xbp1. The diamond indicates the nonspecific band. (E) Heatmap (shown as z-score) for proteostasis-related genes in 3T3-L1 with indicated treatment. For UPR inhibitors (IN), KIRA8, GSK2606414, and ceapin-A7 were used in combination. (F) Agarose gel of Xbp1 cDNA amplicons (upper panel) and ratio of the band intensities for S/(S+U) quantified using ImageJ (lower panel). cDNA was from AML12 treated with Ctrl/CM generated as in E. (G) Heatmap (shown as z-score) for Cer synthesis–related genes in 3T3-L1 treated as in E. (H) Ctrl/CM were derived from FB1 (10 μM)-, myriocin (10 μM)-, or GW4869 (20 μM)-pretreated 3T3-L1. Agarose gel of Xbp1 cDNA amplicons from AML12 treated with regular Ctrl/CM or Ctrl/CM as specified. (I) Western blot of XBP1s (upper panel) and agarose gel of Xbp1 cDNA amplicons (lower panel) from AML12 treated with regular or Cer inhibitor–pretreated Ctrl/CM. Cer inhibitors indicate a combination of FB1, myriocin, and GW4869. Source data are available for this figure: SourceData F3.
The upregulation in the amount of Cer in CM could be due to either activation of its biogenesis or induction of its secretion, or both. Again, there was no clear correlation between the Xbp1 splicing level in receiving cells and the expression level of Cer synthesis–related genes in donor cells, including Sptlc1 and Sptlc2 for serine palmitoyltransferase (SPT), Kdsr for 3-ketodihydrosphingosine reductase, and Cers2/4/5/6 for Cer synthase (Cers) in the de novo synthesis pathway, as well as Smpd1 for acid sphingomyelinase (ASM) and Smpd2 for neutral sphingomyelinase (SMPD2) in the salvage pathway (Fig. 3, F and G). In addition, pretreatment of 3T3-L1 with Cer synthesis inhibitors GW4869, FB1, and myriocin, which target SMPD2, Cers, and SPT, respectively, either individually or in combination, had no influence on the CM-induced Xbp1 splicing, denying the role of transcriptional upregulation of Cer synthesis in donor cells (Fig. 3, H and I).
Sequentially collected CM with total medium replenishment each time exhibited gradually decreasing abilities in inducing the UPR, suggesting that Tg treatment elicited a rapid, transient release of Cer from the donor cell (Fig. 4, A and B). The outer leaflet of the cell membrane is abundant in SM. One possible way for rapid release of Cer is the conversion of SM to Cer at the cell surface. This could be executed by extracellular SMase. ASM has been reported to be secreted via exocytosis of lysosomes in wounded cells for rapid plasma membrane resealing (Tam et al., 2010). We then measured the ASM activity in CM and found that CM showed a significantly higher activity of ASM than Ctrl (Fig. 4 C). The amount of ASM was also higher in CM than in Ctrl (Fig. 4 D). Remarkably, blocking lysosomal proton pump V-ATPase with bafilomycin A1 (Baf A1), pharmacological inhibition of ASM with desipramine (DPA), or disrupting lysosomal secretion with Ca2+ chelator BAPTA-AM reduced the activity and the protein amount of ASM in CM (Fig. 4, C and D). The UPR induction capacity of CM was also decreased if the donor cells were pretreated with Baf A1, DPA, or BAPTA-AM (Fig. 4, E–G). These results suggest that the rapid release of Cer from donor cells could be mediated by the secretory ASM.
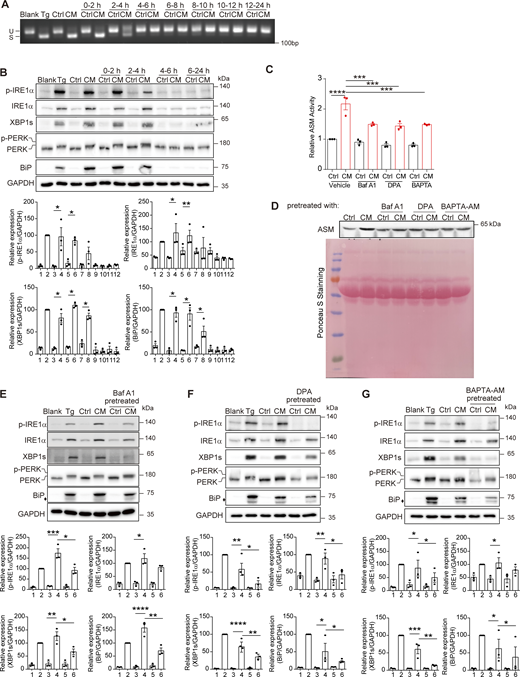
ERS leads to an ASM-dependent, rapid release of Cer. (A) Agarose gel of Xbp1 cDNA amplicons from AML12 treated with Ctrl/CM aliquots obtained at indicated time slots. (B) Western blot of p-IRE1α, XBP1s, p-PERK, and BiP (upper panel) and quantification of protein levels (lower panel) from AML12 treated as in A. The diamond indicates the nonspecific band. Lanes were numbered from left to right, with the ratio in lane 2 (Tg treatment) set as 100. The statistical analyses were calculated by one-way ANOVA. Data were shown as the mean ± SEM, n = 3. *P < 0.05, **P < 0.01. (C and D) ASM activities (C) and western blot of ASM (D) in medium derived from 3T3-L1 pretreated with or without 100 nM Baf A1, 50 μM DPA, or 20 μM BAPTA-AM. The relative ASM activity was calculated by setting the activity of Ctrl_vehicle as 1. The statistical analyses were calculated by one-way ANOVA. Data were shown as the mean ± SEM, n = 3. ***P < 0.001, ****P < 0.0001. (E–G) Western blot of p-IRE1α, XBP1s, p-PERK, and BiP (upper panel) and quantification of protein levels (lower panel) from AML12 treated with regular or (E) Baf A1-, (F) DPA-, and (G) BAPTA-AM–pretreated 3T3-L1–derived Ctrl/CM. The diamond indicates the nonspecific band. Lanes were numbered from left to right, with the ratio in lane 2 (Tg treatment) set as 100. The statistical analyses were calculated by one-way ANOVA. Data were shown as the mean ± SEM, n = 3. *P < 0.05, **P < 0.01, ***P < 0.001, ****P < 0.0001. Source data are available for this figure: SourceData F4.
ERS leads to an ASM-dependent, rapid release of Cer. (A) Agarose gel of Xbp1 cDNA amplicons from AML12 treated with Ctrl/CM aliquots obtained at indicated time slots. (B) Western blot of p-IRE1α, XBP1s, p-PERK, and BiP (upper panel) and quantification of protein levels (lower panel) from AML12 treated as in A. The diamond indicates the nonspecific band. Lanes were numbered from left to right, with the ratio in lane 2 (Tg treatment) set as 100. The statistical analyses were calculated by one-way ANOVA. Data were shown as the mean ± SEM, n = 3. *P < 0.05, **P < 0.01. (C and D) ASM activities (C) and western blot of ASM (D) in medium derived from 3T3-L1 pretreated with or without 100 nM Baf A1, 50 μM DPA, or 20 μM BAPTA-AM. The relative ASM activity was calculated by setting the activity of Ctrl_vehicle as 1. The statistical analyses were calculated by one-way ANOVA. Data were shown as the mean ± SEM, n = 3. ***P < 0.001, ****P < 0.0001. (E–G) Western blot of p-IRE1α, XBP1s, p-PERK, and BiP (upper panel) and quantification of protein levels (lower panel) from AML12 treated with regular or (E) Baf A1-, (F) DPA-, and (G) BAPTA-AM–pretreated 3T3-L1–derived Ctrl/CM. The diamond indicates the nonspecific band. Lanes were numbered from left to right, with the ratio in lane 2 (Tg treatment) set as 100. The statistical analyses were calculated by one-way ANOVA. Data were shown as the mean ± SEM, n = 3. *P < 0.05, **P < 0.01, ***P < 0.001, ****P < 0.0001. Source data are available for this figure: SourceData F4.
Cer is delivered in the form of lipoprotein
As highly hydrophobic molecules, Cer cannot freely diffuse in an aqueous environment. Its impermeability to the filter with a cutoff at 100 kDa also indicated a macromolecule-bound form during transmission (Fig. 5 A). Small extracellular vesicle (sEV) plays important roles in cell–cell communication and has been reported to be abundant in Cer (Kalluri and LeBleu, 2020). However, sEVs isolated from the filtered CM by either size-exclusion chromatography (SEC) or ultracentrifugation failed to elicit Xbp1 splicing, although they presented the typical cuplike shape (Fig. 5, B and C; and Fig. S3, A and B). Instead, the eluent following sEV fractions in SEC , which exhibited much smaller size than sEV, was competent in activating Xbp1 splicing (Fig. 5, B and C).
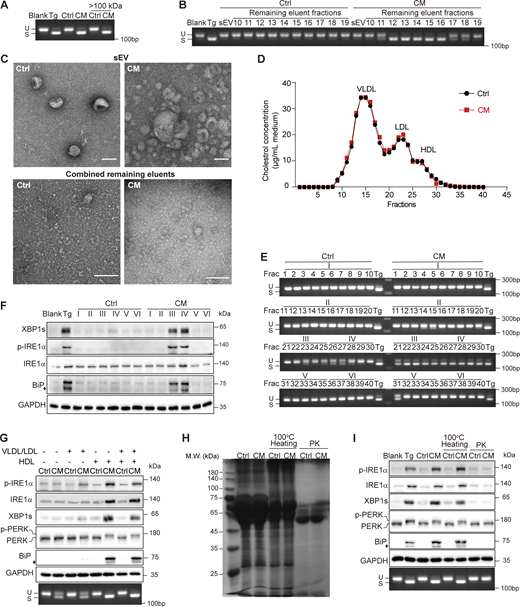
Cer is delivered intercellularly via lipoprotein. (A) Agarose gel of Xbp1 cDNA amplicons in AML12 treated with Ctrl/CM. Fractions with M.W. >100 kDa by filtration were also used. (B) Agarose gel of Xbp1 cDNA amplicons in AML12 treated with sEV and the remaining eluents isolated from Ctrl/CM using qEV column. (C) Transmission electron microscope images of sEV and the combined remaining eluents used in B. Scale bar, 100 nm. (D) FPLC of the remaining eluents used in B. A total of 40 fractions were collected, and the cholesterol concentrations in each fraction were determined. (E and F) Agarose gel of Xbp1 cDNA amplicons (E) and western blot of p-IRE1α, XBP1s, and BiP (F) in AML12 treated with each fraction from (D) or fraction combinations denoted as I-VI as shown in E. The diamond indicates the nonspecific band. (G) Western blot of p-IRE1α, XBP1s, p-PERK, and BiP (upper panel) and agarose gel of Xbp1 cDNA amplicons (lower panel) in AML12 treated with Ctrl/CM generated by culturing 3T3-L1 using DFBS, VLDL/LDL-containing FBS, HDL-containing FBS, or VLDL/LDL/HDL-containing FBS. The diamond indicates the nonspecific band. (H) Coomassie brilliant blue staining of 3T3-L1–derived Ctrl/CM treated with 100°C heating or 100 μg/ml PK. (I) Western blot of p-IRE1α, XBP1s, p-PERK, and BiP (upper) and agarose gel of Xbp1 cDNA amplicons (lower) in AML12 treated with regular, 100°C heated, or 100 μg/ml PK-pretreated Ctrl/CM. The diamond indicates the nonspecific band. PK, proteinase K; FPLC, fast-protein liquid chromatography. Source data are available for this figure: SourceData F5.
Cer is delivered intercellularly via lipoprotein. (A) Agarose gel of Xbp1 cDNA amplicons in AML12 treated with Ctrl/CM. Fractions with M.W. >100 kDa by filtration were also used. (B) Agarose gel of Xbp1 cDNA amplicons in AML12 treated with sEV and the remaining eluents isolated from Ctrl/CM using qEV column. (C) Transmission electron microscope images of sEV and the combined remaining eluents used in B. Scale bar, 100 nm. (D) FPLC of the remaining eluents used in B. A total of 40 fractions were collected, and the cholesterol concentrations in each fraction were determined. (E and F) Agarose gel of Xbp1 cDNA amplicons (E) and western blot of p-IRE1α, XBP1s, and BiP (F) in AML12 treated with each fraction from (D) or fraction combinations denoted as I-VI as shown in E. The diamond indicates the nonspecific band. (G) Western blot of p-IRE1α, XBP1s, p-PERK, and BiP (upper panel) and agarose gel of Xbp1 cDNA amplicons (lower panel) in AML12 treated with Ctrl/CM generated by culturing 3T3-L1 using DFBS, VLDL/LDL-containing FBS, HDL-containing FBS, or VLDL/LDL/HDL-containing FBS. The diamond indicates the nonspecific band. (H) Coomassie brilliant blue staining of 3T3-L1–derived Ctrl/CM treated with 100°C heating or 100 μg/ml PK. (I) Western blot of p-IRE1α, XBP1s, p-PERK, and BiP (upper) and agarose gel of Xbp1 cDNA amplicons (lower) in AML12 treated with regular, 100°C heated, or 100 μg/ml PK-pretreated Ctrl/CM. The diamond indicates the nonspecific band. PK, proteinase K; FPLC, fast-protein liquid chromatography. Source data are available for this figure: SourceData F5.
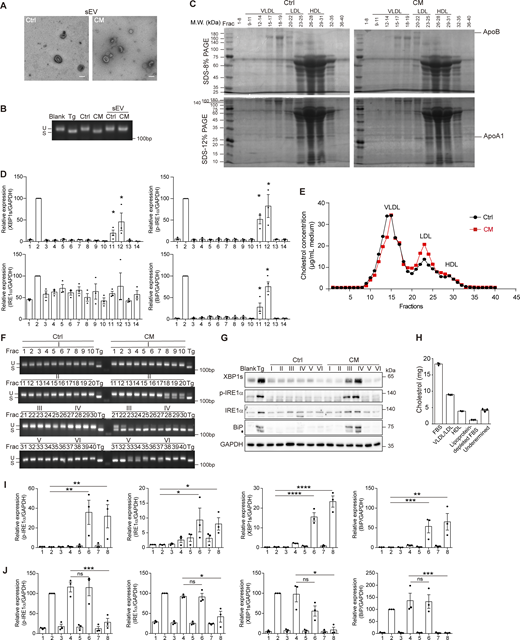
Cer is delivered in the form of lipoprotein but not sEV. (A) Transmission electron microscope of sEV extracted from 3T3-L1–derived Ctrl or CM by ultracentrifugation. Scale bar, 200 nm. (B) Agarose gel of Xbp1 cDNA amplicons in AML12 treated with sEV extracted from 3T3-L1–derived Ctrl or CM by ultracentrifugation. (C) Coomassie blue staining of FPLC fractions of Ctrl/CM numbered as in Fig. 5 D. Bands corresponding to ApoB and ApoA1 were denoted. (D) Quantification of protein levels in Fig. 5 F. Lanes were numbered from left to right, with the ratio in lane 2 (Tg treatment) set as 100. The statistical analyses were calculated using an unpaired t test, two-tailed. Each lane (3–14) was compared with lane 1, and only significant upregulation was denoted. Data were shown as the mean ± SEM, n = 3. *P < 0.05. (E) FPLC of the remaining eluents after sEV extraction from AML12-derived Ctrl/CM. A total of 40 fractions were collected, and the cholesterol concentrations in each fraction were determined. (F and G) Agarose gel of Xbp1 cDNA amplicons (F) and western blot of p-IRE1α, XBP1s, and BiP (G) in AML12 treated with each fraction from (E) or fraction combinations denoted as I-VI as shown in F. The diamond indicates the nonspecific band. (H) Cholesterol content in FBS, fractions of VLDL/LDL and HDL, DFBS, and undetermined fractions isolated by ultracentrifugation. (I) Quantification of protein levels in Fig. 5 G. Lanes were numbered from left to right, with the ratio in lane 1 set as 1. The statistical analyses were calculated using an unpaired t test, two-tailed. Data were shown as the mean ± SEM, n = 3. *P < 0.05, **P < 0.01, ***P < 0.001, ****P < 0.0001. (J) Quantification of protein levels in Fig. 5 I. Lanes were numbered from left to right, with the ratio in lane 2 (Tg treatment) set as 100. The statistical analyses were calculated using an unpaired t test, two-tailed. Data were shown as the mean ± SEM, n = 3. *P <0.05, ***P < 0.001. FPLC, fast-protein liquid chromatography; ApoB, apolipoprotein B; ApoA1, apolipoprotein A1. Source data are available for this figure: SourceData FS3.
Cer is delivered in the form of lipoprotein but not sEV. (A) Transmission electron microscope of sEV extracted from 3T3-L1–derived Ctrl or CM by ultracentrifugation. Scale bar, 200 nm. (B) Agarose gel of Xbp1 cDNA amplicons in AML12 treated with sEV extracted from 3T3-L1–derived Ctrl or CM by ultracentrifugation. (C) Coomassie blue staining of FPLC fractions of Ctrl/CM numbered as in Fig. 5 D. Bands corresponding to ApoB and ApoA1 were denoted. (D) Quantification of protein levels in Fig. 5 F. Lanes were numbered from left to right, with the ratio in lane 2 (Tg treatment) set as 100. The statistical analyses were calculated using an unpaired t test, two-tailed. Each lane (3–14) was compared with lane 1, and only significant upregulation was denoted. Data were shown as the mean ± SEM, n = 3. *P < 0.05. (E) FPLC of the remaining eluents after sEV extraction from AML12-derived Ctrl/CM. A total of 40 fractions were collected, and the cholesterol concentrations in each fraction were determined. (F and G) Agarose gel of Xbp1 cDNA amplicons (F) and western blot of p-IRE1α, XBP1s, and BiP (G) in AML12 treated with each fraction from (E) or fraction combinations denoted as I-VI as shown in F. The diamond indicates the nonspecific band. (H) Cholesterol content in FBS, fractions of VLDL/LDL and HDL, DFBS, and undetermined fractions isolated by ultracentrifugation. (I) Quantification of protein levels in Fig. 5 G. Lanes were numbered from left to right, with the ratio in lane 1 set as 1. The statistical analyses were calculated using an unpaired t test, two-tailed. Data were shown as the mean ± SEM, n = 3. *P < 0.05, **P < 0.01, ***P < 0.001, ****P < 0.0001. (J) Quantification of protein levels in Fig. 5 I. Lanes were numbered from left to right, with the ratio in lane 2 (Tg treatment) set as 100. The statistical analyses were calculated using an unpaired t test, two-tailed. Data were shown as the mean ± SEM, n = 3. *P <0.05, ***P < 0.001. FPLC, fast-protein liquid chromatography; ApoB, apolipoprotein B; ApoA1, apolipoprotein A1. Source data are available for this figure: SourceData FS3.
Lipoproteins usually have a size smaller than sEV and are known to carry Cer (Iqbal et al., 2017). We surmised that Cer in CM was present on lipoproteins. We then further fractionated the eluent active in inducing Xbp1 splicing. A total of 40 fractions were collected sequentially, among which the portions containing very-low-density lipoprotein (VLDL), low-density lipoprotein (LDL), and high-density lipoprotein (HDL) were designated according to the cholesterol concentrations, as well as the presence of apolipoproteins (Fig. 5 D and Fig. S3 C). We found that fractions that contained HDL were able to induce Xbp1 splicing, IRE1α phosphorylation, and the expression of XBP1s and BiP. Fractions containing LDL were less effective than HDL, exhibiting the Xbp1 splicing induction ability (Fig. 5, E and F; and Fig. S3 D). This was also the case for AML12-derived CM (Fig. S3, E–G). To further investigate the necessity of LDL/HDL in the activity of CM, we isolated VLDL/LDL and HDL from fetal bovine serum (FBS), along with lipoprotein-depleted FBS (DFBS) (Fig. S3 H). We then generated CM by culturing 3T3-L1 with DFBS in the presence or absence of VLDL/LDL or HDL. Compared to the condition with supplementation of both VLDL/LDL and HDL, cell culture with DFBS resulted in almost a total loss of the ability of CM in provoking XBP1s expression, although the Xbp1 splicing induction ability was only partially impaired. Furthermore, the addition of HDL, but not VLDL/LDL, restored the ability of CM in eliciting both XBP1s expression and Xbp1 splicing (Fig. 5 G and Fig. S3 I). These results suggested that HDL, or other molecules present in the HDL fraction, was important for the effectiveness of Cer in the UPR induction. In line with this, most Cer species showed a trend of concentration increase, though slightly, in the HDL fraction derived from CM than that from Ctrl (Table 1).
Cer concentration (mmol/ml) in HDL part of Ctrl/CM
| Ctrl_1 | Ctrl_2 | Ctrl_3 | Ctrl_4 | Ctrl, Mean + SEM | CM_1 | CM_2 | CM_3 | CM_4 | CM, Mean + SEM | P value | |
|---|---|---|---|---|---|---|---|---|---|---|---|
| Cer | 3.130E-07 | 4.800E-07 | 4.409E-07 | 4.557E-07 | 4.224E-07 ± 3.734E-08 | 5.454E-07 | 4.622E-07 | 3.884E-07 | 4.903E-07 | 4.716E-07 ± 3.267E-08 | 0.3596 |
| Cer d18:1/14:0 | 3.763E-10 | 4.195E-10 | 4.439E-10 | 4.266E-10 | 4.165E-10 ± 1.447E-11 | 6.378E-10 | 4.457E-10 | 6.118E-10 | 5.316E-10 | 5.570E-10 ± 4.333E-11 | 0.0218 |
| Cer d18:1/15:0 | 2.280E-10 | 2.341E-10 | 2.966E-10 | 3.599E-10 | 2.798E-10 ± 3.097E-11 | 4.308E-10 | 2.562E-10 | 3.301E-10 | 3.139E-10 | 3.328E-10 ± 3.640E-11 | 0.3099 |
| Cer d18:1/16:0 | 2.136E-08 | 2.759E-08 | 2.607E-08 | 2.924E-08 | 2.608E-08 ± 1.682E-09 | 3.547E-08 | 2.984E-08 | 2.808E-08 | 2.986E-08 | 3.083E-08 ± 1.612E-09 | 0.0876 |
| Cer d18:0/16:0 | 1.585E-09 | 2.026E-09 | 1.689E-09 | 2.018E-09 | 1.833E-09 ± 1.130E-10 | 2.315E-09 | 1.841E-09 | 2.155E-09 | 2.222E-09 | 2.133E-09 ± 1.023E-10 | 0.0966 |
| Cer d18:1/17:0 | 4.857E-10 | 7.601E-10 | 7.931E-10 | 8.822E-10 | 7.303E-10 ± 8.540E-11 | 1.043E-09 | 8.417E-10 | 8.257E-10 | 1.044E-09 | 9.370E-10 ± 5.956E-11 | 0.0943 |
| Cer d18:0/17:0 | 1.426E-10 | 2.136E-10 | 1.229E-10 | 1.689E-10 | 1.623E-10 ± 1.965E-11 | 1.611E-10 | 1.573E-10 | 1.724E-10 | 2.190E-10 | 1.773E-10 ± 1.427E-11 | 0.5596 |
| Cer d18:1/18:0 | 5.322E-09 | 7.390E-09 | 7.540E-09 | 7.811E-09 | 7.015E-09 ± 5.716E-10 | 1.002E-08 | 7.669E-09 | 7.335E-09 | 8.380E-09 | 8.348E-09 ± 5.920E-10 | 0.1565 |
| Cer d18:0/18:0 | 5.630E-10 | 1.053E-09 | 6.478E-10 | 8.909E-10 | 7.880E-10 ± 1.116E-10 | 8.717E-10 | 7.787E-10 | 9.566E-10 | 1.079E-09 | 9.220E-10 ± 6.399E-11 | 0.3377 |
| Cer d18:1/19:0 | 2.531E-10 | 3.844E-10 | 3.910E-10 | 4.902E-10 | 3.795E-10 ± 4.862E-11 | 5.817E-10 | 3.969E-10 | 2.993E-10 | 3.231E-10 | 4.003E-10 ± 6.407E-11 | 0.8050 |
| Cer d18:1/20:0 | 3.063E-09 | 5.222E-09 | 5.029E-09 | 5.071E-09 | 4.595E-09 ± 5.133E-10 | 6.198E-09 | 4.328E-09 | 4.314E-09 | 4.957E-09 | 4.950E-09 ± 4.432E-10 | 0.6194 |
| Cer d18:0/20:0 | 3.182E-10 | 4.508E-10 | 4.120E-10 | 4.843E-10 | 4.163E-10 ± 3.590E-11 | 4.927E-10 | 4.467E-10 | 5.188E-10 | 5.044E-10 | 4.908E-10 ± 1.553E-11 | 0.1055 |
| Cer d18:1/21:0 | 1.428E-09 | 2.345E-09 | 2.262E-09 | 2.266E-09 | 2.075E-09 ± 2.157E-10 | 2.361E-09 | 2.121E-09 | 2.035E-09 | 2.394E-09 | 2.228E-09 ± 8.693E-11 | 0.5364 |
| Cer d18:0/21:0 | 1.317E-10 | 2.324E-10 | 1.624E-10 | 2.419E-10 | 1.920E-10 ± 2.677E-11 | 1.756E-10 | 1.948E-10 | 2.338E-10 | 2.344E-10 | 2.098E-10 ± 1.453E-11 | 0.5813 |
| Cer d18:1/22:0 | 4.075E-08 | 6.674E-08 | 6.335E-08 | 6.543E-08 | 5.908E-08 ± 6.129E-09 | 8.062E-08 | 6.482E-08 | 4.875E-08 | 6.814E-08 | 6.555E-08 ± 6.567E-09 | 0.4981 |
| Cer d18:0/22:0 | 1.925E-09 | 2.951E-09 | 2.618E-09 | 2.744E-09 | 2.560E-09 ± 2.208E-10 | 3.090E-09 | 2.606E-09 | 2.959E-09 | 3.043E-09 | 2.925E-09 ± 1.084E-10 | 0.1883 |
| Cer d18:1/23:0 | 3.297E-08 | 5.515E-08 | 4.472E-08 | 4.522E-08 | 4.453E-08 ± 4.539E-09 | 5.654E-08 | 4.905E-08 | 3.804E-08 | 4.851E-08 | 4.800E-08 ± 3.802E-09 | 0.5787 |
| Cer d18:0/23:0 | 1.118E-09 | 2.056E-09 | 1.550E-09 | 1.746E-09 | 1.620E-09 ± 1.969E-10 | 2.028E-09 | 1.701E-09 | 1.702E-09 | 2.108E-09 | 1.885E-09 ± 1.081E-10 | 0.2828 |
| Cer d18:1/24:1 | 9.282E-08 | 1.425E-07 | 1.310E-07 | 1.322E-07 | 1.245E-07 ± 1.084E-08 | 1.615E-07 | 1.423E-07 | 1.067E-07 | 1.491E-07 | 1.400E-07 ± 1.175E-08 | 0.3683 |
| Cer d18:1/24:0 | 6.062E-08 | 9.208E-08 | 9.037E-08 | 8.742E-08 | 8.263E-08 ± 7.406E-09 | 1.055E-07 | 8.816E-08 | 7.198E-08 | 8.819E-08 | 8.835E-08 ± 6.737E-09 | 0.5882 |
| Cer d18:0/24:1 | 3.324E-09 | 5.305E-09 | 4.532E-09 | 4.950E-09 | 4.528E-09 ± 4.329E-10 | 5.695E-09 | 4.719E-09 | 4.690E-09 | 5.463E-09 | 5.140E-09 ± 2.556E-10 | 0.2688 |
| Cer d18:0/24:0 | 2.217E-09 | 3.717E-09 | 2.800E-09 | 3.230E-09 | 2.993E-09 ± 3.188E-10 | 3.533E-09 | 3.076E-09 | 3.066E-09 | 3.334E-09 | 3.253E-09 ± 1.103E-10 | 0.4701 |
| Cer d18:1/25:1 | 3.818E-09 | 6.240E-09 | 5.250E-09 | 6.142E-09 | 5.363E-09 ± 5.602E-10 | 6.745E-09 | 5.387E-09 | 5.546E-09 | 6.393E-09 | 6.018E-09 ± 3.257E-10 | 0.3512 |
| Cer d18:1/25:0 | 4.955E-09 | 7.491E-09 | 6.705E-09 | 6.899E-09 | 6.510E-09 ± 5.464E-10 | 8.424E-09 | 7.374E-09 | 6.020E-09 | 7.172E-09 | 7.245E-09 ± 4.918E-10 | 0.3560 |
| Cer d18:1/26:1 | 1.794E-09 | 2.900E-09 | 2.622E-09 | 2.877E-09 | 2.548E-09 ± 2.604E-10 | 3.609E-09 | 2.639E-09 | 2.764E-09 | 3.154E-09 | 3.040E-09 ± 2.190E-10 | 0.1979 |
| Cer d18:1/26:0 | 1.790E-09 | 2.960E-09 | 3.439E-09 | 3.143E-09 | 2.833E-09 ± 3.613E-10 | 3.654E-09 | 2.896E-09 | 2.625E-09 | 2.679E-09 | 2.965E-09 ± 2.357E-10 | 0.7691 |
| Cer d16:1/16:0 | 2.410E-10 | 2.225E-10 | 3.811E-10 | 3.023E-10 | 2.868E-10 ± 3.568E-11 | 3.976E-10 | 2.740E-10 | 3.738E-10 | 3.705E-10 | 3.540E-10 ± 2.737E-11 | 0.1854 |
| Cer d16:1/18:0 | 1.685E-10 | 1.808E-10 | 1.257E-10 | 1.393E-10 | 1.535E-10 ± 1.269E-11 | 2.221E-10 | 1.781E-10 | 2.376E-10 | 1.824E-10 | 2.050E-10 ± 1.482E-11 | 0.0386 |
| Cer d16:1/19:0 | 2.802E-10 | 2.991E-10 | 1.606E-10 | 4.218E-10 | 2.905E-10 ± 5.342E-11 | 3.177E-10 | 3.500E-10 | 3.564E-10 | 5.167E-10 | 3.853E-10 ± 4.470E-11 | 0.2226 |
| Cer d16:0/20:0 | 2.333E-10 | 3.484E-10 | 2.620E-10 | 3.337E-10 | 2.943E-10 ± 2.778E-11 | 3.713E-10 | 3.291E-10 | 3.500E-10 | 4.848E-10 | 3.838E-10 ± 3.482E-11 | 0.0913 |
| Cer d16:1/22:0 | 3.315E-10 | 6.059E-10 | 4.239E-10 | 4.681E-10 | 4.573E-10 ± 5.722E-11 | 5.931E-10 | 4.553E-10 | 4.710E-10 | 5.788E-10 | 5.245E-10 ± 3.577E-11 | 0.3574 |
| Cer d16:1/23:0 | 5.582E-11 | 1.282E-10 | 5.796E-11 | 1.650E-10 | 1.017E-10 ± 2.695E-11 | 1.392E-10 | 9.842E-11 | 8.830E-11 | 7.442E-11 | 1.000E-10 ± 1.389E-11 | 0.9577 |
| Cer d16:1/24:1 | 6.209E-10 | 9.275E-10 | 8.610E-10 | 9.292E-10 | 8.348E-10 ± 7.301E-11 | 1.184E-09 | 7.686E-10 | 7.874E-10 | 9.835E-10 | 9.298E-10 ± 9.647E-11 | 0.4622 |
| Cer d16:1/24:0 | 7.463E-11 | 3.020E-10 | 4.342E-10 | 4.750E-10 | 3.214E-10 ± 9.017E-11 | 5.638E-10 | 3.724E-10 | 1.533E-10 | 3.711E-10 | 3.650E-10 ± 8.398E-11 | 0.7356 |
| Cer d17:1/16:0 | 4.669E-10 | 5.967E-10 | 6.392E-10 | 6.689E-10 | 5.930E-10 ± 4.452E-11 | 7.947E-10 | 6.706E-10 | 7.321E-10 | 7.488E-10 | 7.368E-10 ± 2.564E-11 | 0.0312 |
| Cer d17:1/18:0 | 3.962E-10 | 4.950E-10 | 3.712E-10 | 6.033E-10 | 4.663E-10 ± 5.286E-11 | 5.210E-10 | 4.923E-10 | 4.955E-10 | 7.828E-10 | 5.728E-10 ± 7.039E-11 | 0.2718 |
| Cer d17:0/19:0 | 1.601E-10 | 3.138E-10 | 2.283E-10 | 3.550E-10 | 2.643E-10 ± 4.368E-11 | 2.933E-10 | 3.631E-10 | 2.605E-10 | 4.076E-10 | 3.310E-10 ± 3.346E-11 | 0.2707 |
| Cer d17:1/21:0 | 4.573E-10 | 4.900E-10 | 2.227E-10 | 6.056E-10 | 4.440E-10 ± 8.030E-11 | 3.961E-10 | 3.884E-10 | 4.297E-10 | 7.773E-10 | 4.978E-10 ± 9.353E-11 | 0.6781 |
| Cer d17:1/22:0 | 3.027E-10 | 5.130E-10 | 5.420E-10 | 5.024E-10 | 4.650E-10 ± 5.465E-11 | 6.355E-10 | 5.172E-10 | 4.193E-10 | 6.189E-10 | 5.478E-10 ± 5.032E-11 | 0.3080 |
| Cer d17:1/23:0 | 7.682E-11 | 1.735E-10 | 1.642E-10 | 2.207E-10 | 1.587E-10 ± 3.003E-11 | 2.207E-10 | 1.934E-10 | 1.535E-10 | 1.600E-10 | 1.818E-10 ± 1.572E-11 | 0.5219 |
| Cer d17:0/23:0 | 3.080E-10 | 4.279E-10 | 3.719E-10 | 4.821E-10 | 3.975E-10 ± 3.734E-11 | 4.630E-10 | 4.154E-10 | 3.784E-10 | 5.032E-10 | 4.398E-10 ± 2.734E-11 | 0.3964 |
| Cer d17:1/24:1 | 1.017E-09 | 1.301E-09 | 1.159E-09 | 1.263E-09 | 1.185E-09 ± 6.238E-11 | 1.501E-09 | 1.290E-09 | 1.183E-09 | 1.156E-09 | 1.283E-09 ± 7.793E-11 | 0.3664 |
| Cer d17:0/24:1 | 3.051E-09 | 4.124E-09 | 4.395E-09 | 4.759E-09 | 4.083E-09 ± 3.682E-10 | 5.049E-09 | 4.415E-09 | 3.732E-09 | 4.375E-09 | 4.393E-09 ± 2.696E-10 | 0.5223 |
| Cer d17:0/24:0 | 5.579E-10 | 7.017E-10 | 6.827E-10 | 6.766E-10 | 6.550E-10 ± 3.277E-11 | 7.988E-10 | 6.096E-10 | 6.447E-10 | 6.686E-10 | 6.808E-10 ± 4.124E-11 | 0.6423 |
| Cer d20:1/15:0 | 2.407E-10 | 2.664E-10 | 1.974E-10 | 3.399E-10 | 2.610E-10 ± 2.995E-11 | 2.524E-10 | 3.212E-10 | 2.388E-10 | 3.501E-10 | 2.905E-10 ± 2.678E-11 | 0.4904 |
| Cer d20:1/20:0 | 3.328E-10 | 4.169E-10 | 4.388E-10 | 4.649E-10 | 4.135E-10 ± 2.857E-11 | 4.574E-10 | 3.663E-10 | 4.115E-10 | 5.539E-10 | 4.470E-10 ± 4.021E-11 | 0.5224 |
| Cer d20:1/22:0 | 6.772E-10 | 9.791E-10 | 1.175E-09 | 1.088E-09 | 9.790E-10 ± 1.080E-10 | 1.143E-09 | 1.042E-09 | 9.872E-10 | 1.267E-09 | 1.109E-09 ± 6.227E-11 | 0.3364 |
| Cer d20:0/22:1 | 1.824E-10 | 3.722E-10 | 1.901E-10 | 2.832E-10 | 2.568E-10 ± 4.474E-11 | 1.393E-10 | 1.739E-10 | 1.324E-10 | 3.025E-10 | 1.870E-10 ± 3.974E-11 | 0.2880 |
| Cer d20:1/24:1 | 5.083E-10 | 1.073E-09 | 8.673E-10 | 1.011E-09 | 8.638E-10 ± 1.260E-10 | 9.269E-10 | 9.900E-10 | 8.684E-10 | 1.166E-09 | 9.888E-10 ± 6.535E-11 | 0.4124 |
| Cer d20:1/24:0 | 1.891E-08 | 2.632E-08 | 2.175E-08 | 2.672E-08 | 2.343E-08 ± 1.873E-09 | 2.636E-08 | 2.317E-08 | 3.186E-08 | 3.359E-08 | 2.878E-08 ± 2.411E-09 | 0.1303 |
An unpaired t test was used for statistical analysis.
We previously showed that the effect of CM is heat-resistant (Fig. 2 A). The requirement of HDL prompted us to double-check the protein content in heated CM. We found that the supernatant of heated CM still contained considerably a high amount of proteins (Fig. 5 H). These proteins, though denatured, remain soluble and may still be able to carry Cer and partially warrant its UPR-inducing ability. To clarify the importance of proteins in Cer delivery, CM was digested by proteinase K. This resulted in a dramatic loss of proteins and a complete loss of ability in inducing the UPR (Fig. 5, H and I; and Fig. S3 J). Thus, proteins in the HDL-resident fraction bestowed the UPR-inducing ability on secretory Cer, probably by providing lipoprotein as a carrier.
Cer activates the UPR by disrupting membrane fluidity and Ca2+ homeostasis
We then turned to the receiving cells, seeking to understand the activation mechanism of cell-nonautonomous UPR. First, we examined the role of endocytosis by employing a panel of endocytosis inhibitors to treat AML12, including amiloride and ethyl-isopropyl amiloride (EIPA) (inhibitors of macropinocytosis), nocodazole (inhibitor of clathrin-mediated endocytosis), and nystatin and methyl-β-cyclodextrin (MβCD) (inhibitors of caveola-mediated endocytosis). Only MβCD was able to abolish the CM-induced UPR (Fig. 6 A, Fig. 7 A, and Fig. S4 A). The effect of lipids extracted from CM could also be inhibited by MβCD (Fig. 7 B and Fig. S4 B). On the contrary, blockage of clathrin-mediated endocytosis by silencing AP-2α, clathrin heavy chain (CHC), or dynamin expression with siRNA in 293T, or abolishing caveola-dependent endocytosis by knocking out caveolin-1 (Cav1) in AML12, could not prevent CM-induced Xbp1 splicing (Fig. 6, B–F). Thus, endocytosis is dispensable for cell-nonautonomous UPR induction by Cer.
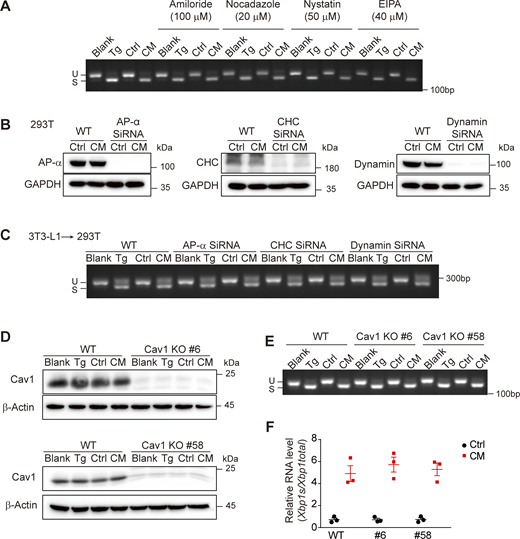
Cer activates the UPR in an endocytosis-independent manner. (A) Agarose gel of Xbp1 cDNA amplicons in AML12 treated with Ctrl/CM ± endocytosis inhibitors (amiloride, nocodazole, nystatin, EIPA). (B and C) Effect of clathrin deficiency on ERS transmission. (B) Knockdown efficiency of AP-2α, CHC, or dynamin siRNA (100 nM) in 293T cells examined by western blot. (C) Agarose gel of Xbp1 cDNA amplicons in WT or clathrin knockdown 293T cells treated with 3T3-L1-derived Ctrl/CM. (D–F) Effect of Cav1 KO on ERS transmission. (D) Cav1 KO efficiency in AML12 cells examined by western blot. (E) Agarose gel of Xbp1 cDNA amplicons in WT or Cav1 KO AML12 cells treated with 3T3-L1–derived Ctrl/CM. (F) Quantification of Xbp1s/Xbp1total by RT-qPCR in WT or Cav1 KO AML12 cells treated with 3T3-L1–derived Ctrl/CM (n = 3). Source data are available for this figure: SourceData F6.
Cer activates the UPR in an endocytosis-independent manner. (A) Agarose gel of Xbp1 cDNA amplicons in AML12 treated with Ctrl/CM ± endocytosis inhibitors (amiloride, nocodazole, nystatin, EIPA). (B and C) Effect of clathrin deficiency on ERS transmission. (B) Knockdown efficiency of AP-2α, CHC, or dynamin siRNA (100 nM) in 293T cells examined by western blot. (C) Agarose gel of Xbp1 cDNA amplicons in WT or clathrin knockdown 293T cells treated with 3T3-L1-derived Ctrl/CM. (D–F) Effect of Cav1 KO on ERS transmission. (D) Cav1 KO efficiency in AML12 cells examined by western blot. (E) Agarose gel of Xbp1 cDNA amplicons in WT or Cav1 KO AML12 cells treated with 3T3-L1–derived Ctrl/CM. (F) Quantification of Xbp1s/Xbp1total by RT-qPCR in WT or Cav1 KO AML12 cells treated with 3T3-L1–derived Ctrl/CM (n = 3). Source data are available for this figure: SourceData F6.
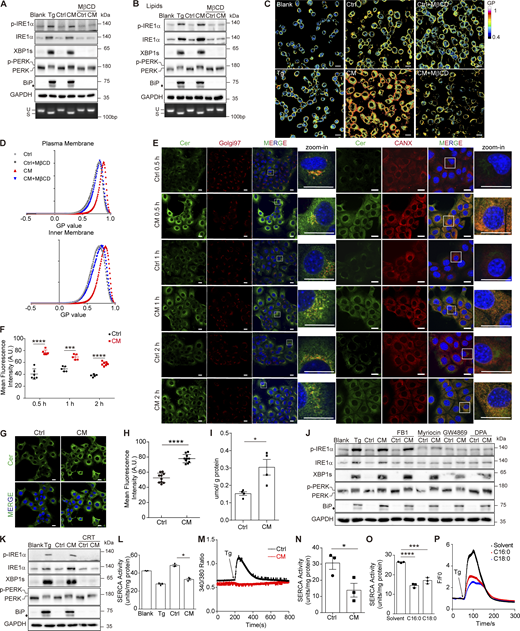
Cer activates the UPR by disrupting membrane fluidity and Ca2+homeostasis. (A and B) Western blot of p-IRE1α, XBP1s, p-PERK, and BiP in AML12 (upper panel) and agarose gel of Xbp1 cDNA amplicons (lower panel) from AML12 treated with Ctrl/CM (A) or Ctrl/CM-extracted lipids (B) with or without 5 mM MβCD. The diamond indicates the nonspecific band. (C and D) Laurdan staining (C) and histogram of the GP values of the plasma membrane and inner membrane (D) in AML12 treated with Ctrl/CM ± MβCD (5 mM) for 2 h. Scale bar, 20 μm. (E–H) (E and G) Representative confocal microscopic images of AML12 cells stained with anti-Cer (green), anti-Golgin-97 (red), and anti-calnexin (red) antibodies and Hoechst (blue). (E) Cells were treated with Ctrl/CM for the indicated time. (G) Cells were treated with Ctrl/CM lipids for 30 min. Quantifications of Cer fluorescence intensities in the left panel of (E) and in (G) measured by ImageJ are shown in (F) (n ≥ 5 fields) and (H) (n = 10 fields), respectively. The statistical analyses were performed using an unpaired t test, two-tailed. Data were shown as the mean ± SEM. ***P < 0.001, ****P < 0.0001. Scale bar, 20 μm. (I) Quantification of Cer content in microsome (μmol/g protein) by mass spectrometry. Microsome was isolated from AML12 treated with Ctrl/CM for 1 h. The statistical analyses were performed using an unpaired t test, two-tailed. Data were shown as the mean ± SEM, n = 4. *P < 0.05. (J) Western blot of p-IRE1α, XBP1s, p-PERK, and BiP in AML12 treated with Ctrl/CM ± inhibitors. The diamond indicates the nonspecific band. Inhibitors are FB1 (10 μM), myriocin (10 μM), GW4869 (20 μM), and DPA (50 μM). (K) Western blot of p-IRE1α, XBP1s, p-PERK, and BiP in AML12 treated with Ctrl/CM ± 5 μM of CRT0066101 (CRT) for 6 h. The diamond indicates the nonspecific band. (L) SERCA activity determined in AML12 cell lysates. Cells were treated with Ctrl/CM for 2 h. The statistical analyses were performed using an unpaired t test, two-tailed. Data were shown as the mean ± SEM, n = 3. *P < 0.05. (M) Measurement of Ca2+ signals in the cytosol of AML12 by 5 μM Fura-2 staining. Cells were treated with Ctrl/CM for 2 h. nCtrl = 74 cells; nCM = 120 cells. (N) SERCA activity determined in AML12 cell lysates. Cells were treated with Ctrl/CM-extracted lipid for 2 h. The statistical analyses were performed using an unpaired t test, two-tailed. Data were shown as the mean ± SEM, n = 3. *P < 0.05. (O) SERCA activity determined in AML12 cell lysates. Cells were treated with 20 μM of C16:0 or C18:0 for 2 h. The statistical analyses were performed using an unpaired t test, two-tailed. Data were shown as the mean ± SEM, n = 3. ***P < 0.001, ****P < 0.0001. (P) Measurement of Ca2+ signals in the cytosol of 293T by 4 μM Fluo-4 staining. Cells were treated with 20 μM of C16:0 or C18:0 for 2 h. nsolvent = 139 cells; nc16:0 = 144 cells; nc18:0 = 97 cells. Source data are available for this figure: SourceData F7.
Cer activates the UPR by disrupting membrane fluidity and Ca2+homeostasis. (A and B) Western blot of p-IRE1α, XBP1s, p-PERK, and BiP in AML12 (upper panel) and agarose gel of Xbp1 cDNA amplicons (lower panel) from AML12 treated with Ctrl/CM (A) or Ctrl/CM-extracted lipids (B) with or without 5 mM MβCD. The diamond indicates the nonspecific band. (C and D) Laurdan staining (C) and histogram of the GP values of the plasma membrane and inner membrane (D) in AML12 treated with Ctrl/CM ± MβCD (5 mM) for 2 h. Scale bar, 20 μm. (E–H) (E and G) Representative confocal microscopic images of AML12 cells stained with anti-Cer (green), anti-Golgin-97 (red), and anti-calnexin (red) antibodies and Hoechst (blue). (E) Cells were treated with Ctrl/CM for the indicated time. (G) Cells were treated with Ctrl/CM lipids for 30 min. Quantifications of Cer fluorescence intensities in the left panel of (E) and in (G) measured by ImageJ are shown in (F) (n ≥ 5 fields) and (H) (n = 10 fields), respectively. The statistical analyses were performed using an unpaired t test, two-tailed. Data were shown as the mean ± SEM. ***P < 0.001, ****P < 0.0001. Scale bar, 20 μm. (I) Quantification of Cer content in microsome (μmol/g protein) by mass spectrometry. Microsome was isolated from AML12 treated with Ctrl/CM for 1 h. The statistical analyses were performed using an unpaired t test, two-tailed. Data were shown as the mean ± SEM, n = 4. *P < 0.05. (J) Western blot of p-IRE1α, XBP1s, p-PERK, and BiP in AML12 treated with Ctrl/CM ± inhibitors. The diamond indicates the nonspecific band. Inhibitors are FB1 (10 μM), myriocin (10 μM), GW4869 (20 μM), and DPA (50 μM). (K) Western blot of p-IRE1α, XBP1s, p-PERK, and BiP in AML12 treated with Ctrl/CM ± 5 μM of CRT0066101 (CRT) for 6 h. The diamond indicates the nonspecific band. (L) SERCA activity determined in AML12 cell lysates. Cells were treated with Ctrl/CM for 2 h. The statistical analyses were performed using an unpaired t test, two-tailed. Data were shown as the mean ± SEM, n = 3. *P < 0.05. (M) Measurement of Ca2+ signals in the cytosol of AML12 by 5 μM Fura-2 staining. Cells were treated with Ctrl/CM for 2 h. nCtrl = 74 cells; nCM = 120 cells. (N) SERCA activity determined in AML12 cell lysates. Cells were treated with Ctrl/CM-extracted lipid for 2 h. The statistical analyses were performed using an unpaired t test, two-tailed. Data were shown as the mean ± SEM, n = 3. *P < 0.05. (O) SERCA activity determined in AML12 cell lysates. Cells were treated with 20 μM of C16:0 or C18:0 for 2 h. The statistical analyses were performed using an unpaired t test, two-tailed. Data were shown as the mean ± SEM, n = 3. ***P < 0.001, ****P < 0.0001. (P) Measurement of Ca2+ signals in the cytosol of 293T by 4 μM Fluo-4 staining. Cells were treated with 20 μM of C16:0 or C18:0 for 2 h. nsolvent = 139 cells; nc16:0 = 144 cells; nc18:0 = 97 cells. Source data are available for this figure: SourceData F7.
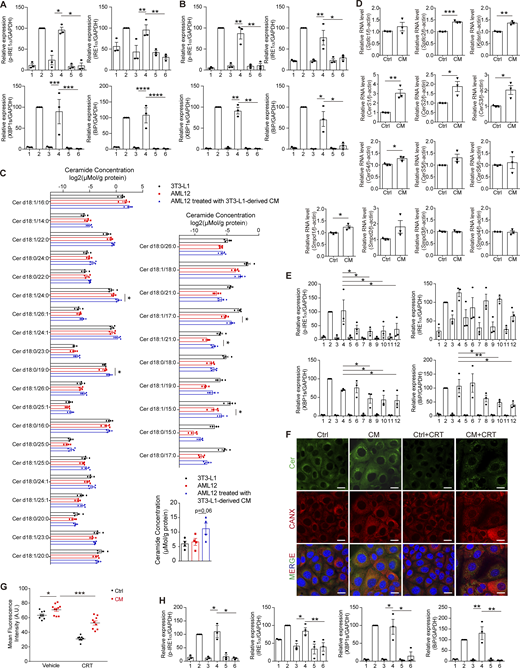
CM augments Cer synthesis–related gene transcription in receiving cells, and CRT reduces the content of Cer in cells. (A and B) Quantification of protein levels in Fig. 7 A (A) and Fig. 7 B (B). Lanes were numbered from left to right, with the ratio in lane 2 (Tg treatment) set as 100. The statistical analyses were calculated by one-way ANOVA. Data were shown as the mean ± SEM, n = 3. *P < 0.05, **P < 0.01, ***P < 0.001, ****P < 0.0001. (C) Cer concentration in 3T3-L1 and AML12 treated without or with 3T3-L1–derived CM. Left panel, Cer species that showed no significant difference of the concentration between 3T3-L1 and AML12 (unpaired t test, two-tailed, P ≥ 0.05). Right upper panel, Cer species that showed a significant difference in the concentration between 3T3-L1 and AML12 (unpaired t test, two-tailed, P < 0.05). Right lower panel, total Cer. The statistical analysis between AML12 and AML12 treated with CM was calculated using an unpaired t test, two-tailed. Data were shown as the mean ± SEM, n = 4. *P < 0.05. (D) RT-qPCR of Cer synthesis–related genes in AML12 treated with Ctrl/CM for 30 min. The statistical analyses were calculated by an unpaired t test, two-tailed. Data were shown as the mean ± SEM, n = 3. *P < 0.05, **P < 0.01, ***P < 0.001. (E) Quantification of protein levels in Fig. 7 J. Lanes were numbered from left to right, with the ratio in lane 2 (Tg treatment) set as 100. The statistical analyses were calculated by an unpaired t test, two-tailed. Data were shown as the mean ± SEM, n = 3. *P < 0.05, **P < 0.01. (F) Representative confocal microscopic images of AML12 cells stained with anti-Cer antibody and Hoechst (blue). Cells were treated with Ctrl/CM ± 5 μM CRT0066101 (CRT) for 2 h. Scale bar, 20 μm. (G) Quantification of Cer fluorescence intensities in F measured by ImageJ, n ≥ 8 fields. The statistical analyses were performed using one-way ANOVA. Data were shown as the mean ± SEM. *P < 0.05, ***P < 0.001. (H) Quantification of protein levels in Fig. 7 K. Lanes were numbered from left to right, with the ratio in lane 2 (Tg treatment) set as 100. The statistical analyses were calculated by one-way ANOVA. Data were shown as the mean ± SEM, n = 3. *P < 0.05, **P < 0.01. Source data are available for this figure: SourceData FS4.
CM augments Cer synthesis–related gene transcription in receiving cells, and CRT reduces the content of Cer in cells. (A and B) Quantification of protein levels in Fig. 7 A (A) and Fig. 7 B (B). Lanes were numbered from left to right, with the ratio in lane 2 (Tg treatment) set as 100. The statistical analyses were calculated by one-way ANOVA. Data were shown as the mean ± SEM, n = 3. *P < 0.05, **P < 0.01, ***P < 0.001, ****P < 0.0001. (C) Cer concentration in 3T3-L1 and AML12 treated without or with 3T3-L1–derived CM. Left panel, Cer species that showed no significant difference of the concentration between 3T3-L1 and AML12 (unpaired t test, two-tailed, P ≥ 0.05). Right upper panel, Cer species that showed a significant difference in the concentration between 3T3-L1 and AML12 (unpaired t test, two-tailed, P < 0.05). Right lower panel, total Cer. The statistical analysis between AML12 and AML12 treated with CM was calculated using an unpaired t test, two-tailed. Data were shown as the mean ± SEM, n = 4. *P < 0.05. (D) RT-qPCR of Cer synthesis–related genes in AML12 treated with Ctrl/CM for 30 min. The statistical analyses were calculated by an unpaired t test, two-tailed. Data were shown as the mean ± SEM, n = 3. *P < 0.05, **P < 0.01, ***P < 0.001. (E) Quantification of protein levels in Fig. 7 J. Lanes were numbered from left to right, with the ratio in lane 2 (Tg treatment) set as 100. The statistical analyses were calculated by an unpaired t test, two-tailed. Data were shown as the mean ± SEM, n = 3. *P < 0.05, **P < 0.01. (F) Representative confocal microscopic images of AML12 cells stained with anti-Cer antibody and Hoechst (blue). Cells were treated with Ctrl/CM ± 5 μM CRT0066101 (CRT) for 2 h. Scale bar, 20 μm. (G) Quantification of Cer fluorescence intensities in F measured by ImageJ, n ≥ 8 fields. The statistical analyses were performed using one-way ANOVA. Data were shown as the mean ± SEM. *P < 0.05, ***P < 0.001. (H) Quantification of protein levels in Fig. 7 K. Lanes were numbered from left to right, with the ratio in lane 2 (Tg treatment) set as 100. The statistical analyses were calculated by one-way ANOVA. Data were shown as the mean ± SEM, n = 3. *P < 0.05, **P < 0.01. Source data are available for this figure: SourceData FS4.
Mechanistically, MβCD inhibits endocytosis by cholesterol sequestration, which increases membrane fluidity (Ikonen, 2008). We hypothesized that Cer secreted from donor cells may activate the UPR through altering the membrane fluidity in receiving cells. This was confirmed by 6-dodecanoyl-2-dimethylaminonaphthalene (Laurdan) staining, in which CM prominently decreased the membrane fluidity. As a control, Tg treatment had little effect on the membrane fluidity, although it induced cell-autonomous UPR. Notably, MβCD antagonized the effect of CM and improved membrane fluidity (Fig. 7, C and D).
The decrease in membrane fluidity occurred not only on the plasma membrane, but also inside the cell (Fig. 7, C and D). We wondered whether Cer disturbed the ER membrane. Immunofluorescence staining revealed a significant accumulation of Cer in receiving cells upon CM treatment, which occurred as early as 30 min (Fig. 7, E and F). Notably, while Cer in Ctrl-treated cells mainly localized on Golgi, it showed a more diffused distribution in CM-treated cells, nicely colocalized with the ER marker calnexin (Fig. 7 E). In addition, treatment with CM-extracted lipids also led to Cer accumulation and diffusion in receiving cells (Fig. 7, G and H). To further validate the upregulation of Cer content in the ER, microsomes were isolated from CM-treated AML12 and subjected to Cer quantification by mass spectrometry, which showed a twofold increase in Cer amount upon CM treatment (Fig. 7 I).
How does extracellular Cer increase the Cer level within the cell if endocytosis is not involved? We found that CM treatment resulted in a general increase of different species of Cer, no matter if they are more abundant in 3T3-L1 than in AML12 or not (Fig. S4 C). In addition, CM treatment elevated the transcription level of many Cer synthesis–related genes (Fig. S4 D). The ER is the major site of Cer synthesis. We reasoned that CM treatment augmented Cer synthesis in the ER, leading to accumulation of Cer on the ER membrane, thus provoking the UPR through disrupting the ER membrane fluidity. In agreement with this, pharmaceutical inhibition of Cer synthesis with FB1, myriocin, GW4869, or DPA (targeting Cers, SPT, SMPD2, and ASM, respectively) remarkably reduced the IRE1α phosphorylation and slightly decreased the expression of BiP in receiving cells. In addition, GW4869 and DPA also suppressed XBP1s expression (Fig. 7 J and Fig. S4 E). Meanwhile, boosting the ER-to-Golgi transportation of Cer by activating Cer transport protein (CERT) using CRT0066101, an antagonist against protein kinase D, the suppressor of CERT, significantly reduced the amount of Cer in AML12 and abolished CM-induced UPR (Fig. 7 K and Fig. S4, F–H).
Previous studies have shown that Cer excess disrupts SERCA activity (Liu et al., 2014). We hypothesized that CM-induced Cer accumulation on the ER may also cripple SERCA activity. This was confirmed by the result that microsome isolated from the CM-treated AML12 cell exhibited decreased SERCA activity compared with that from Ctrl-treated cells (Fig. 7 L). Furthermore, Tg-induced Ca2+ release from the ER was totally abolished with CM treatment, reflecting a depletion of the Ca2+ store in the ER lumen (Fig. 7 M). Lipid extracts from CM were also able to cripple SERCA activity (Fig. 7 N). The addition of Cer alone recapitulated such phenomena, although it reduced the ER Ca2+ store to a less extent than CM, probably due to the lack of lipoprotein (Fig. 7, O and P). Thus, by disrupting ER membrane fluidity and ER Ca2+ homeostasis, Cer induced the UPR in receiving cells.
SM restored membrane fluidity and inhibited Cer-induced UPR
If Cer induces the UPR by disrupting membrane fluidity, restoration of membrane fluidity would be able to suppress the UPR in receiving cells. This was indeed the case with MβCD (Fig. 7, A–D). In addition, we found that the addition of SM was also able to reduce the UPR signaling intensities (Fig. 8 A). Meanwhile, SM recovered the membrane fluidity, and restored SERCA activity and ER Ca2+ content (Fig. 8, B–E). Interestingly, SM reduced Cer content in CM-treated cells (Fig. 8, F and G). This is not due to suppression of Cer synthesis–related gene expression (Fig. 8 H). Although we still do not know the mechanism how SM reduces Cer content and increases membrane fluidity in receiving cells, our finding indicates that SM, with a head group different from Cer, could counterbalance the effect of Cer, regulating the membrane fluidity and the ER homeostasis in concert with Cer.
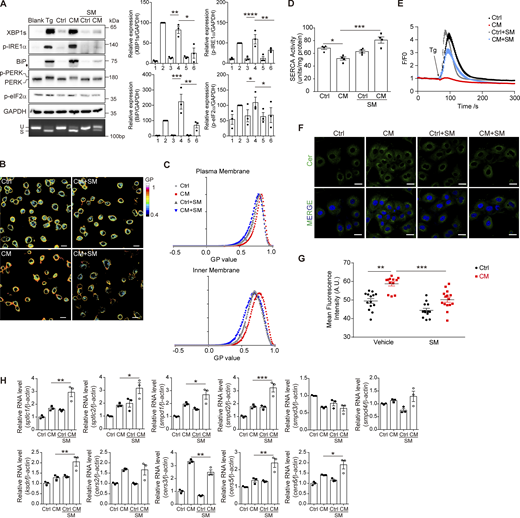
SM restored membrane fluidity and inhibited Cer-induced UPR. (A) Western blot of UPR markers and agarose gel of Xbp1 cDNA amplicons (left panel) and quantification of protein amount (right panel) in AML12 treated with Ctrl/CM ± SM (100 μg/ml). The diamond indicates the nonspecific band. For western blot, lanes were numbered from left to right, with the ratio in lane 2 (Tg treatment) set as 100. The statistical analyses were calculated by one-way ANOVA. Data were shown as the mean ± SEM, n = 3. *P < 0.05, **P < 0.01, ***P < 0.001, ****P < 0.0001. (B and C) Laurdan staining (B) and histogram of the GP values of the plasma membrane and inner membrane (C) in AML12 treated with Ctrl/CM ± SM (100 μg/ml) for 2 h. Scale bar, 20 μm. (D) SERCA activity determined in AML12 cell lysates. Cells were treated with Ctrl/CM ± SM (100 μg/ml) for 2 h. The statistical analyses were calculated by one-way ANOVA. Data were shown as the mean ± SEM, n = 4. *P < 0.05, ***P < 0.001. (E) Measurement of Ca2+ signals in the cytosol of 293T by Fluo-4 (4 μM) staining. Cells were treated with Ctrl/CM ± SM for 2 h. nCtrl = 61 cells; nCM = 54 cells; nCtrl+SM = 64; nCM+SM = 50 cells. (F) Representative confocal microscopic images of AML12 cells stained with anti-Cer antibody and Hoechst (blue). Cells were treated with Ctrl/CM ± SM (100 μg/ml) for 2 h. Scale bar, 20 μm. (G) Quantification of Cer fluorescence intensities in G measured by ImageJ, n ≥ 8 fields. The statistical analyses were calculated by one-way ANOVA. Data were shown as the mean ± SEM. **P < 0.01, ***P < 0.001. (H) RT-qPCR of Cer synthesis–related genes in AML12 treated with Ctrl/CM ± SM for 30 min. The statistical analyses were calculated by an unpaired t test, two-tailed. Data were shown as the mean ± SEM, n = 3. *P < 0.05, **P < 0.01, ***P < 0.001. Source data are available for this figure: SourceData F8.
SM restored membrane fluidity and inhibited Cer-induced UPR. (A) Western blot of UPR markers and agarose gel of Xbp1 cDNA amplicons (left panel) and quantification of protein amount (right panel) in AML12 treated with Ctrl/CM ± SM (100 μg/ml). The diamond indicates the nonspecific band. For western blot, lanes were numbered from left to right, with the ratio in lane 2 (Tg treatment) set as 100. The statistical analyses were calculated by one-way ANOVA. Data were shown as the mean ± SEM, n = 3. *P < 0.05, **P < 0.01, ***P < 0.001, ****P < 0.0001. (B and C) Laurdan staining (B) and histogram of the GP values of the plasma membrane and inner membrane (C) in AML12 treated with Ctrl/CM ± SM (100 μg/ml) for 2 h. Scale bar, 20 μm. (D) SERCA activity determined in AML12 cell lysates. Cells were treated with Ctrl/CM ± SM (100 μg/ml) for 2 h. The statistical analyses were calculated by one-way ANOVA. Data were shown as the mean ± SEM, n = 4. *P < 0.05, ***P < 0.001. (E) Measurement of Ca2+ signals in the cytosol of 293T by Fluo-4 (4 μM) staining. Cells were treated with Ctrl/CM ± SM for 2 h. nCtrl = 61 cells; nCM = 54 cells; nCtrl+SM = 64; nCM+SM = 50 cells. (F) Representative confocal microscopic images of AML12 cells stained with anti-Cer antibody and Hoechst (blue). Cells were treated with Ctrl/CM ± SM (100 μg/ml) for 2 h. Scale bar, 20 μm. (G) Quantification of Cer fluorescence intensities in G measured by ImageJ, n ≥ 8 fields. The statistical analyses were calculated by one-way ANOVA. Data were shown as the mean ± SEM. **P < 0.01, ***P < 0.001. (H) RT-qPCR of Cer synthesis–related genes in AML12 treated with Ctrl/CM ± SM for 30 min. The statistical analyses were calculated by an unpaired t test, two-tailed. Data were shown as the mean ± SEM, n = 3. *P < 0.05, **P < 0.01, ***P < 0.001. Source data are available for this figure: SourceData F8.
Prolonged CM treatment leads to the UPR attenuation and cooperates with SM to regulate multiple cellular functions
Under chronic ERS, Xbp1 splicing could be diminished (Lin et al., 2007). We wondered whether this also happens in CM-treated cells. Long-term treatment by CM led to an attenuation of the UPR, as was shown for the phosphorylation of IRE1α, PERK, and eIF2α, as well as the expression of downstream UPR markers XBP1s and ATF4 (Fig. 9 A). The attenuation of the UPR was unlikely due to the recovery of ER homeostasis, since the ER Ca2+ content remained abnormally low (Fig. 9 B).
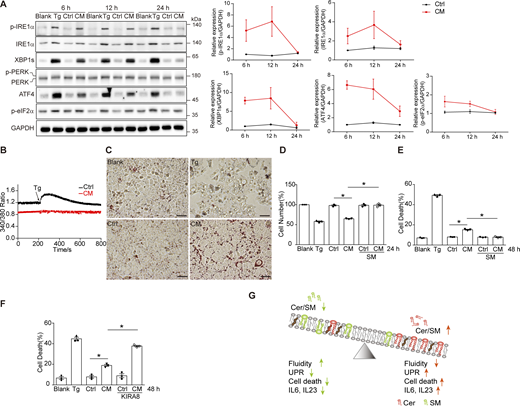
CM and SM cooperate to regulate multiple cellular functions. (A) Western blot of UPR markers (left panel) and quantification of protein levels (right panel) in AML12 treated with Ctrl/CM for the indicated time. The diamond indicates the nonspecific band. The ratio of protein band signals in lane 3 (Ctrl, 6 h) was set as 1. (B) Measurement of Ca2+ signals in the cytosol of AML12 by Fura-2 staining. Cells were pretreated with Ctrl or CM for 24 h. (C) Oil Red O staining of AML12 cells after 48-h treatment with Ctrl or CM. Scale bar, 50 μm. (D) Cell proliferation of AML12 treated with Ctrl/CM ± SM (100 μg/ml) for 24 h assessed by crystal violet staining, n = 3. *P < 0.05. (E) Cell death percentage of AML12 treated with Ctrl/CM ± SM (100 μg/ml) for 48 h, n = 3. *P < 0.05. (F) Cell death percentage of AML12 treated with Ctrl/CM ± KIRA8 (0.5 μM) for 48 h, n = 3. *P < 0.05. (G) Schematic illustration of how SM/Cer ratio regulates membrane fluidity and related cell functions. All statistical analyses were calculated by one-way ANOVA. Data were shown as the mean ± SEM. Source data are available for this figure: SourceData F9.
CM and SM cooperate to regulate multiple cellular functions. (A) Western blot of UPR markers (left panel) and quantification of protein levels (right panel) in AML12 treated with Ctrl/CM for the indicated time. The diamond indicates the nonspecific band. The ratio of protein band signals in lane 3 (Ctrl, 6 h) was set as 1. (B) Measurement of Ca2+ signals in the cytosol of AML12 by Fura-2 staining. Cells were pretreated with Ctrl or CM for 24 h. (C) Oil Red O staining of AML12 cells after 48-h treatment with Ctrl or CM. Scale bar, 50 μm. (D) Cell proliferation of AML12 treated with Ctrl/CM ± SM (100 μg/ml) for 24 h assessed by crystal violet staining, n = 3. *P < 0.05. (E) Cell death percentage of AML12 treated with Ctrl/CM ± SM (100 μg/ml) for 48 h, n = 3. *P < 0.05. (F) Cell death percentage of AML12 treated with Ctrl/CM ± KIRA8 (0.5 μM) for 48 h, n = 3. *P < 0.05. (G) Schematic illustration of how SM/Cer ratio regulates membrane fluidity and related cell functions. All statistical analyses were calculated by one-way ANOVA. Data were shown as the mean ± SEM. Source data are available for this figure: SourceData F9.
Cer has been reported to stimulate fatty acid uptake (Xia et al., 2015). In line with this, AML12 cells with CM treatment for 48 h exhibited mild lipid accumulation (Fig. 9 C). Meanwhile, prolonged CM treatment led to cell growth arrest and increased the level of cell death, indicating the lipotoxicity of CM (Fig. 9, D–F). Interestingly, inhibition of the IRE1α-XBP1 pathway by KIRA8 exacerbated cell death (Fig. 9 F). The effect of CM on lipid accumulation, cell growth arrest, and cell death induction was confirmed using AML12 as both donor and receiving cells, further demonstrating the universality of CM-regulated cell–cell communication under ERS (Fig. S5, A–C). We further investigated the relationship between SM and CM by examining the effect of SM on different outputs of CM treatment. Interestingly, with AML12 being the receiving cell, SM restored cell growth and prevented cell death caused by 3T3-L1–derived CM and AML12-derived CM treatment (Fig. 9, D and E; and Fig. S5, B and C).

CM and SM cooperate to regulate multiple cellular functions. (A) Oil Red O staining of AML12 cells after 48-h treatment with AML12-derived Ctrl or CM. Scale bar, 50 μm. (B) Cell proliferation of AML12 treated with AML12-derived Ctrl/CM ± SM (100 μg/ml) for 24 h assessed by crystal violet staining. The statistical analyses were calculated by one-way ANOVA. Data were shown as the mean ± SEM, n = 3. *P < 0.05. (C) Cell death percentage of AML12 treated with AML12-derived Ctrl/CM ± SM (100 μg/ml) for 48 h. The statistical analyses were calculated by one-way ANOVA. Data were shown as the mean ± SEM, n = 3. *P < 0.05. (D) Agarose gel of Xbp1 cDNA amplicons in J774A.1 treated with lipids extracted from B16.F10-derived Ctrl/CM for 6 h, in the presence or absence of SM (100 μg/ml). (E) RT-qPCR of IL-6 and IL-23 in J774A.1 treated with lipids extracted from B16.F10-derived Ctrl/CM for 6 h, in the presence or absence of SM (100 μg/ml). The statistical analyses were calculated by one-way ANOVA. Data were shown as the mean ± SEM, n = 3. ***P < 0.001, ****P < 0.0001. (F) RT-qPCR of IL-6 and IL-23 in J774A.1 treated with C16:0 or C18:0 at 100 μM for 6 h. The statistical analyses were performed using an unpaired t test, two-tailed. Data were shown as the mean ± SEM, n = 3. *P < 0.05, **P < 0.01, ***P <0.001.
CM and SM cooperate to regulate multiple cellular functions. (A) Oil Red O staining of AML12 cells after 48-h treatment with AML12-derived Ctrl or CM. Scale bar, 50 μm. (B) Cell proliferation of AML12 treated with AML12-derived Ctrl/CM ± SM (100 μg/ml) for 24 h assessed by crystal violet staining. The statistical analyses were calculated by one-way ANOVA. Data were shown as the mean ± SEM, n = 3. *P < 0.05. (C) Cell death percentage of AML12 treated with AML12-derived Ctrl/CM ± SM (100 μg/ml) for 48 h. The statistical analyses were calculated by one-way ANOVA. Data were shown as the mean ± SEM, n = 3. *P < 0.05. (D) Agarose gel of Xbp1 cDNA amplicons in J774A.1 treated with lipids extracted from B16.F10-derived Ctrl/CM for 6 h, in the presence or absence of SM (100 μg/ml). (E) RT-qPCR of IL-6 and IL-23 in J774A.1 treated with lipids extracted from B16.F10-derived Ctrl/CM for 6 h, in the presence or absence of SM (100 μg/ml). The statistical analyses were calculated by one-way ANOVA. Data were shown as the mean ± SEM, n = 3. ***P < 0.001, ****P < 0.0001. (F) RT-qPCR of IL-6 and IL-23 in J774A.1 treated with C16:0 or C18:0 at 100 μM for 6 h. The statistical analyses were performed using an unpaired t test, two-tailed. Data were shown as the mean ± SEM, n = 3. *P < 0.05, **P < 0.01, ***P <0.001.
Finally, by taking another system with B16.F10 and J774A.1 as the donor and receiving cell, respectively, we found that lipid extracted from B16.F10-derived CM induced not only the UPR but also the expression of cytokines, including IL-6 and IL-23 in macrophages (Fig. S5, D and E). This was also observed using Cer alone (Fig. S5 F). The addition of SM reduced both the UPR activation and cytokine expression (Fig. S5, D and E). Thus, SM was able to reduce the effect of CM in different aspects, including the UPR activation, cell death induction, and cytokine expression, probably acting as a counterbalance to Cer (Fig. 9 G).
Discussion
A rapid release of Cer via HDL from ER-stressed cells independent of the UPR
The propagation of UPR signaling from ER-stressed cells to naïve cells has recently been noticed in various experimental systems. Different mechanisms have been proposed (Di Conza et al., 2021; McNally et al., 2022; Ozbey et al., 2020; Sprenkle et al., 2019; Tirosh et al., 2020; Wei et al., 2019). With step-by-step fractionation and lipidomics analysis, our study proved that Cer accounted for the intercellular ERS transmission. Interestingly, ERS-induced Cer release is a rapid response at the post-transcriptional level. Our study suggests a rapid release of Cer mediated by secretory ASM. Disruption of Ca2+ homeostasis and/or membrane rupture have been reported to trigger lysosomal exocytosis to secrete lysosomal enzymes for membrane repair, including ASM (Reddy et al., 2001; Tam et al., 2010). ASM release led to Cer-rich domain formation at the plasma membrane to facilitate membrane repair and microbial infection (Andrews, 2019). It is possible that ERS disrupts Ca2+ homeostasis, triggering lysosomal exocytosis and the release of ASM, which converts SM to Cer at the cell surface, where Cer is packed into lipoproteins and secreted. Compared with transcriptional regulation, such strategy enables cells to immediately respond to stresses by releasing Cer as signal molecules in the first place. Since many stimulations could trigger ASM release, for example, virus infection, UV exposure, and membrane injury (Kornhuber et al., 2015), such ASM-mediated Cer release could be prevalent under physiological conditions. Were this true, the concept of “ERS transmission” need to be reconsidered, since ERS may not be necessary for Cer-mediated signal transduction between cells.
Proteinase K digestion dramatically reduced the effect of CM-extracted lipids on UPR induction, suggesting the importance of proteins in Cer delivery. Among VLDL, LDL, and HDL, we found that HDL is the most abundant in protein. This could be the reason why the functional parts in CM mainly reside in the HDL fractions. Interestingly, although 3T3-L1 itself produces lipoproteins, extracellular HDL is indispensable, indicating that the package of Cer into lipoprotein mainly occurs at the cell surface. Alternatively, HDL may be internalized and packed with Cer before it was secreted again. Previous studies show that Cer alone can activate the UPR (McNally et al., 2022). This was also observed in our study. However, such effect requires Cer at much higher concentration than that in the CM-extracted lipids. We speculate that lipoproteins increase the solubility of Cer, facilitating its delivery to receiving cells.
The mechanism of Cer release and delivery proposed in our study is different from that observed in palmitate-treated myotubes, where PERK activation and CerS2 upregulation in donor cells are needed for the release of Cer, which is transmitted by extracellular vesicles (EVs) (McNally et al., 2022). De novo synthesis of Cer requires a relatively long time and is an intracellular process. The location where Cer is produced probably determines the way for its delivery. We also noticed an increased level of Cers2 in 3T3-L1 upon Tg treatment (Fig. 3 G). It is possible that ERS induces Cer release in two phases: an early phase executed by ASM at the cell surface, and a slow phase as de novo–synthesized Cer comes up intracellularly. Whether ERS triggers a biphasic secretion of Cer, or the secretion mechanism is cell type– and stress type–specific remains elusive.
Multifunctional regulation in receiving cells via altering membrane biophysical property
With a single hydroxyl group as the polar head, Cer cannot form hydrated bilayers by themselves, but usually coexists with SM on the membrane (Slotte, 2016). In vitro biophysical study suggests that gel-like Cer-rich platform (CRP) is detergent-resistant and more densely packed than cholesterol–SM raft (Bieberich, 2018; Sot et al., 2006). An increasing amount of Cer results in displacement of cholesterol from cholesterol–SM raft and advances the formation of CRP (Megha and London, 2004). This can increase membrane rigidity. Notably, by altering the membrane biophysical properties in receiving cells, extracellular Cer induces the UPR. Such membrane property–regulated signaling modulation may also apply to the induction of cytokine expression as was seen in macrophages, where Toll-like receptors could be involved. Moreover, the effect of Cer could be neutralized by SM. Different from Cer, SM has a phosphocholine moiety in its head group, which acts as a spacer to prevent close hydrophobic interactions between fatty acyl chains and greatly reduce the melting temperature of the molecule compared with its Cer counterpart (García-Arribas et al., 2016; Jiménez-Rojo et al., 2014). Thus, a high SM/Cer ratio manifests high membrane fluidity. This was evidenced by SM-treated cells. SM/Cer balance is important for cell fate decision and cell function modulation (Taniguchi and Okazaki, 2020, 2021). In cells, such balance is regulated by SM synthases and sphingomyelinases. Our study suggests that ERS can remotely dictate SM/Cer balance, regulating cellular functions nonautonomously by modulating membrane biophysical properties.
The role of different species of Cer is another interesting question. McNally et al. reported very-long-chain Cer, e.g., Cer d18:1/22:0 (C22:0) and Cer d18:1/24:0 (C24:0) as the inducer of cell-nonautonomous UPR (McNally et al., 2022). Consistent with this, we found that CM treatment led to C24:0 accumulation in AML12. In addition, C16:0 and C18:0 were also able to activate the UPR. Notably, most of the Cer species that we detected in our experiment showed a trend of content increase in lipid extracts from 3T3-L1–derived CM compared with that from Ctrl, and in CM-treated AML12 compared with untreated cells. It is possible that a specific acyl chain length is not stringently required for Cer to induce the UPR. Nevertheless, Cer with longer chains may be more potent in disrupting membrane fluidity due to its higher hydrophobicity.
Cell-nonautonomous UPR activation as a protective yet transient response
Then what is the physiological significance of cell-nonautonomous UPR? We found that the activation of the IRE1α-XBP1 pathway is beneficial to hepatocyte viability (Fig. 9 F). This is similar to autonomous IRE1α-XBP1 function. XBP1s induction in receiving cells occurs within 6 h, far before the onset of cell death. CM treatment led to Cer accumulation within 30 min, quick enough to elicit the UPR in the first place. Therefore, cell-nonautonomous UPR may serve as a frontline preventive response to alleviate the adverse impact from Cer and ERS transmission. Interestingly, such protective response was diminished at late time points, similar as cell-autonomous UPR (Lin et al., 2007). It is possible that prolonged Cer excess may finally damage the UPR component, for example, IRE1α, a transmembrane protein that is sensitive to the change of membrane properties. Thus, duration and intensity of ERS is a double-edged sword at not only the single-cell level, but also the multicellular level.
Future directions
There are still many questions that need to be studied in the future. (1) How is Cer packed into HDL and secreted? (2) Does HDL only provide proteins as a carrier for Cer, or if there are other factors that synergize with Cer to broadcast ERS signal? (3) How does extracellular Cer increase the Cer content in receiving cells? Transcription upregulation of Cer synthesis–related genes could be one reason, but may not be the only one. (4) What is the mechanism of Cer-level decrease in receiving cells upon SM treatment? (5) Is there other physiological functions of ERS transmission via Cer?
Materials and methods
Cell culture
293T (ATCC CRL-3216, RRID: CVCL_0063), RAW264.7 (ATCC TIB-71, RRID: CVCL_0493), B16.F10 (ATCC CRL-6475, RRID: CVCL_0159), and J774A.1 (ATCC TIB-67, RRID: CVCL_0358) cell lines were obtained from the ATCC. NCTC1469 (RRID: CVCL_3066) was obtained from Cell Resource Center, Institute of Basic Medical Sciences, Chinese Academy of Medical Sciences. 3T3-L1 (RRID: CVCL_0123), AML12 (RRID: CVCL_0140), and MIN6 (RRID: CVCL_0431) were kind gifts from the laboratory of Dr. Yifu Qiu (Peking University, Beijing, China), Dr. Hongbo Hu (China Agricultural University, Beijing, China), and Dr. Tao Xu (Institute of Biophysics, CAS, Beijing, China), respectively. 293T, 3T3-L1, RAW264.7, NCTC1469, 3T3-L1 IRE1α knockout (KO), 3T3-L1 shXBP1, 3T3-L1 PERK KO cells, B16.F10, and J774A.1 cell lines were cultured in DMEM with 10% FBS. MIN6 cells were cultured in DMEM with 110 mg/liter sodium pyruvate supplemented with 15% FBS and 55 μM 2-mercaptoethanol. AML12 and AML12 Cav1 KO cell lines were cultured in DMEM/F12 medium supplemented with 10% FBS, 10 µg/ml insulin, 5.5 µg/ml transferrin, 5 ng/ml selenium, and 40 ng/ml dexamethasone. All cells were cultured in a humidified incubator at 37°C and 5% CO2. All cell lines were tested negative for Mycoplasma contamination.
The reagents used in cell culture experiments are as follows. Sphingomyelinase (S7651), Oil Red O (O0625), sodium oleate (O7501), palmitic acid (P9767), ceapin-A7 (SML2330), GSK2606414 (516535), 2-ACETYL-1,3-CYCLOPENTANEDIONE (R426911), and 2,2,2-tribromoethanol (T48402) were purchased from Sigma-Aldrich. GW4869 (S7609), nocodazole (S2775), U-73122 (S8011), LY294002 (S1105), desipramine hydrochloride (S5485), and CRT0066101 (S8366) were purchased from Selleck. BAPTA-AM (ab120503) was purchased from Abcam. Myriocin (HY-N6798), MβCD (HY-101461), amiloride hydrochloride (HY-B0285A), nystatin (HY-17409), and EIPA hydrochloride (HY-101840A) were purchased from MCE. Fumonisin B1 (73682) was purchased from STEMCELL. Cer d18:1/16:0 (860516P), Cer d18:1/22:0 (860501P), Cer d18:1/24:1 (860525P), Cer d18:1/18:0 (860518P), and SM (860062P) were purchased from Avanti Polar Lipids. Cleanascite lipid adsorption and clarification reagent (X2555-10) was purchased from Biotech Support Group. ASAH1 (TP312434) was purchased from OriGene. KIRA8 was synthesized by WuXi AppTec. Anti-mouse IgM MicroBeads (130-047-302) were purchased from Miltenyi Biotec, Inc.
Primary mouse hepatocyte isolation
All animal experiments were approved by the Institutional Committee at the Institute of Biophysics, Chinese Academy of Sciences. Wild-type C57BL/6 mice (RRID: IMSR_JAX:000664) (6–8 wk old, male) were purchased from GemPharmatech (RRID:SCR_017239). All mice were maintained on a 12/12-h light–dark cycle and fed ad libitum. Hepatocytes were isolated by two-step collagenase perfusion as described previously (Huo et al., 2017). After the mouse was anesthetized by 2,2,2-tribromoethanol (T48402; Sigma-Aldrich), the liver was perfused by Hank’s balanced salt solution (HBSS) through cannulation to the portal vein. After ∼50 ml HBSS had perfused through the liver, hepatocytes were in situ retrograde perfused by collagenase type IV–containing (C5138; Sigma-Aldrich) HBSS buffer. After perfusion, hepatocytes were dissociated from the digested liver by gently scraping with a glass rod; they were then suspended in DMEM/F12 medium and filtered through a 100-μm cell strainer. The cell suspension was then fractionated by Percoll density gradient centrifugation (1,125 g, 5 min, 4°C). Hepatocytes were suspended in DMEM/F12 medium containing 10% FBS, 1 nM insulin, 50 nM hydrocortisone, 0.15 mg/ml methionine, and 1% penicillin–streptomycin. After seeding to relevant plate wells, the hepatocytes were treated as designed.
CM collection
Two days after reaching full confluence, 3T3-L1 cells were induced for differentiation with DMEM + 10% FBS, containing 10 μg/ml insulin (I5500; Sigma-Aldrich) + 1 μM dexamethasone (D4902; Sigma-Aldrich) + 0.5 mM IBMX (T1713; TargetMol). The induction medium was kept on the cells for 48 h. Thereafter, the medium was changed every two days with DMEM + 10% FBS + insulin (10 μg/ml), until day 8. Donor cells were treated with 0.2 μM Tg (T9033; Sigma-Aldrich) or 5 μg/ml Tm (ab120296; Abcam) for 2 h for generating CM, while <1-min treatment with the same reagent was performed to make Ctrl. After treatment, cells were washed with PBS 4 times and then changed to fresh medium for 6 h, and the collected medium was filtered through 0.22-μm syringe filters. The >30-kDa medium was filtered by Millipore Amicon Ultra Centrifugal Filters with a 30-kDa cutoff (UFC9030; Merck). For heating treatment, Ctrl or CM was boiled at 100°C for 10 min. Proteinase K (PK) (100 μg/ml)-treated medium was treated as follows: 37°C, 30 min→ 65°C, 10 min →100°C, 10 min. Both heating and PK-treated samples were centrifuged at 3,000 rpm for 15 min, and supernatants were collected.
Lipid extraction and class separation
An equivalent volume of Ctrl and CM was concentrated to 100 μl, and then, global lipids were extracted by a modified Folch method as described previously (Pellegrino et al., 2014). Briefly, 100 μl of medium was incubated with 2 ml of the solvent mixture (2:1 chloroform/methanol, vol/vol), incubated for 1 h at room temperature. Then, 400 μl of NaCl 0.9% was added and the samples were revortexed. Phases were separated by centrifugation (5 min, 1,200 rpm), and the upper phase was discarded. 400 μl of a mixture composed of NaCl (0.9%): MeOH: CHCl3 (48:47:3, vol/vol/vol) was added to the lower organic phase. After centrifugation, the upper phase was collected and discarded. Another 400 μl of the NaCl: MeOH: CHCl3 mixture was added to the lower phase, followed by centrifugation. The extracts were evaporated under N2 and stored at −80°C until analysis. The amount of lipid for cell treatment was equivalent to that in the original medium. For example, we used 2 ml of CM, or lipid extracted from 2 ml of CM, to treat cells that were cultured in a 6-well plate.
A lipid class separation experiment was performed according to a previous report, where Bond Elut NH2 columns (Agilent) were used in the purification of lipid classes (Kaluzny et al., 1985). Briefly, global lipids extracted from the medium described above were dissolved in chloroform and eluted with different solvents. All neutral lipids were eluted with chloroform-2-propanol (2:1), fatty acid with 2% acetic acid in diethyl ether, and all phospholipids with methanol. Next, neutral lipid from above was dried under N2 and reconstituted in hexane, and then, part a was eluted with hexane, part b with 1% diethyl ether, 10% methylene chloride with hexane, part c with 5% ethyl acetate in hexane, part d with 15% ethyl acetate in hexane, and part e with chloroform/methanol (2:1) (Ruiz-Gutierrez and Perez-Camino, 2000). Part e and all the other lipid classes were subjected to lipidomics mass spectrometry analysis.
Elimination of Cer in medium with anti-Cer antibody
The Ctrl/CM were incubated with or without anti-Cer (1:100) (ALX-8040196, RRID: AB_2051116) at 4°C overnight. Anti-IgM magnetic beads (130-047-302, Miltenyi Biotec) were added and incubated while shaking for another 3 h. After removing the magnetic beads, the supernatant was collected for further use.
Removal of Cer with ASAH1
Ctrl/CM-extracted lipids were dissolved in 10 μl ethanol, and then, 90 μl of 25 mM sodium acetate buffer (pH 4.5) was added. The lipids were then incubated with 1 μg ASAH1 at 37°C for 2 h without agitation (Bedia et al., 2010). Vehicle samples consisted in the same incubation mixture in the absence of ASAH1. The reaction was terminated by adding 200 μl HPLC-grade (2:1, vol/vol) chloroform/methanol (Bernardo et al., 1995). The extracts were evaporated under N2 and stored at −80°C until further use.
Preparation of Cer
Cer d18:1/16:0, Cer d18:1/18:0, Cer d18:1/22:0, and Cer d18:1/24:1 were prepared following standard protocols in the literature (McNally et al., 2022). In brief, they were dissolved in chloroform/methanol 1:1 and then dried down under N2 gas. Ethanol and dodecane were mixed at a ratio of 98:2, followed by vortexing and prewarming to 37°C, and were added to the dried Cer such that the final stock concentration was 5 mM. This mixture was thoroughly vortexed and incubated at 37°C for a further 20 min followed by further vortexing. The stock solution of Cer was diluted in cell culture medium (37°C) to the required treatment concentration followed by vortex mixing. Ethanol/dodecane was included as a vehicle control at the same concentration as the treatment.
Lipidomics mass spectrometry analysis
Lipids were extracted from Ctrl/CM-extracted lipids (part e and all the other lipid classes), 3T3-L1 cells, and AML12 cells with or without CM treatment, using modified Bligh and Dyer’s extraction procedure (Lam et al., 2016), and dried in the SpeedVac under N2 mode. Samples were stored at −80°C until further analysis. All lipidomics analyses were conducted at LipidALL Technologies using Agilent 1290 II UPLC coupled with Sciex QTRAP 6500 PLUS as reported previously (Lam et al., 2021). For normal phase analysis of polar lipids, individual species were separated using a Phenomenex Luna 3 µm silica column (internal diameter 150 × 2.0 mm) under the following conditions: mobile phase A (chloroform: methanol: ammonium hydroxide, 89.5:10:0.5) and mobile phase B (chloroform: methanol: ammonium hydroxide: water, 55:39:0.5:5.5). Quantification of individual lipid species was carried out by referencing to spiked internal standards, namely, d9-PC32:0(16:0/16:0), d9-PC36:1p(18:0p/18:1), Cer d18:1/15:0-d7, d9-SM d18:1/18:1, C8-GluCer, C8-GalCer, d3-LacCer d18:1/16:0, Gb3 d18:1/17:0, d7-LPC18:1, d17:1 Sph, d17:1 S1P, which were obtained from Avanti Polar Lipids (Alabaster). Acylcarnitines were quantitated using d3-16:0-acylcarnitine (Cayman Chemicals).
RT-PCR and RT-qPCR
Total RNA from cell lines was isolated with TRNzol Universal Reagent (DP424; TIANGEN), and cDNA was synthesized with the FastKing RT kit (with gDNase) (KR116; TIANGEN). Xbp1 primers were used to amplify an Xbp1 amplicon by PCR. PCR program was set up as follows: initial denaturation, 95°C, 5 min; denaturation, 95°C, 30 s, annealing, 55°C, 30 s, extension, 72°C, 30 s, 35 cycles; and 72°C, 10 min. Then, PCR products were resolved on 2.5% agarose gel. The unspliced form (mouse 171 bp; human 283 bp) and spliced form (mouse 145 bp; human 257 bp) can be distinguished by size difference and have been labeled “U” and “S,” respectively, in all the figures. RT-qPCR was performed according to SuperReal PreMix Plus (SYBR Green) (FP205; TIANGEN) instructions. Three-step PCR was set up as follows: initial denaturation, 95°C, 15 min; denaturation, 95°C, 10 s, annealing, 55°C, 20 s, extension, 72°C, 40 cycles; and melting/dissociation curve stage. The targeting mRNA level was normalized to the β-actin mRNA level (for the primer sequence, see Table S1).
RNA-sequencing analysis
Total RNA of 3T3-L1 and AML12 cells was isolated as described above. RNA quality was monitored using Agilent 2100, and RNA integrity was monitored by agarose gel electrophoresis. In all cases, RNA integrity member was >9.50, 28S/18S >1.0. mRNA libraries were generated and sequenced at Biomarker Technologies. RNA-sequencing data were analyzed using the HISAT2-StringTie pipeline (Pertea et al., 2015). Differential expression gene (DEG) analysis was done using the DESeq2 (RRID: SCR_000154) package (Love et al., 2014). DEGs (fold change >2, P <0.05) were considered to be notably DEGs. Normalized FPKM (Fragments Per Kilobase of exon model per Million mapped fragments) values were generated by the DESeq2 (RRID: SCR_000154) package and used to calculate fold change of gene expression in a sample divided by average expression in all samples. Heatmap of DEGs was generated using the pheatmap (RRID:SCR_016418) package. Pathway enrichment analysis of KEGG (RRID:SCR_012773) was conducted using the ggplot2 package (RRID: SCR_014601) to identify DEGs.
ASM activity measurement
CM and Ctrl were obtained from differentiated 3T3-L1 as usual with two modifications: (1) cells were pretreated with 100 nM Baf A1 (HY-100558; MCE), 50 μM desipramine hydrochloride (S5485), or 20 μM BAPTA-AM (ab120503) for 1 h before adding Tg; and (2) after Tg treatment at 0.1 μM for 2 h, cells were recovered in fresh medium for 1 h instead of 6 h. ASM activities in CM and Ctrl were measured using Acidic Sphingomyelinase Assay Kit (ab190554; Abcam) and normalized by the total protein concentration in the medium. The samples for medium ASM western blot were also collected as above.
Isolation and characterization of small extracellular vesicles (sEVs) and lipoprotein
sEVs were isolated from Ctrl and CM by ultracentrifugation (Thery et al., 2006) or SEC. Briefly, for ultracentrifugation, medium was subject to sequential centrifugation at 2,000 g, 10 min, and 10,000 g, 30 min, to remove dead cells and debris. The medium was then subjected to centrifugation at 100,000 g for 90 min to separate sEV. The pellet was washed once with PBS at 100,000 g for 70 min. The sEV pellet after the final centrifugation was resuspended in a small volume of PBS for further use. For SEC sEV isolation, medium was concentrated using Millipore Amicon Ultra Centrifugal Filters with a 100-kDa cutoff (UFC910008; Merck), then loaded onto a qEV column (ICO-35; Izon Science). A maximum of 500 μl of medium loaded onto the column, followed by elution with 10 ml freshly filtered PBS and 0.5 ml fractions, were collected. As per the manufacturer’s instructions, EV-rich fractions 7–9 were pooled as sEV, and fractions 10–20 were remaining eluent parts. The sEV-containing fractions were pooled after elution and concentrated for further analysis.
To character sEVs by transmission electronic microscope, 3 μl purified sEVs were deposited on Carbon Supported Copper Grids (BZ110223b; Zhongjingkeyi), which had been hydrophilically treated with a glow discharger. After incubation for 60 s, residual sample solution is blotted off with a piece of filter paper from the grid edge. The grid is washed quickly with 3 μl 2% uranyl acetate solution two times. Subsequently, the grid is stained with 3 μl 2% uranyl acetate solution for 60 s, and then, the stain solution is removed with a piece of filter paper from the grid edge. After being naturally dried, the grid is observed using a transmission electron microscope (Tecnai Spirit, 120 kV; Thermo Fisher Scientific) equipped with an EMSIS Veleta camera (2K × 2K) and RADIUS software.
Fast-protein liquid chromatography
For lipoprotein profiling, Ctrl and CM-eluted fractions (10–20) from the qEV column were combined and concentrated by Millipore Amicon Ultra Centrifugal Filters with a 100-kDa cutoff (UFC910008; Merck), and separated by fast-protein liquid chromatography on a Superose S-6 10/300 GL column (GE Healthcare) at a flow rate of 0.5 ml/min. Forty sequential fractions (500 μl each) were collected. Cholesterol concentrations were measured in each fraction by Amplex Red Cholesterol Assay Kit (A12216; Invitrogen).
Preparation of VLDL/LDL, HDL, and lipoprotein deficiency FBS
Add KBr to FBS to produce a density of 1.063 g/ml using the formula: FBS (ml) × 0.0834 = KBr (g). Hold the tube on ice, then mix slowly using a wide-bore pipette to avoid causing excessive shear stress in the solution. Transfer the plasma to ultracentrifuge tubes using syringes. The FBS was ultracentrifuged (4°C) at 100,000 g for 24 h. Gently aspirate approximately the top 1/5 of the tube that contain the VLDL/LDL. Collect the infranatant in the bottom 4/5 portion of the tube that contain the HDL. Weigh out the required amount of KBr to produce a density of 1.21 g/ml in the plasma using the formula: d = 1.063 plasma (ml) × 0.235 = KBr (g). And then centrifuge at 100,000 g for another 24 h. Aspirate the HDL fraction, the top 1/5 of the centrifuge tube, using a syringe. The middle of the tube is lipoprotein deficiency part (Li et al., 2018). Dialyze against PBS at 4°C for 72 h, and change the buffer using fresh PBS per 24 h. The medium was filtered with a 0.22-µm syringe filter, and cholesterol concentration was measured at each part by Amplex Red Assay Kit (A12216; Invitrogen).
KO and knockdown cell line establishment
For generation of CRISPR/Cas9 KO cell lines, sgRNA was constructed into the vector PX458. Cells were transiently transfected with the appropriate plasmid followed by FACS-based monoclonal selection on the basis of GFP fluorescence. Single KO clones were verified by immunoblotting and sequencing of the PCR fragments. sgRNA sequences were as follows: IRE1α: 5′-AGAGGACGGGCTCCATCAAG-3′, PERK: 5′-GGGAGCAAGCAAACTGCGGG-3′, Cav1: 5′-GGACGTAGATGGAGTAGACG-3′.
For shRNA-mediated knockdown, 293T cells were cotransfected with these plasmids: psPAX2 (RRID: Addgene_12260), pMD2.G (RRID: Addgene_12259), and pLKO.1_shXBP1 containing a shRNA sequence targeting Xbp1 mRNA sequence: shXBP1-F, 5′-CCGGAACTAAAGTGAGCATACCACTCTCGAGAGTGGTATGCTCACTTTAGTTTTTTTG-3′, shXBP1-R, 5′-AATTCAAAAAAACTAAAGTGAGCATACCACTCTCGAGAGTGGTATGCTCACTTTAGTT-3′. 2 days following cotransfection, lentiviral supernatants were centrifuged at 1,000 rpm for 3 min and then filtered through a 0.45-μm syringe-driving filter. 3T3-L1 cells were infected with shXBP1 lentivirus for 48 h. Stable XBP1 knockdown 3T3-L1 cell lines were selected with 10 μg/ml puromycin in cell culture medium.
For siRNA-mediated knockdown, the siRNAs listed below were transfected into 293T cells at a final concentration of 100 nM using jetPRIME transfection reagent (101000046; Polyplus) according to the manufacturer’s instructions. The cells were used for various assays 48 h after siRNA transfection. The siRNA sequences are as follows: AP-2 α siRNA: 5′-GAGCAUGUGCACGCUGGCCA-3′, CHC siRNA: 5′-GCAATGAGCTGTTTGAAGA-3′, dynamin2 siRNA: 5′-GACAUGAUCCUGCAGUUCA-3′.
Laurdan staining and data analysis
Cells were treated as indicated for 2 h and then stained with 5 μM Laurdan (850582P; Avanti Polar Lipids), 37°C, 30 min. The cells were washed with PBS, then fixed with 4% paraformaldehyde (PFA), 37°C, 15 min, and kept at 37°C until detection. Imaging was performed on A1R MP+ multiphoton confocal microscopes (Nikon) with excitation at 800 nm using a femtosecond-pulsed laser, and the fluorescence was detected in the ranges 400–460 and 470–530 nm. Images were visualized using a 25×/1.1(WD2.0 mm) objective at room temperature and acquired by NIS-Elements AR5.4 software. Pseudocolored generalized polarization (GP) images were generated as previously described (Owen et al., 2011) using software Imaris 9.8 (RRID: SCR_007370) (Bitplane) and ImageJ (RRID: SCR_003070). To quantify changes, GP values were calculated according to . Here, I represents the intensity in each pixel in the image acquired in the indicated spectral channel, and G is the calibration factor according to the following equation: , where GPmes is the GP value of the dye in pure dimethyl sulfoxide measured with the same microscope setup and settings as those used for the real sample, and GPref value is 0.207.
Immunoblot and immunofluorescence
Cells were lysed in RIPA containing 50 mM Tris (pH 7.4), 150 mM NaCl, 1% Triton X-100, 1% sodium deoxycholate, 0.1% SDS, supplemented with protease inhibitors (539137; Merck Millipore) and phosphatase inhibitor cocktail (524625; Merck Millipore). The cell nuclear protein was extracted by Nuclear and Cytoplasmic Protein Extraction Kit (P0028; Beyotime). The lysates were ultrasonicated and then centrifuged at 4°C, 12,000 rpm, 15 min. The supernatant was collected, and protein concentrations were determined by the BCA protein assay kit (P0010; Beyotime), followed by the addition of SDS-loading dye (0.25% bromophenol blue, 0.5 M DTT, 50% glycerol, 10% SDS, 0.25 M Tris-HCl [pH 6.8]) and heating at 100°C for 10 min. After being separated in SDS–polyacrylamide gel (SDS-PAGE) gels, proteins were transferred to PVDF membranes (IPVH00010; Millipore) and blocked in PBST containing 5% nonfat milk. Membranes were incubated overnight with indicated primary antibodies, followed by horseradish peroxidase–conjugated secondary antibody incubation, and then were developed by ChemiScope Chemiluminescence Imaging System (Clinx). ImageJ software was used to measure the intensities of the protein bands. Primary antibodies IRE1α (3294S, RRID: AB_823545), PERK (3192S, RRID: AB_2095847), BiP (3177S, RRID: AB_2119845), ATF4 (11815S, RRID: AB_2616025), p-eIF2α (Ser51) (3398S, RRID: AB_2096481), XBP1s (12782S, RRID: AB_2687943), and Cav1 (3238S, RRID: AB_2072166) were purchased from Cell Signaling Technology. p-IRE1α (S724) (ab124945, RRID: AB_11001365), calnexin (ab22595, RRID: AB_2069006), and Golgin-97 (ab84340, RRID: AB_1860512) were purchased from Abcam. β-Actin (66009-1-lg, RRID: AB_2782959), GAPDH (60004-1-lg, RRID: AB_2107436), and ASM (14609-1-AP, RRID: AB_2878068) were purchased from Proteintech. ATF6 (NBP1-75478, RRID: AB_11008989) was purchased from Novus. Histone H3 (P01L24) was purchased from Gene-Protein Link. Cer (ALX-8040196, RRID: AB_2051116) was purchased from Enzo Life Sciences. AP-2α (BD610501, RRID: AB_397867), CHC (ab21679, RRID: AB_2083165), and dynamin (sc-166669, RRID: AB_2093684) antibodies were gifted by Dr. Kangmin He laboratory (Institute of Genetic and Developmental Biology, CAS, , Beijing, China).
AML12 cells were plated in glass-bottom cell culture dish. After the indicated treatment, cells were fixed with 4% PFA, permeabilized by 1% NP-40, blocked by 1% BSA, and incubated with primary antibody at 4°C overnight. Then, cells were incubated with fluorescence-labeled secondary antibody and stained by Hoechst (C1025; Beyotime). Images were visualized on an Olympus FV1200 laser scanning confocal microscope using 60× (oil/NA1.35) objective at room temperature and acquired by FV10-ASW4.1 software. ImageJ software was used to analyze average fluorescence intensity.
Calcium flux measurement
The cytosolic Ca2+ concentration was determined using Fura-2 AM (F1201; Invitrogen) or Fluo-4 AM (F14201; Invitrogen). Briefly, AML12 cells were stained with 5 μΜ Fura-2 AM in calcium-free Tyrode’s solution for 30 min at 37°C, and 293T cells were stained with 4 μΜ Fluo-4 AM in HBSS for 30 min, washed, and incubated in calcium-free Tyrode’s solution (for AML12) or HBSS (for 293T) for 30 min. 4 mM EGTA was added before cell imaging. For AML12 cells, fluorescence images were obtained every 10 s by Nikon Eclipse Ti for 200 s, and then, 10 μΜ Tg was added for ER calcium measurement. Emission light >510 nm was captured, and 340/380 ratio was exported for ImageJ (RRID: SCR_003070) analysis. For 293T cells, images were obtained every 2 s by Zeiss LSM 980 for 60 s, and then, 5 μΜ Tg was added for ER calcium measurement. Emission fluorescence signaling was captured and exported for ImageJ (RRID: SCR_003070) analysis.
SERCA activity measurement
Cells were collected and homogenized using Dounce Tissue Grinder in buffer (20 mM HEPES, 250 mM sucrose, 1 mM EDTA, pH 7.4) containing protease inhibitor cocktail (539137; Merck Millipore). The microsomes were isolated as described previously (Zhao et al., 2017) with minor modifications. Before the final 100,000 g ultracentrifugation, the supernatant was centrifuged at 20,000 g for 30 min at 4°C to remove lysosome in the pellet (Wieckowski et al., 2009). The samples were diluted 1:100∼1:500 for SERCA activity measurement (ATPase Assay Kit, ab270551; Abcam). Ca2+ ATPase activity was normalized by protein content.
Data analysis
Statistical analyses were performed using GraphPad Prism 8.0 software (RRID: SCR_002798). The statistical analyses are described in detail in figure legends. All data were shown as the mean ± SEM. Throughout all figures: *P < 0.05, **P < 0.01, ***P < 0.001, and ****P < 0.0001. Significance was concluded at P < 0.05.
Online supplemental material
This manuscript contains five supplemental figures, Figs. S1–S5, and Table S1, which provide further details about Cer regulation of cell-to-cell ER transmission. Fig. S1 shows cell-nonautonomous UPR activation occurred in different types of donor-receiving cells. Fig. S2 demonstrates that lipid-mediated cell-nonautonomous UPR activation in different types of donor-receiving cells. Fig. S3 illustrates Cer is delivered in the form of lipoprotein but not sEV. Fig. S4 shows CM augments Cer synthesis–related gene transcription in receiving cells, and CRT reduces the content of Cer in cells. Fig. S5 demonstrates CM and SM cooperate to regulate multiple cellular functions. Table S1 shows the primer list in this study.
Data availability
The data underlying Fig. 1 E; and Fig. 3, E and G are openly available in China National Center for Bioinformation at https://www.cncb.ac.cn/, accession number: CRA006892. The original data for Fig. 1 E can be found in AML12_Ctrl1/2/3 and AML12_CM1/2/3. The original data for Fig. 3, E and G can be found in Di_3T3L1_0.02 Tg_2h1/2/3, Di_3T3L1_0.2 Tg_1min1/2/3, Di_3T3L1_0.2 Tg_2h1/2/3, Di_3T3L1_IN_0.2 Tg_1min1/2/3, and Di_3T3L1_IN_0.2 Tg_2h1/2/3. The data underlying Fig. 2, G and H; and Fig. S4 C are openly available in China National Center for Bioinformation at https://www.cncb.ac.cn/, accession number: OMIX001130. The original data for Fig. 2, G and H can be found in Ctrl CM lipidomics. The original data for Fig. S4 C can be found in 3T3-L1 AML12 cell line lipidomics. The other data underlying all figures are available in the published article and its online supplemental material.
Acknowledgments
We thank Dr. Tao Xu (Institute of Biophysics, CAS) for providing MIN6 cell line; Dr. Junjie Hu (Institute of Biophysics, CAS) for help with Ca2+ imaging; Dr. Yifu Qiu (Peking University) for providing 3T3-L1 cell line and help with pre-adipocyte differentiation; Dr. Hongbo Hu (China Agriculture University) for sharing AML12 cell line; and Dr. Kangmin He (Institute of Genetics and Developmental Biology, CAS) for sharing human clathrin–related siRNAs and antibodies. We also thank Yan Teng and Yun Feng (Center for Biological Imaging (CBI), Institute of Biophysics, CAS) for their help in taking and analyzing confocal images, and Junying Jia and Shu Meng (Core Facility, Institute of Biophysics, CAS) for their technical support in flow cytometry.
This work was supported by the National Natural Science Foundation of China 92354303 (to L. Wang), National Key R&D Program of China 2021YFA1300800 (to L. Wang), Strategic Priority Research Program of CAS XDB37020305 (to L. Wang), CAS Youth Interdisciplinary Team Funding JCTD-2021-07 (to L. Wang), National Key R&D Program of China 2017YFA0506400 (to L. Wang), National Natural Science Foundation of China 31770877 (to L. Wang), National Natural Science Foundation of China 31900564 (to Y. Huo), National Natural Science Foundation of China 32170785 (to L. Wang), and Novo Nordisk-Chinese Academy of Sciences Research Fund NNCAS-2017-6-JRP (to L. Wang).
Author contributions: Y. Huo: conceptualization, data curation, formal analysis, funding acquisition, investigation, project administration, validation, visualization, and writing—original draft. X. Liu, C. Lu, T. Li, Z. Yang, F. Xu, and S. Chen: data curation. K. Yin: resources. L. Wang: conceptualization, data curation, formal analysis, funding acquisition, investigation, methodology, project administration, resources, supervision, validation, visualization, and writing—original draft, review, and editing.

